Structure of a low-population intermediate state in the release of an enzyme product
- Imperial College London, United Kingdom
- University of Cambridge, United Kingdom
Figures
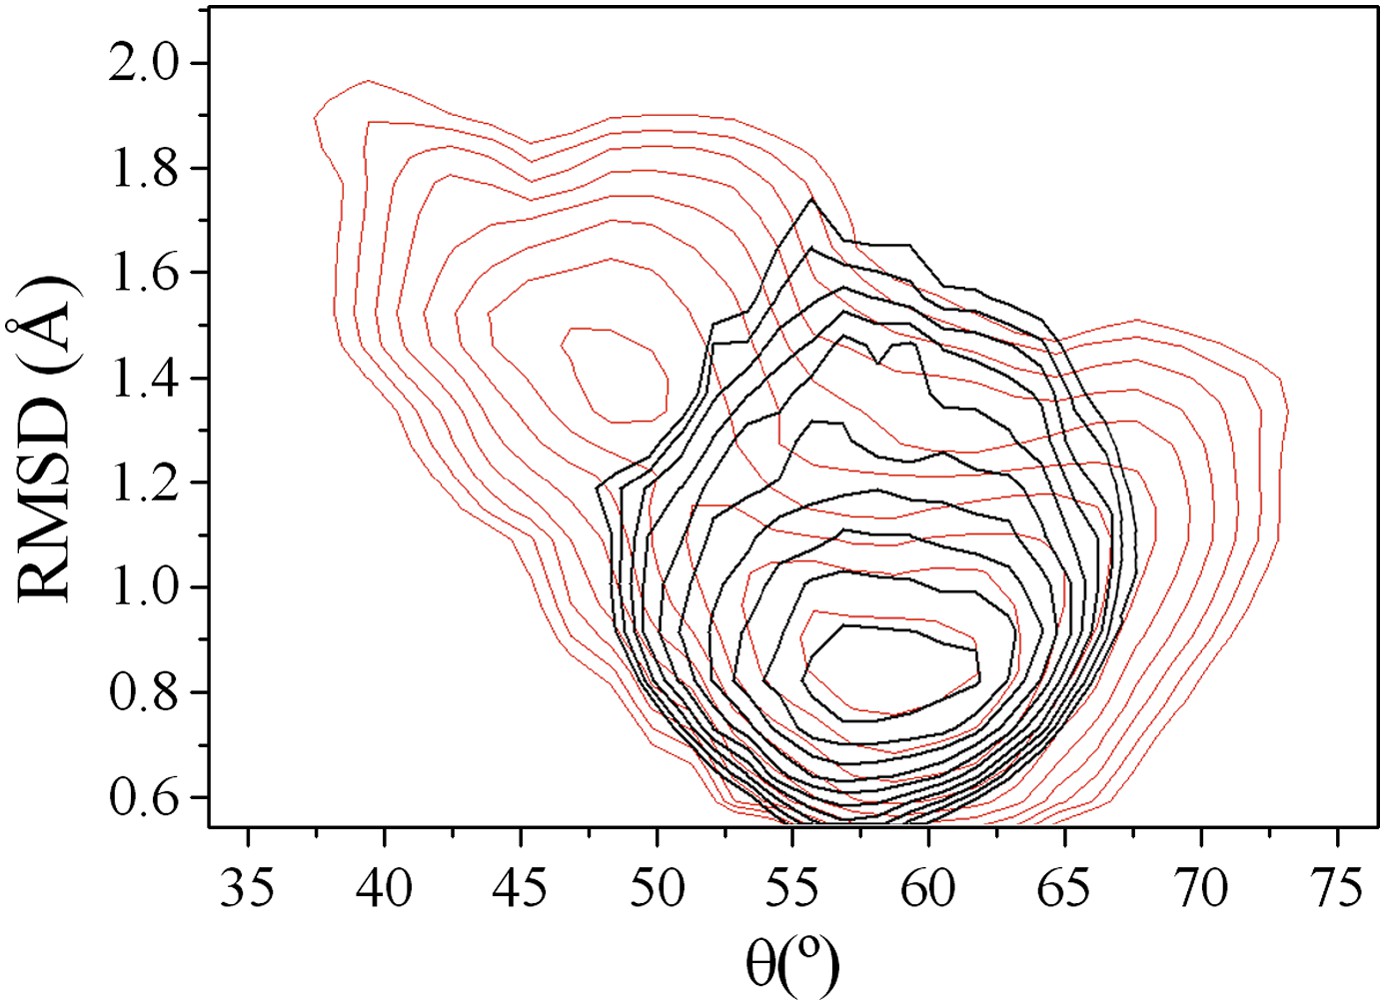
Figure 1 with 5 supplements
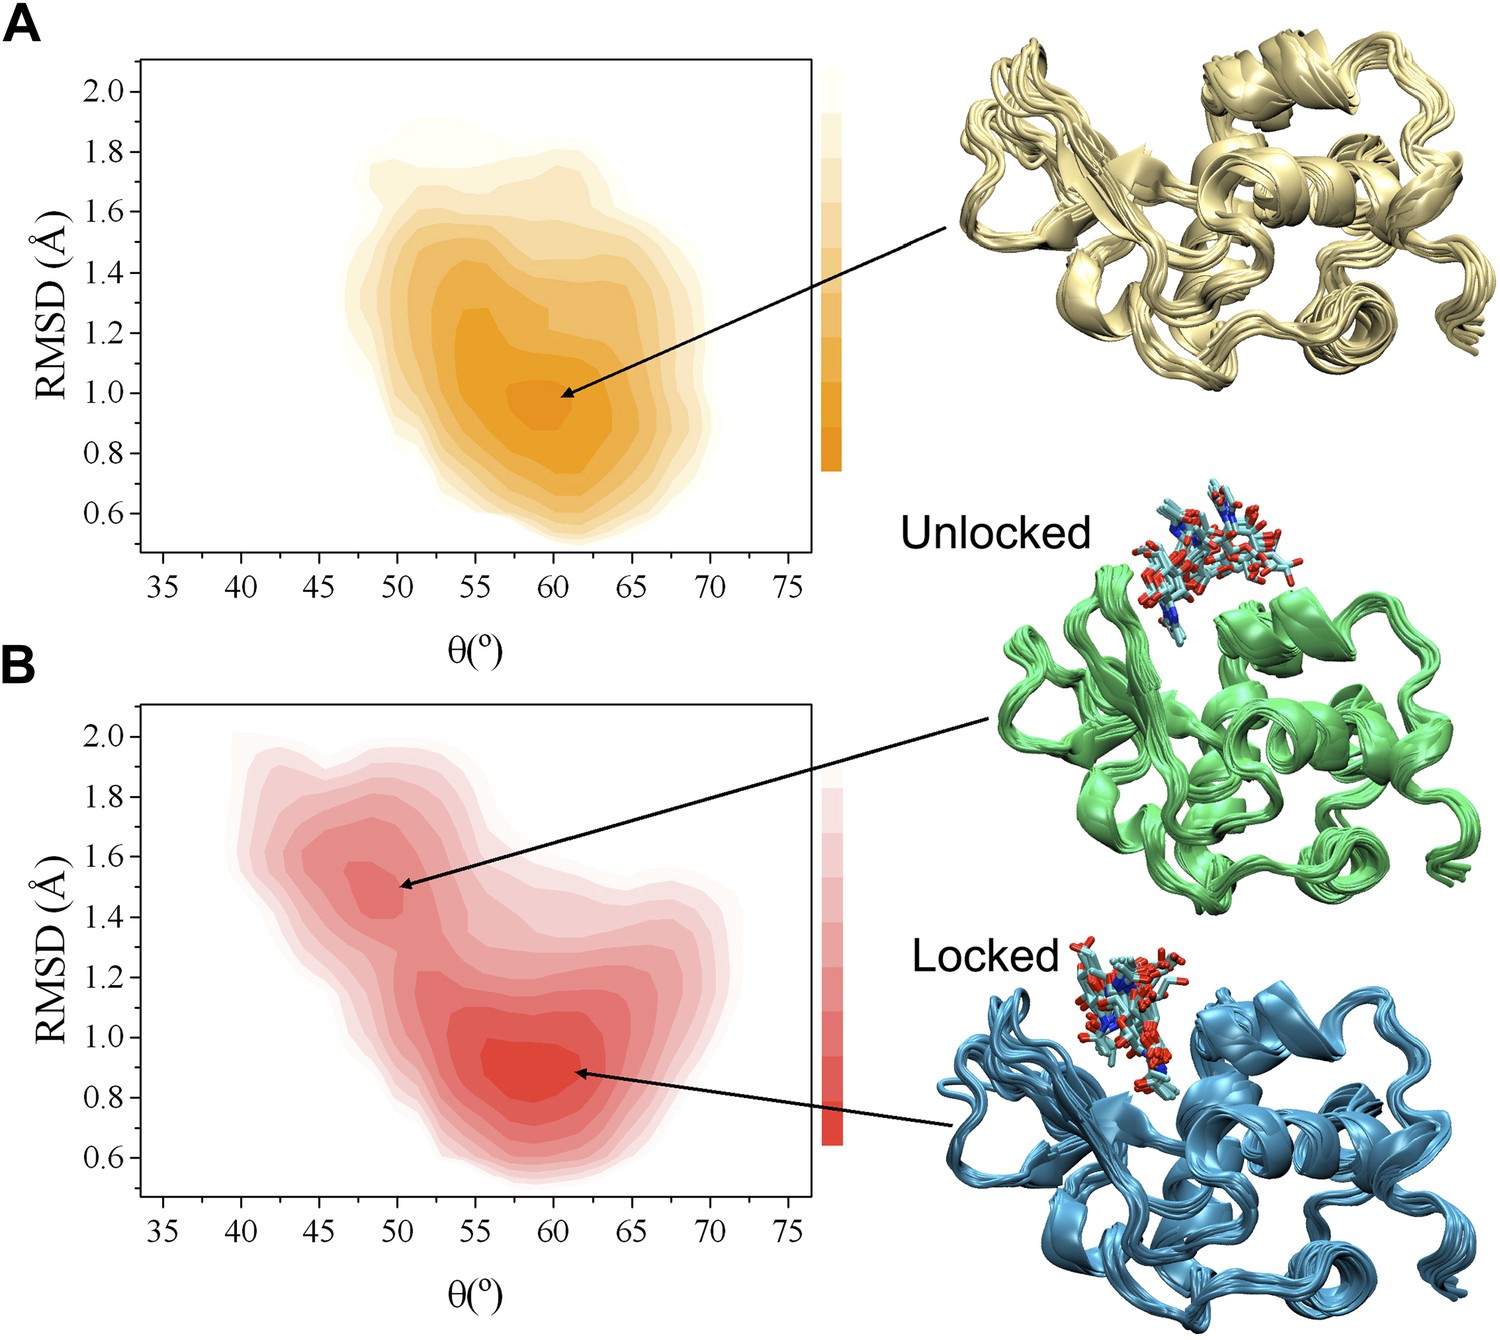
Comparison of the free-energy landscapes of human lysozyme in the free state (A) and in the bound state with triNAG (B).
The bound state exhibits a ground state (the ‘locked state’) and an additional local minimum with about 13% population (the ‘unlocked state’), which represents an intermediate in the release of the product of the enzymatic reaction. Free-energy landscapes are shown as function of the ‘breathing’ angle θ and of the RMSD from the X-ray structure, which was calculated on the Cα atoms by including secondary structure regions only, of a human lysozyme variant in complex with triNAG (PDB code 1BB5); free-energy landscapes were obtained as −kBTlnH(θ, RMSD), where H(θ, RMSD) is the number of times conformations with specific θ and RMSD values was sampled during the simulations (De Simone et al., 2013b).
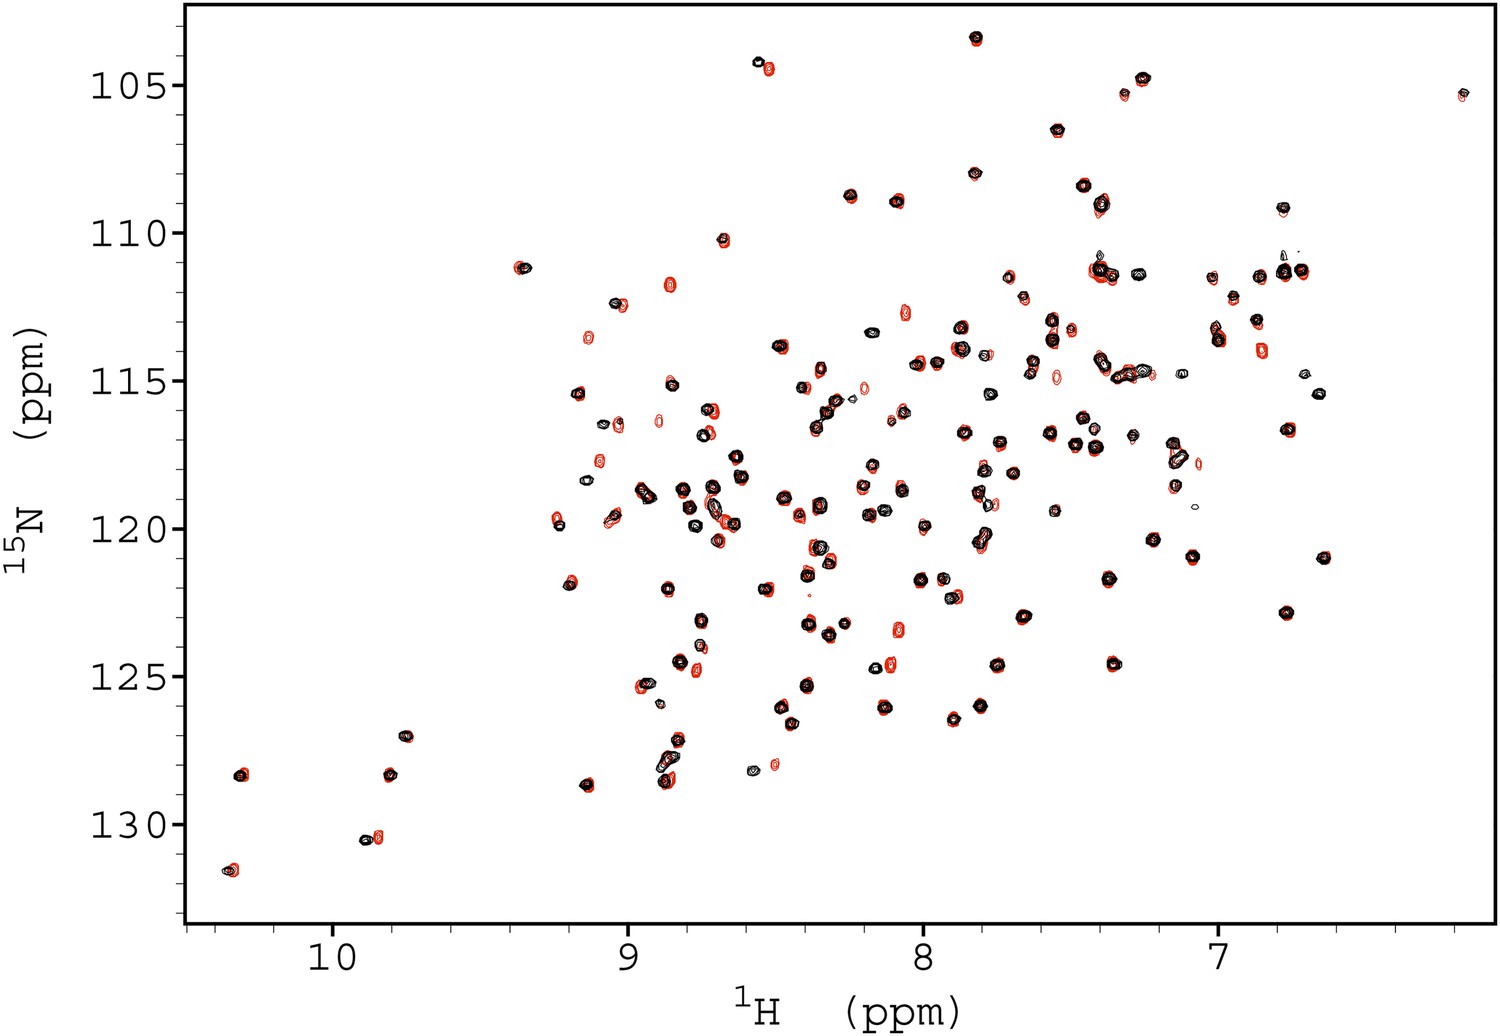
Figure 1—figure supplement 1
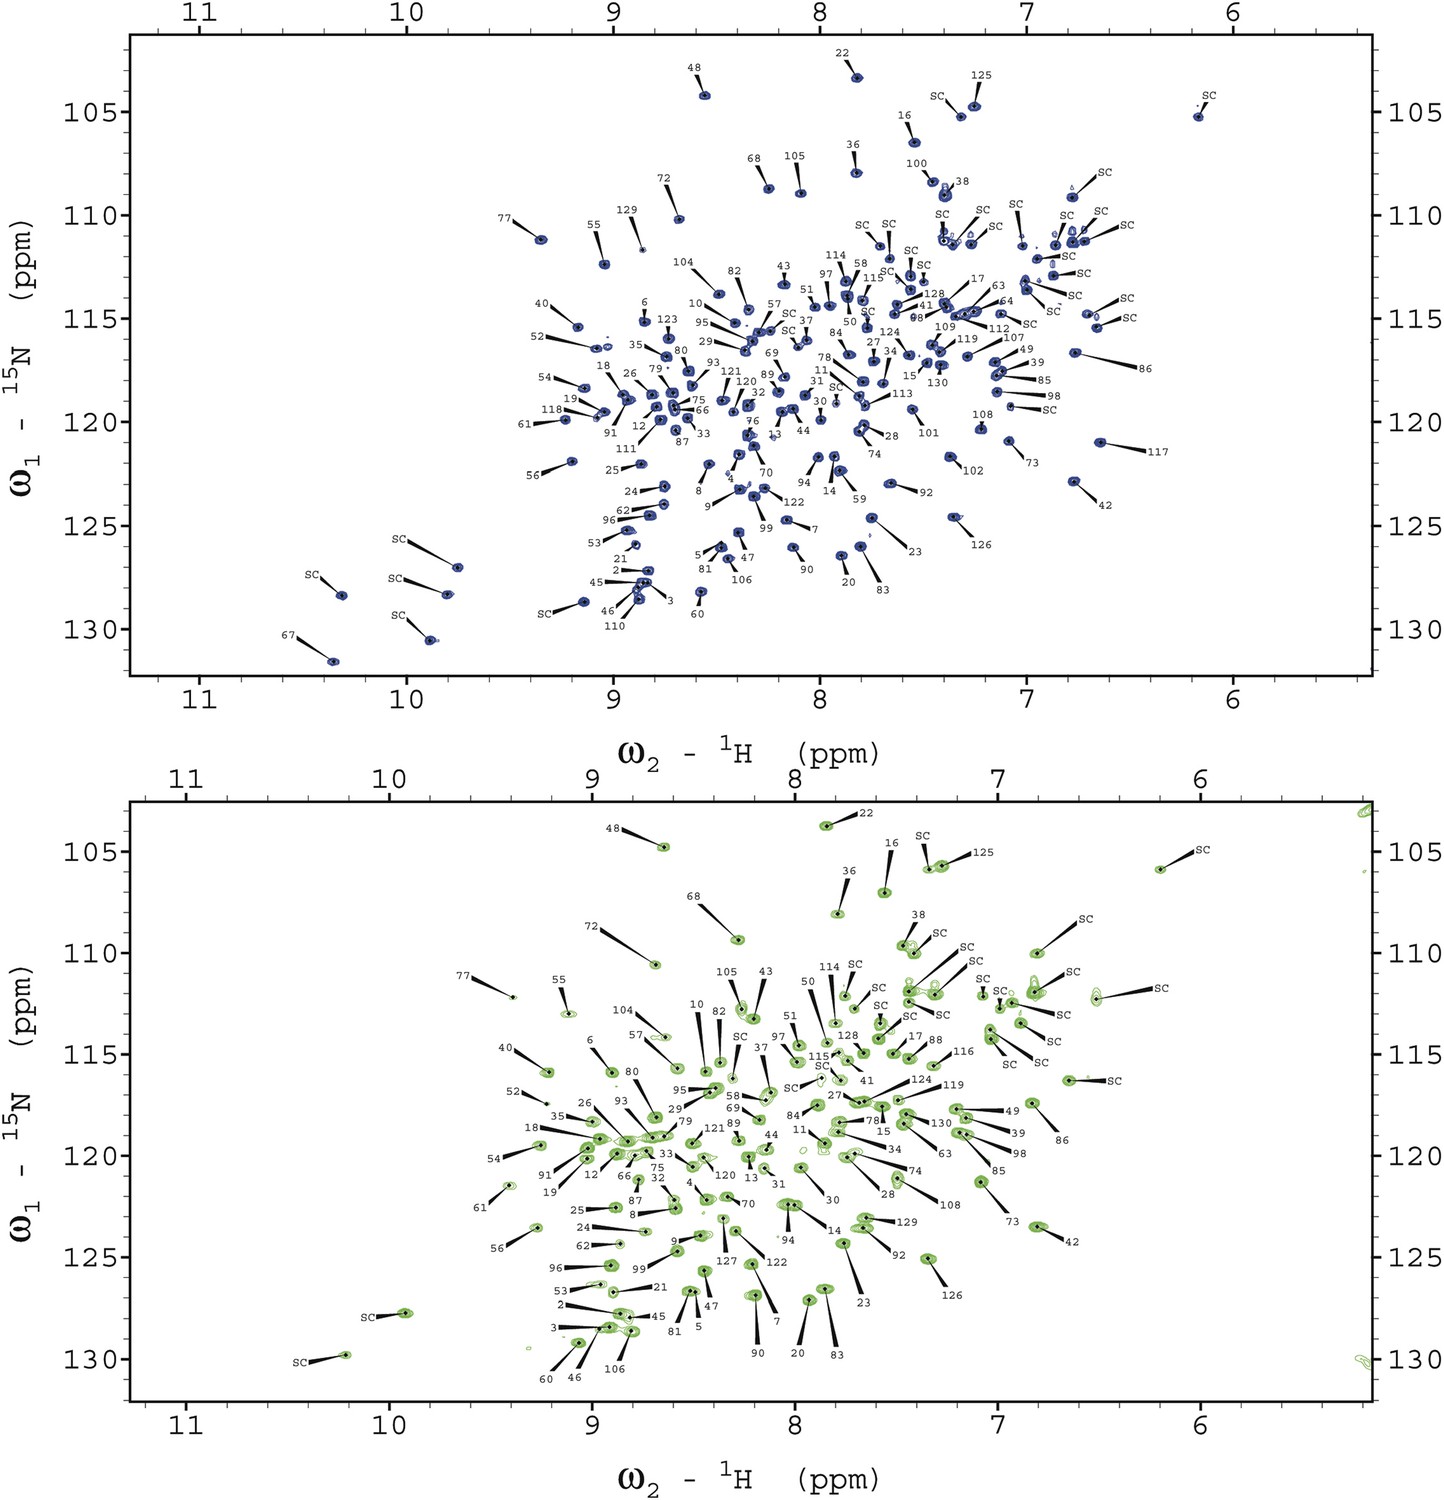
Assignments of the 1H-15N HSQC spectra of the free and triNAG-bound states of human lysozyme.
The x-axis represents the 1H (in ppm) dimension and the y-axis represents the 15N (in ppm) dimension.
Figure 1—figure supplement 2

Extracts of 1H-15N HSQC spectra showing the titration of triNAG to human lysozyme for selected residues showing significant chemical shift changes upon binding.
Depending on the individual residues, the time scale of exchange is fast or intermediate. Blue: free state (f); yellow: 0.5 equivalents of sugar; red: 1.1 equivalents; green: 2.4 equivalents; blue: 10 equivalents, corresponding to the bound state (b). The x-axis represents the 1H (in ppm) dimension and the y-axis represents the 15N dimension (in ppm).
Figure 1—figure supplement 3
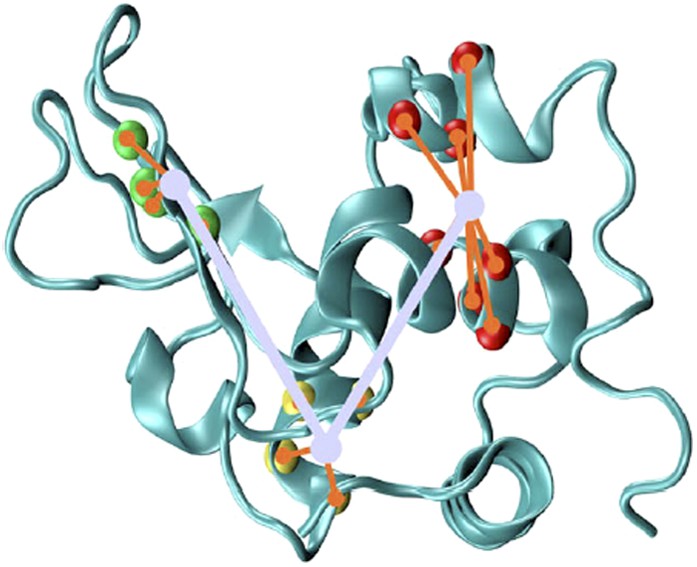
Illustration of the breathing angle θ of lysozyme (De Simone et al., 2013b), which accounts for the large-amplitude motion between the α-domain and β-domain of lysozyme and is computed from the centres of mass of Cα-atoms from three protein regions (De Simone et al., 2013b).
Region 1 (in the α-domain) spans residues 28–31 and 111–114 (in red), region 2 (in the hinge region) spans residues 90–93 (in yellow), and region 3 (in the β-domain) spans residues 44, 45, 51, and 52 (in green).
Figure 1—figure supplement 4

(A, B) Experimentally measured 15N-1H residual dipolar couplings (RDCs) of human lysozyme in the free state (A) and the triNAG-bound state (B).
(C, D) Representation of the regions that are mostly affected by triNAG binding in the steric (C) and electrostatic (D) RDC measurements (red indicates small changes and blue indicates large changes).
Figure 1—figure supplement 5
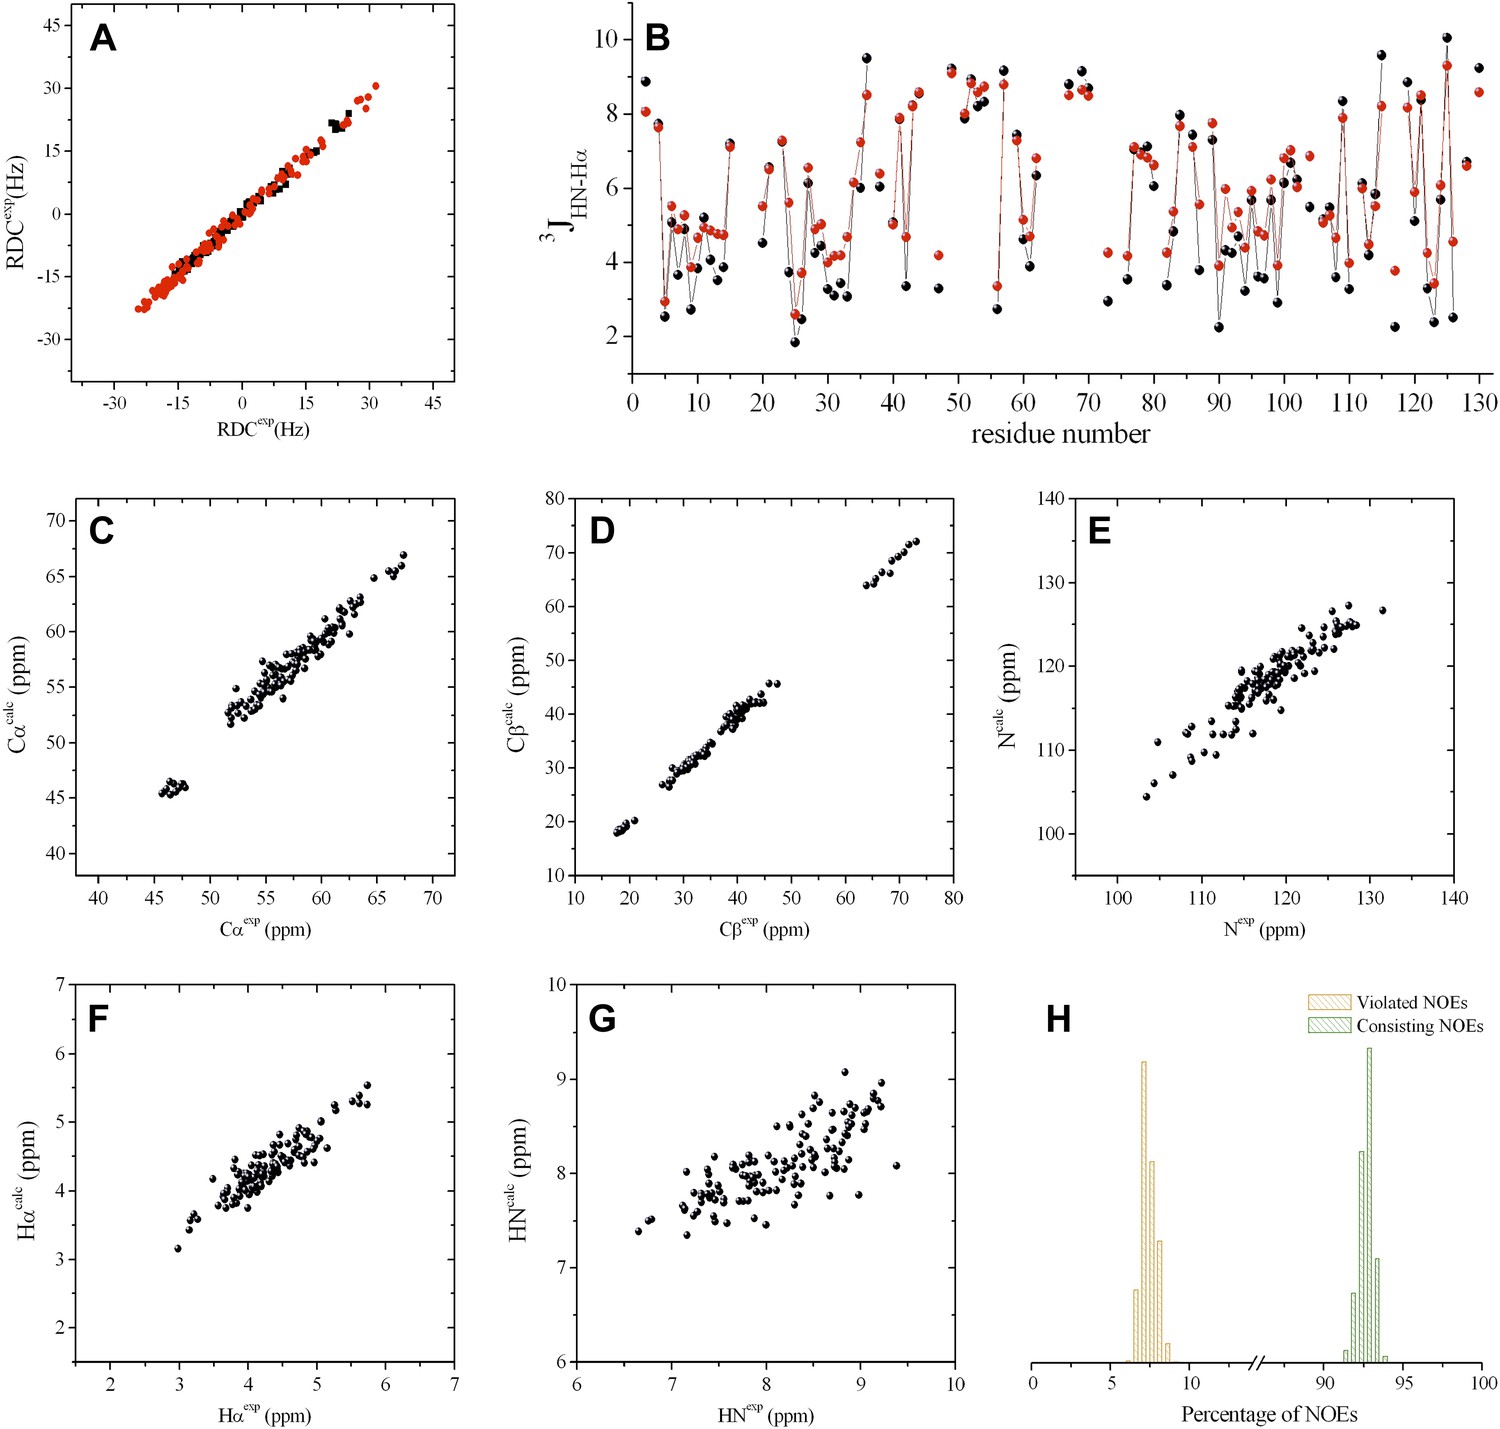
Validation of the RDC-refined structural ensembles determined in this work representing the free and triNAG-bound states of human lysozyme.
(A) Comparison between calculated and experimental RDCs (black circles for the steric medium and red circles for the electrostatic medium); the Q factors at 0.10 in both cases. (B) Comparison between experimental (black) and calculated (red) 3J HN-Hα scalar couplings; the RMSD value is 0.49 Hz. (C-G) Comparison between experimental and calculated chemical shifts, which we obtained by using the Sparta + method (Shen and Bax, 2010): Cα (C), Cβ (D), N (E), Hα (F), and HN (G); the RMSD values (in ppm) are 0.90, 0.82, 1.90, 0.16, and 0.24 for Cα, Cβ, N, Hα, and HN, respectively. (H) Distributions of the satisfied (about 93%, in green) and violated (about 7%, in orange) NOEs in the individual structures of the ensemble.
Figure 2
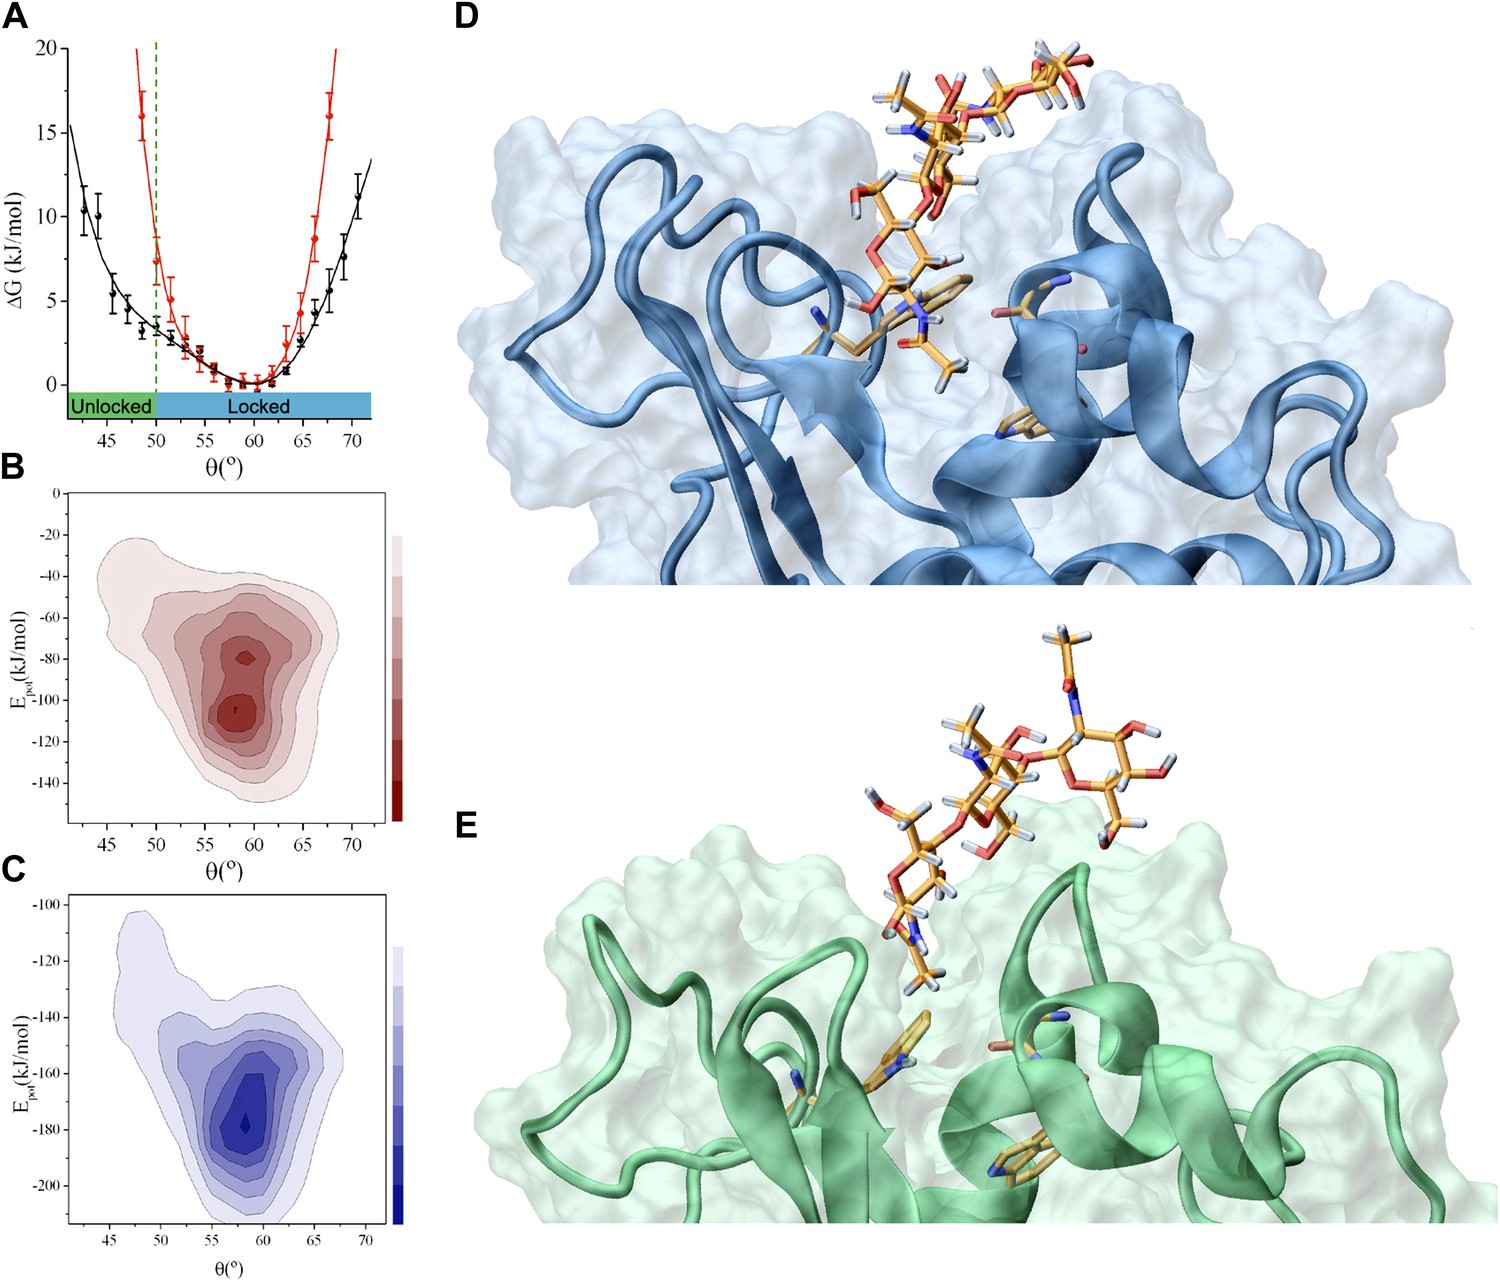
Analysis of the interactions that stabilise the intermediate state in the release of the product (the ‘unlocked state’).
(A) Free-energy landscape as a function of the angle θ. (B) Potential energy landscape, Epot, of lysozyme in the free state; Epot represents the contribution of the force field used in the simulations, that is, the total force field without the RDC restraint term (see ‘Materials and methods’). (C) Potential energy landscape, Epot, of the lysozyme-triNAG bound state. (D) Structure of the ‘locked state’. (E) Structure of the ‘unlocked state’.
Figure 3
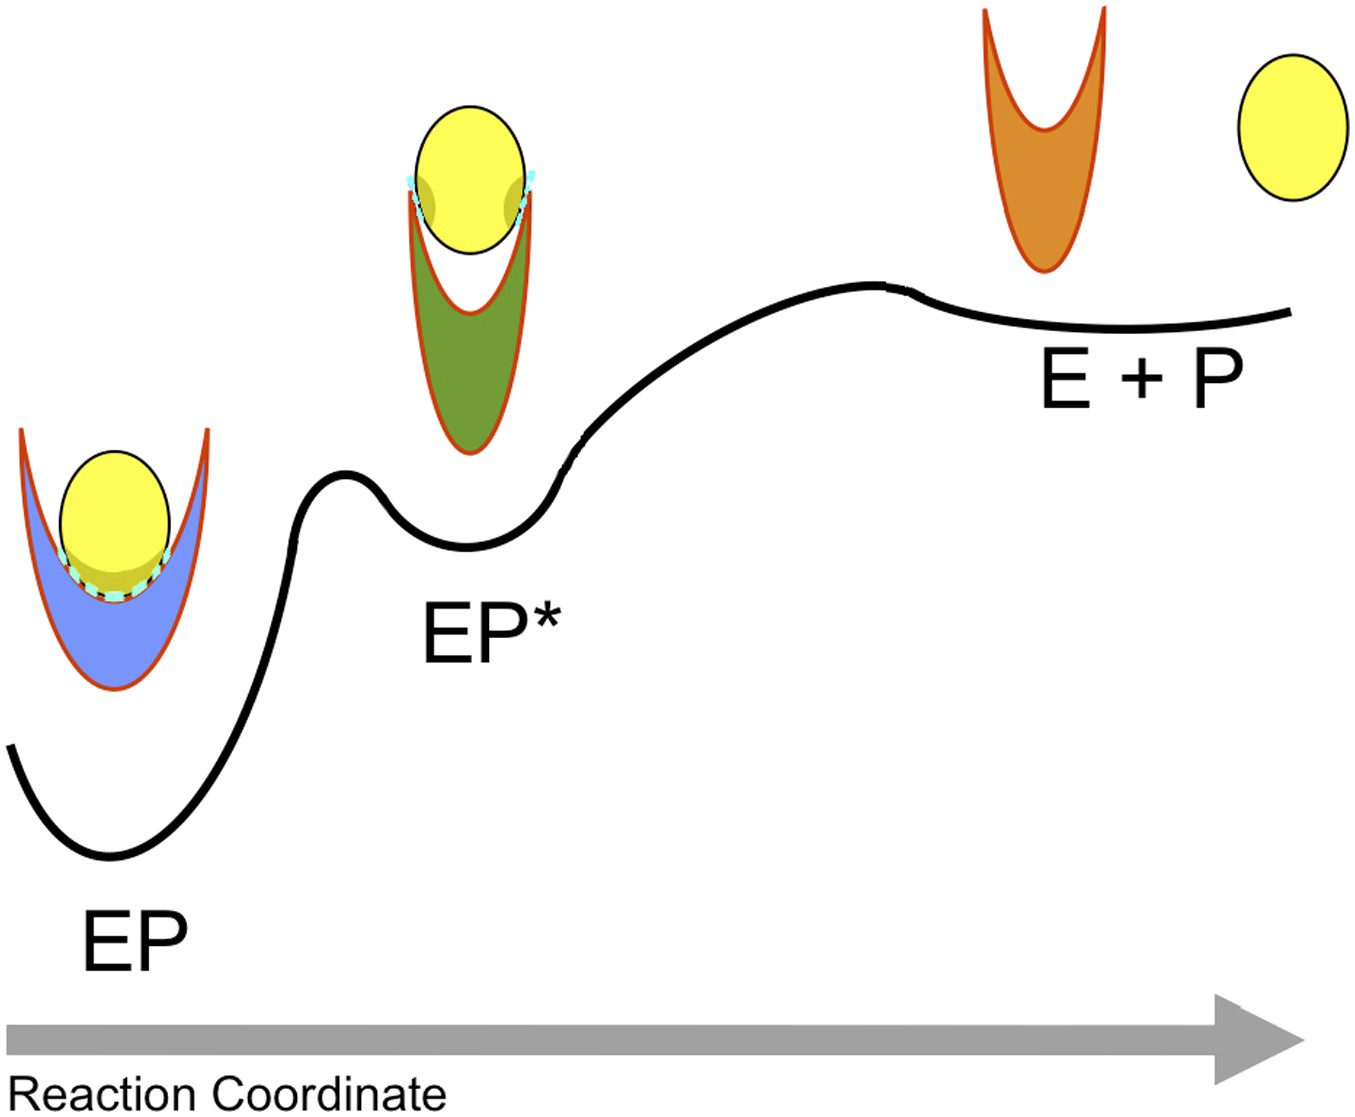
Schematic illustration of the process of product release.
The product (P) is released by the enzyme (E) in a process that begins in the ground (or ‘locked’) state of the complex (EP), visits a metastable (or ‘unlocked’) intermediate state (EP*) and reaches the unbound state (E + P). The interactions in the ‘locked state’ (EP) and in the ‘unlocked state’ (EP*) are shown in light blue.
Figure 4 with 3 supplements

Experimental assessment of the role of the intermediate state determined in this work in the product release process.
(A) Structure of the unlocked state illustrating the hydrogen bond between side chains of N44 and E35 that stabilises this intermediate species. (B) The hydrogen bond is not formed in the locked state because N44 and E35 are too far apart. (C) The N44A variant, which lacks the hydrogen bond donor, is unable to form this hydrogen bond, thus destabilising the intermediate state and inhibiting the release of the product. The decrease of the ability of the N44A mutant to release triNAG has been assessed by surface plasmon resonance (SPR) experiments. (D) Cellular assay of lysozyme activity. The N44A variant has an intermediate activity between wild type and the control E35D variant.
Figure 4—figure supplement 1
Comparison of the 1H-15N HSQC spectra of WT (black) and N44A mutant (red).
https://doi.org/10.7554/eLife.02777.012
Figure 4—figure supplement 2
Comparison of the free-energy landscapes of wild-type (red) and N44A mutant (black) lysozyme.
In the N44A mutant, the unlocked state (see also Figure 1) is absent. Free-energy landscapes were obtained as described in Figure 1.
Figure 4—figure supplement 3
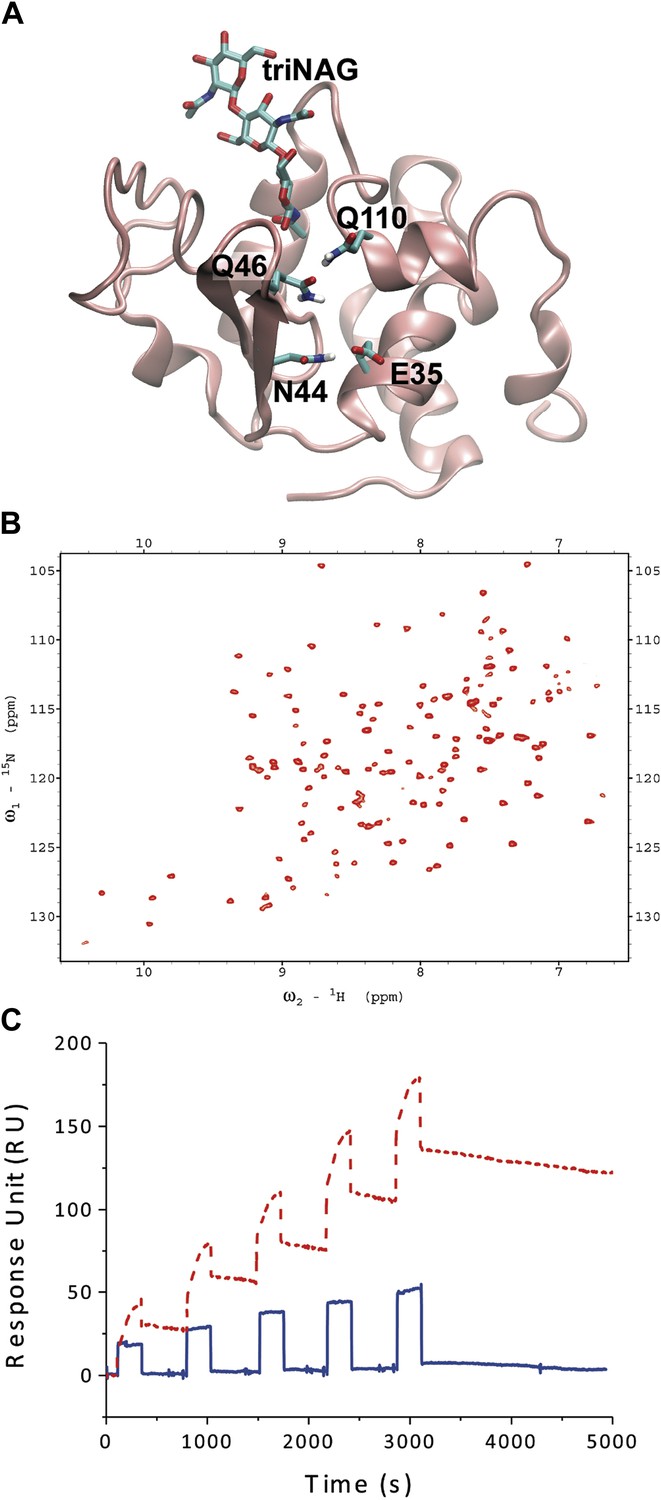
Study of the N46Q/V110Q mutant.
(A) Illustration of the engineered N46Q/V110Q glutamine–glutamine interactions. (B) The 1H-15N-HSQC spectrum of the N46Q/V110Q mutant shows that the mutation does not affect the structural properties of the mutant (see also Figure 4—figure supplement 1). (C) The increase in the ability of the N46Q/V110Q mutant to release triNAG has been assessed by surface plasmon resonance (SPR) experiments.
Download links
A two-part list of links to download the article, or parts of the article, in various formats.
Downloads (link to download the article as PDF)
Open citations (links to open the citations from this article in various online reference manager services)
Cite this article (links to download the citations from this article in formats compatible with various reference manager tools)
Structure of a low-population intermediate state in the release of an enzyme product
eLife 4:e02777.
https://doi.org/10.7554/eLife.02777


