PDF neuron firing phase-shifts key circadian activity neurons in Drosophila
- Brandeis University, United States
- National Center for Behavioral Genomics, Brandeis University, United States
- Howard Hughes Medical Institute, Brandeis University, United States
Figures
Figure 1
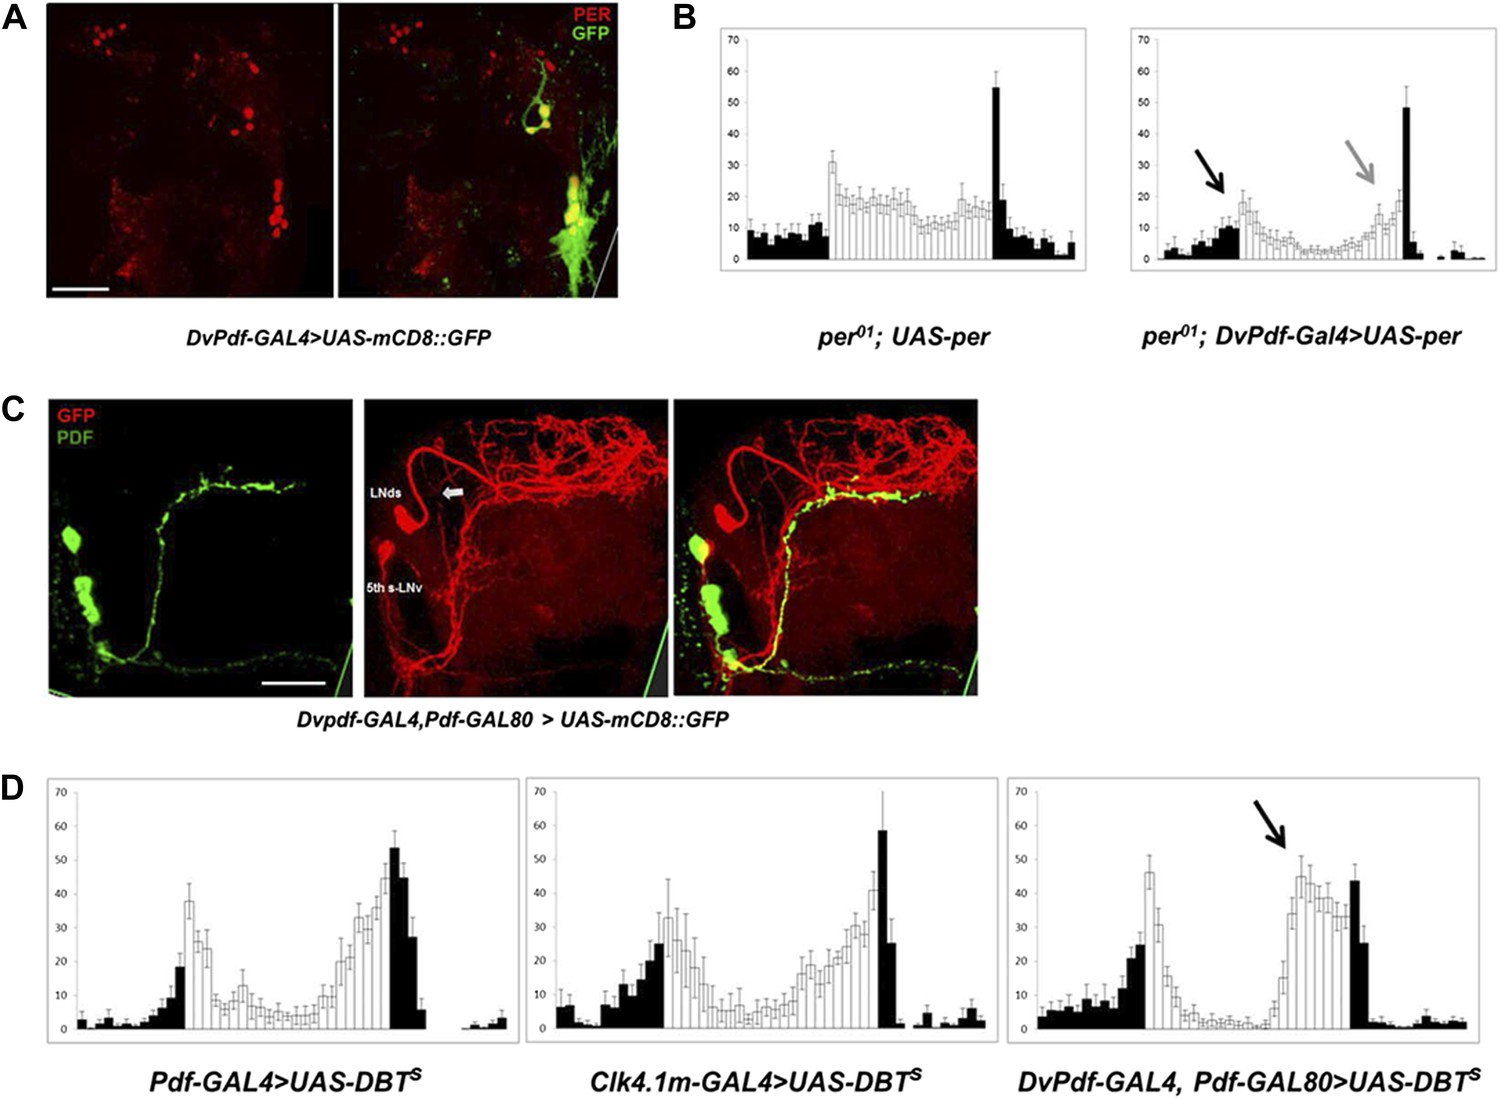
Characterization of the five E cells labeled by DvPdf-GAL4, Pdf-GAL80.
(A) The brain expression pattern of DvPdf-GAL4; UAS-mCD8::GFP flies. Immunostaining with anti-PER only (red, left panel) and with anti-GFP (green) as well as anti-PER (right panel). GFP and PER co-localize in the PDF positive cells, LNds and the 5th-sLNv. The scale bar = 50 μm. A maximum intensity projection of confocal image stacks containing the cell bodies regions is shown. (B) Rescue of PER expression with DvPdf-GAL4 in a per0 background restores both morning and evening anticipation peaks. per0 flies have no morning and evening anticipation peaks (left panel), whereas per0; DvPdf-GAL4; UAS-per flies show normal morning and evening peaks (right panel). Black and gray arrows point to morning and evening anticipation peaks, respectively. White and black bars indicate activity events/30 min bin during the day and night of the LD cycle. Error bars represent standard error of the mean (SEM). n = 15–16 for each group. (C) GFP immunostaining of DvPdf-GAL4, Pdf-GAL80; UAS-mCD8::GFP flies. GFP (red) is expressed in 3–4 LNds and the 5th-sLNv (middle panel), and PDF (green) is expressed in the large and small LNvs (left panel). The white arrow shows additional tracts from Dv-E cells that project to the accessory medulla (aMe). The scale bar = 50 μm. (D) Averaged group activity profiles from UAS-DBTs expressed with Pdf-GAL4, Clk4.1m-GAL4 and DvPdf-GAL4, Pdf-GAL80 flies. The black arrow shows the advanced evening anticipation peak. Averaged over 2 days of LD data. White and black bars indicate activity events/30 min bin during the day and night of the LD cycle, respectively. Error bars represent standard error of the mean (SEM). n = 15–16 for each group.
Figure 2
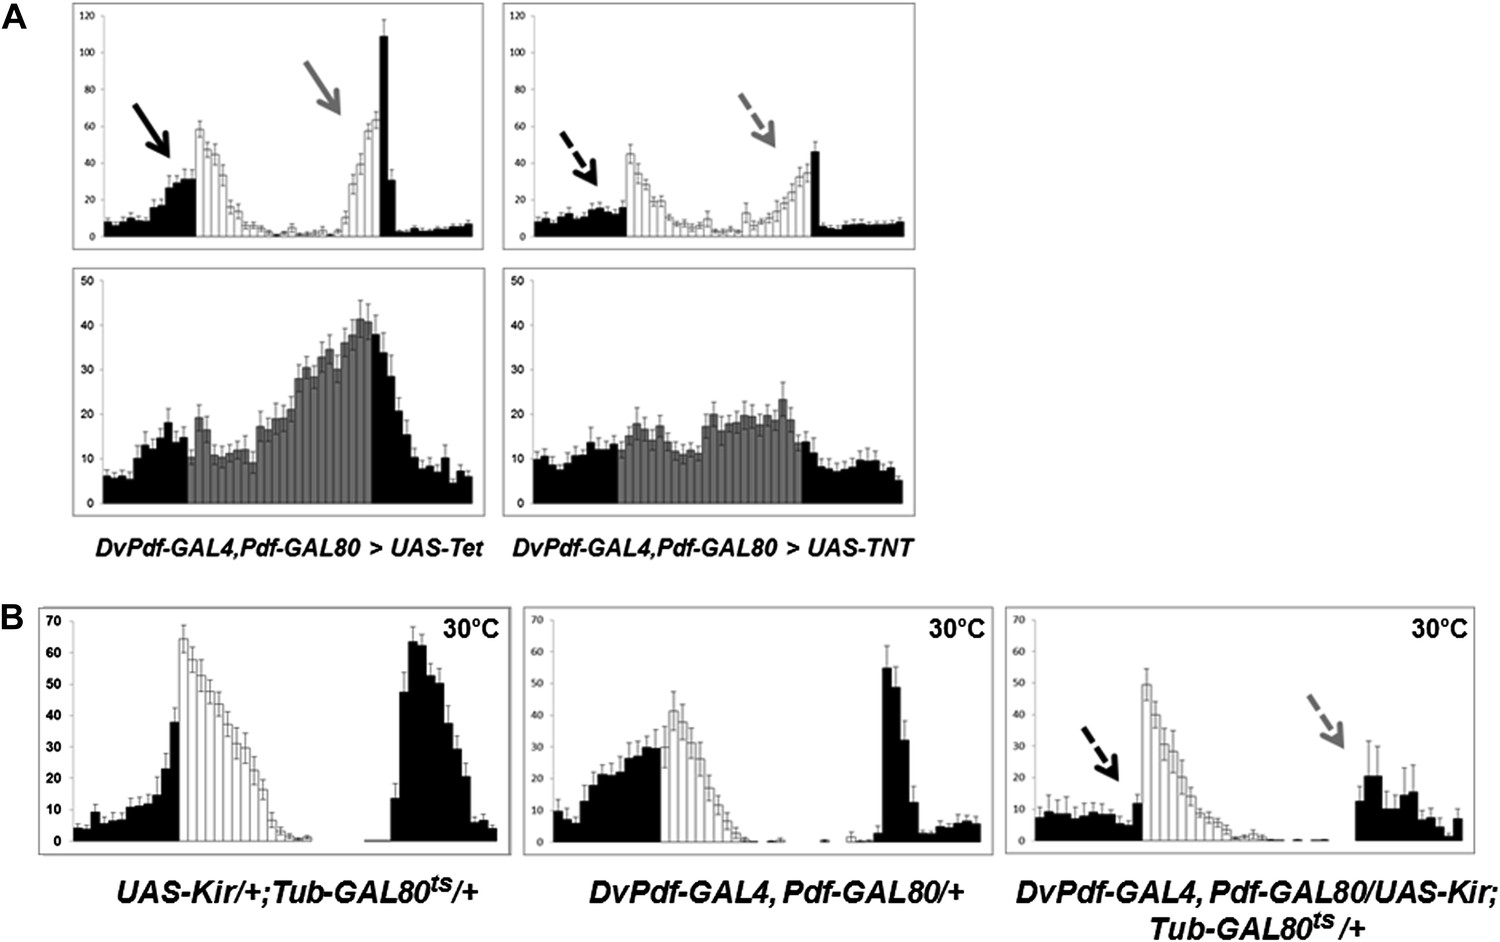
The five Dv-E cells are essential for circadian activity.
(A) Group activity profiles during LD (top) and DD (bottom) cycles from DvPdf-GAL4, Pdf-GAL80/UAS-Tet and DvPdf-GAL4, Pdf-GAL80/UAS-TNT flies averaged over 3 days of LD or DD data. White/black bars, LD cycle; Grey/black bars, DD cycle. Error bars represent standard error of the mean (SEM) and n = 16 for each group. Arrows indicate morning anticipation (black) and evening anticipation (light gray), and dashed arrows indicate attenuated morning anticipation (black) and evening anticipation (light gray). The activity (with the standard error of the mean), DD rhythmicity and period are also shown. (B) Averaged group activity profiles during LD cycles from UAS-Kir/+; TubGAL80ts/+ (left panel), DvPdf-GAL4, Pdf-GAL80/+ (middle panel) and DvPdf-GAL4, Pdf-GAL80/UAS-Kir; TubGAL80ts/+ (right panel) flies at 30°C. The left and middle panels are the two parental control strains and the right panel is the activity-inhibited strain. At the high temperature the control flies show a typical increased morning peak and delayed evening peak. In the right panel, the GAL80ts become inactivated at 30°C allowing KIR expression in the E cells. The dashed arrows indicate attenuated morning and evening peaks. White/black bars indicate activity events in day/night as above. n = 24 for DvPdf-GAL4, Pdf-GAL80/UAS-Kir; TubGAL80ts/+flies and n = 20 for parental groups. Error bars represent SEM.
Figure 3
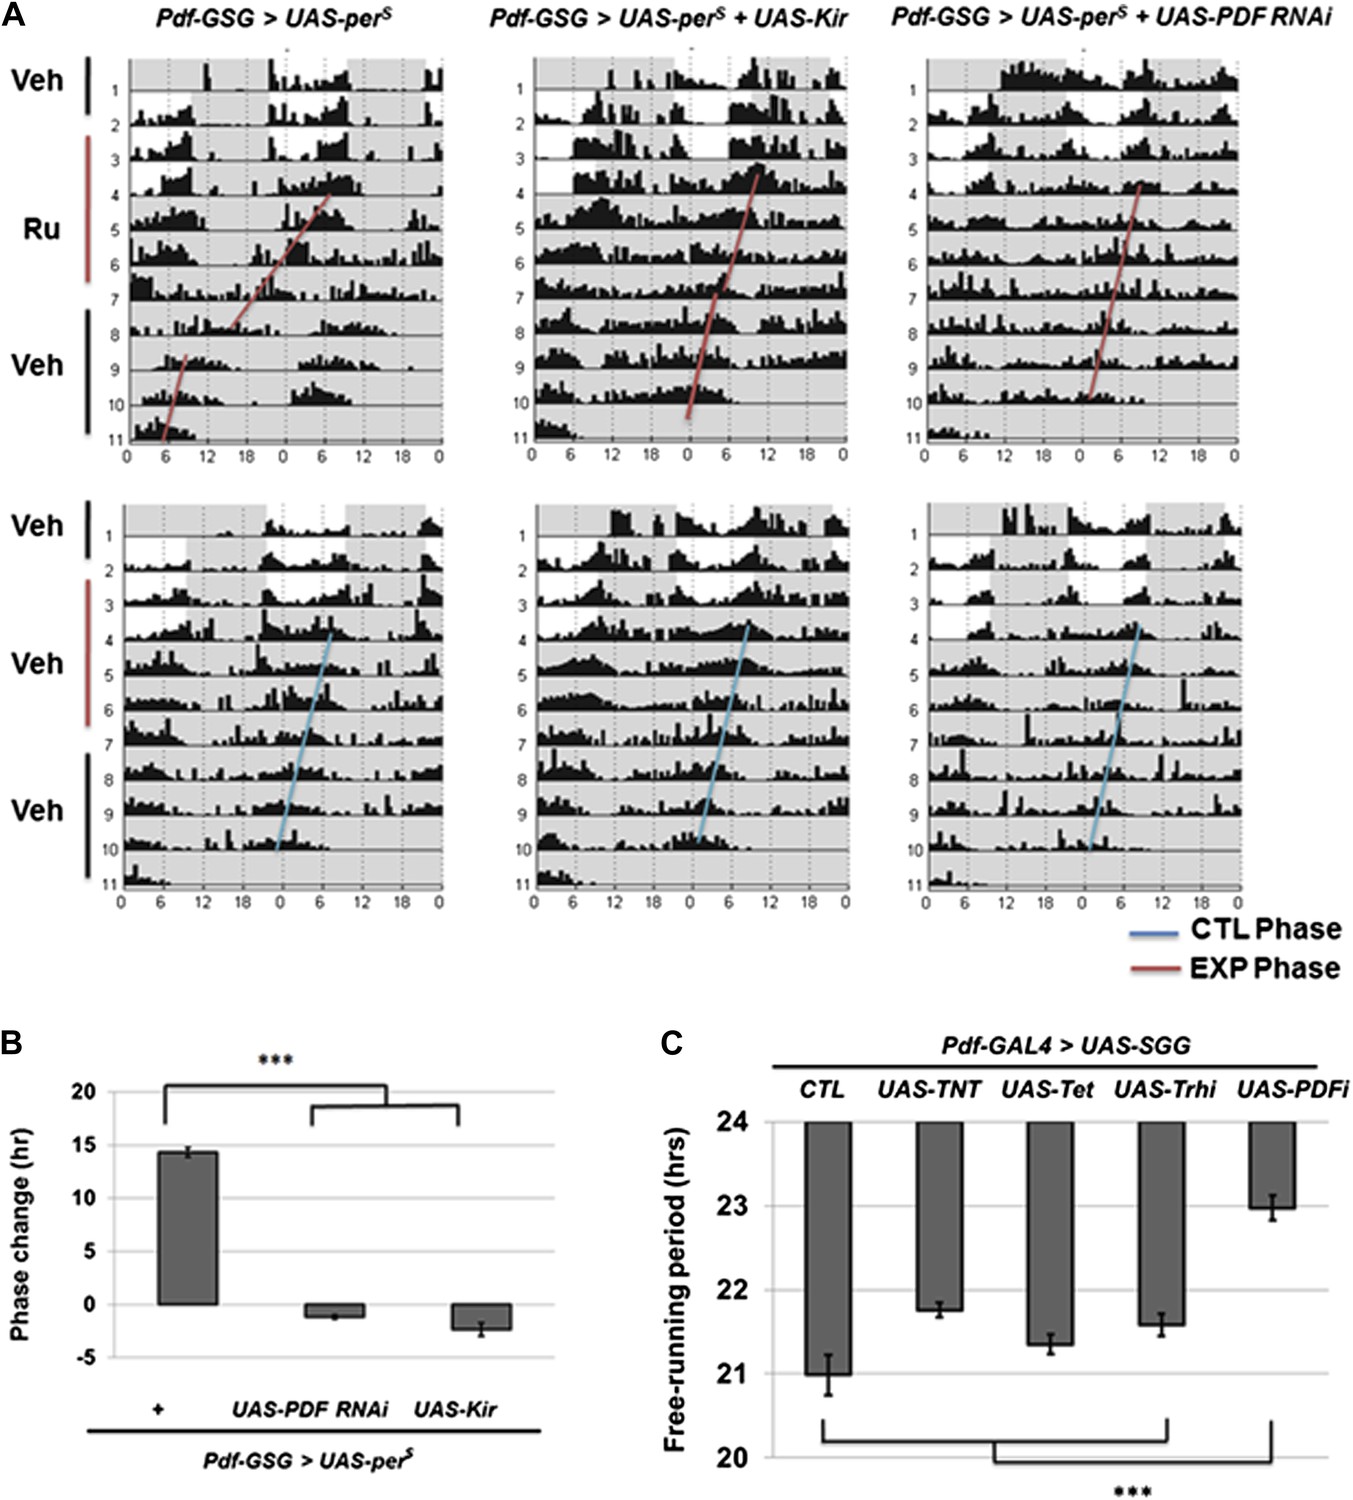
M cells use the PDF peptide and neuronal activity to adjust period in DD.
(A) Accelerated M cells send PDF as a resetting signal to cause a daily advanced activity phase. Double plotted averaged actograms of representative individual flies from each genotype are shown. Experimental group were transferred to RU486 food for 2 days in LD and the maintained for 3 days in DD before being returned back to food containing vehicle. Control group were maintained in vehicle food. Flies expressing Kir and PDF RNAi in M cells gradually lose rhythmicity during the 3 drug feeding DD days. In the actograms, white background represents day, gray background represents darkness. Red lines indicate the DD phase of the experimental group, and the blue lines indicate the DD phase of control group. The genotype of each group was labeled above the panels. (B)The quantification of phase change for the genotypes described in (A). n = 60-64 for each group. ‘***’ means p<0.001 as determined by one way analysis of variance (ANOVA), Tukey post hoc test, and the error bars indicate SEM. (C) Co-expression of PDF RNAi in accelerates M cells prevented period shortening. The histogram shows the period of five genotypes: UAS-SGG; Pdf-GAL4/+, UAS-SGG; Pdf-GAL4/UAS-TNT, UAS-SGG; Pdf-GAL4/UAS-Tet, UAS-SGG; Pdf-GAL4/UAS-Trh RNAi, UAS-SGG; Pdf-GAL4/UAS-PDF RNAi. Tetanus toxin light chain (TNT) was used to block neurotransmitter releasing, and Tet is an inactive form of TNT, Trh RNAi was used as control of PDF RNAi since PDF cells do not express tryptophan hydroxylase (Trh), PDF RNAi is as in Figure 2B n = 13–15 for each group. ‘***’ represents p<0.001 as determined by one way analysis of variance (ANOVA), Tukey post hoc test, and the error bar indicates SEM.
Figure 4
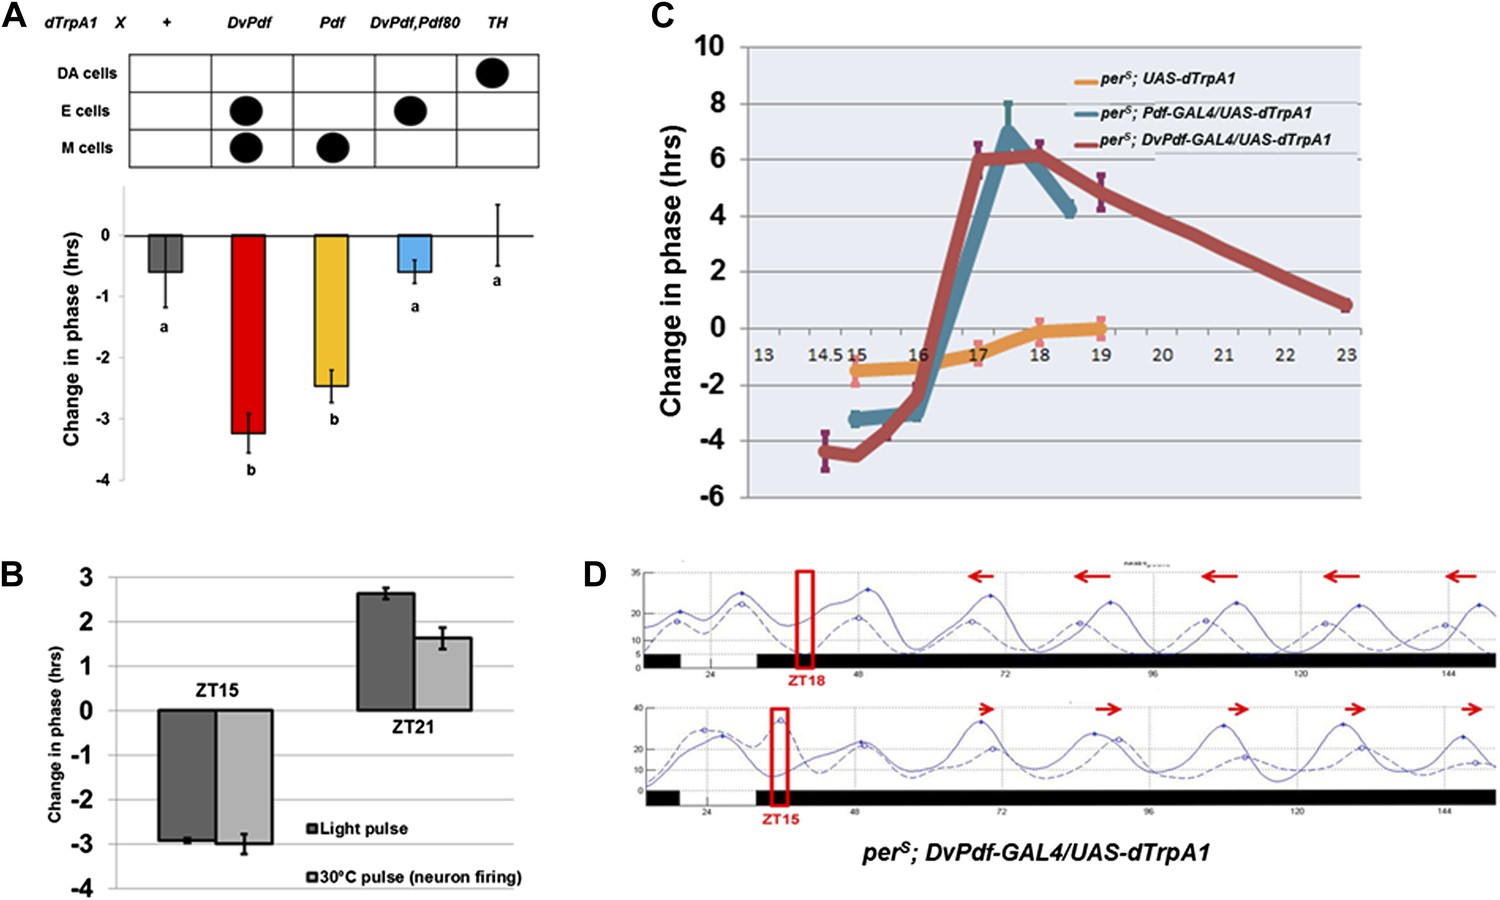
Activation of M cells is necessary and sufficient to trigger a phase-shift without light.
(A) Only the drivers that express dTrpA1 in the PDF+ morning cells can cause a phase-shift in constant darkness. All of the GAL4>UAS-dTrpA1 flies were first entrained during 3 LD days to synchronize their endogenous clock and the transferred to 30°C at ZT15 for 2 hr during the last LD night and then returned to 21°C for the following days in DD. GAL4 lines that exhibit substantial phase delays label the PDF-positive pacemaker neurons. n = 16–32 for each group. Genotype of each group was labeled above the histogram. DA = dopaminergic neurons. M and E cells were described in main text. The letters ‘a’ and ‘b’ indicate significantly different groups (p<0.001), by one way analysis of variance (ANOVA), Tukey post hoc test. The error bars indicate SEM. (B) Firing of PDF positive morning cells induces quasi-normal phase-shifts compared to light-induced phase-shifts. Pdf-GAL4/UAS-dTrpA1 flies exhibit a phase delay at ZT15 and a phase advance at ZT21 after a 2 hr 30°C pulse or a 2 hr light pulse. n = 32 for each group. The error bars indicate SEM. Note that phase-shift values are not very different from a standard 10 min light pulse. (C) The magnitude of a neuronal firing-induced phase-shift is larger in perS flies. perS; pdf-GAL4/UAS-dTrpA1, perS; DvPdf-GAL4/UAS-dTrpA1 and perS; UAS-dTrpA1 flies were exposed to a 2 hr 30°C pulse at different circadian times. n = 16-32 for each group. The error bars indicate SEM. (D) The detailed phase shift panel of the 30°C pulse at ZT15 and ZT18 of perS; DvPdf-GAL4/UAS-dTrpA1 flies. Red box indicates the time of the 2 hr pulse of 30°C. The dashed line represents the 30°C pulsed group and the solid line the control group. Red arrows indicate the direction of phase change.
Figure 5
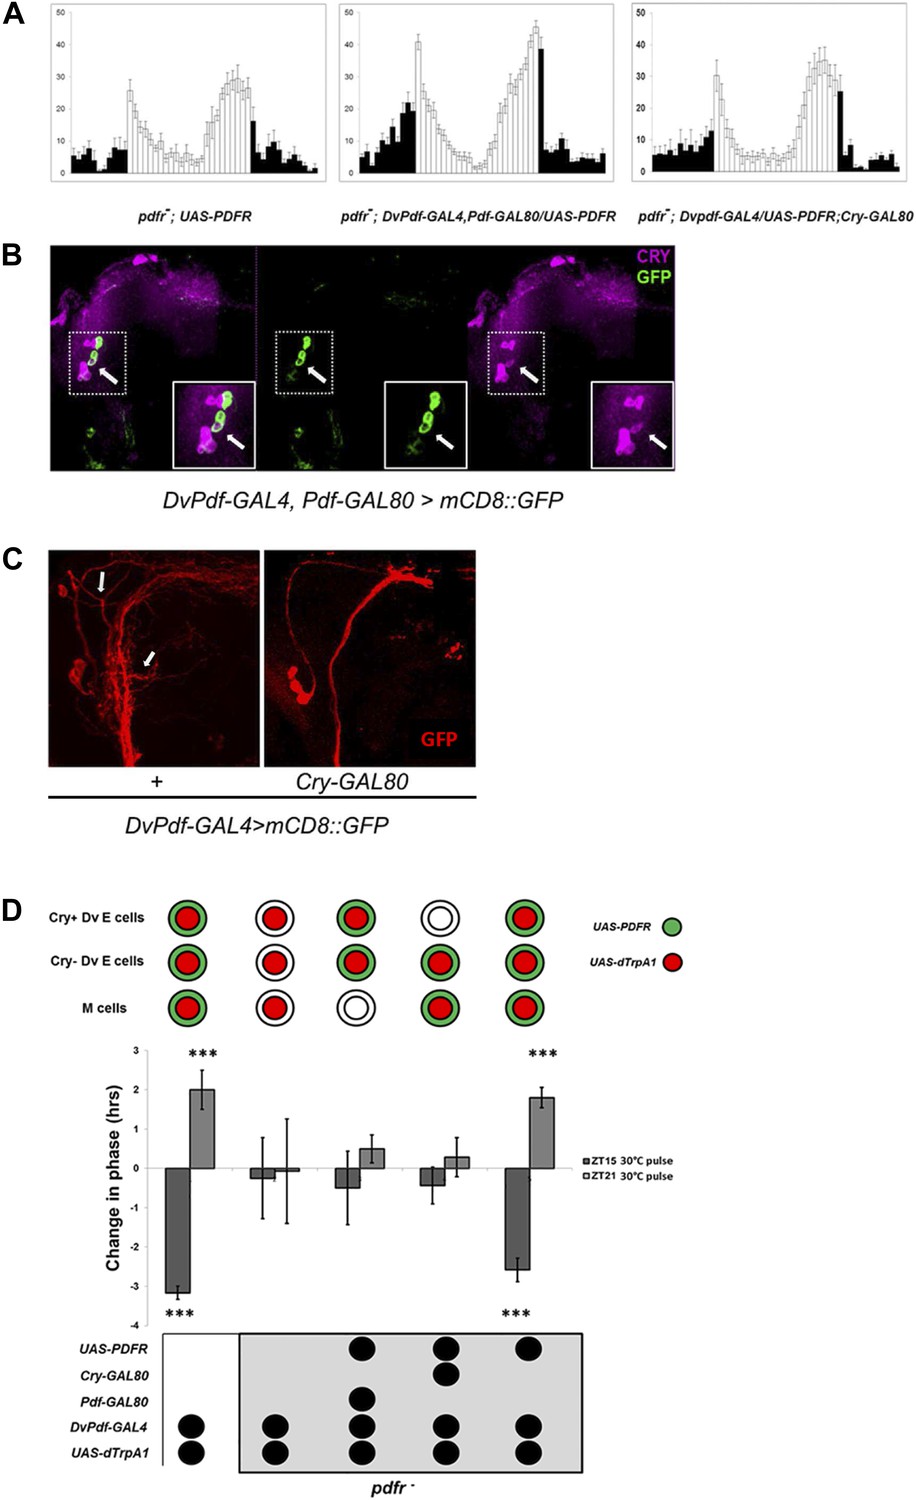
Restoring E cell PDFR rescues period, rhythmicity and firing-induced phase shifts.
(A) pdfr mutant flies show no morning peak and an advanced evening peak as expected (left panel). Rescue of PDFR expression with the Dv-E cell driver in this mutant background restores both morning and evening anticipation peaks, that is, these flies show an intact morning peak and more normal onset of evening peak activity (middle panel). Inhibition of rescue in CRY-positive E cells with Cry-GAL80 prevents the restoration of morning and evening activity peaks. n = 16–18 for each group. Genotypes are shown under each panel. The error bar indicates SEM. (B) CRY staining pattern in DvPdf-GAL4, Pdf-GAL80; UAS-mCD8::GFP brains. GFP (green) is expressed in 4 LNds (left and middle panel), and CRY signal (magenta) is visible in the large PDF cells (below and to the left of the arrow) as well as 3 LNds (left and right panel). The arrow shows the one CRY-positive DV-E cell. Magnified images of the upper dash line boxed area are shown in lower solid line box. (C) Adding a copy of Cry-GAL80 eliminates GFP staining of the CRY-positive Dv-E cells as well as their branches, which are adjacent to the PDF cell dorsal projections. Brains from DvPdf-GAL4/+; UAS-mCD8::GFP/+ (left panel) and DvPdf-GAL4/+; Cry-GAL80/UAS-mCD8::GFP (right panel) were stained with a GFP antibody (red). The upper arrow shows the typical projection from DvPdf -labeled CRY positive LNd neuron and the lower arrow points to likely branches from the 5th-sLNv. With Cry-GAL80, both of these projections are absent. Note that a copy of Cry-GAL80 can block GAL4 activity in CRY positive Dv-E cells but not in sLNv, the dorsal projections from sLNvs are still visible in DvPdf-GAL4/+; Cry-GAL80/UAS-mCD8::GFP brains (right panel). (D) Flies were exposed to a 30°C pulse for 2 hr at ZT15 (dark gray bars) or ZT21 (light gray bars). The expression pattern of UAS-dTrpA1 and UAS-PDFR is shown above the histogram. Genotypes shown below each histogram are (from left to right): DvPdf-GAL4/UAS-dTrpA1 (n = 32), pdfr−; DvPdf-GAL4/UAS-dTrpA1(n = 32), pdfr−; DvPdf-GAL4,UAS-dTrpA1/UAS-PDFR; Pdf-GAL80 (n = 24), pdfr−; DvPdf-GAL4, UAS-dTrpA1/UAS-PDFR; Cry-GAL80 (n = 24) and pdfr−; DvPdf-GAL4,UAS-dTrpA1/UAS-PDFR (n = 30). ‘***’ represents p<0.001 as determined by the student's t test and indicates a significant phase change. The error bars are SEM.
Figure 6
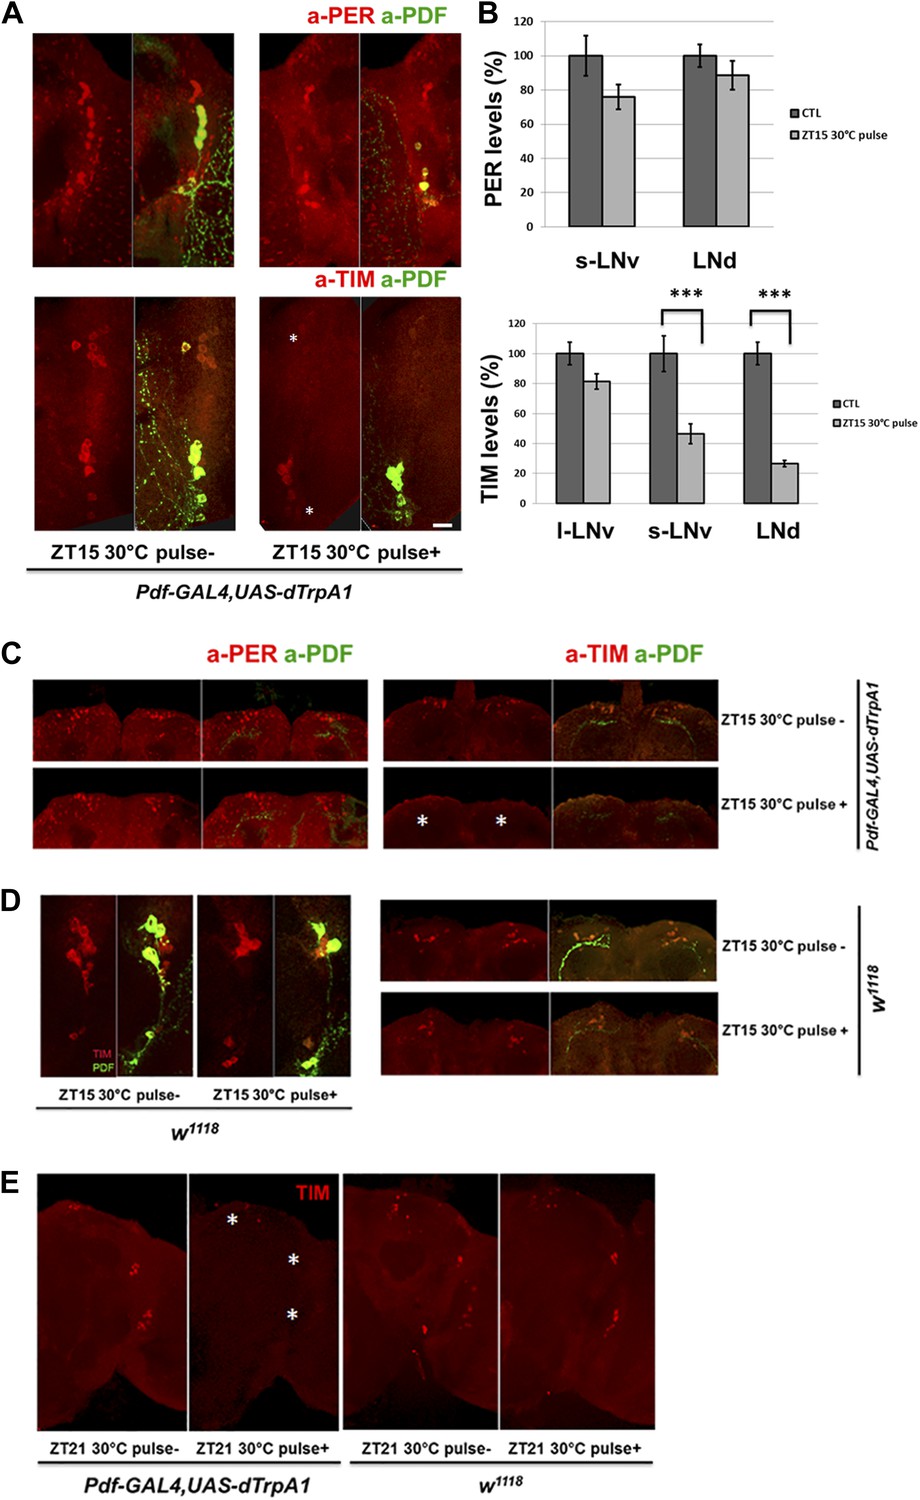
TIM but not PER in downstream circadian neurons responds to M cell firing.
(A) TIM and PER staining in central pacemakers of fly brains after firing of M cells at ZT15. PER or TIM staining intensity is measured in pdf-GAL4/UAS-dTrpA1 flies after a 2 hr 30°C pulse at ZT15. Brains were co-staining with anti-PDF (green) to visualize PDF+ cells. Asterisk indicates LNds (top) and s-LNvs cells (bottom). Note that staining in l-LNvs (higher than asterisk) does not change very much with firing. (B) Quantification of PER and TIM staining intensity in each group of clock neurons with or without a 30°C pulse (standard error of the mean [±SEM]). 5 brains and 10 hemispheres were quantified in each group. Scale bar = 20 μm. (C) TIM and PER staining in dorsal region (asterisk) of flies as described in (A). (D) TIM levels are not changed in wild-type fly brains after 2 hr at 30°C at ZT15. TIM levels in central (left panel) and dorsal circadian neurons (right panel) are shown in representative brains. (E) TIM levels are significantly decreased in Pdf-GAL4/UAS-dTrpA1 brains (left panel) but not in WT control brains (right panel) after 2 hr 30°C pulse at ZT21.
Figure 7
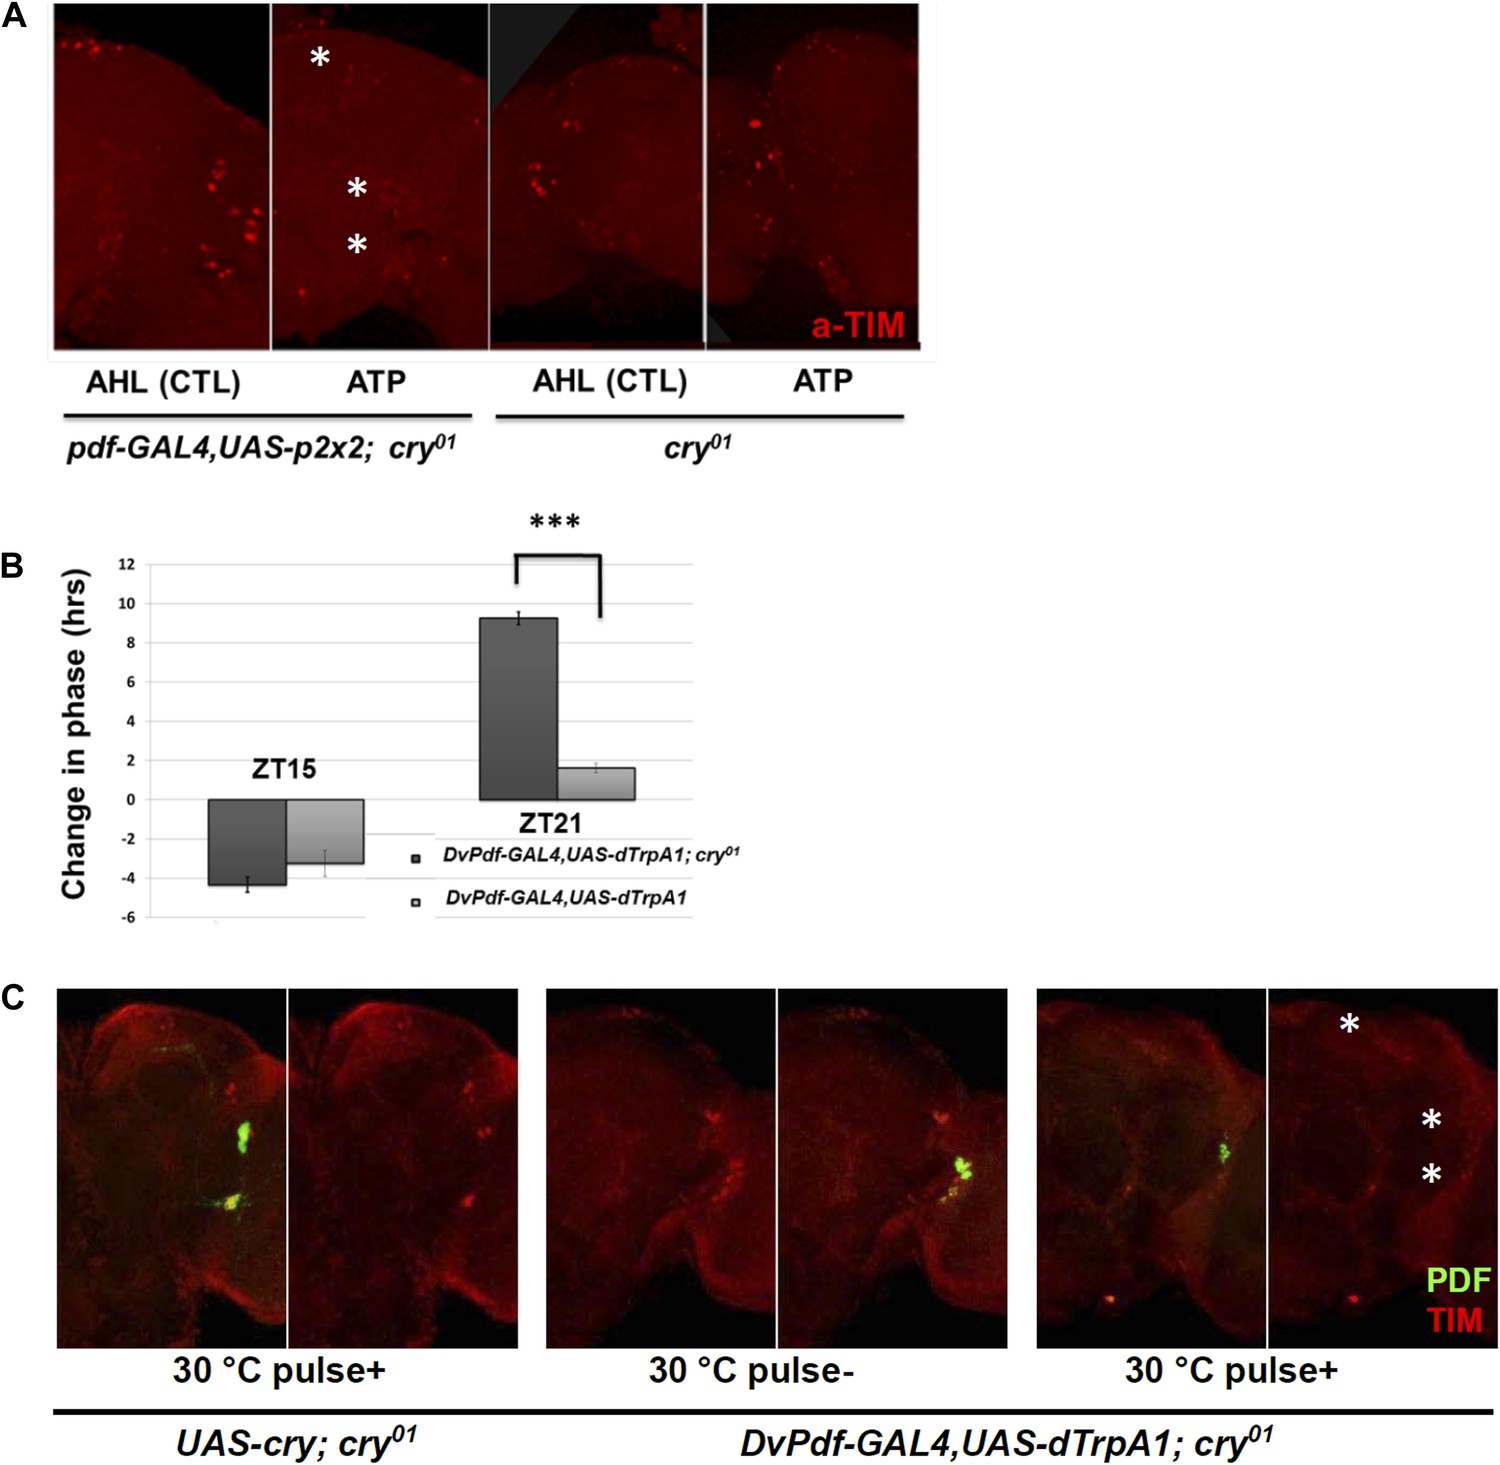
CRY is not required for M cell firing-induced TIM degradation and Phase Shifts.
(A) TIM staining intensity strongly decreases in response to M cell firing caused by 2 hr incubation with 2.5 mM ATP (Pdf-GAL4/UAS-p2x2; cry01, left panel) at ZT21. TIM levels in the control cry01 group were not affected by the 2.5 mM ATP incubation (right panel). Asterisks indicate DNs, LNds and LNvs (top to bottom). (B) Firing-induced phase-shifting behavioral data in a cry null mutant strain. This strain shows a normal response to firing at ZT15 but an exaggerated response at ZT21. n = 32 for each group. ‘***’ represents p<0.001 as determined by the student's t test for normally distributed data. The error bars indicate SEM. (C) TIM is degraded in DNs, LNds and LNvs (asterisks, top and bottom, respectively) after firing at ZT21 even without CRY. An anti-PDF antibody (green) was used to visualize LNvs, and TIM was visualized with an anti-TIM antibody (red). TIM levels were markedly decreased after a ZT21 2 hr 30°C pulse of DvPdf-GAL4/UAS-dTrpA1; cry01 flies. TIM was not decreased in control UAS-cry; cry01 flies. The control strains are in the left four panels and the firing panels in the right two panels. Odd panels show staining with PDF and anti-TIM, whereas the even panels show staining only with anti-TIM.
Figure 8
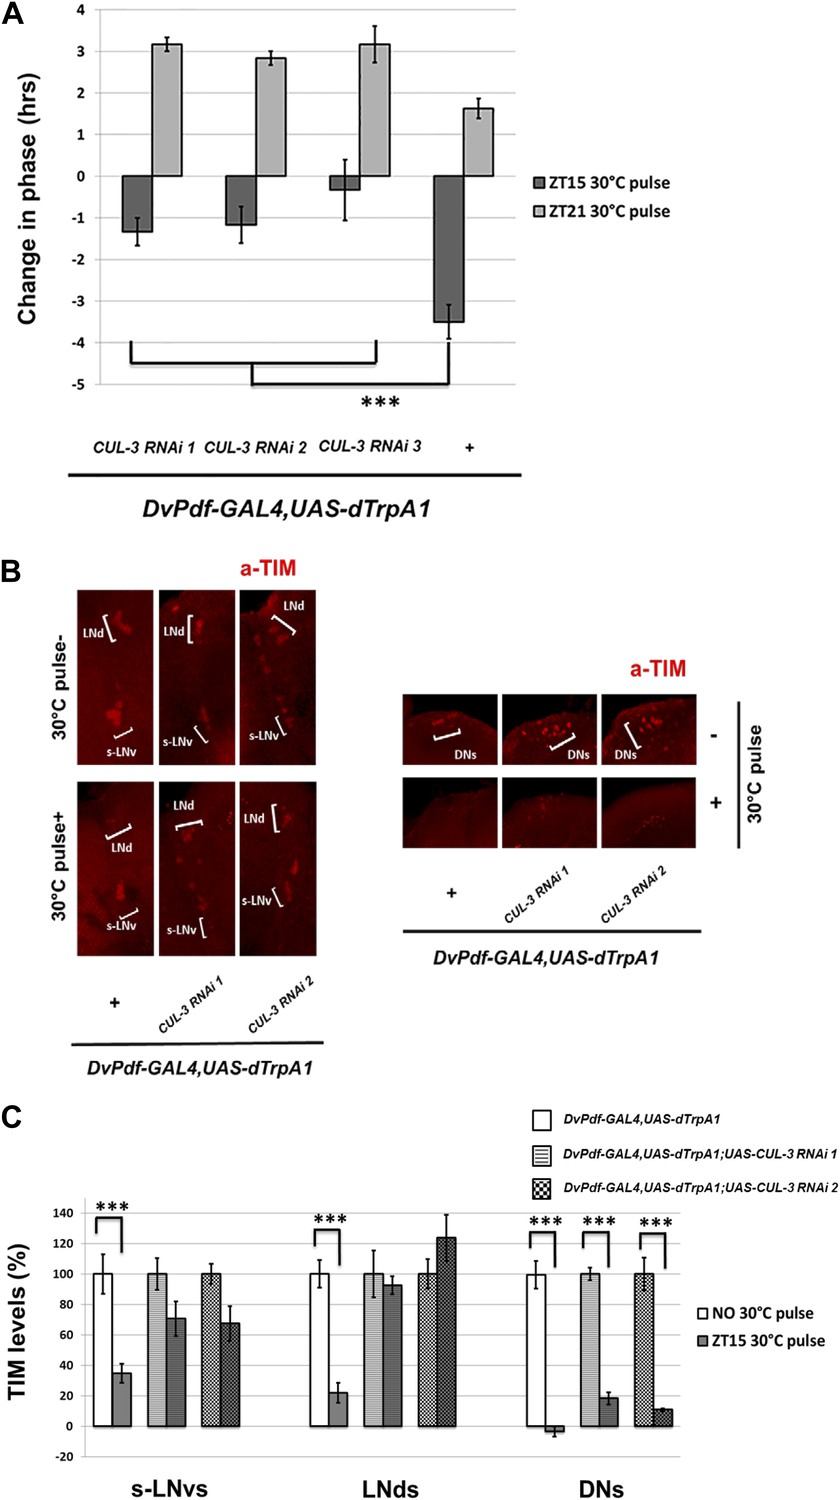
CUL-3 is involved in the delay zone phase shift response to PDF cell activation.
(A) CUL-3 RNAi lines and background control lines were co-expressed with dTrpA1 under control of DvPdf-GAL4. Their phase-shifts were measured after 2 hr 30°C pulse at ZT15 or ZT21. Genotypes were shown below each group. n = 30–32 for each group. ‘***’ means p<0.001 as determined by one way analysis of variance (ANOVA), Tukey post hoc test, and the error bars indicate SEM. (B) TIM levels were much less affected by neuron firing in DvPdf positive neurons expressing CUL-3 RNAi. Flies were transferred to 30°C and pulsed at ZT15 for 2 hr. Their brains were then dissected and immunostained with antibodies against TIM (red) and PDF (not shown). Different groups of circadian neurons were imaged and classified by their positions relative to PDF staining. Individual representative brains are shown. The experiment was repeated three times with qualitatively identical results in all three groups: LNds, s-LNvs and DNs. (C) TIM levels in different clock neuron groups for the genotypes described in (A) were quantified and normalized to the values of the control (same genotype without 30°C pulse, set to 100%). 10–12 hemispheres were examined in each group. ***p<0.001 compared to the controls as determined by the student's t test. The error bars indicate SEM.
Figure 9
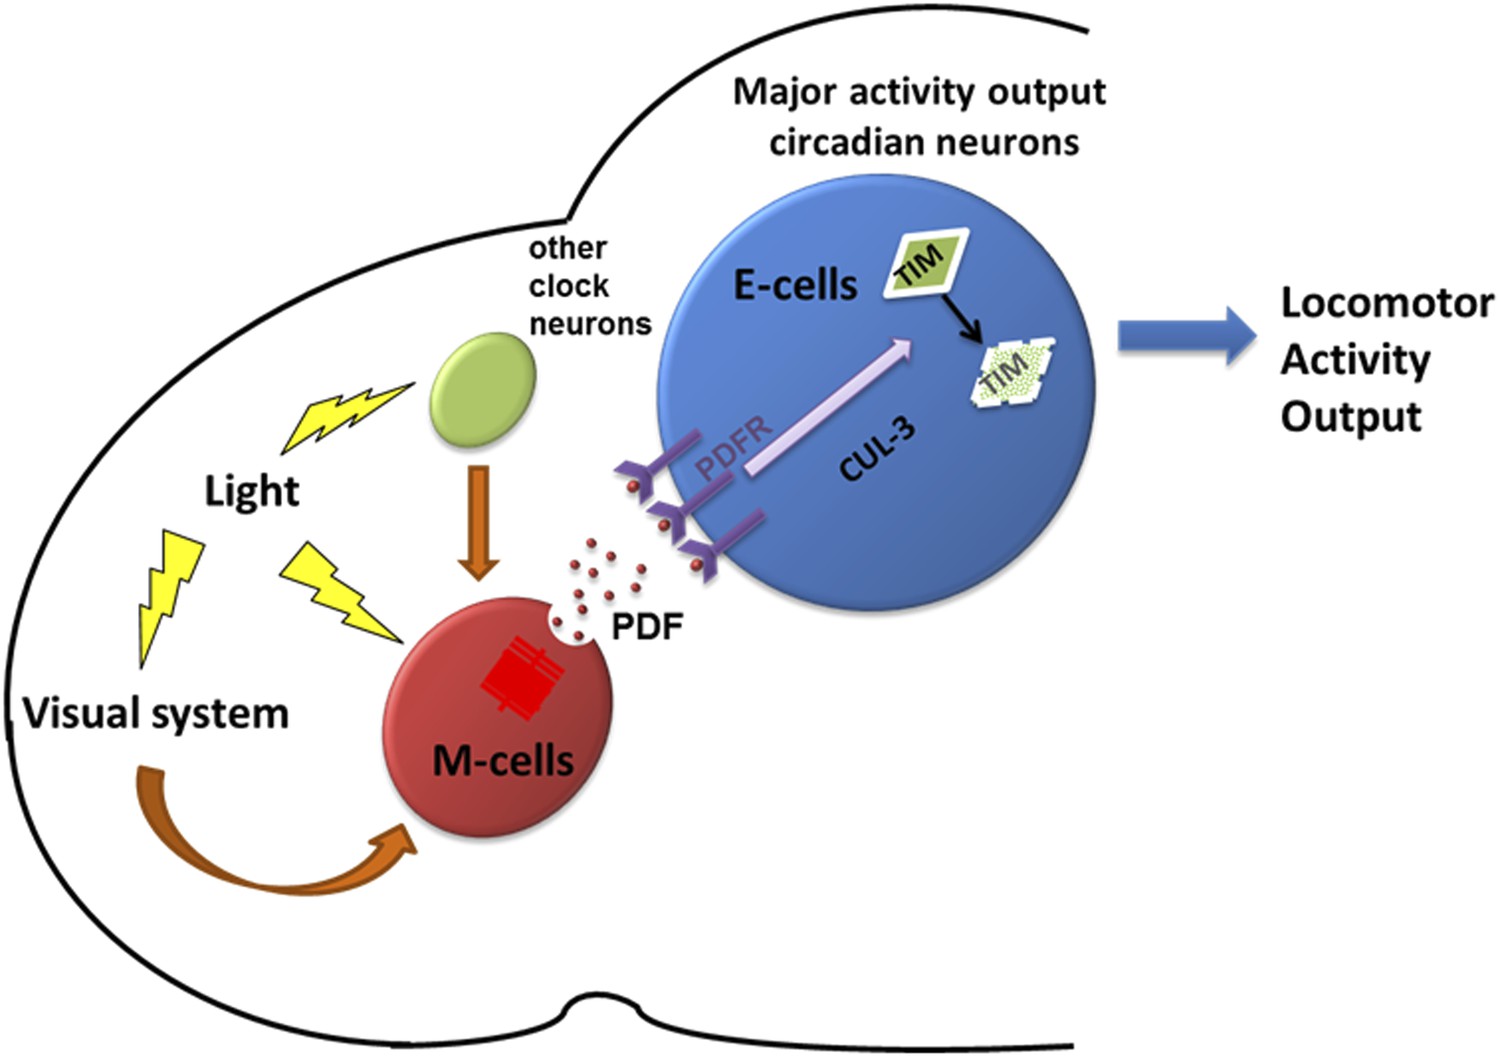
A model depicting how PDF and PDF-positive morning cells respond to light cues and control the pace of downstream E cells.
Light activates morning cells directly or only indirectly through the visual system or from other clock neurons and induces PDF secretion. PDF then acts on downstream evening cells to promote cytoplasmic TIM degradation through a CRY-independent and CUL-3 dependent pathway, which causes phase or period adjustment.
Tables
Table 1
Circadian behavior parameters of different genotypes under constant darkness (DD)
| Genotype | N | Rhythmic N | Percent rhythmic | Period (hr) ± S.D. | Power ±S.D. |
|---|---|---|---|---|---|
| Pdf-GAL4/+ | 15 | 14 | 93.3 | 24.3 ± 0.1 | 93 ± 15 |
| UAS-DBTs/+ | 16 | 16 | 100 | 23.7 ± 0.3 | 125 ± 19 |
| Clk4.1m-GAL4/+ | 16 | 14 | 87.5 | 24.2 ± 0.1 | 86 ± 15 |
| DvPdf-GAL4/+ | 32 | 29 | 90.6 | 23.6 ± 0.2 | 143 ± 22 |
| DvPdf-GAL4,Pdf-GAL80/+ | 30 | 26 | 86.7 | 24.5 ± 0.5 | 79 ± 14 |
| DvPdf-GAL4/+;Pdf-GAL80/+ | 16 | 14 | 87.5 | 24.2 ± 0.3 | 113 ± 26 |
| Pdf-GAL4/+;UAS-DBTs/+ | 16 | 11 | 68.7 | 19.7 ± 1.2 | 74 ± 16 |
| Clk4.1m-GAL4/UAS-DBTs | 15 | 12 | 80 | 23.1 ± 0.4 | 104 ± 23 |
| DvPdf-GAL4,Pdf-GAL80/+;UAS-DBTs/+ | 16 | 14 | 87.5 | 23.5 ± 0.1 | 69 ± 7 |
| DvPdf-GAL4,Pdf-GAL80/UAS-TNT | 16 | 4 | 25 | 24.1 ± 0.5 | 35 ± 6 |
| DvPdf-GAL4,Pdf-GAL80/UAS-Tet | 16 | 14 | 87.5 | 24.3 ± 0.2 | 134 ± 32 |
| UAS-Kir/+;Tub-GAL80ts/+ (30°C) | 20 | 16 | 80 | 25.7 ± 1 | 105 ± 16 |
| DvPdf-GAL4,Pdf-GAL80/UAS-Kir;Tub-GAL80ts/+ (30°C) | 24 | 5 | 20.8 | 26.5 ± 2.2 | 27 ± 5 |
| DvPdf-GAL4,Pdf-GAL80/+ (30°C) | 20 | 15 | 75 | 24.1 ± 0.3 | 71 ± 13 |
| UAS-perS/+;Pdf-GSG/+ (RU-) | 15 | 15 | 100 | 23.3 ± 0.2 | 121 ± 12 |
| UAS-perS/+;Pdf-GSG/+ (RU+) | 16 | 10 | 62.5 | 20.5 ± 1.4 | 73 ± 15 |
| UAS-perS/UAS-Kir;Pdf-GSG/+ (RU−) | 14 | 13 | 92.9 | 23 ± 0.3 | 94 ± 13 |
| UAS-perS/UAS-Kir;Pdf-GSG/+ (RU+) | 16 | 3 | 18.7 | 22.8 ± 1.2 | 24 ± 6 |
| UAS-perS/+;Pdf-GSG/UAS-PDF RNAi (RU−) | 15 | 14 | 93.3 | 23.3 ± 0.2 | 88 ± 15 |
| UAS-perS/+;Pdf-GSG/UAS-PDF RNAi (RU+) | 16 | 2 | 12.5 | 22.3 ± 0.8 | 19 ± 3 |
| UAS-perS/+;Pdf-GSG/+ (RU+ to RU−) | 60 | 54 | 90 | 23.2 ± 0.1 | 94 ± 13 |
| UAS-perS/UAS-Kir;Pdf-GSG/+ (RU+ to RU−) | 64 | 41 | 64 | 23.6 ± 0.6 | 56 ± 11 |
| UAS-perS/+;Pdf-GSG/UAS-PDF RNAi (RU+ to RU−) | 62 | 35 | 56.5 | 23.8 ± 1.2 | 48 ± 7 |
| UAS-dTrpA1/+ (21°C) | 16 | 16 | 100 | 24.4 ± 0.4 | 117 ± 8 |
| DvPdf-GAL4/UAS-dTrpA1 (21°C) | 32 | 31 | 96.8 | 24.2 ± 0.3 | 93 ± 6 |
| DvPdf-GAL4,Pdf-GAL80/UAS-dTrpA1 (21°C) | 16 | 12 | 75 | 23.6 ± 0.5 | 72 ± 8 |
| Pdf-GAL4/UAS-dTrpA1 (21°C) | 32 | 31 | 96.9 | 24.2 ± 0.3 | 127 ± 15 |
| UAS-dTrpA1/+;TH-GAL4/+ (21°C) | 16 | 16 | 100 | 23.6 ± 0.4 | 166 ± 19 |
| perS;UAS-dTrpA1/+ (21°C) | 16 | 16 | 100 | 20.3 ± 0.2 | 131 ± 12 |
| perS;Pdf-GAL4/UAS-dTrpA1 (21°C) | 32 | 31 | 96.9 | 19.7 ± 0.6 | 102 ± 10 |
| perS;DvPdf-GAL4/UAS-dTrpA1 (21°C) | 32 | 31 | 96.9 | 20.1 ± 0.2 | 97 ± 13 |
| perS;DvPdf-GAL4,Pdf-GAL80/UAS-dTrpA1 (21°C) | 16 | 14 | 87.5 | 21.1 ± 0.7 | 125 ± 19 |
| pdfr−;UAS-PDFR | 16 | 6 | 37.5 | 21.9 ± 1.2 | 34 ± 7 |
| pdfr−;DvPdf-GAL4,Pdf-GAL80/UAS-PDFR | 18 | 13 | 72.2 | 24.8 ± 0.4 | 77 ± 10 |
| pdfr−;DvPdf-GAL4/UAS-PDFR;Cry-GAL80/+ | 16 | 7 | 43.8 | 22.1 ± 0.7 | 37 ± 8 |
| pdfr−;DvPdf-GAL4,UAS-dTrpA1/UAS-PDFR (21°C) | 30 | 24 | 80 | 23.7 ± 0.9 | 69 ± 9 |
| pdfr−;DvPdf-GAL4,UAS-dTrpA1/UAS-PDFR;Pdf-GAL80/+ (21°C) | 24 | 18 | 75 | 23.8 ± 0.7 | 65 ± 13 |
| pdfr−;DvPdf-GAL4,UAS-dTrpA1/UAS-PDFR;Cry-GAL80/+ (21°C) | 24 | 11 | 45.8 | 21.5 ± 1 | 33 ± 5 |
| pdfr−;DvPdf-GAL4,UAS-dTrpA1/+ (21°C) | 32 | 13 | 40.6 | 21.2 ± 1.1 | 29 ± 8 |
| DvPdf-GAL4,UAS-dTrpA1/+;cry01 (21°C) | 32 | 25 | 78.1 | 23.2 ± 0.7 | 64 ± 14 |
| DvPdf-GAL4,UAS-dTrpA1/+ (21°C) | 30 | 24 | 80 | 24.1 ± 0.3 | 71 ± 13 |
| DvPdf-GAL4,UAS-dTrpA1/+;UAS-Cul-3 RNAi #1/+ (21°C) | 31 | 25 | 80.6 | 24.6 ± 0.3 | 85 ± 8 |
| DvPdf-GAL4,UAS-dTrpA1/UAS-Cul-3 RNAi #2 (21°C) | 32 | 27 | 84.4 | 24.2 ± 0.4 | 73 ± 9 |
| DvPdf-GAL4,UAS-dTrpA1/+;UAS-Cul-3 RNAi #3/+ (21°C) | 32 | 25 | 78.1 | 24.1 ± 0.3 | 82 ± 19 |
| UAS-Cul-3 RNAi #1/+ (21°C) | 16 | 16 | 100 | 24.1 ± 0.2 | 131 ± 11 |
| UAS-Cul-3 RNAi #2/+ (21°C) | 16 | 15 | 93.8 | 23.5 ± 0.2 | 103 ± 21 |
| UAS-Cul-3 RNAi #3/+ (21°C) | 16 | 15 | 93.8 | 23.7 ± 0.1 | 95 ± 13 |
Download links
A two-part list of links to download the article, or parts of the article, in various formats.
Downloads (link to download the article as PDF)
Open citations (links to open the citations from this article in various online reference manager services)
Cite this article (links to download the citations from this article in formats compatible with various reference manager tools)
PDF neuron firing phase-shifts key circadian activity neurons in Drosophila
eLife 3:e02780.
https://doi.org/10.7554/eLife.02780


