Inferring eye position from populations of lateral intraparietal neurons
- California Institute of Technology, United States
Figures
Figure 1
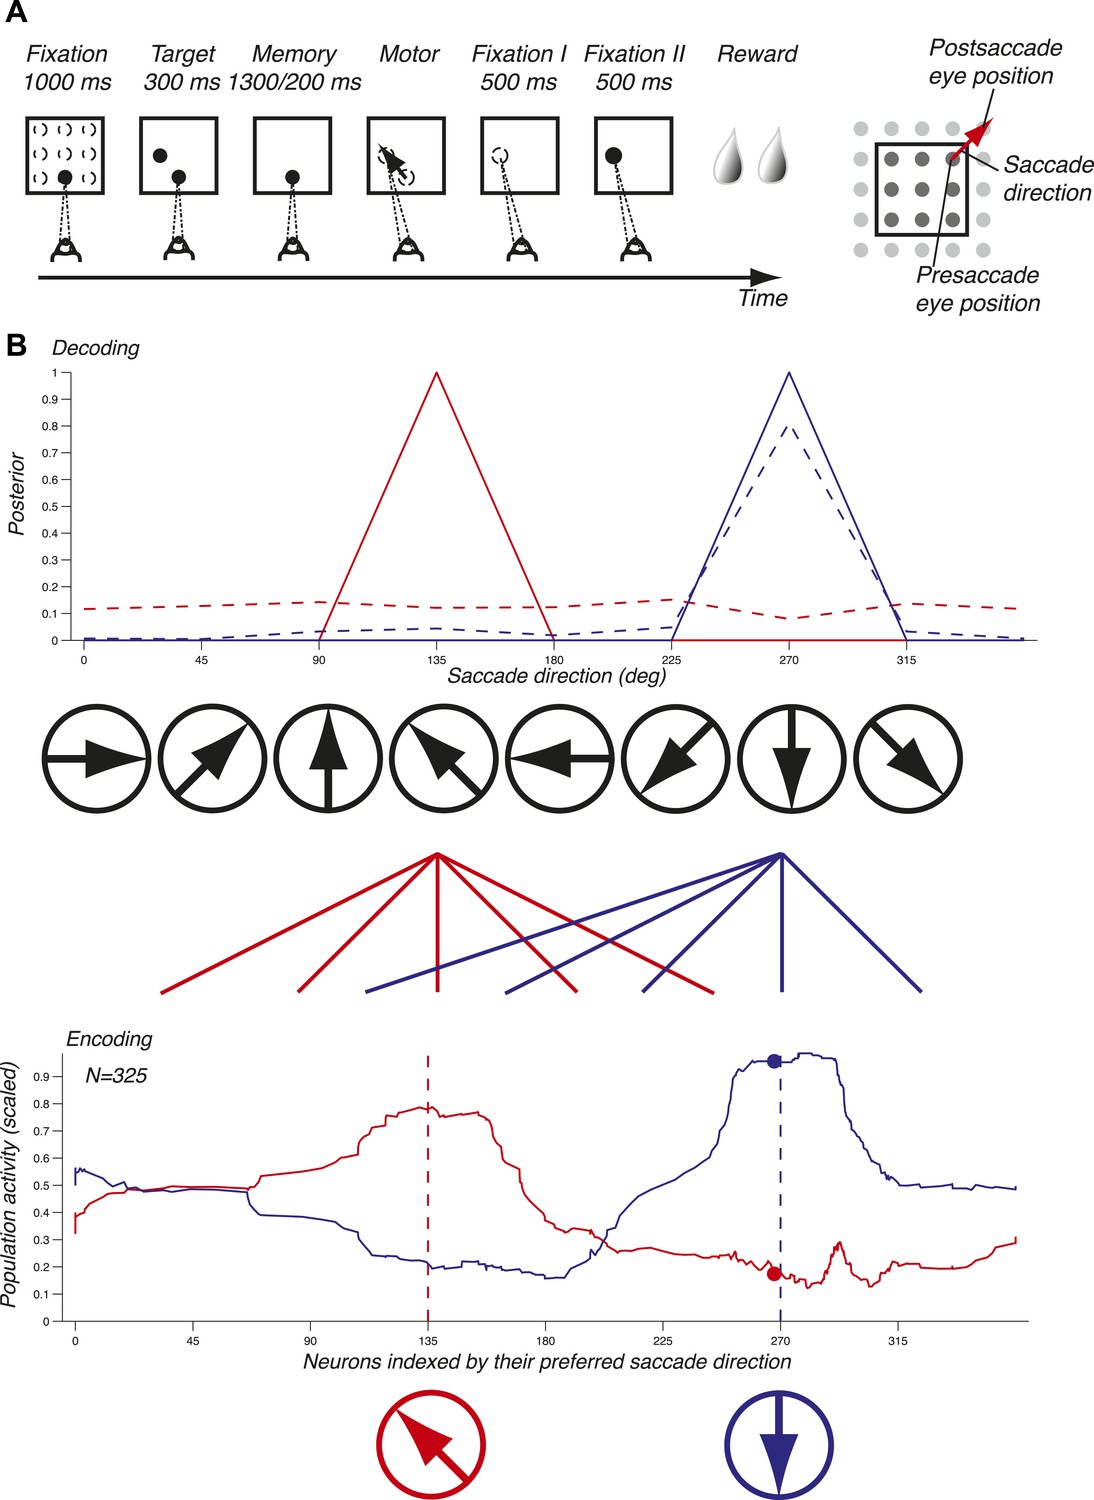
Task and decoding mechanisms. (A) Scheme of the task and the three oculomotor behaviors. (B) Predicting saccade direction from the population activity in LIP. The population activity of 325 neurons (red and blue curves, bottom panel) during the memory epoch was computed at the preferred eye position (derived from the fixation epoch) for two planned saccade directions (180 and 270 deg, dotted lines, bottom panel), and yielded the prediction (red and blue curves, top panel). The responses of a single neuron (red and blue dots, bottom panel) yielded the dotted probability distributions (top panel).
Figure 2
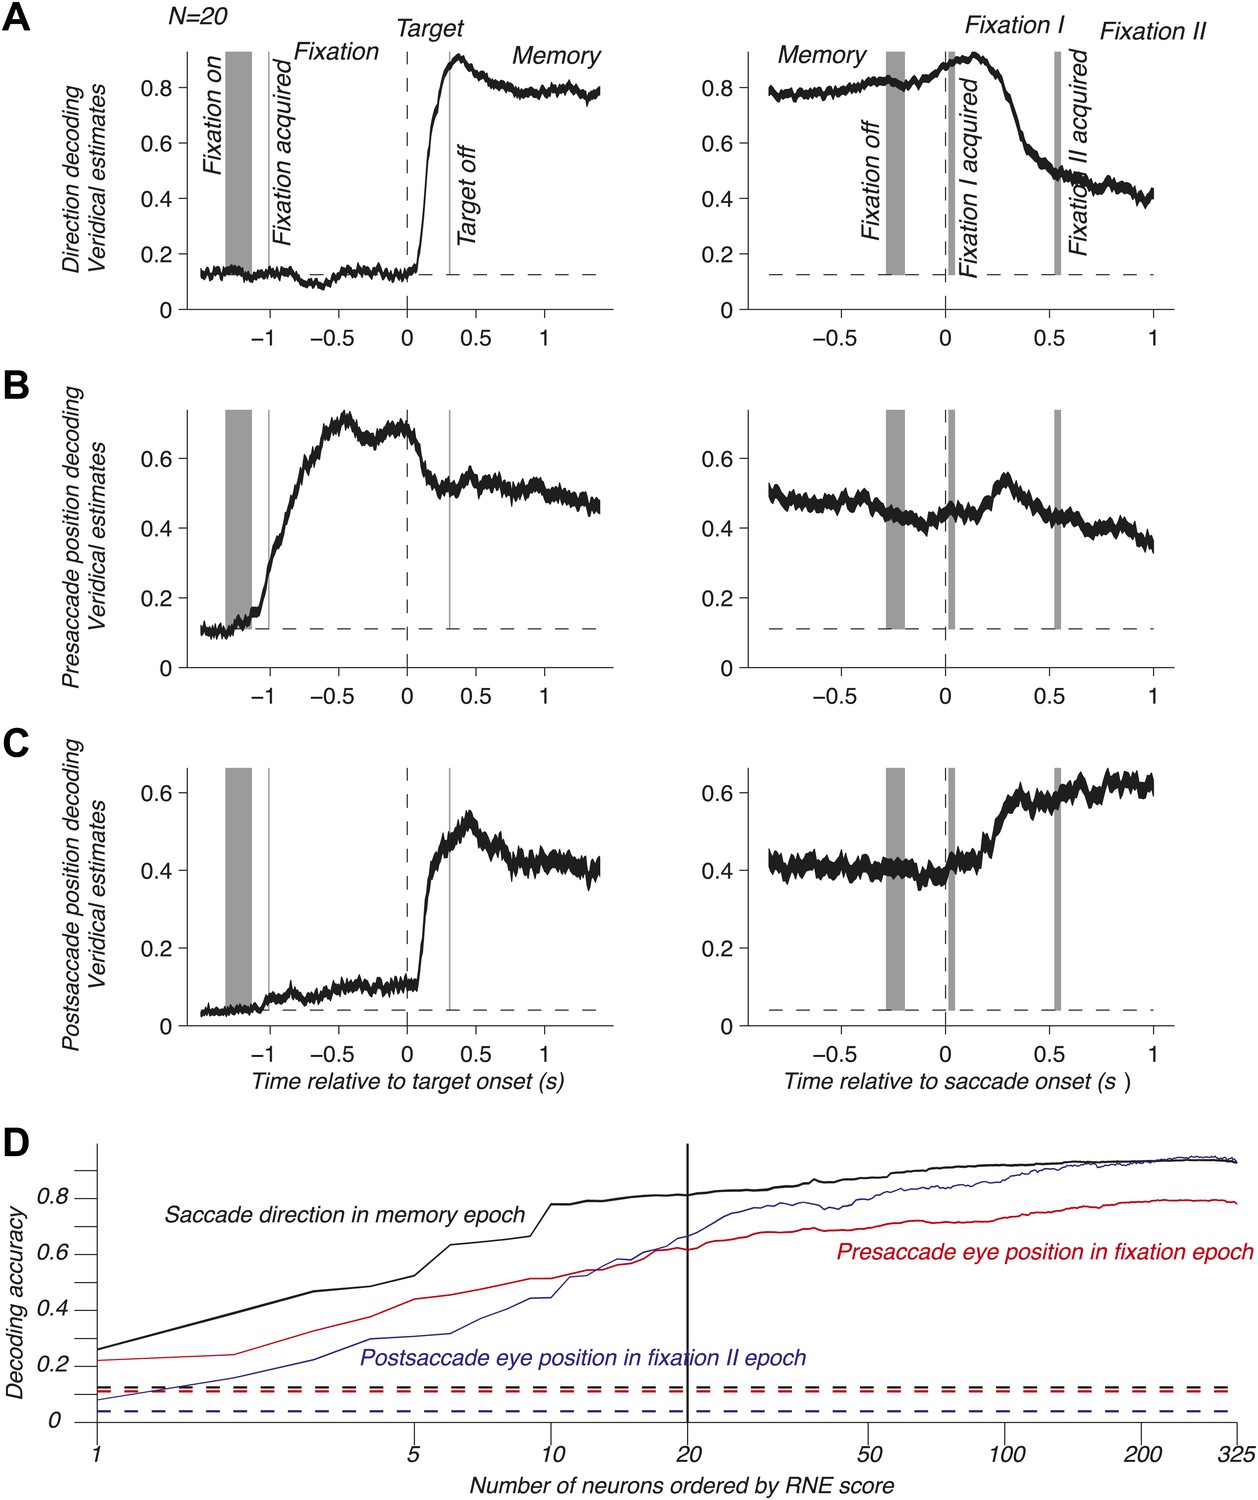
NPC across the task for one population and as function of the number of neurons. (A–C) Time course of the NPC for a population of 20 independently recorded neurons for the three oculomotor behaviors. The dark curves are the decoding accuracies (mean ± SEM across trials) with spike times aligned to the target onset (left column) and saccade onset (right column). The horizontal dotted lines represent chance levels (1/8, 1/9 and 1/25 respectively). The shaded gray areas (mean ± SD) represent the different task events: fixation on, fixation acquired, target off (left column) and fixation off, fixation I acquired, fixation II acquired (right column). (D) NPC for each of the three oculomotor behaviors during different task epochs as function of the number of neurons ordered by increasing importance for the NPC (mean ± SEM).
Figure 3
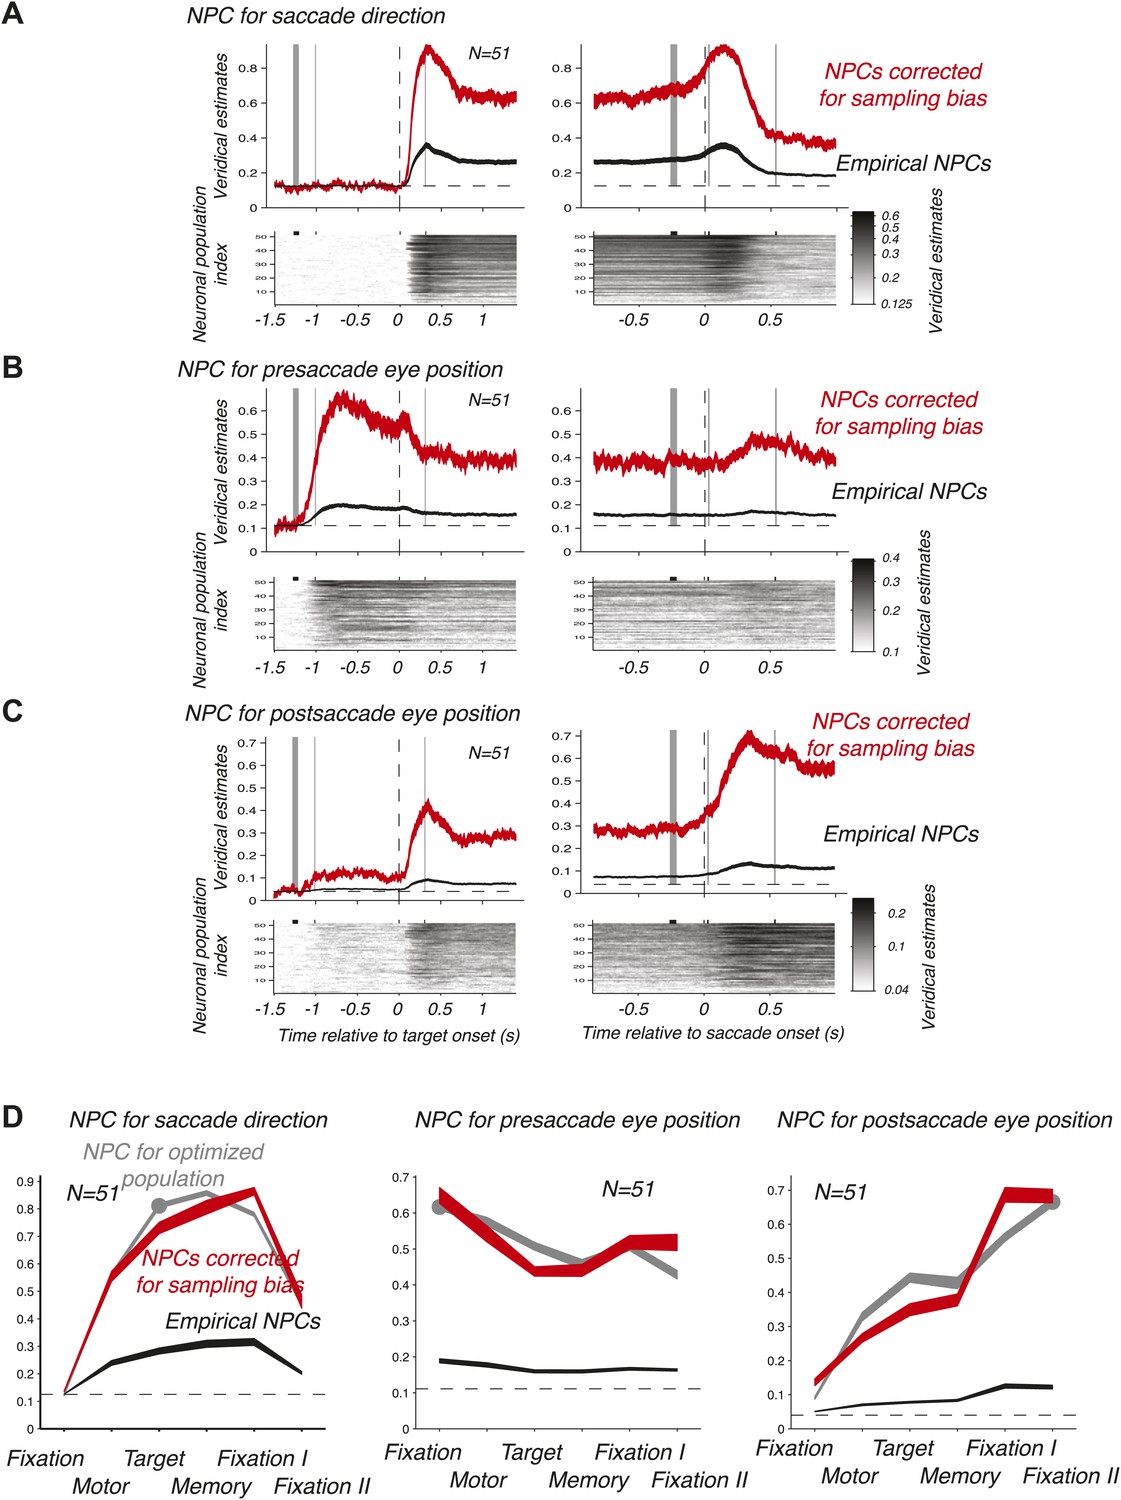
Time course of the NPC. (A–C) Time course of the NPC for 51 empirical samples of simultaneously recorded neurons for the three oculomotor behaviors. The images (bottom panels) represent the NPC with spike times aligned to the target onset (left column) and saccade onset (right column). Each horizontal slice represents the NPC of one population. The dark curves in the upper panels are the time courses of the NPCs averaged across populations (mean ± SD), and the red curves the sampling-corrected NPCs using the same conventions as in Figure 2.(D) Accuracy of the NPC for each behavior in each task epoch. The black curves are the accuracies averaged across empirical populations of simultaneously recorded neurons (mean ± SEM), and the red curves are the sampling corrected empirical populations (mean ± SEM), and the gray curves are the accuracies of the population of 20 ‘optimized’ neurons (mean ± SEM, the dots indicating the epochs used in Figure 2D).
Figure 4
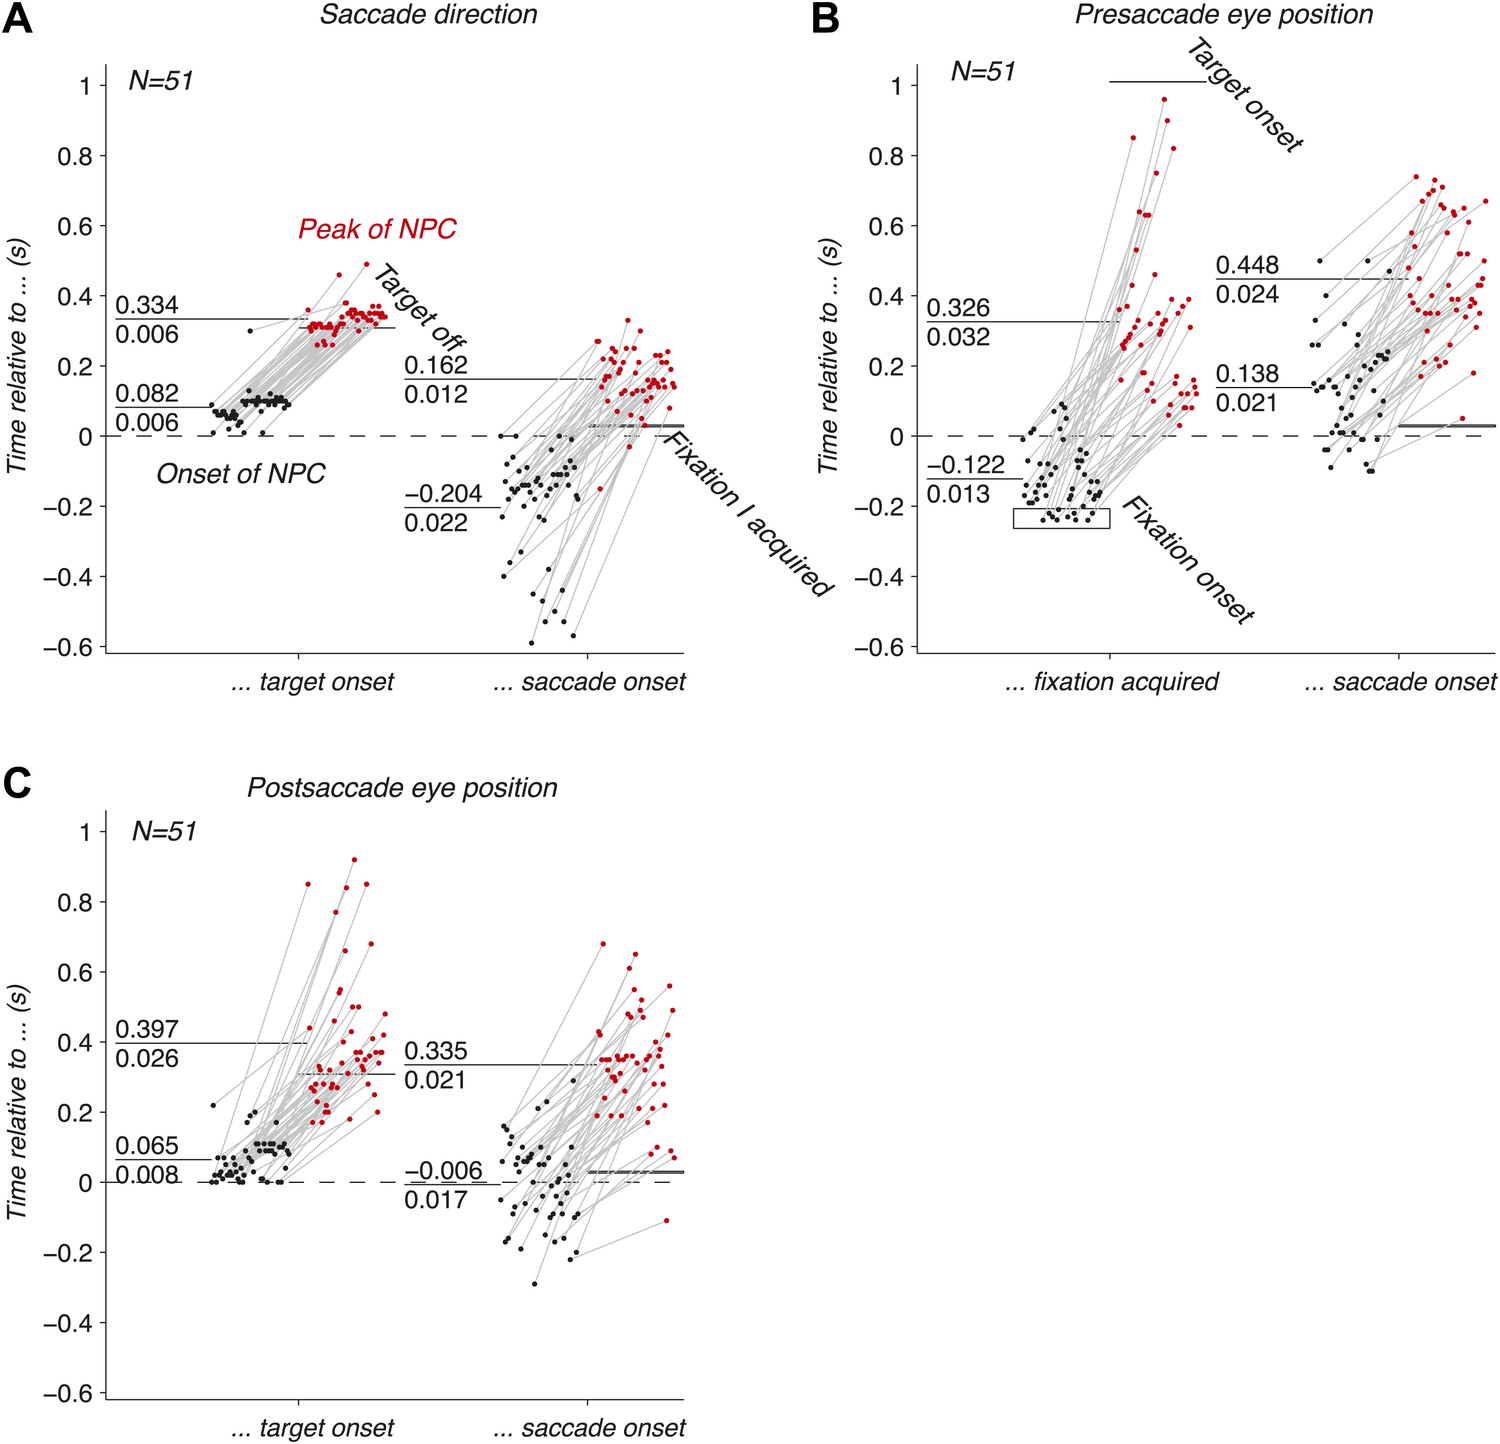
Dynamics of the NPC. (A–C) Timing of the onsets (black dots) and peaks (red dots) of the NPC across empirical populations of simultaneously recorded neurons for the three oculomotor behaviors (times spread out along abscissa for visualization).
Download links
A two-part list of links to download the article, or parts of the article, in various formats.
Downloads (link to download the article as PDF)
Open citations (links to open the citations from this article in various online reference manager services)
Cite this article (links to download the citations from this article in formats compatible with various reference manager tools)
Inferring eye position from populations of lateral intraparietal neurons
eLife 3:e02813.
https://doi.org/10.7554/eLife.02813


