A suppression hierarchy among competing motor programs drives sequential grooming in Drosophila
- Janelia Farm Research Campus, Howard Hughes Medical Institute, United States
Figures
Figure 1 with 6 supplements
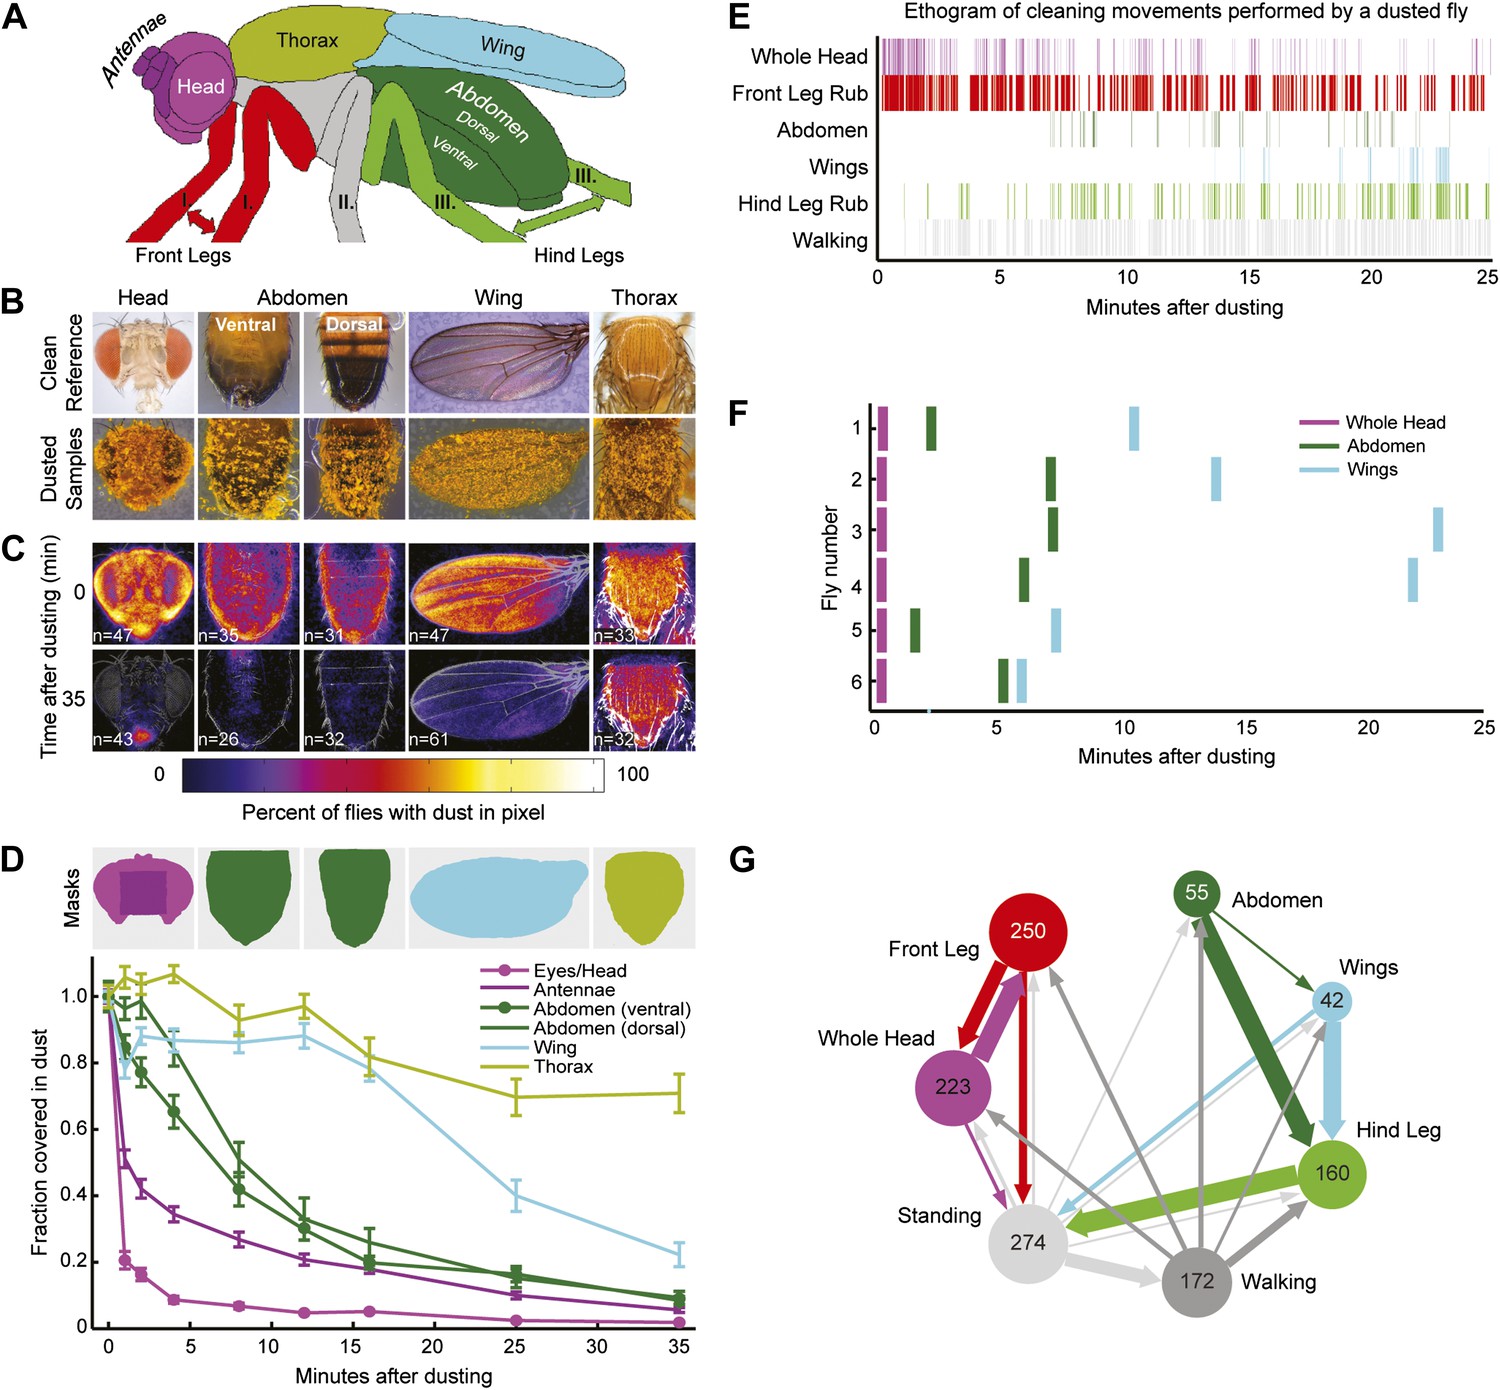
Wild-type flies clean different areas of the body sequentially.
(A) Diagram of body parts cleaned by front leg (red hues) or hind leg (green hues) movements. (B–D) Dust distribution measurements of the bodies of flies that were coated in yellow dust and allowed to groom. (B) Body parts were imaged (dusted samples) and aligned to clean reference images in order to determine the fraction of dust left on each part. (C) Average spatial distribution of dust 0 min after dusting and after flies groomed for 35 min. The number of flies contributing to each heat map is displayed. (D) Dust removal across a 35-min time course. Masks define regions for counting the yellow pixels (dust) remaining on each sample. Each time point (normalized to 0-min samples) is plotted as the fraction of dust left in the defined regions and shown as the mean ± SEM; n ≥ 26 flies. Figure panel is compiled from data shown in Figure 1—figure supplement 3. (E) Representative ethogram of the five most common cleaning movements performed by an individual fly after dusting (manually scored from video recordings). All head cleaning movements are binned because eye and antennal cleaning are not easily distinguishable in the dusted state using our analysis methods (labeled whole head). (F) Latency to the first bout of head, abdomen, or wing cleaning after dusting for each of six flies annotated. (G) Transitions among different body cleaning movements, standing, and walking (across a 25-min time course, n = 6 flies). The radii of the nodes are proportional to the log of the average fraction of total cleaning bouts for each movement. Average total bouts for each movement are shown. Arrow widths represent the transition probabilities between the movements (displaying transition probabilities ≥0.05).
Figure 1—figure supplement 1
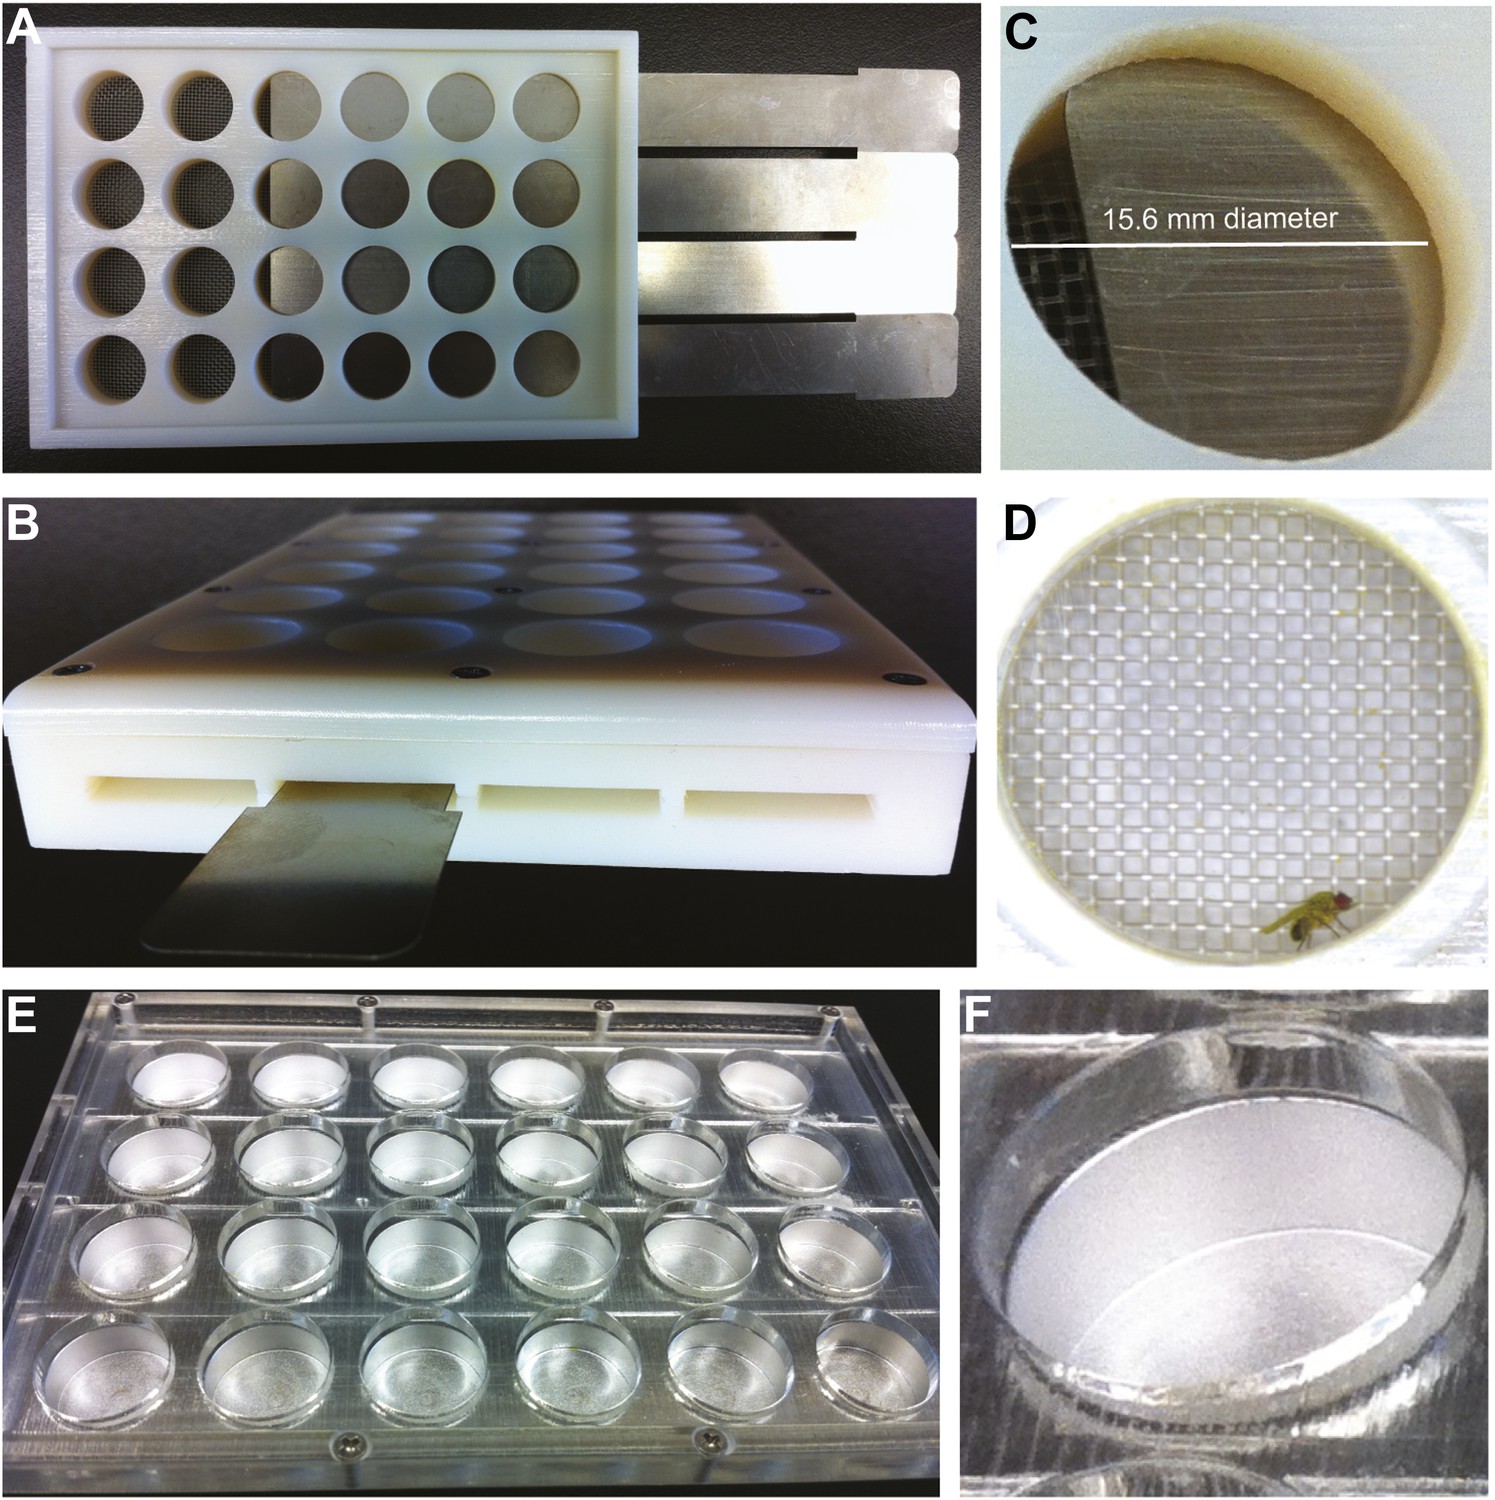
Grooming apparatus for dusting, recording, and observing flies.
(A) Mesh-covered chambers allow free dust to exit while preventing flies from escaping. Connector side shown with some wells closed using slider gates. (B) Sliders gate the chambers for transferring flies and preventing escape. (C) View of a single grooming chamber with the gate partially open. (D) The connector side fits standard multiwell plates for fly dusting (not shown), clear viewing plugs for recording videos (D), and an adaptor for transferring flies between chambers (not shown). (D) Image from a video recording of a dusted fly used to score cleaning movements. (E and F) Shows the aluminum version of the apparatus for rapid cooling of flies. This version was used for the experiment shown in Figure 3C. All displayed grooming chambers are 15.6 mm in diameter.
Figure 1—figure supplement 2
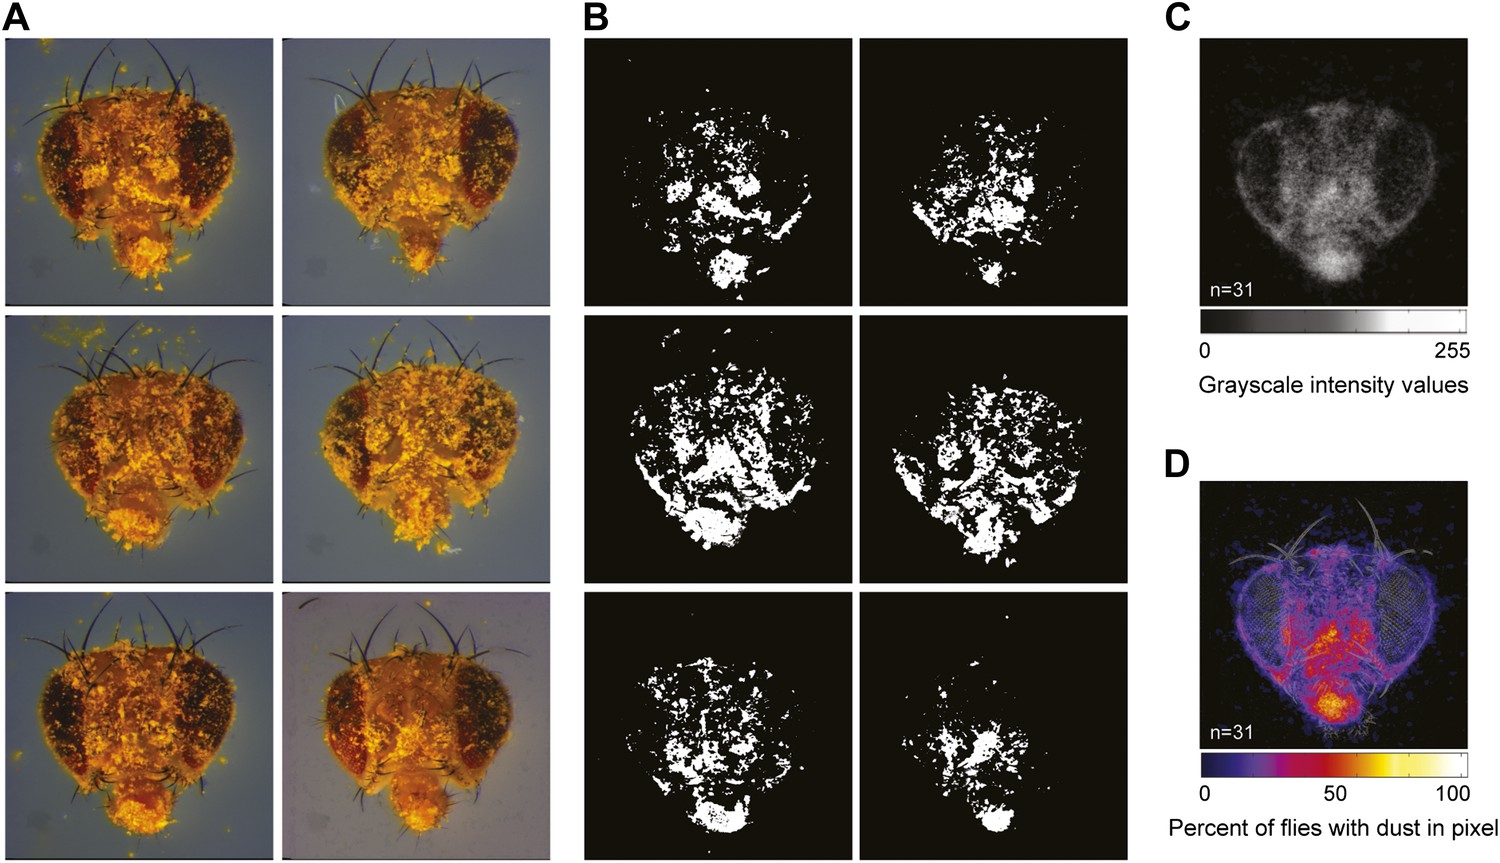
Strategies for quantifying dust on the body surface.
(A) Examples of dusted flies that were allowed to groom for 1 min before their heads were dissected and imaged (showing 6 of 31 total images for this time point). (B) Each image was manually warped to a standard head (shown in Figure 1B), the dust-positive yellow pixels were isolated and converted to grayscale, and all dust pixels were set to 255 intensity values (8 bit). The numbers of white pixels in each image were counted in different regions specified by masks shown in Figure 1D. (C) Average projections were generated from the stack of 31 images. (D) A grayscale color map was produced using the average projection intensity values.
Figure 1—figure supplement 3

Wild-type flies remove dust from body parts at different rates.
Data shown here is compiled and plotted in Figure 1D. (A) Average dust patterns of the body parts of Canton S flies at different time points after dusting. Masks used for defining regions of the body parts for counting dust pixels are shown on top. (B) Distribution plots of quantified dust pattern data. Each point on the plots represents the number of yellow pixels from the body part sample images. The mean is shown as a red line, 1.96 SEN (95% confidence interval) is in red, 1 SD is blue. (C) Curve fit summary of each body part. Curves were fit to either sigmoidal or exponential equations. Values represent the time it took for flies to clean fifty percent of each body part.
Figure 1—figure supplement 4
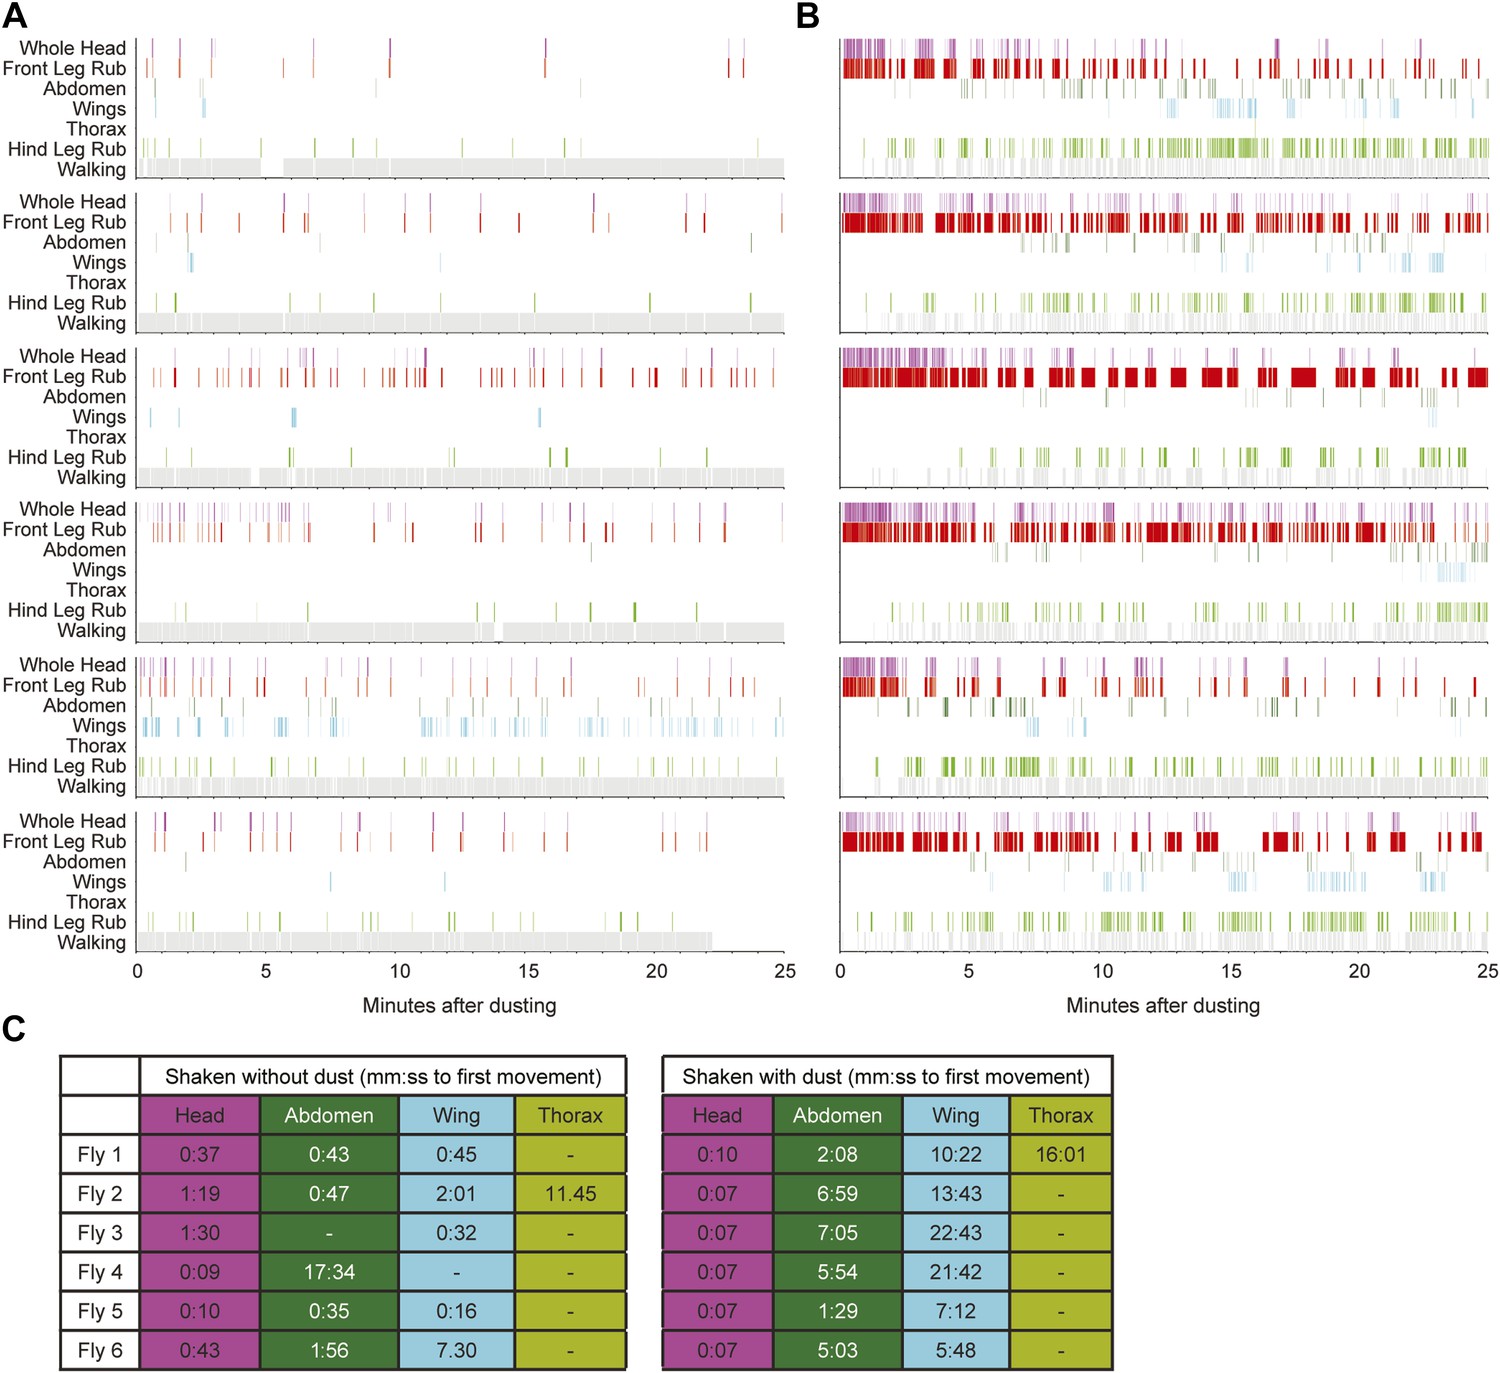
Sequential cleaning of the head, abdomen, and wings requires dust.
(A and B) Cleaning movement ethograms of individual Canton S flies in response to being shaken without (A) and with (B) dust (n = 6 flies for each condition). (C) Table of the time to the first appearance of different cleaning movements for both undusted and dusted flies. Head cleaning movements are all binned because of the difficulty distinguishing between eye and antennal cleaning when flies were dusted (labeled whole head).
Figure 1—figure supplement 5
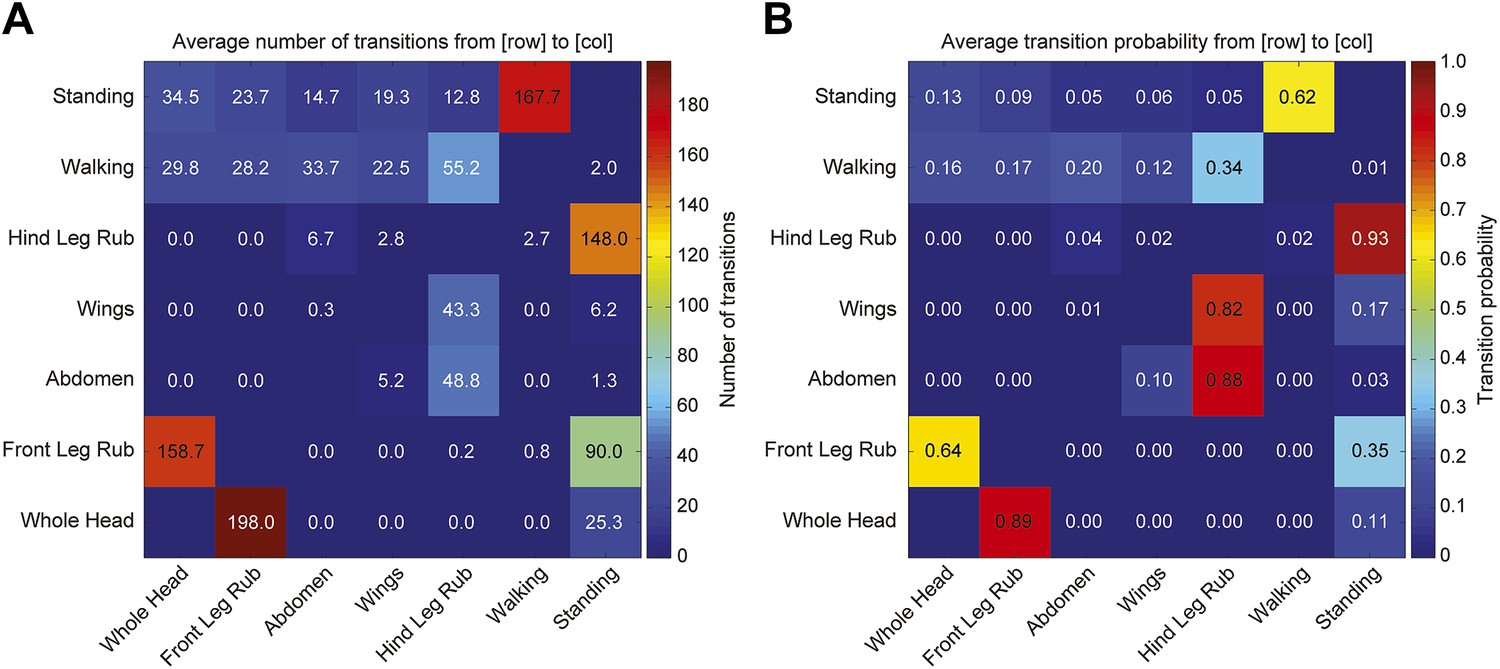
Transitions among cleaning movements of dusted wild-type flies.
Canton S flies were shaken with dust. (A and B) The number of first order transitions between movements (A) and the transition probabilities are shown (B). Data were collected from 25 min of manually scored video (n = 6 flies for each treatment). Movements were binned into whole head, abdomen, wing, and leg rubbing.
Figure 1—figure supplement 6
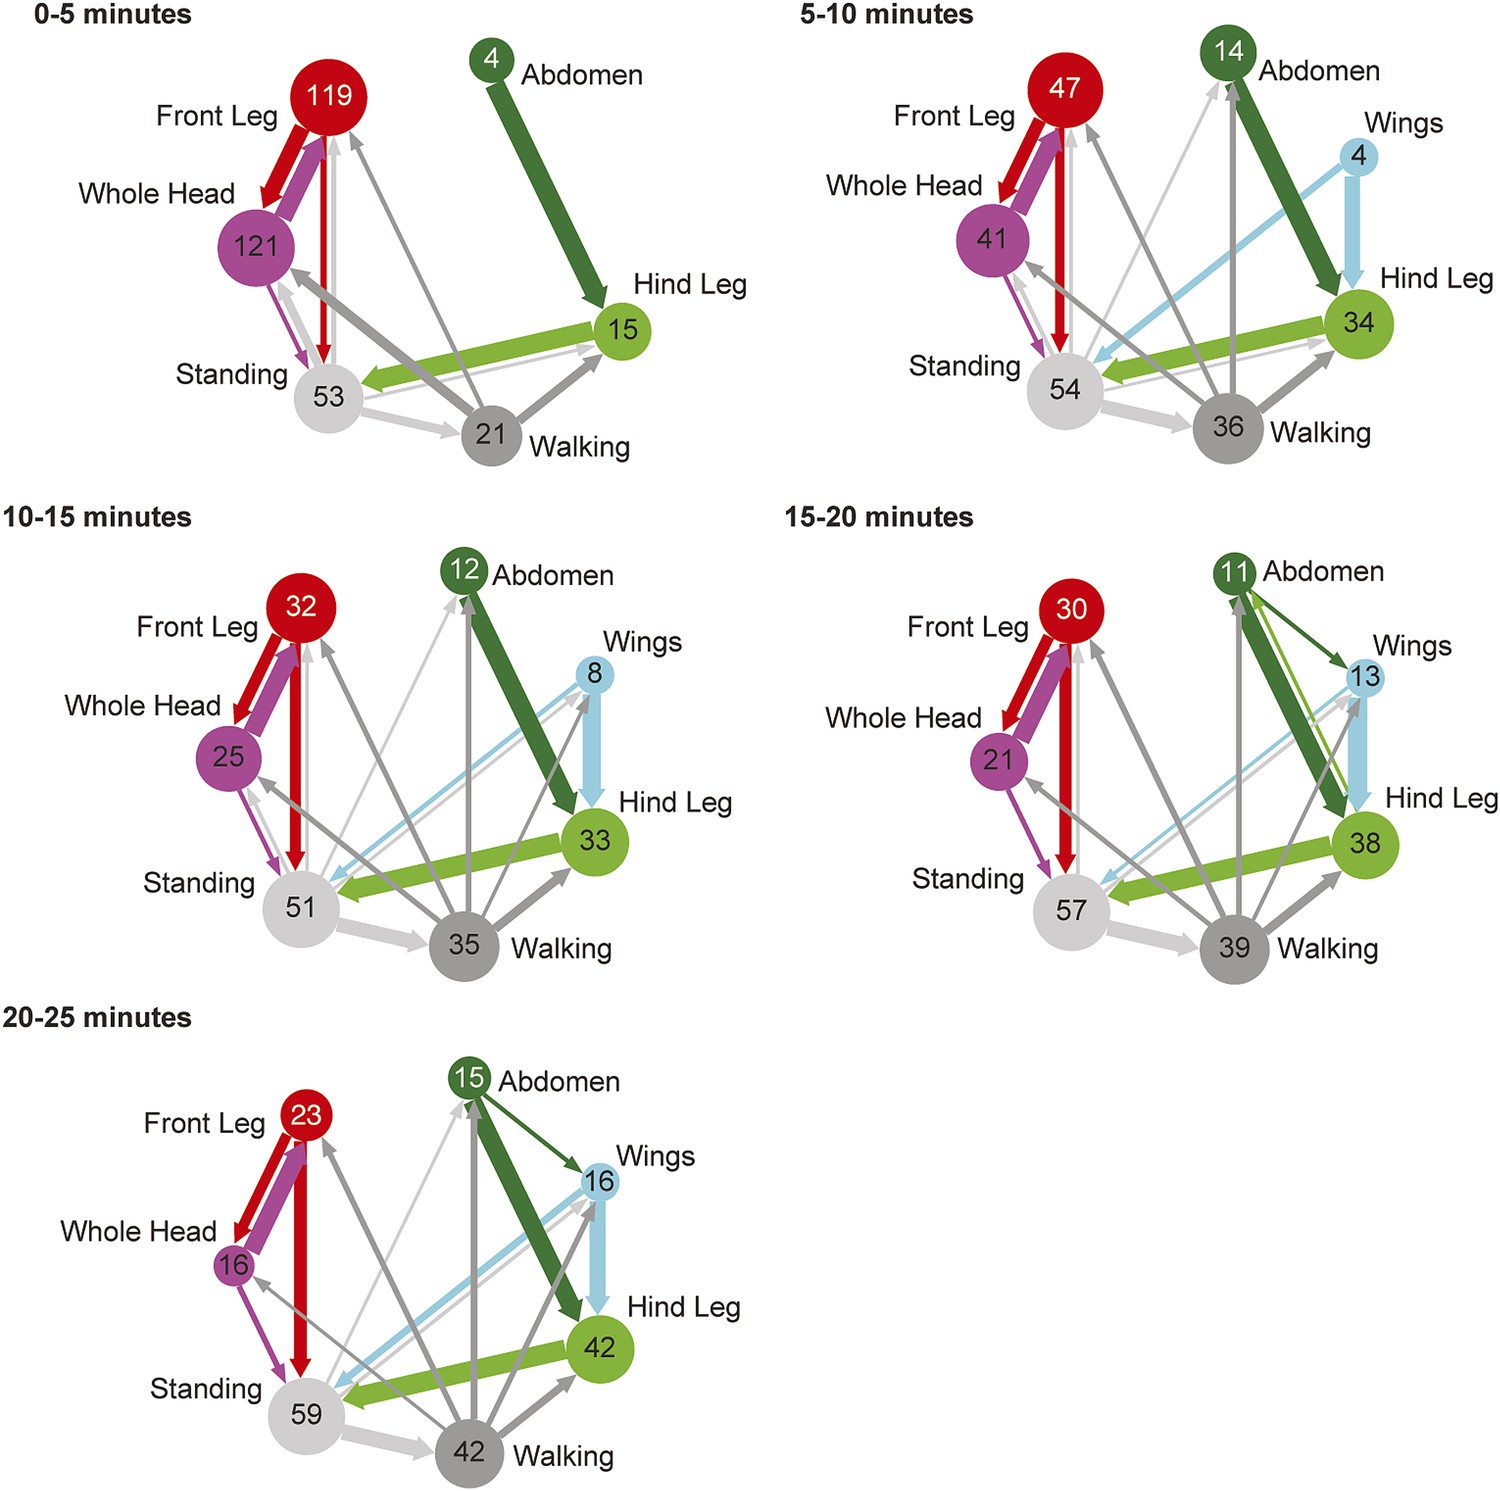
Transitions among cleaning movements performed by dusted wild-type flies over a time course.
Diagrams are generated from manually scored video in 5-min bins, over a 25-min time course (n = 6 flies). The radii of the nodes are proportional to the log of the average fraction of total cleaning bouts for each movement per time bin. Average total bouts for each movement are shown. Arrow widths represent the transition probabilities between the movements (displaying transition probabilities ≥0.05).
Figure 2 with 2 supplements
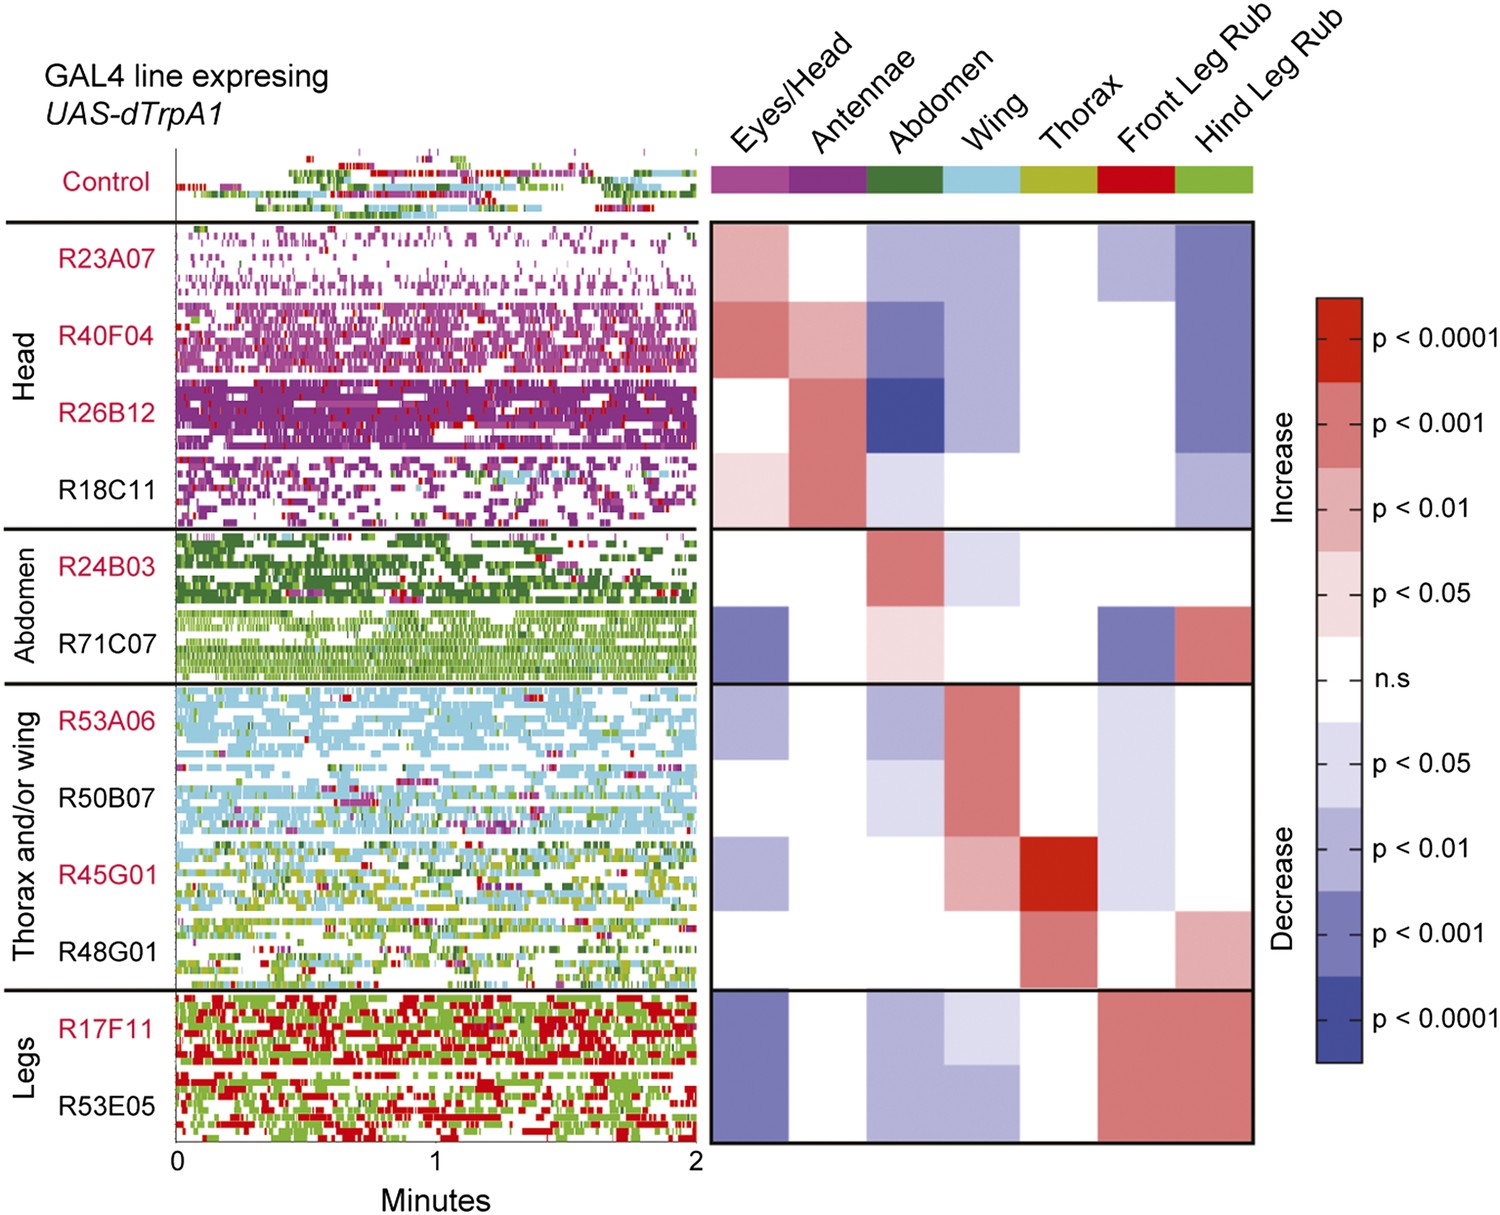
Activation of UAS-dTrpA1 in different GAL4 lines is sufficient to activate discrete cleaning movements in the absence of dust.
Cleaning movement activation phenotypes driven by 12 GAL4 lines expressing UAS-dTrpA1. Flies (including controls) were warmed to 30°C to activate the targeted neurons while their cleaning movements were recorded and manually scored (n = 10 flies/GAL4 line; 130 flies total). Ethograms of the scored behaviors are displayed by compressing all mutually exclusive events to a single line per fly. Colors below the movement names correspond to those on the ethograms. White space in each ethogram represents the time flies spent walking or standing in place. The GAL4 lines are grouped into four cleaning movement categories: head, abdomen, thorax and/or wings, and legs. The grid displays increases and decreases from control flies in the fraction of time each line spent performing different cleaning movements. Grid heat map represents the p-values for the comparisons of the different GAL4 lines and control flies (Kruskal–Wallis followed by Mann–Whitney U pairwise tests and Bonferroni correction). Note: R71C07 displays significant increases in both abdominal cleaning and leg rubbing. Although this line is shown in the abdominal cleaning category, it could also be included with leg rubbing. Lines labeled in red are used in experiments shown in Figure 3 and Figure 5. See Video 2, Video 3, Video 4, Video 5, Video 6, Video 7, Video 8, and Video 9 for representative videos and more description of the activation phenotypes of these lines.
Figure 2—figure supplement 1
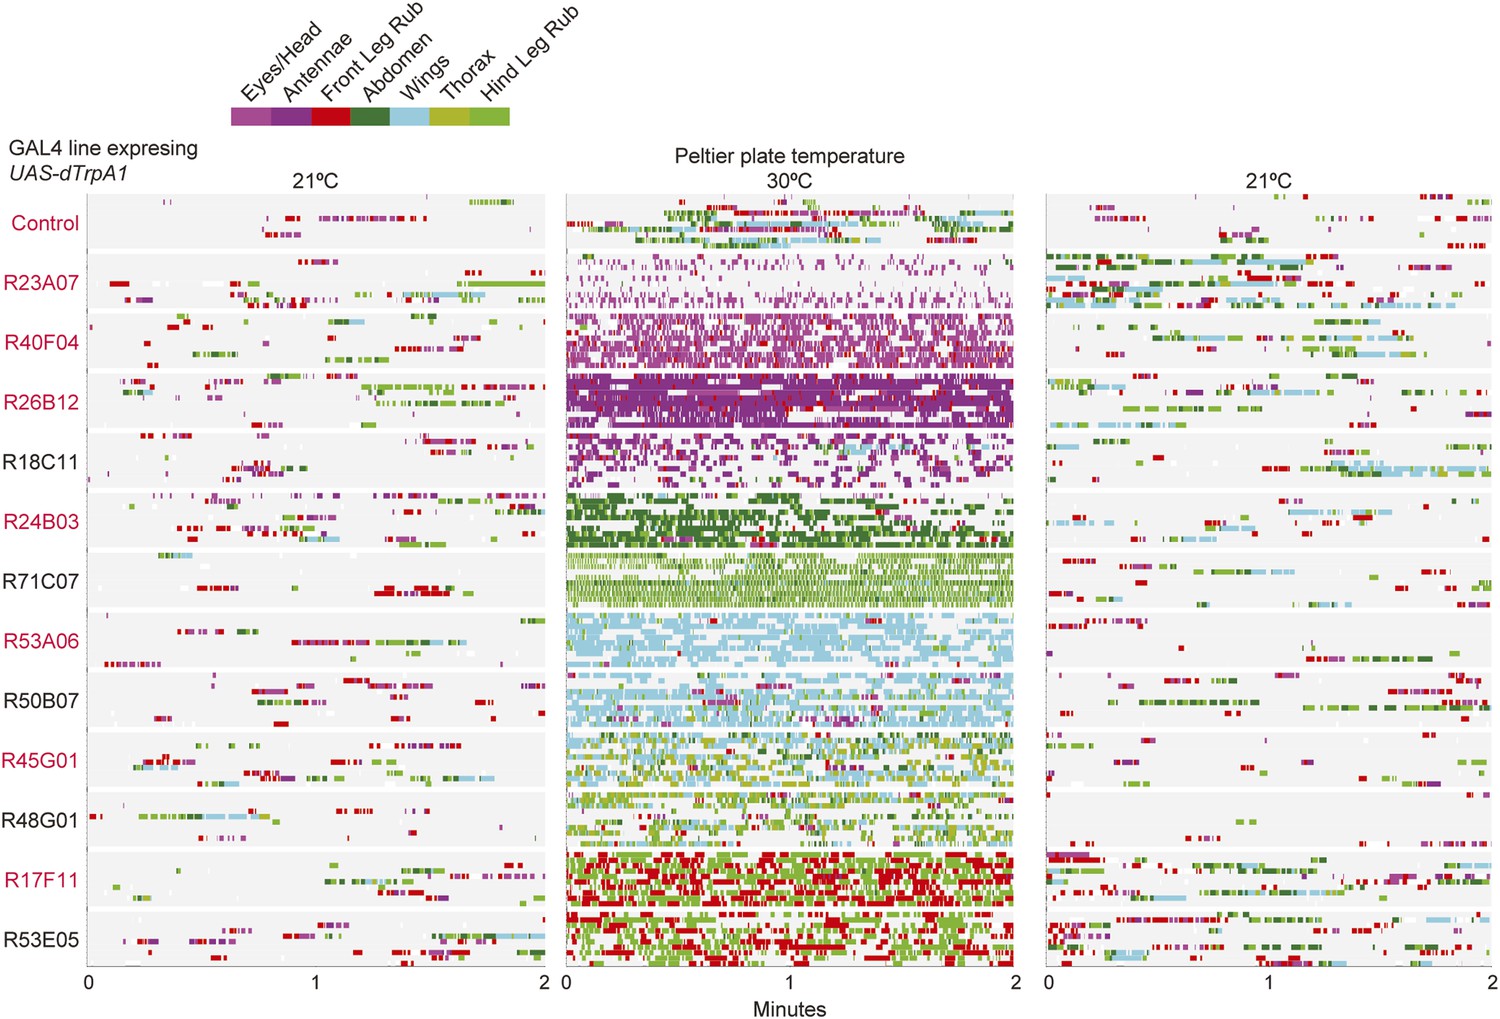
GAL4 lines expressing UAS-dTrpA1 have different activated cleaning phenotypes at high temperature.
GAL4 lines expressing UAS-dTrpA1 were recorded when the heated plate reached 21°C, 30°C, and then back to 21°C for 2 min. Their cleaning movements were manually scored (10 flies/GAL4 line; 130 flies total). Ethograms of the scored behaviors are displayed as described in Figure 2.
Figure 2—figure supplement 2

Anatomy of GAL4 lines used to activate distinct cleaning movements.
Expression patterns of the brains and ventral nerve cords of GAL4 lines expressing a green fluorescent protein reporter (20xUAS-mCD8::GFP (JFRC7)). Maximum projections of confocal images are shown. The neuropile is visualized using an anti-bruchpilot antibody (magenta). White scale bars, 100 μm. UAS-dTrpA1-activation phenotypes are listed with the name of each GAL4 line.
Figure 3 with 3 supplements
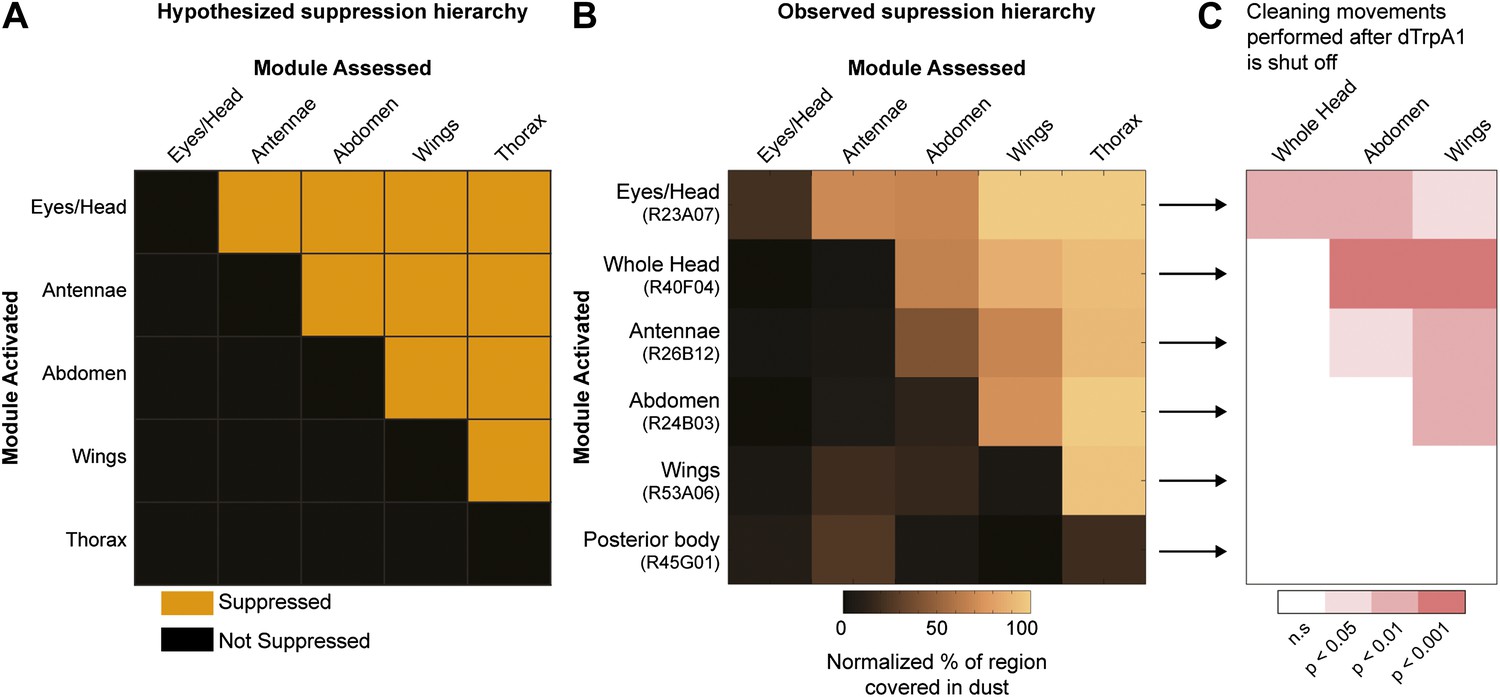
Hierarchical suppression and dust stimulus drive cleaning movement selection.
Cleaning of specific body parts was artificially activated while flies were dusted to stimulate competition between their cleaning movements. Flies were pre-warmed at 30°C such that the dTrpA1-induced cleaning module was active at the time of dusting. After grooming for 25 min, flies were anesthetized and their dust patterns were measured. (A) Grid showing the expected suppression pattern if the hierarchical suppression hypothesis is true. Modules are arranged on the grid in the order that they occur in the normal grooming sequence. (B) The observed suppression hierarchy. For each line, the normalized fraction of dust remaining on different regions of the flies is mapped onto the corresponding grid locations (n ≥ 26 per body part, ‘Materials and methods’). The module activated by each GAL4 line is listed above the line name. Data used to generate the grid is shown in Figure 3—figure supplement 1. (C) Cleaning movements performed when a GAL4/dTrpA1-activated module is shut off. Arrows from B to each row in C show the GAL4 line and corresponding dust distribution that was tested. The grid displays increases from control flies in the frequencies of different cleaning movements performed in the first 3 minutes after shutting off dTrpA1 (n = 10 flies per line). Grid heat map represents the p-values for the comparisons of the different GAL4 lines and control flies (Kruskal–Wallis followed by Mann–Whitney U pairwise tests and Bonferroni correction). Movements were manually scored. All head cleaning movements are binned and displayed as whole head, because eye and antennal cleaning are not easily distinguishable in the dusted state. Control and experimental flies performed few thoracic cleaning bouts and are therefore not shown.
Figure 3—figure supplement 1
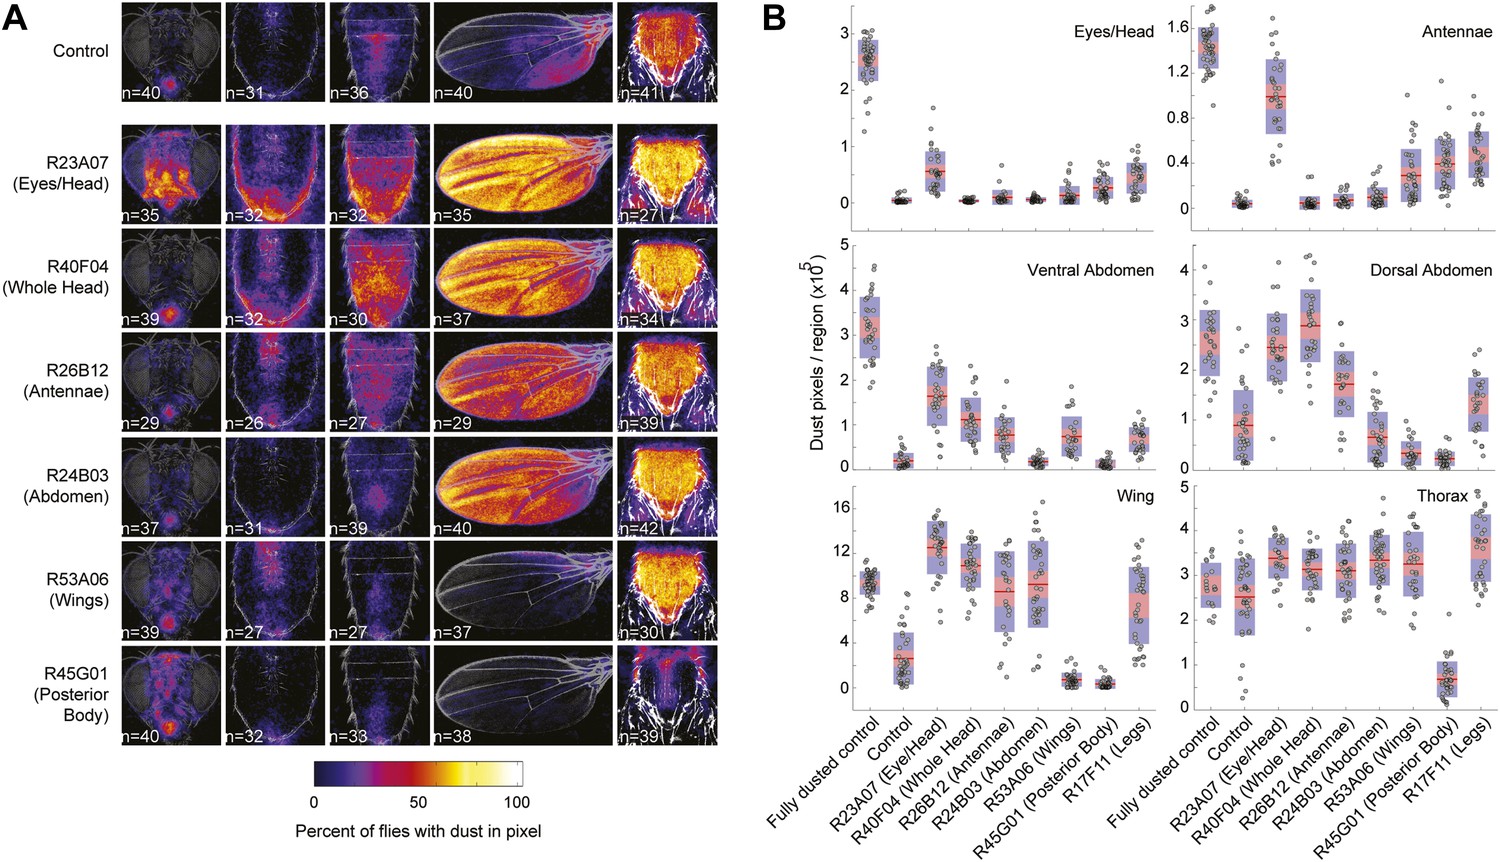
Dust patterns resulting from coating flies in dust and artificially activating specific cleaning movements.
(A) Dust patterns of UAS-dTrpA1-activated cleaning lines 25 min after dusting (described in Figure 3). Average dust patterns are displayed as previously described in Figure 1B. (B) Distribution plots of quantified dust pattern data. Each point on the plots represents the number of yellow pixels from the body part sample images. The mean is shown as a red line, 1.96 SEM (95% confidence interval) is in red, 1 SD is blue. UAS-dTrpA1-activation phenotypes are listed with the name of each GAL4 line. Control flies show remaining dust levels when no module activated. Data shown here is compiled and plotted in Figure 3B.
Figure 3—figure supplement 2
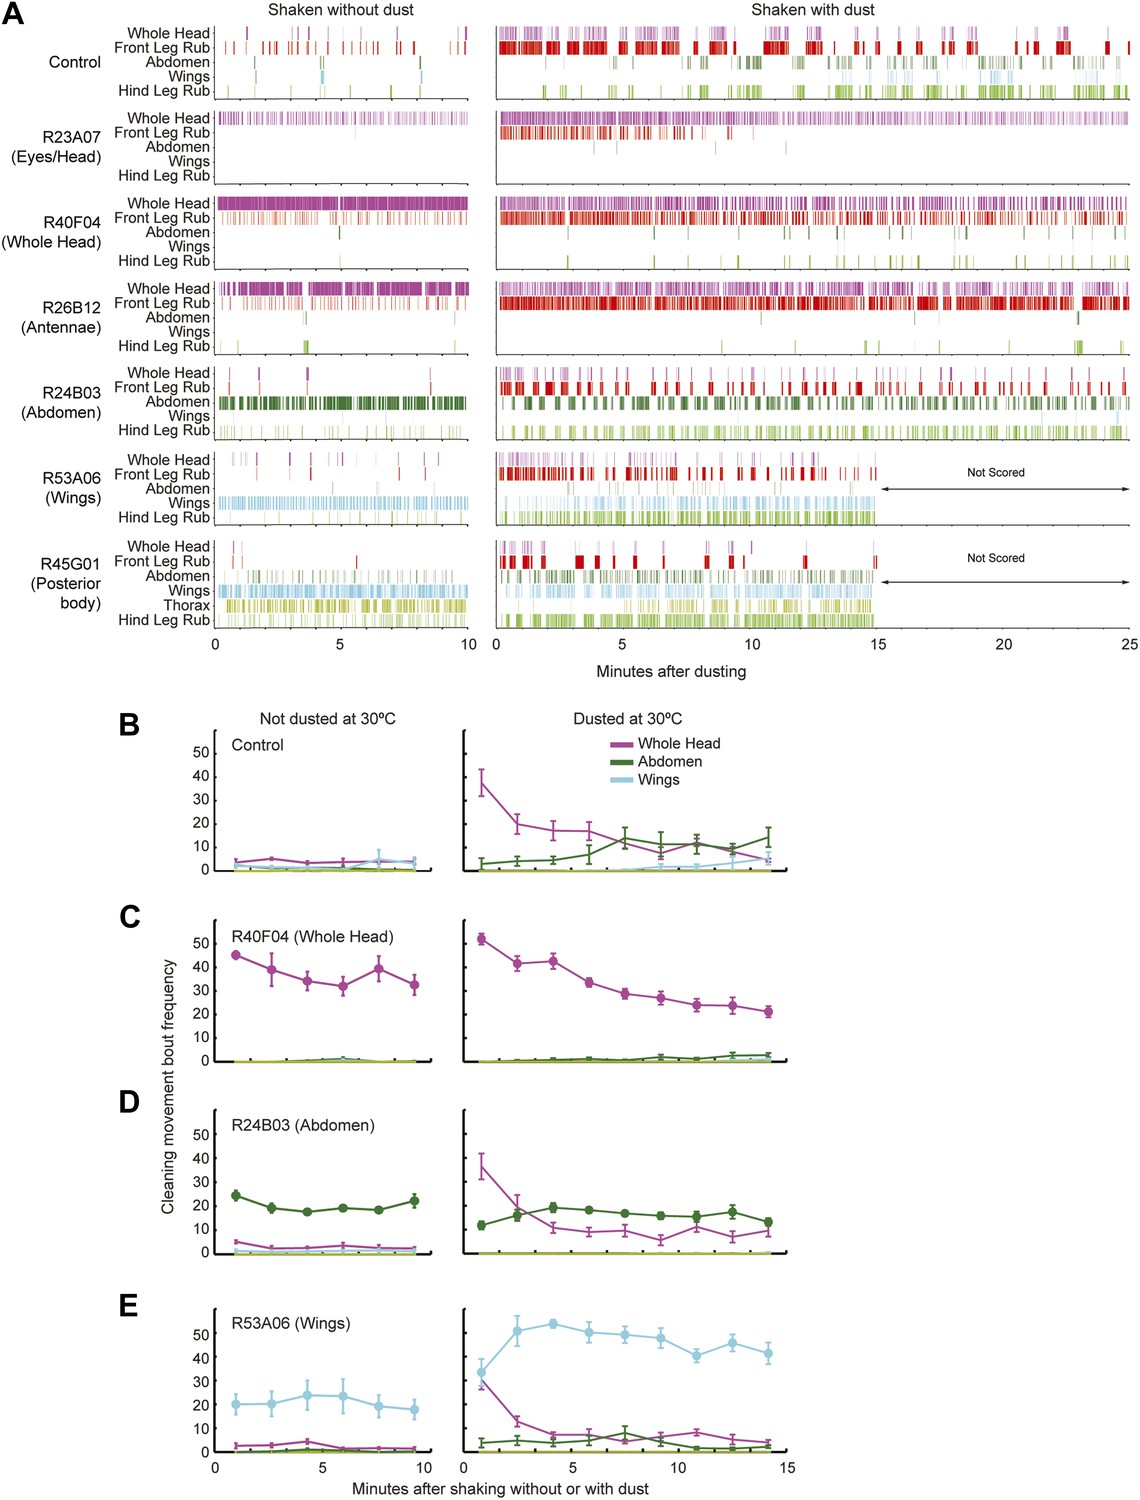
Behaviors of flies that were coated in dust while specific cleaning movements were artificially activated.
Flies were pre-warmed at 30°C such that the dTrpA1-activated cleaning movement was being performed at the time of dusting. They were shaken with or without dust and allowed to groom while their cleaning movements were recorded for behavioral analysis. (A) Representative manually annotated ethograms of GAL4 lines expressing dTrpA1 that were shaken with and without dust. The most common mutually exclusive movements performed by individual flies are displayed. R53A06 and R45G01 were not scored beyond 15 min because they had already progressed through the cleaning sequence. (B–E) Most head cleaning bouts occur at the beginning of grooming both in wild-type flies and when other cleaning movements are artificially activated. Number of cleaning movements for each major body part in 100 s intervals after flies were shaken without or with dust (plotted as the mean ± SEM; n = 5). Different lines displayed are: control (B), R40F04-GAL4/UAS-dTrpA1 (head cleaning) (C), R24B03-GAL4/UAS-dTrpA1 (abdominal cleaning) (D), R53A06-GAL4/UAS-dTrpA1 (wing cleaning) (E). Artificially activated movements are displayed as lines with filled circles at each time interval. Dust stimulated cleaning movements (not artificially activated) are shown as lines with no filled circles. All head cleaning movements are combined (labeled whole head). Friedman tests show a statistical difference between points in each head cleaning curve with dusted flies. This demonstrates that the numbers of head cleaning bouts at the beginning of grooming are higher than those at the end of the time course (p values for each line shown as undusted, dusted). Control (p = 0.817, p = 0.0004), R40F04 (p = 0.147, p = 0.00008), R24B03 (p = 0.3038, p = 0.0038), R53A06 (p = 0.0599, p = 0.0027). Other GAL4 lines showed similar results to these examples.
Figure 3—figure supplement 3
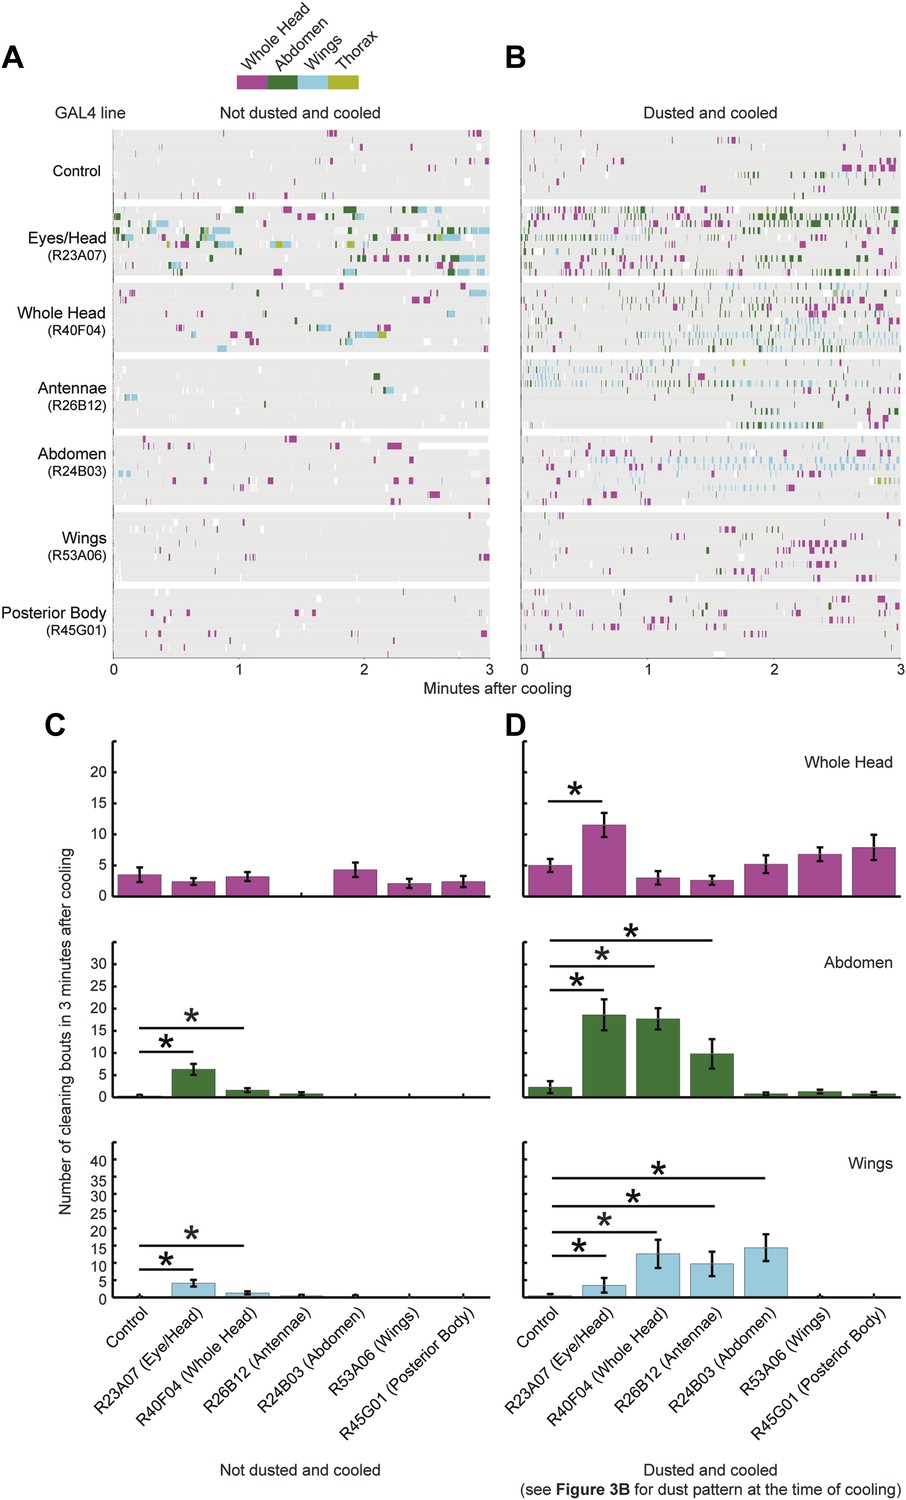
Triggering of cleaning movements is dust dependent.
This experiment was designed to test between two possible mechanisms for the sequential induction of cleaning movements. One possibility is that activation of a preceding cleaning movement and its subsequent deactivation triggers the next movement. Alternatively, the next movement is completely determined by the distribution of dust on the body. (A and B) Cleaning movements performed during the first 3 min after the flies were cooled. GAL4 lines expressing UAS-dTrpA1 were shaken without (A) or with (B) dust and treated as described in the results. Movements were recorded and manually scored (n = 10 flies per line per treatment). Ethograms of the scored behaviors are displayed by compressing all mutually exclusive events to a single line for each fly. UAS-dTrpA1-activation phenotypes are listed with the name of each GAL4 line. (C and D) Bar graphs of the frequencies of different movements in the first 3 min after flies were cooled that were undusted (C) or dusted (D) (plotted as the mean ± SEM; n = 10). Head cleaning sub movements are all binned because they are not easily distinguishable from one another when flies are dusted (labeled whole head). Asterisks show samples that were significantly different from control from a Kruskal–Wallis test followed by Mann–Whitney U pairwise tests and Bonferroni correction (p < 0.05). Note that R23A07 and R40F04 showed increases in posterior cleaning movements that were not dust dependent. However, these movements were not increased to the same frequencies as those observed when the flies were dusted and cooled. Data shown in D is compiled and displayed in Figure 3C.
Figure 4
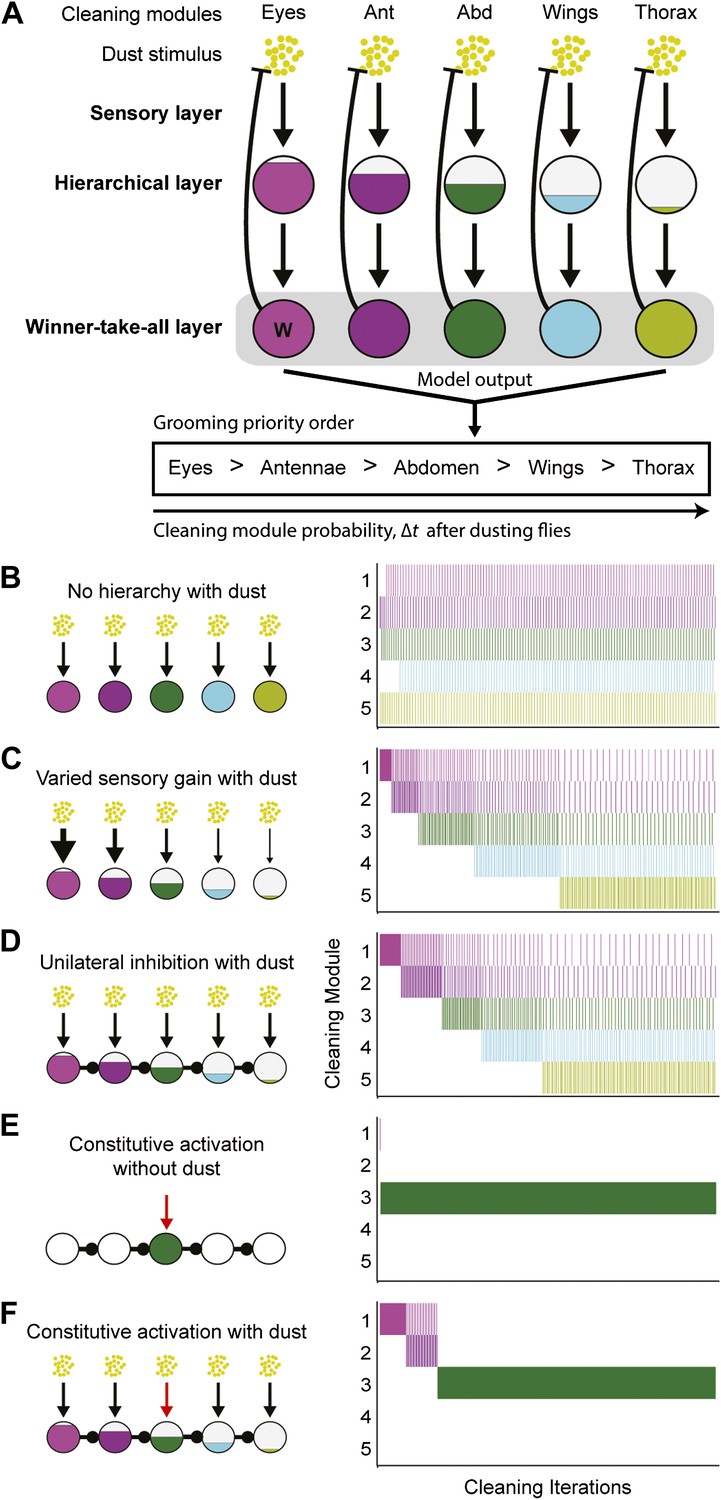
Model of hierarchical suppression results in the sequential progression of grooming.
(A) The dust induced grooming sequence requires three layers: (1) the sensory layer detects dust and independently activates each cleaning module. This is shown as parallel excitatory arrows from each yellow dust cartoon to activate specific cleaning modules. (2) The hierarchical layer determines each module's level of activation when its respective body part is coated in dust. Circle fill levels show theoretical differences in the relative activation levels of the modules. (3) The winner-take-all layer selects the cleaning module that is most active and suppresses all competing responses (‘W’ in this layer shows that the eye cleaning module is selected first). Theoretical all-to-all inhibitory connections in this layer are depicted as a gray box for simplicity. Blunt arrows from the winner-take-all layer to the yellow dust depict that the winning module reduces its own sensory input by cleaning off the dust and consequently becoming less active. The cleaning continues until the activation level of the module is no longer maximal, at which point the transition of cleaning to the new maximally active module occurs. Multiple iterations of this process result in a sequential progression. (B–D) Computational model simulates possible implementations of the hierarchical layer in establishing the most active modules. Modifications to the hierarchical layer and sensory inputs are depicted in each diagram. In this simulation, the competition is between five different cleaning modules. The ethograms show typical results of the simulation, where each row corresponds to the output of a module. (B) Equal sensitivities to dust and no inhibitory connections. (C) Modules with varying sensory gain in response to dust: modules with higher sensory gain (depicted with thicker arrows) have higher activation levels in response to the same dust amount. Fill levels represent the relative activity levels of the modules at the first iteration of the simulation. (D) Unidirectional lateral inhibitory connections between the modules. For simplicity of illustration, only the nearest-neighbor inhibitory connections are shown; in the computational implementation, each module inhibits all the subordinate modules in the hierarchy (e.g., 2 inhibits 3, 4, and 5). (E) Constitutive activation of a single cleaning module. Simulated by setting the amount of dust on a particular body part to completely dirty after each round of cleaning (depicted with the red arrow). (F) Constitutive activation of a single cleaning module in the presence of dust on all body parts.
Figure 5
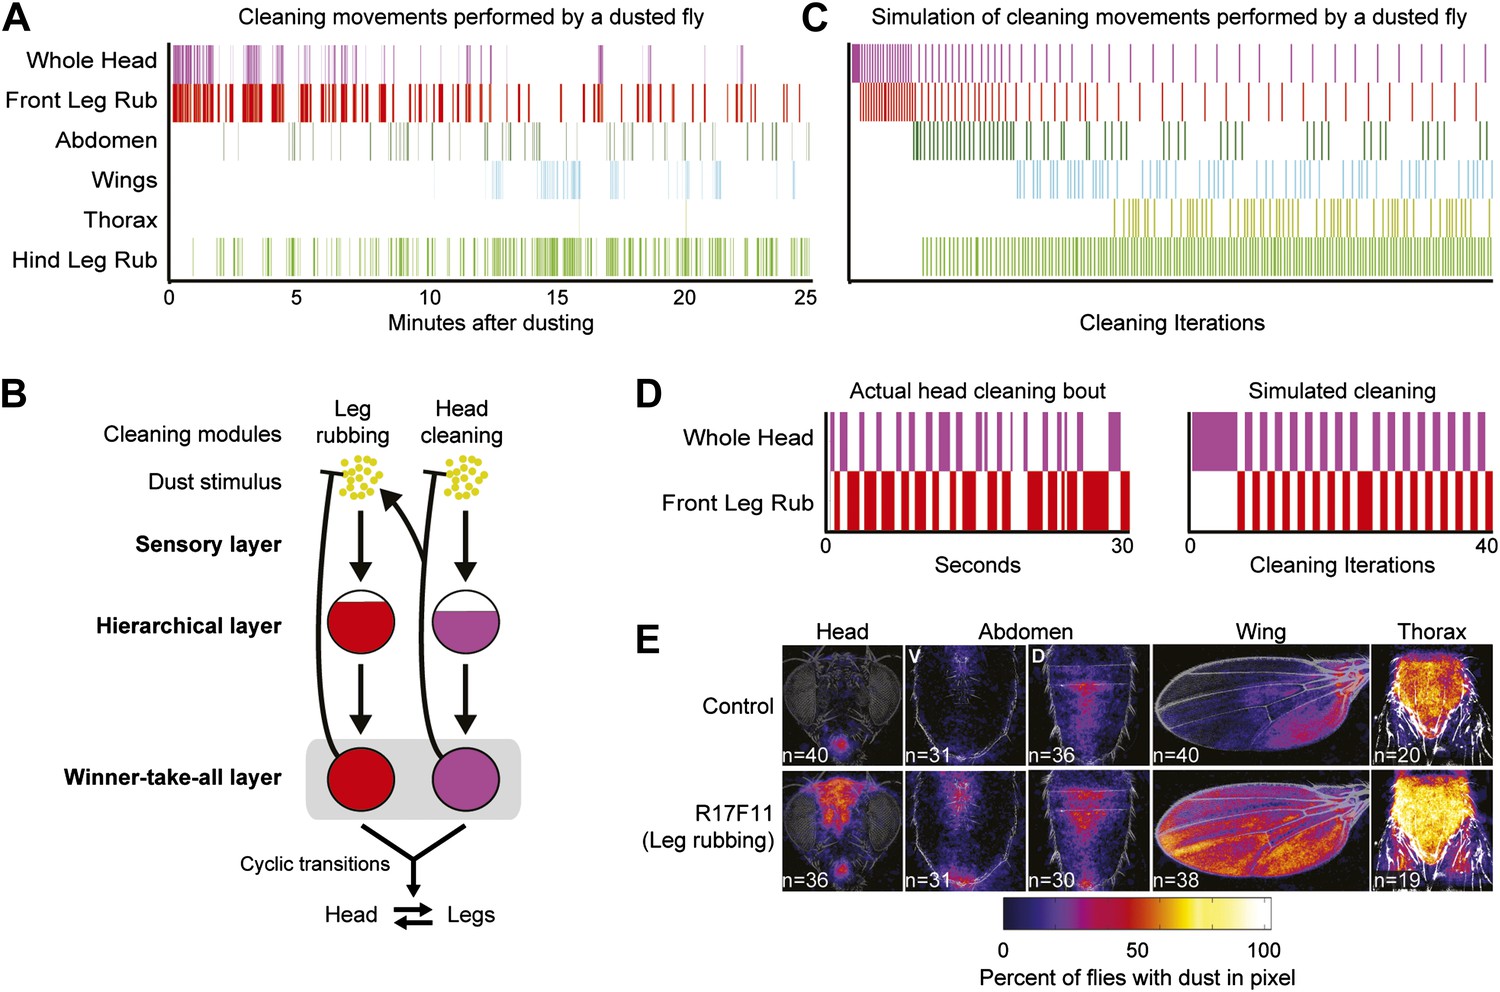
Hierarchical suppression mediates the cyclic transitions between cleaning modules.
Leg rubbing was simulated in the grooming model based on two features. (1) The legs accumulate dust as they remove it from the body parts. Leg rubbing is subsequently executed to remove that dust. (2) The sensory gain on the legs was set high relative to the other cleaning modules such that they are the most active and selected in the winner-take-all layer when they were sufficiently dirty. (A) Ethogram example of a wild-type fly grooming for comparison to the simulation. (B) Model of the leg rubbing and body part cleaning cycle (head cleaning example shown). Leg rubbing is hierarchically associated with the body-cleaning modules (similar to the associations among the cleaning modules described in Figure 4). The only difference between leg rubbing and the other modules is the accumulation of dust on the legs during body part cleaning. This is depicted by a forked connection that removes dust from the head (blunt arrow) and transfers it to the legs (arrow to the leg rubbing module). (C) Simulation of grooming with leg rubbing and four body-cleaning modules (result is typical). (D) Typical examples of cyclic switching between body cleaning and leg rubbing. The ethogram on the left displays a wild-type fly cleaning its head and the one on the right shows a simulated head-cleaning bout (each example is from early time points in A or C respectively). (E) Average spatial distribution of dust on each body part that remains when flies were coated in dust while leg rubbing was activated (25 min after dusting). V = ventral, D = dorsal.
Videos
Video 1
Cleaning movements of a wild-type fly after being coated in dust.
This video is related to Figure 1.
Video 2
Activated eye and head cleaning (R23A07-GAL4 / UAS-dTrpA1).
This video is related to Figure 2. Activated at 30°C. Displayed minor walking defect that was unrelated to the cleaning phenotype.
Video 3
Activated whole head cleaning (R40F04-GAL4/UAS-dTrpA1).
This video is related to Figure 2. Activated at 30°C. No other overt phenotypes were observed.
Video 4
Activated antennal cleaning (R26B12-GAL4/UAS-dTrpA1).
This video is related to Figure 2. Activated at 30°C. No other overt phenotypes were observed.
Video 5
Activated abdominal cleaning (R24B03-GAL4/UAS-dTrpA1).
This video is related to Figure 2. Activated at 30°C. No other overt phenotypes were observed.
Video 6
Activated wing cleaning (R53A06-GAL4/UAS-dTrpA1).
This video is related to Figure 2. Activated at 30°C. No other overt phenotypes were observed.
Video 7
Activated posterior body cleaning (R45G01-GAL4/UAS-dTrpA1).
This video is related to Figure 2. Activated at 30°C. No other overt phenotypes were observed.
Video 8
Activated leg rubbing (R17F11-GAL4/UAS-dTrpA1).
This video is related to Figure 2. Activated at 30°C. No other overt phenotypes were observed.
Video 9
Control for activation experiment (Control/UAS-dTrpA1).
This video is related to Figure 2. Activated at 30°C. No phenotypes were observed.
Additional files
-
Supplementary file 1
This file contains design plans for the grooming chambers used in this study (shown in Figure 1—figure supplement 1).
- https://doi.org/10.7554/eLife.02951.028
-
Source code 1
This Matlab code was used to display the average projections of dust patterns on the different body parts (shown in Figure 1—figure supplement 2C). Groomogram code works by averaging the grayscale values from multiple images of the same size for each pixel coordinate.
- https://doi.org/10.7554/eLife.02951.029
-
Source code 2
This code for Matlab will simulate dust-induced fly grooming behavior. Simulations are shown in Figure 4 and Figure 5C,D.
- https://doi.org/10.7554/eLife.02951.030
Download links
A two-part list of links to download the article, or parts of the article, in various formats.
Downloads (link to download the article as PDF)
Open citations (links to open the citations from this article in various online reference manager services)
Cite this article (links to download the citations from this article in formats compatible with various reference manager tools)
A suppression hierarchy among competing motor programs drives sequential grooming in Drosophila
eLife 3:e02951.
https://doi.org/10.7554/eLife.02951


