Integrated action of pheromone signals in promoting courtship behavior in male mice
- Stowers Institute for Medical Research, United States
- Howard Hughes Medical Institute, Janelia Farm Research Campus, United States
- University of Kansas Medical Center, United States
Figures
Figure 1 with 2 supplements
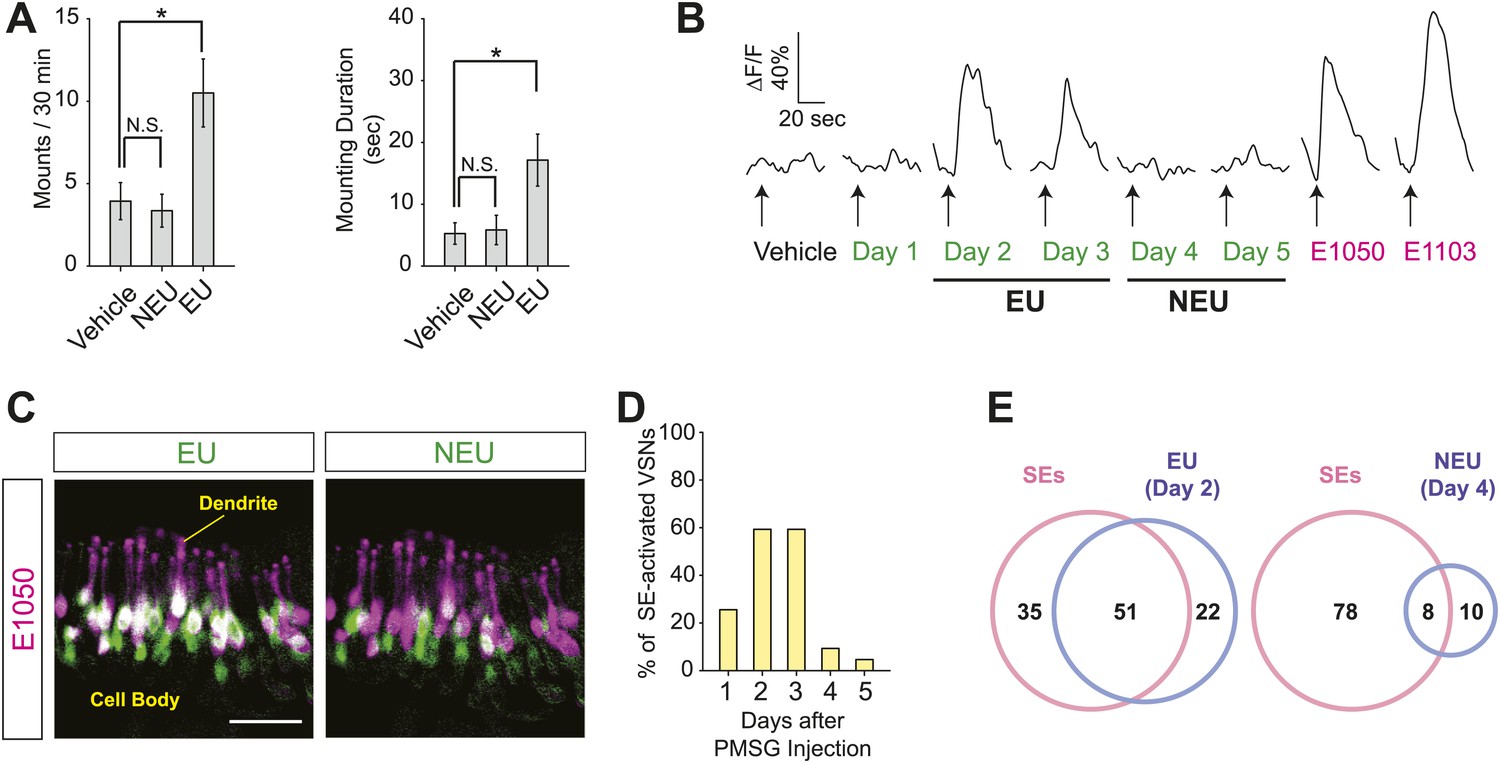
Sulfated estrogens mimic the activity of estrus signal in urine.
(A) The number (left) and duration (right) of mounting behavior of sexually naïve males toward ovariectomized females painted with vehicle (n = 16), non-estrus urine (NEU; n = 14) or estrus urine (EU; n = 22). EU and NEU were collected 2 and 4 days, respectively, after PMSG injection to induce estrus. Error bars, SEM; *p<0.05 (Mann–Whitney test). (B) Traces showing GCaMP2 responses of a representative cell to urine samples collected from females 1 to 5 days after PMSG injection and SEs. Arrows indicate the onset of stimulus delivery. (C) Representative images of the VNO slice response pattern to E1050 (magenta) and urine (green). Scale bar, 50 μm. (D) Bar graph showing the percentage of SE-activated VSNs (n = 86; 3 slices) that are also activated by female urine samples. (E) Venn diagrams showing the overlap between VSNs responding to SEs and those activated by EU or NEU.
Figure 1—figure supplement 1
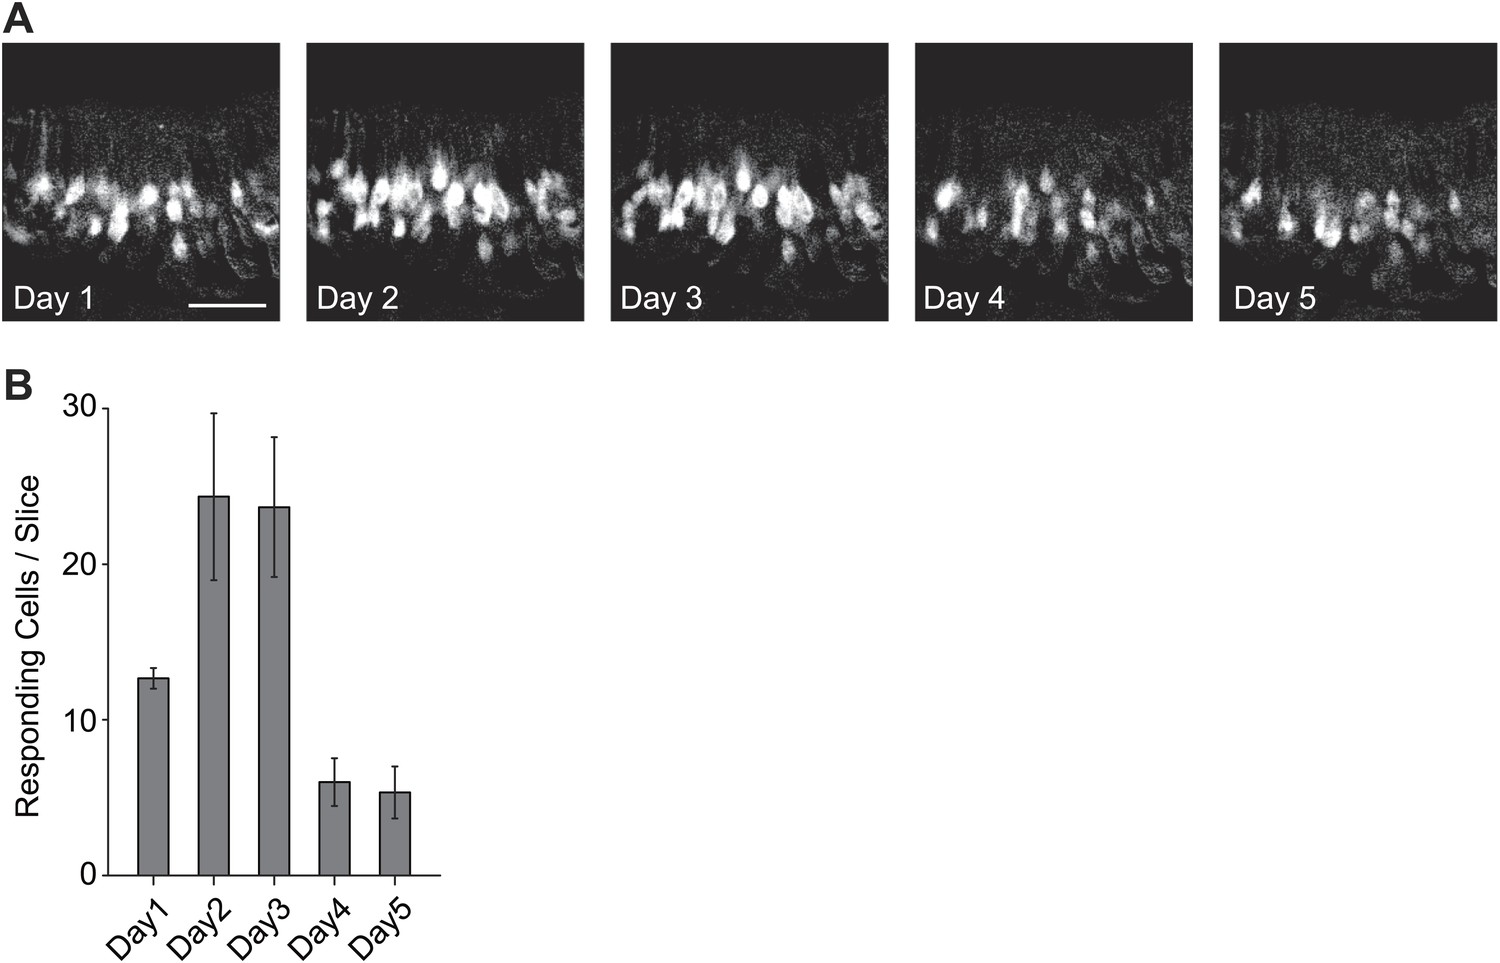
Activation of the VSNs by female mouse urine.
(A) Representative images of the VNO slice response pattern to urine samples collected from females 1 to 5 days after PMSG injection. Scale bar, 50 μm. (B) Bar graph showing the number of responding cells to urine samples collected from females 1 to 5 days after PMSG injection in each slice (3 slices). Error bars, SEM.
Figure 1—figure supplement 2
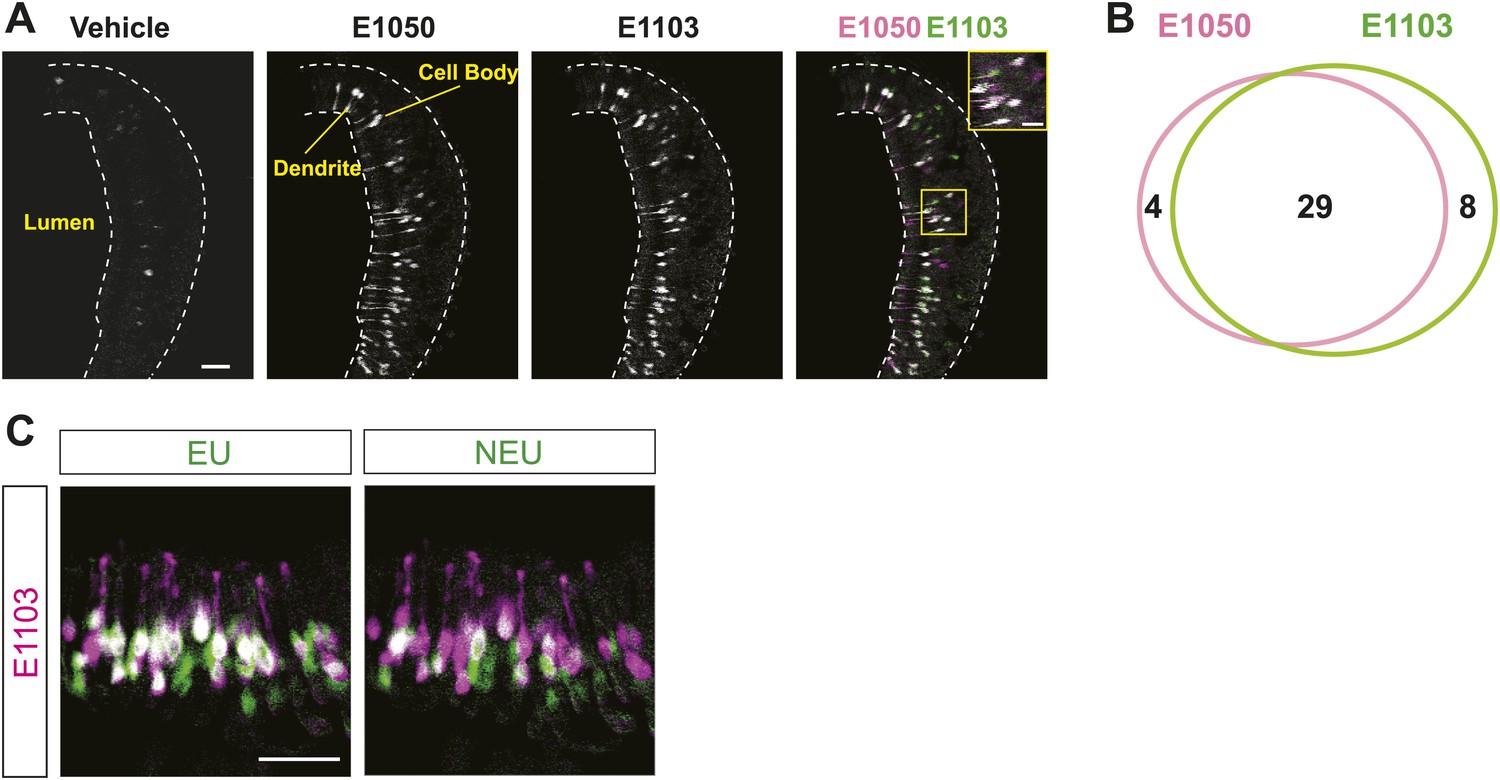
Activation of the VSNs by sulfated estrogen E1050 and E1103.
(A) Representative images of a GCaMP2 VNO slice responding to vehicle, 100 nM E1050 and E1103. Bright cells are the activated neurons. VSNs responding to E1050 (magenta) or E1103 (green) are color-coded in the right panel to show overlap (white). Scale bar, 50 μm. (B) Venn diagram of the overlap of VSNs responding to 100 nM E1050 and E1103. (C) Representative images of the VNO slice response pattern to E1103 and urine samples collected from females 2 or 4 days after PMSG injection. VSNs responding to E1103 (magenta) or urine samples (green) are color-coded to show overlap (white). Scale bar, 50 μm.
Figure 2 with 1 supplement
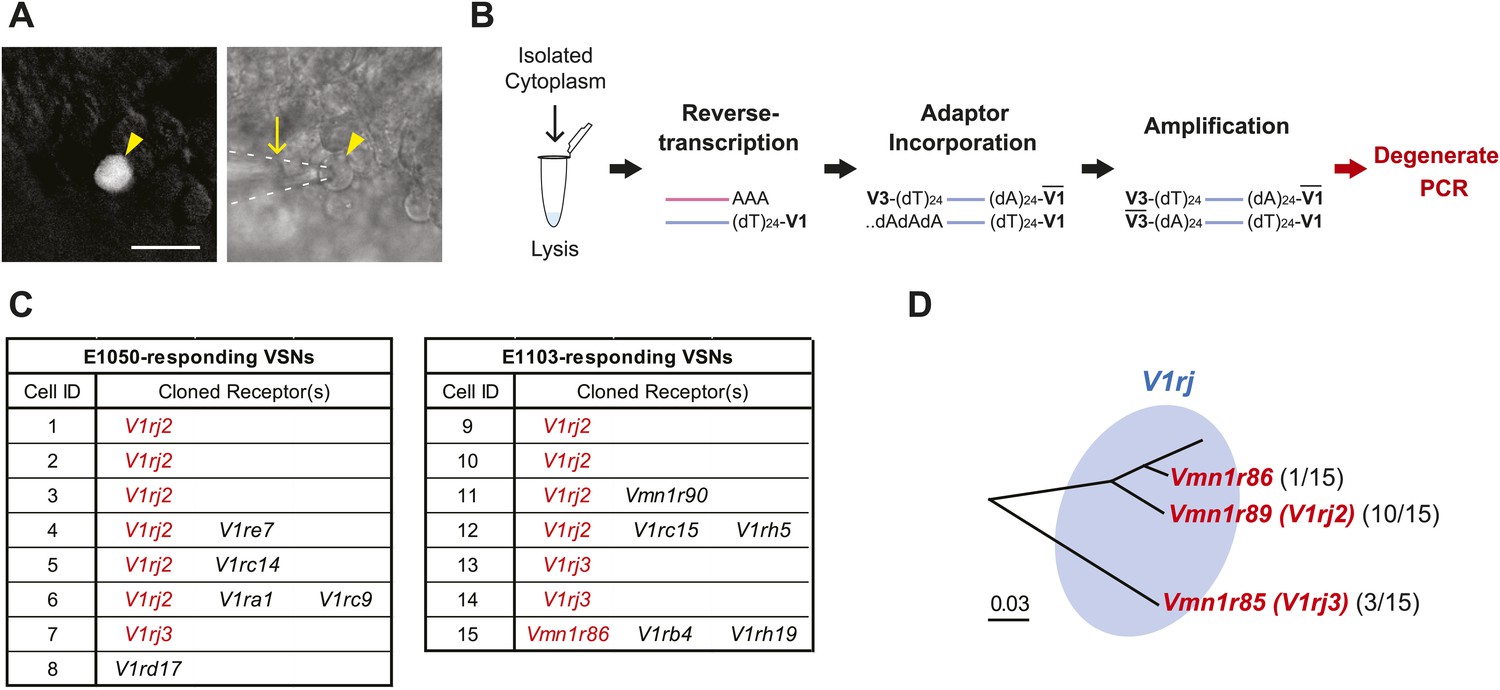
VSNs responding to estrus signal express V1rj receptors.
(A) Representative images of the single-cell isolation procedure. Arrowheads indicate a responding cell illuminated under fluorescence (left), which is aspirated into a micro-capillary (arrow) under bright field illumination (right). Scale bar, 20 μm. (B) Schematic illustration of single-cell degenerate RT-PCR procedure. (C) Tables showing the receptor genes cloned from individual E1050-responding (left) and E1103-responding VSNs (right). Members of V1rj clade are indicated in red. (D) Enlarged view of phylogenetic tree showing the V1rj clade. Receptors cloned from SE-responding VSNs are indicated in red. Numbers in parentheses indicate the number of the VSNs that expressed the receptor out of the total number of SE-responding VSNs profiled.
Figure 2—figure supplement 1

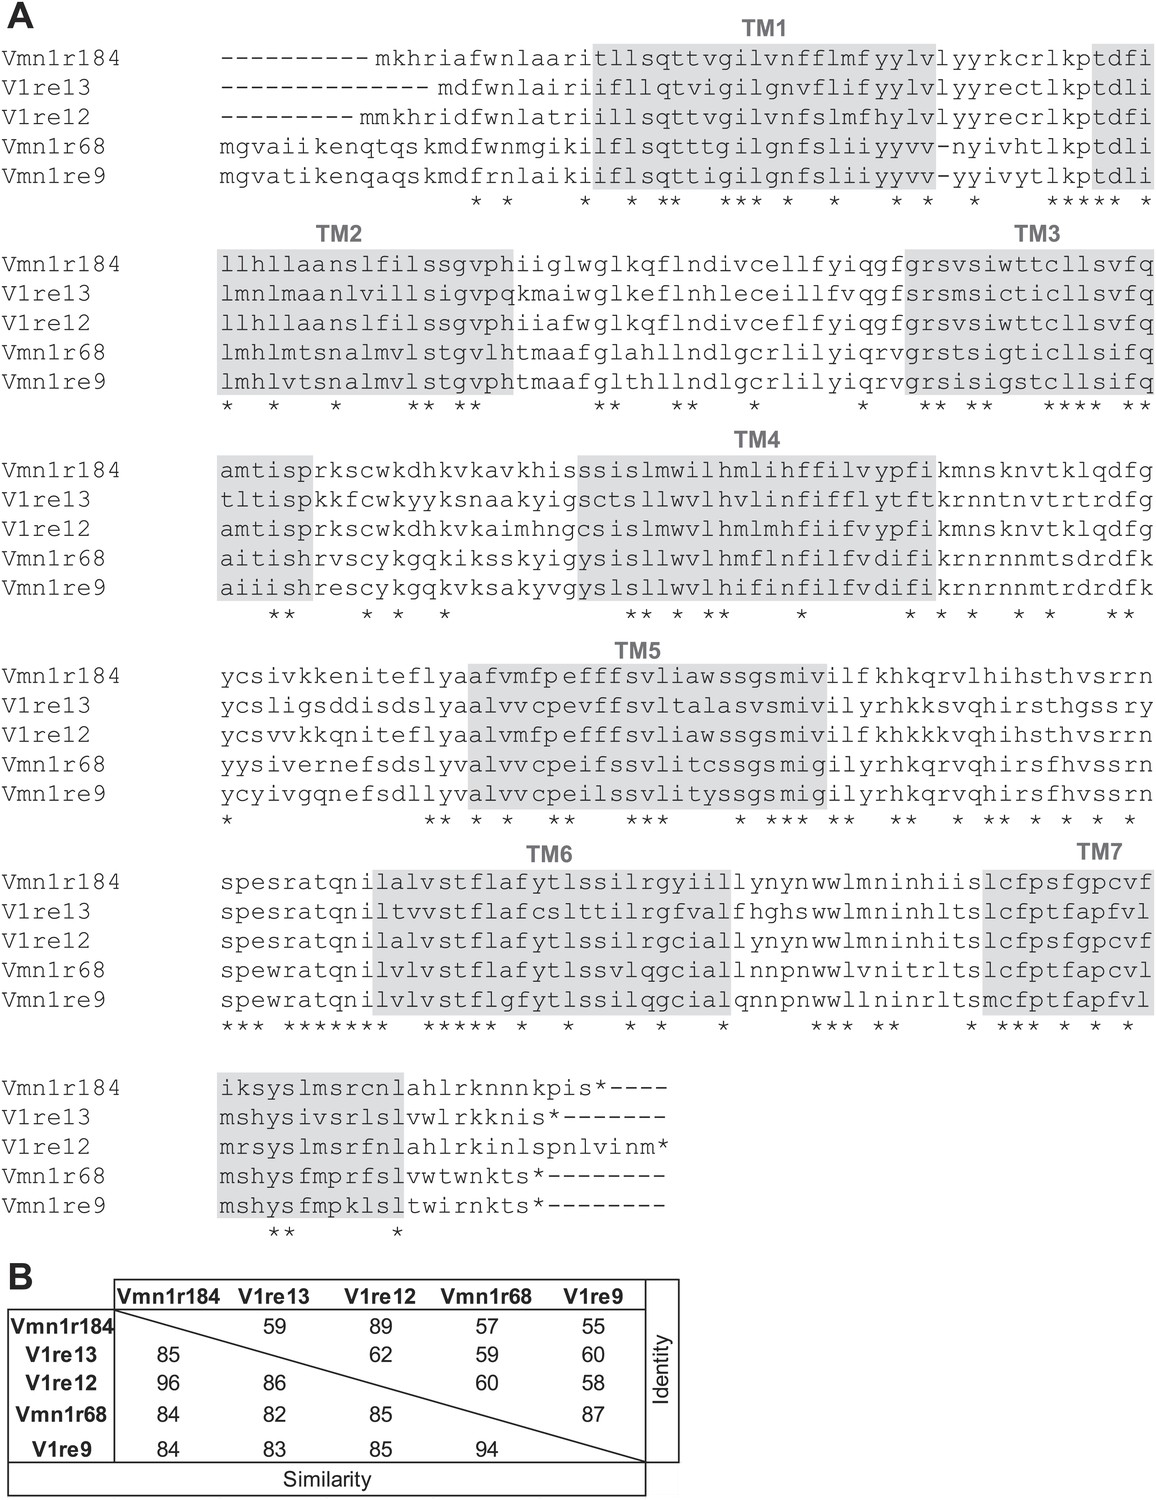
Members of V1rj group receptors are homologous to each other.
(A) Alignment of amino acid sequences of the members of V1Rj group receptors found in sulfated estrogens responding cells. Identical residues are indicated by asterisks. The potential transmembrane (TM) domains are highlighted in gray. (B) Amino acid similarities and identities among the members of V1rj group receptors.
Figure 3 with 1 supplement

V1rj receptors selectively respond to sulfated estrogens.
(A) Schematic illustration of transgenic alleles that induce ectopic V1rj2- or V1rj3-expression in the VNO: (i) Gγ8-tTA allele drives tTA expression in immature VSNs; (ii) Knock-in OMP-IRES-tTA (OIVT) allele drives tTA expression in mature VSNs; (iii) tetO-V1rj2/3-tdTomato allele that allows bicistronic expression of V1rj2 or V1rj3 with tdTomato; (iv) tetO-GCaMP2 allele. (B) Representative images of VNO slices from Gγ8-tTA;OIVT;tetO-V1rj2-tdTomato;tetO-GCaMP2 (top) and Gγ8-tTA;OIVT;tetO-V1rj3-tdTomato;tetO-GCaMP2 (bottom) mice. D: dendrite; CB: cell body. Scale bar, 50 μm. (C) Representative images of GCaMP2 VNO slices from the control (left), V1rj2- (middle) and V1rj3-tdTomato-expressing (right) mice responding to vehicle (top) or 100 nM E1050 (bottom). Scale bar, 50 μm. (D and E) Traces showing GCaMP2 responses of two representative V1rj2 (D) or V1rj3 (E). Response of tdTomato-expressing cells to different concentrations of E1050 (top) and E1103 (bottom). Arrows indicate the onset of stimulus delivery. (F and G) Bar graph showing the normalized response amplitude of V1rj2 (F; n = 247) or V1rj3 (G; n = 207) VSNs to a set of sulfated steroid compounds. Error bars, SEM.
Figure 3—figure supplement 1
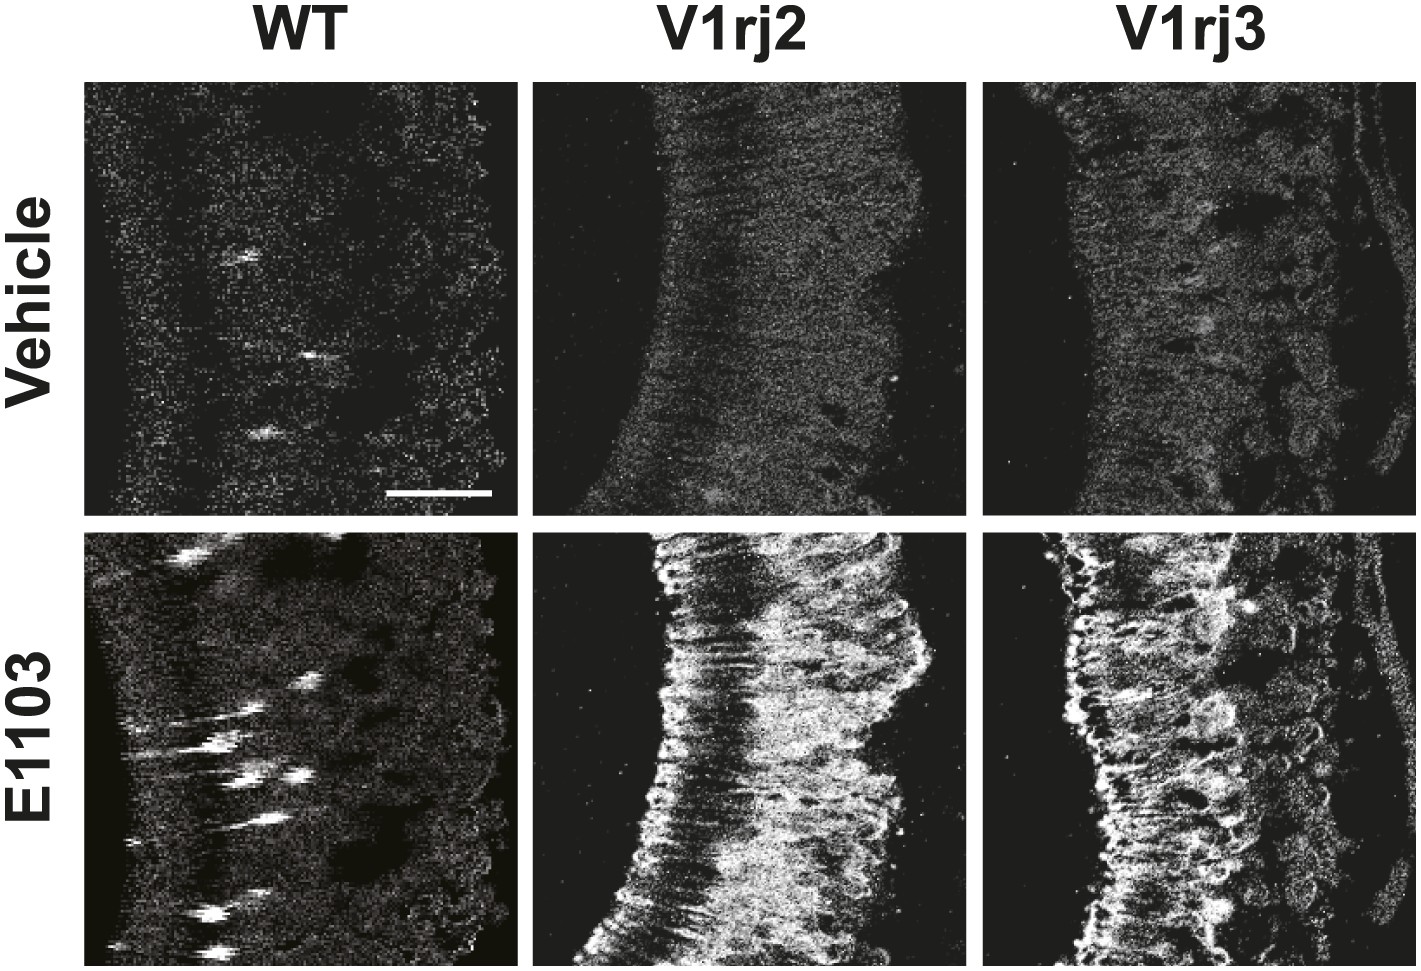
E1103 activates V1rj2/3-expressing VSNs.
Representative images of GCaMP2 VNO slices from the control (left), V1rj2-tdTomato-expressing (middle) and V1rj3-tdTomato-expressing (right) mice responding to vehicle (top) or 100 nM E1103 (bottom). Bright cells are the activated neurons. The control is the same slice as in Figure 3C. Scale bar, 50 μm.
Figure 4 with 1 supplement
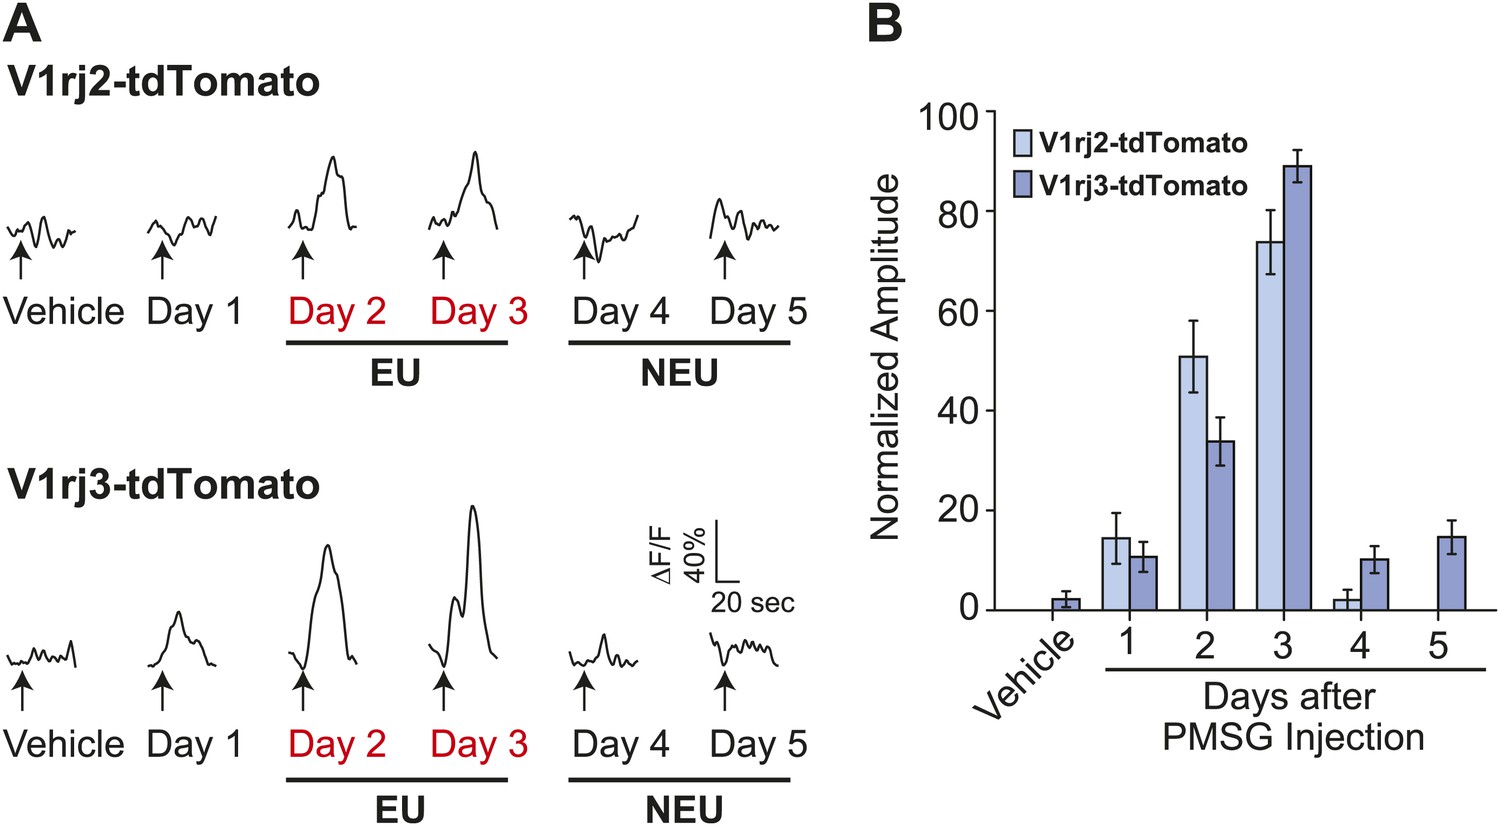
V1rj receptors selectively respond to estrus urinary cues.
(A) Traces showing GCaMP2 responses of a representative V1rj2-tdTomato-expressing cell (top) and a V1rj3-tdTomato-expressing cell (bottom) to urine samples collected from females 1 to 5 days after PMSG injection. (B) Bar graph showing normalized response amplitude of V1rj2 (n = 43) or V1rj3 (n = 77) VSNs labeled by both GCaMP2 and tdTomato. Error bars: SEM.
Figure 4—figure supplement 1

Urine from estrous females in natural estrus cycle activates V1rj3-expressing VSNs.
Bar graph showing normalized response amplitude of V1j3-expressing VSNs to urine from estrous and diestrous females in the natural estrus cycle. Error bars, SEM.
Figure 5 with 3 supplements

V1re-Chr.7 group receptors recognize female-specific gender signals.
(A) Representative images of VSNs responding to urine samples from either females (top) or males (bottom) of different mouse strains. White arrow-heads indicate a Female Urine Specific Cell (FUSC). Scale bar, 20 μm. (B) Enlarged view of the V1re clade of the phylogenetic tree of the V1r family. Receptors located on Chr.7 and Chr.17 are circled in pink and light blue, respectively. Receptors cloned from FUSCs are indicated in bold font. The numbers in parentheses indicate the number of the VSNs that express the receptor over the total numbers of FUSCs examined. (C) Traces showing the GCaMP2 responses of a representative V1re9- (top) and a V1re12-tdTomato-expressing cell (bottom) to female and male urine samples from multiple mouse strains. (D) Bar graph showing the percentage of V1re9 (n = 195) or V1re12 (n = 201) VSNs responding to urine samples from various strains of males and females. (E) Traces showing the GCaMP2 responses of a representative V1re9- (top) and a V1re12-tdTomato-expressing cell (bottom) to urine samples from females 1 to 5 days after PMSG injection. (F) Bar graph showing the percentage of V1re9 (n = 120) or V1re12 (n = 209) VSNs responding to female urine samples.
Figure 5—figure supplement 1
Members of V1re-Chr.7 group receptors are homologous to each other.
(A) Alignment of amino acid sequences of the members of V1re-Chr.7 group receptors found in FUSCs. Identical residues are indicated by asterisks. The potential transmembrane (TM) domains are highlighted in gray. (B) Amino acid similarities and identities of the members of V1re-Chr.7 group receptors.
Figure 5—figure supplement 2
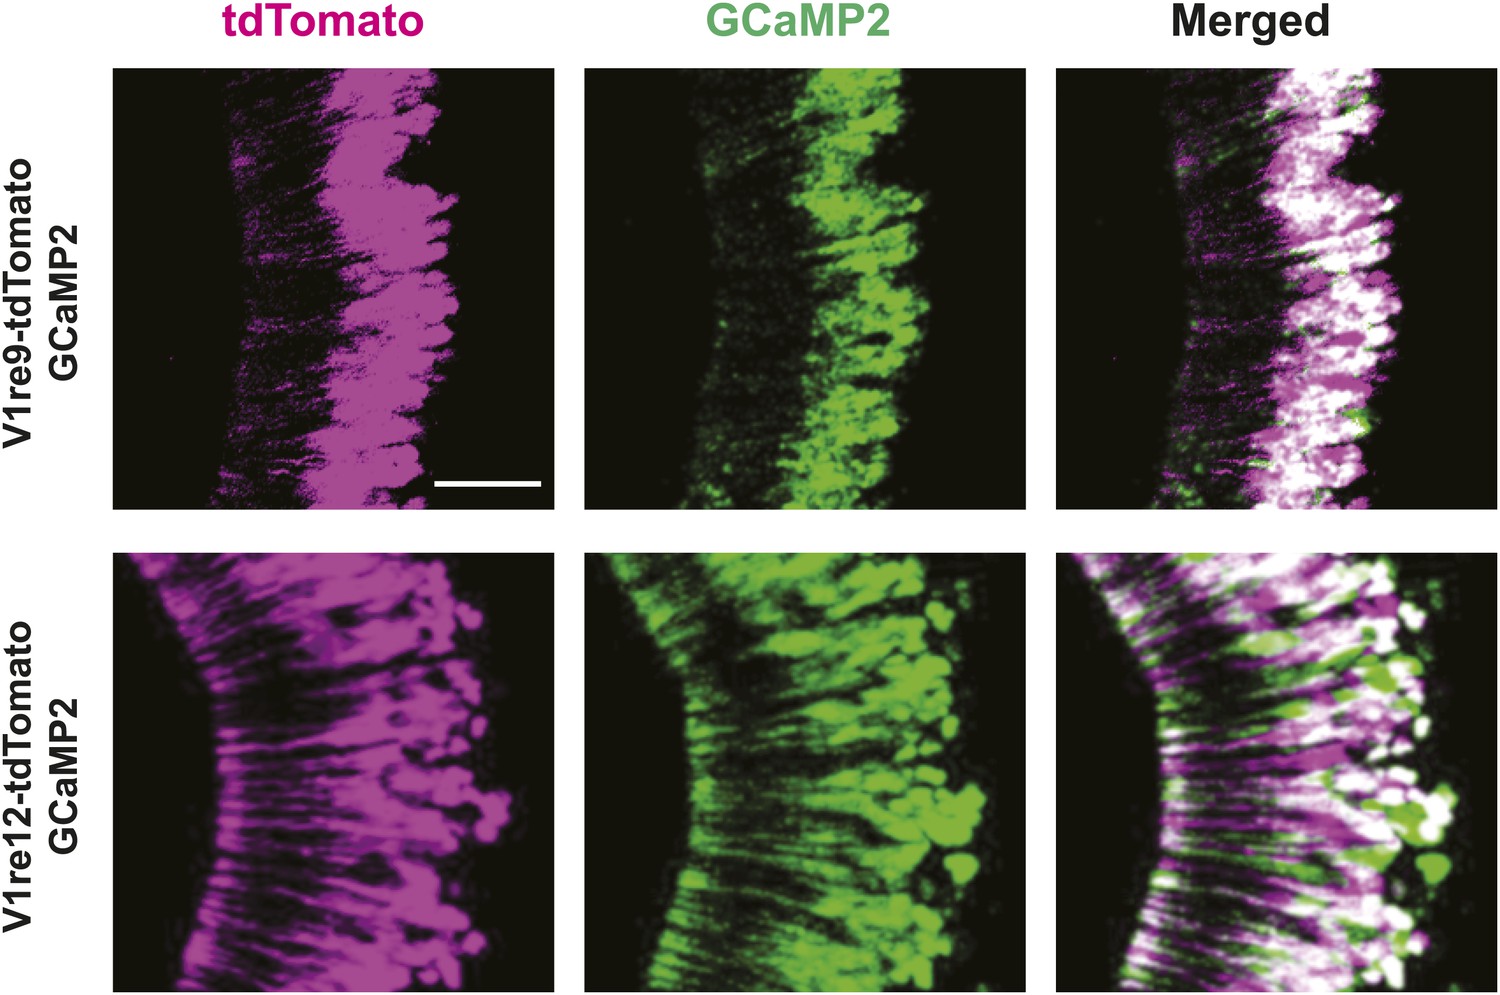
V1re9/12-expressing VSNs express GCaMP2.
Representative images of VNO of Gγ8-tTA;OIVT;tetO-V1re9-tdTomato;tetO-GCaMP2 (top) and Gγ8-tTA;OIVT;tetO-V1re12-tdTomato;tetO-GCaMP2 (bottom) mice. Scale bar, 50 μm.
Figure 5—figure supplement 3

Urine sample from ovariectomized females activates V1re9/e12-expressing cells.
(A) Bar graph showing normalized response amplitude of V1e9 (n = 133) or V1re12 (n = 137) VSNs labeled by both GCaMP2 and tdTomato to urine from estrus (EU) and ovariectomized (OVX) females. (B) Bar graph showing the percentage of V1re9 (n = 371) or V1re12 (n = 221) VSNs responding to urine samples from estrus and ovariectomized females. Error bars, SEM.
Figure 6
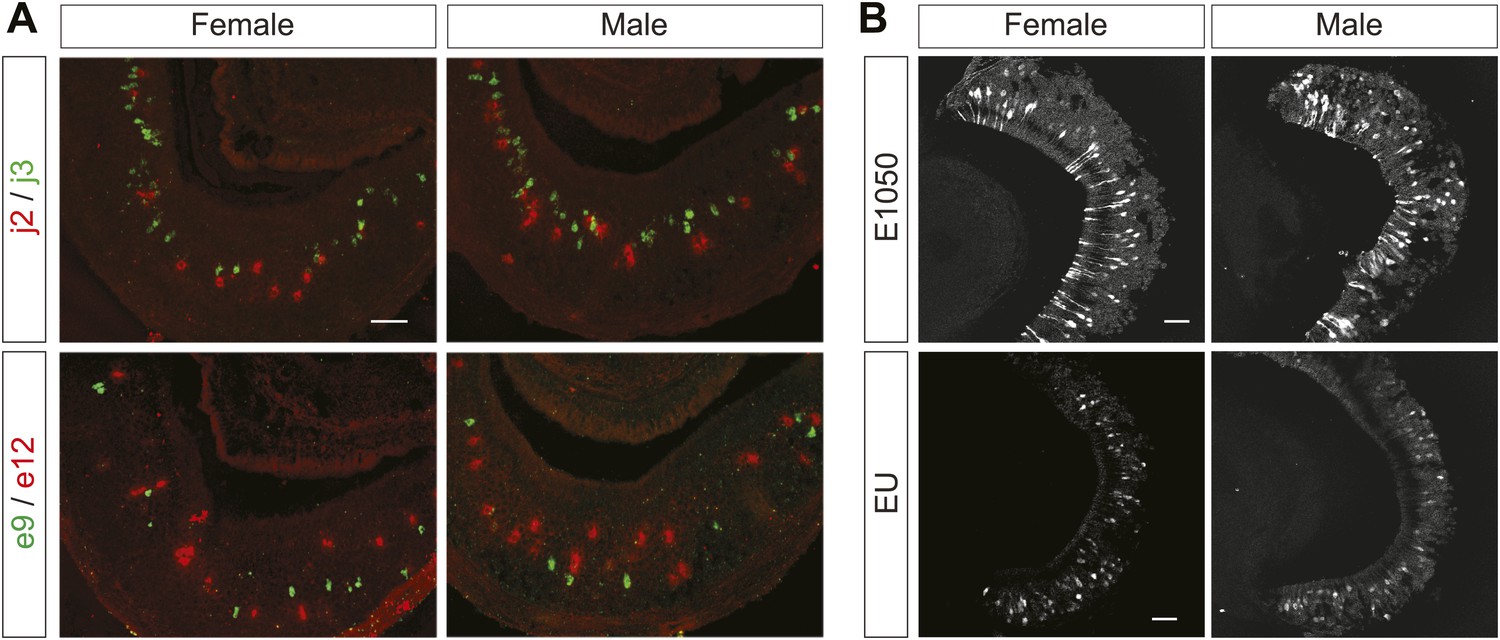
The female cues are detected in male and female VNOs.
(A) Double in situ hybridization of VNO slices. Top row: confocal images showing cells expressing V1rj2 (red) and V1rj3 (green) in VNO sections obtained from female (left) and male (right) mice. Bottom row: confocal images showing cells labeled by V1re9 (green) and V1re12 (red) probes in VNO sections from female (left) and male (right) mice. (B) Representative images of GCaMP2 VNO slices from female (left) and male (right) mice responding to 100 nM E1050 (top) and estrus urine (bottom). Scale bars, 50 μm.
Figure 7 with 1 supplement
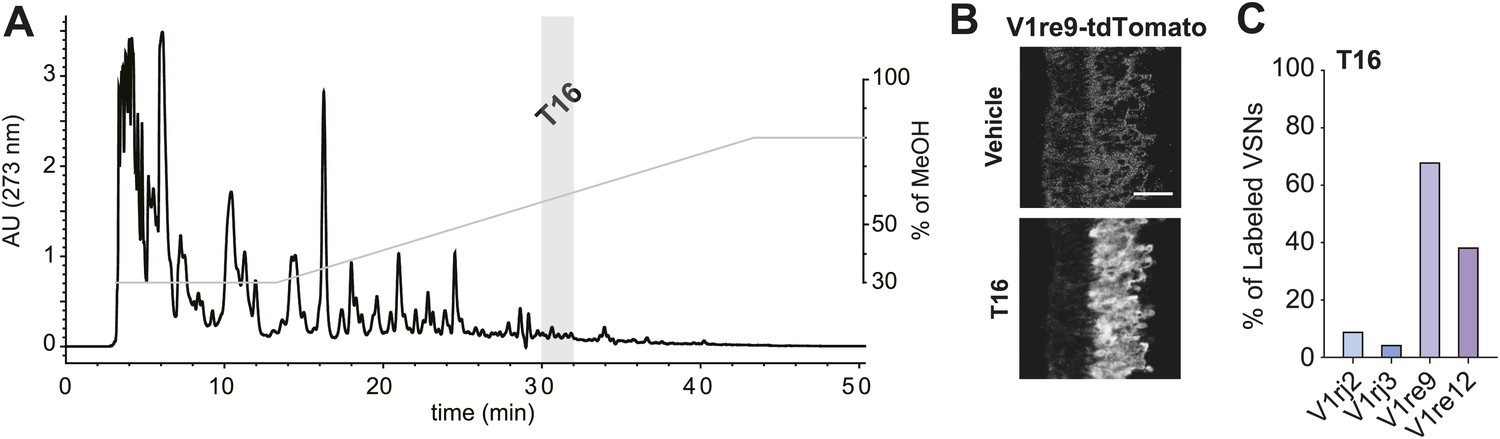
T16 fraction contains the female-specific gender cue.
(A) Chromatogram of HPLC purification using a C18 column. The light gray bar indicates the T16 fraction that activates the V1re9 and V1re12 receptors. (B) A representative image of GCaMP2 VNO slices from a V1re9-tdTomato-expressing mouse responding to the T16 fraction. Scale bar, 50 μm. (C) Bar graph showing the percentage of V1rj2 (n = 172), V1rj3 (n = 243), V1re9 (n = 189) or V1re12 (n = 205) VSNs responding to the T16 fraction.
Figure 7—figure supplement 1
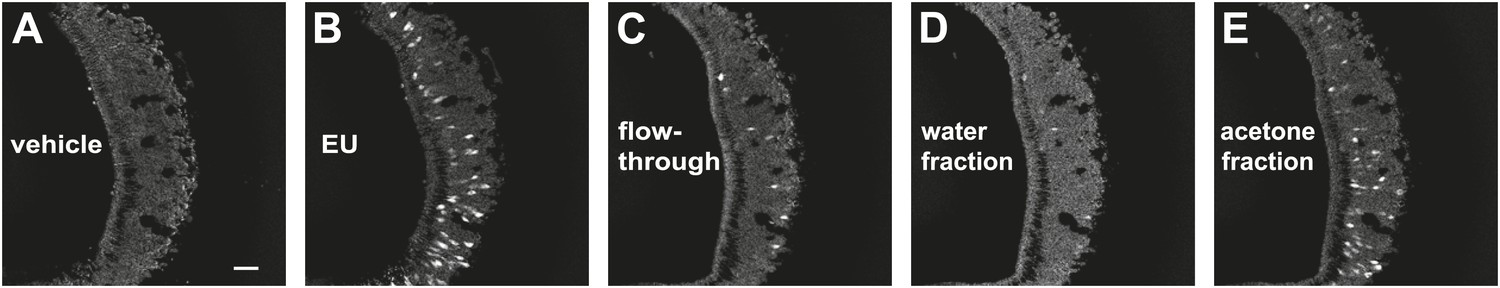
Acetone fraction from XAD4 resins retains VNO-stimulatory activity.
Representative images of a GCaMP2 VNO slice in response to vehicle (A), estrus urine (EU; B), flow-through (C), water (D) and acetone (E) fractions. Scale bar, 50 μm.
Figure 8
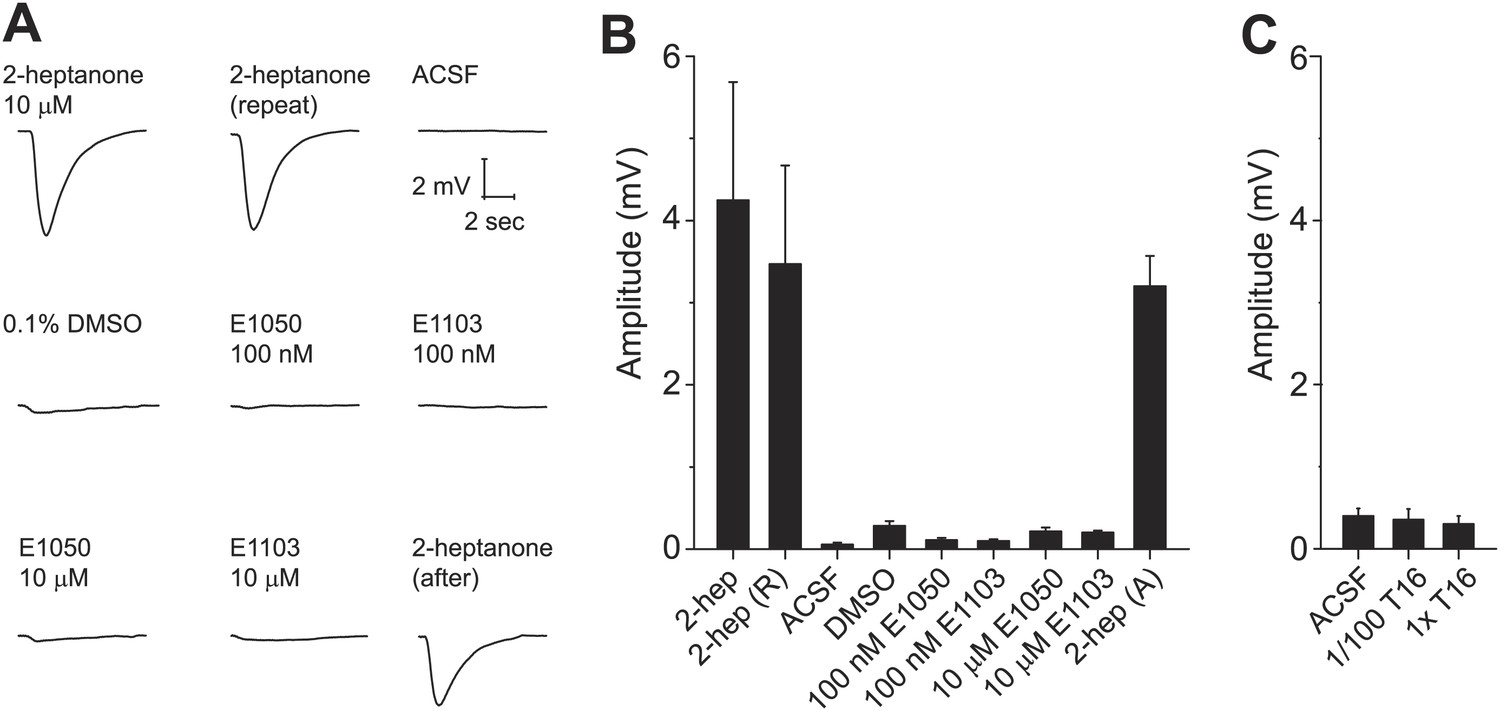
Sulfated estrogens and T16 fraction do not activate the main olfactory system.
(A) Traces showing EOG responses to 2-heptanone, E1050 and E1103. (B and C) Bar graphs showing the mean amplitude of EOG responses to 2-heptanone, E1050 and E1103 (B) and the T16 fraction (C). Error bars: SEM (n = 3 mice).
Figure 9 with 1 supplement
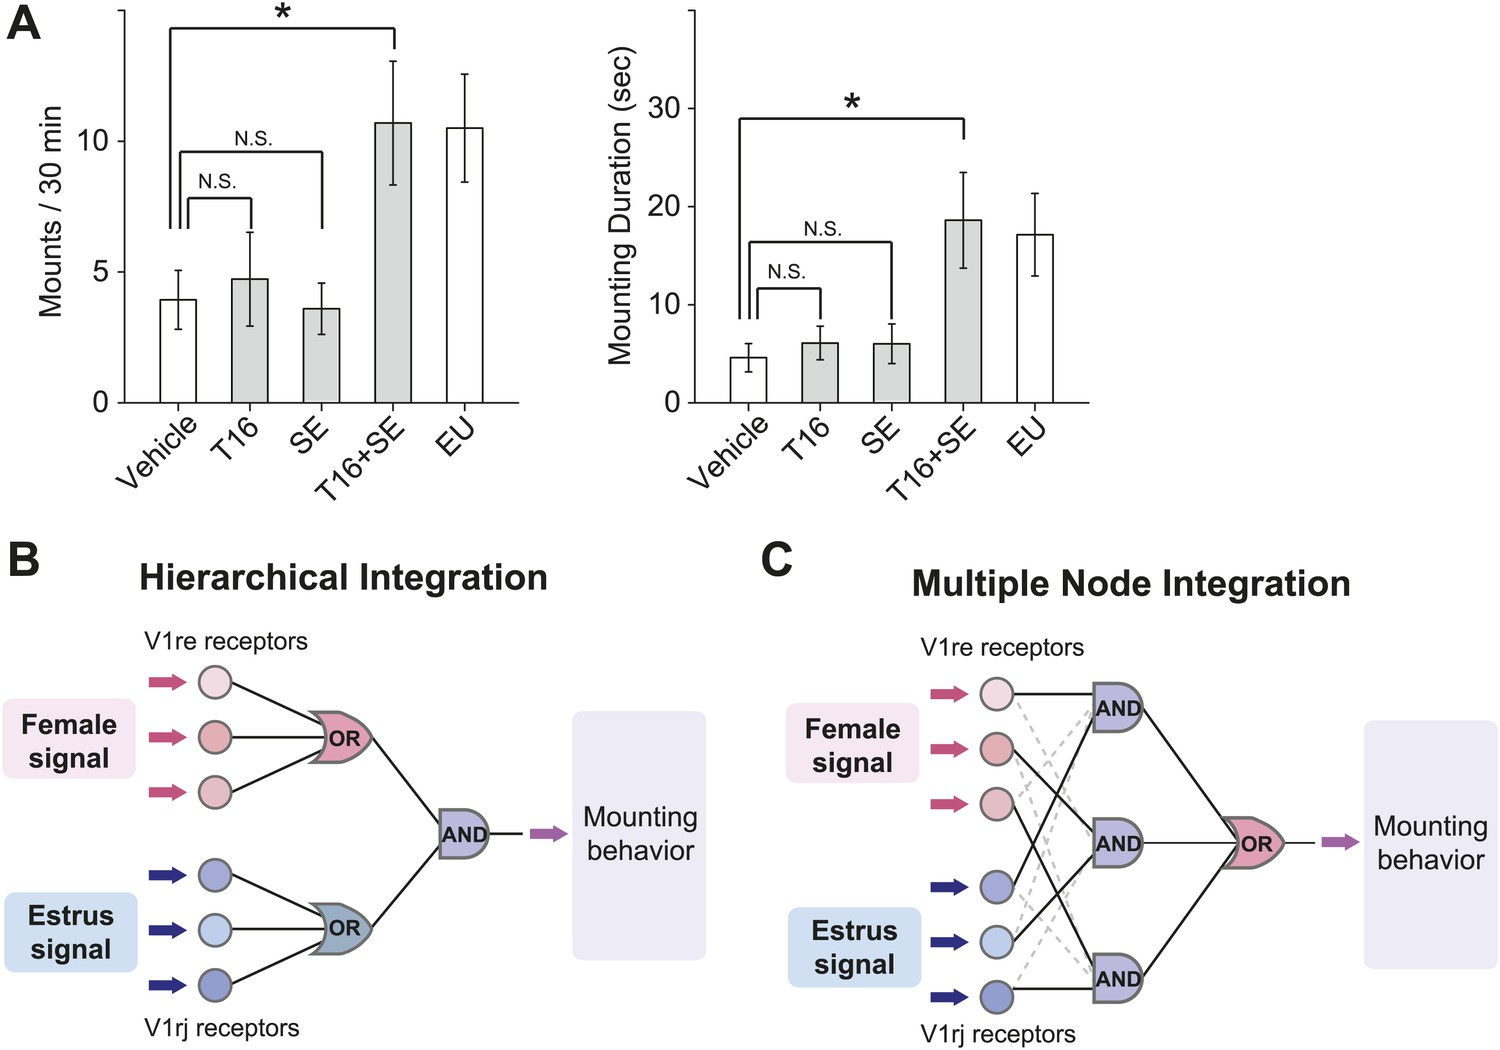
Combined female and estrus cues are sufficient to promote mounting behavior.
(A) The number (left), duration (middle) and latency (right) of mounting behavior of naïve males toward females painted with vehicle, T16 (n = 13), SE (n = 10), T16+SE (n = 13) or EU samples. The data presented with white bars are the same as in Figure 1. Error bars: SEM; *p<0.05 (Mann–Whitney test). (B and C) Schematic illustrations of two alternative models of neural circuits that integrate the female and estrus signals.
Figure 9—figure supplement 1
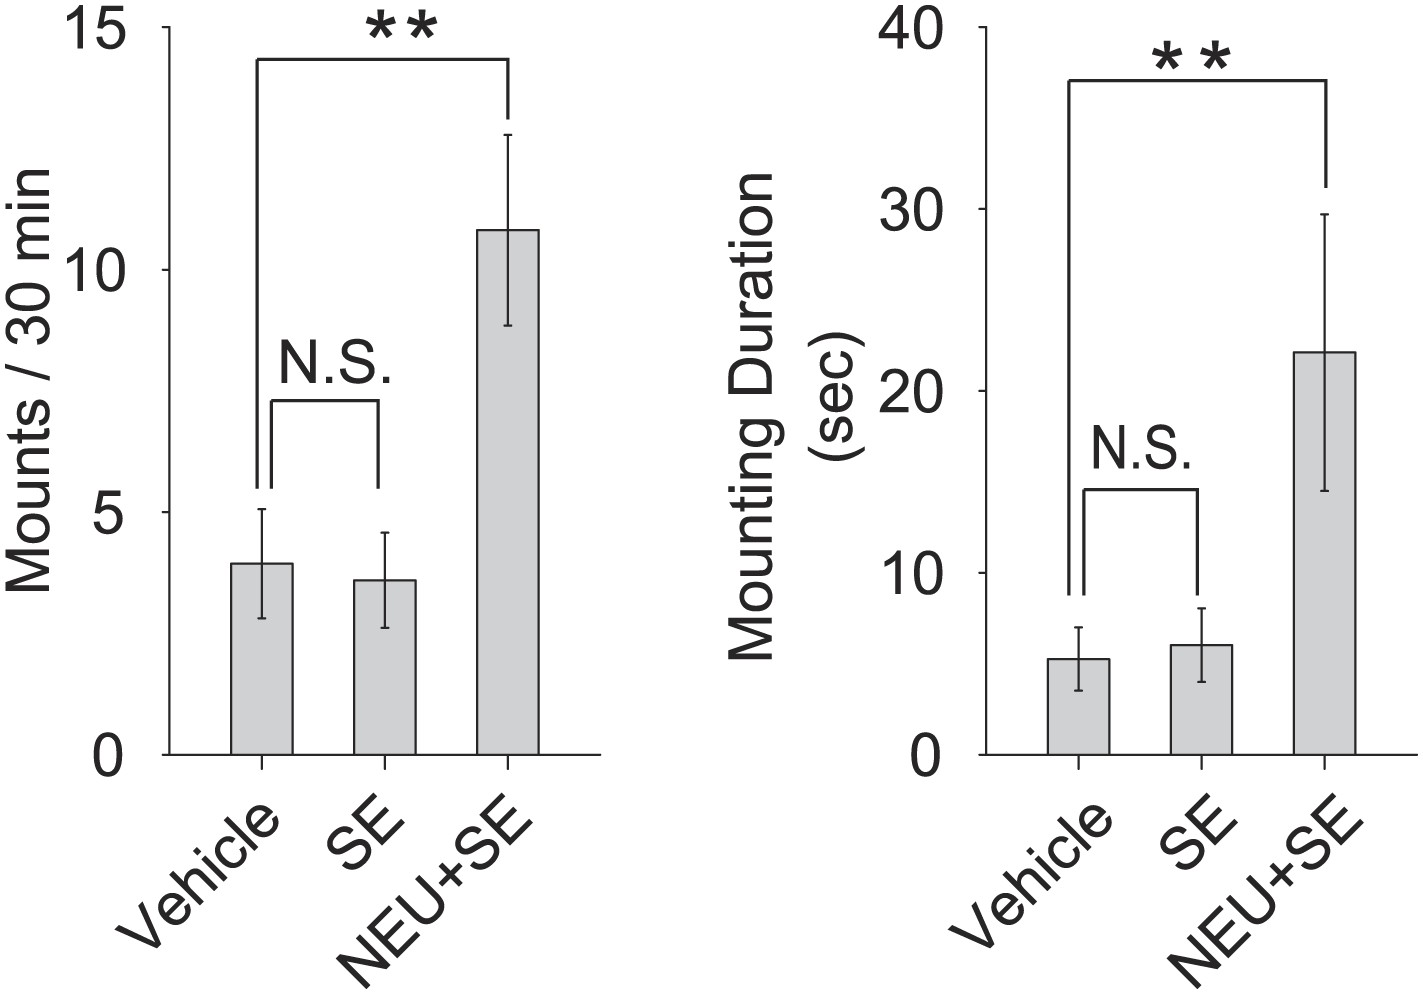
Sulfated estrogens promote courtship in conjunction with NEU.
The number (left panel), duration (middle panel) and latency (right panel) of mounting behavior of sexually naïve males toward the females painted with either vehicle, SE or non-estrus urine (NEU)+SE. The vehicle control is the same as in Figure 1A. Error bars, SEM; n = 10 for SE, n = 16 for NEU+SE; **p<0.01.
Additional files
-
Supplementary file 1
Summary of degenerate PCR primers.
List of primers designed against different clade members of the V1r and V2r families of genes.
- https://doi.org/10.7554/eLife.03025.022
-
Supplementary file 2
Coverage of degenerate primers.
Receptor genes identified from degenerate RT-PCR using whole VNO and single cells. Results from single cells are pooled from multiple experiments. In the Coverage column, bold face numbers indicate 100% coverage of the clade members and italicized numbers indicate coverage lower than 50%.
- https://doi.org/10.7554/eLife.03025.023
-
Supplementary file 3
Sulfated steroids tested.
List of the Steraloids IDs and names of sulfated steroids tested in the experiments.
- https://doi.org/10.7554/eLife.03025.024
Download links
A two-part list of links to download the article, or parts of the article, in various formats.
Downloads (link to download the article as PDF)
Open citations (links to open the citations from this article in various online reference manager services)
Cite this article (links to download the citations from this article in formats compatible with various reference manager tools)
Integrated action of pheromone signals in promoting courtship behavior in male mice
eLife 3:e03025.
https://doi.org/10.7554/eLife.03025


