Enhancement of encoding and retrieval functions through theta phase-specific manipulation of hippocampus
- Picower Institute for Learning and Memory, Massachusetts Institute of Technology, United States
- Massachusetts Institute of Technology, United States
Figures
Figure 1
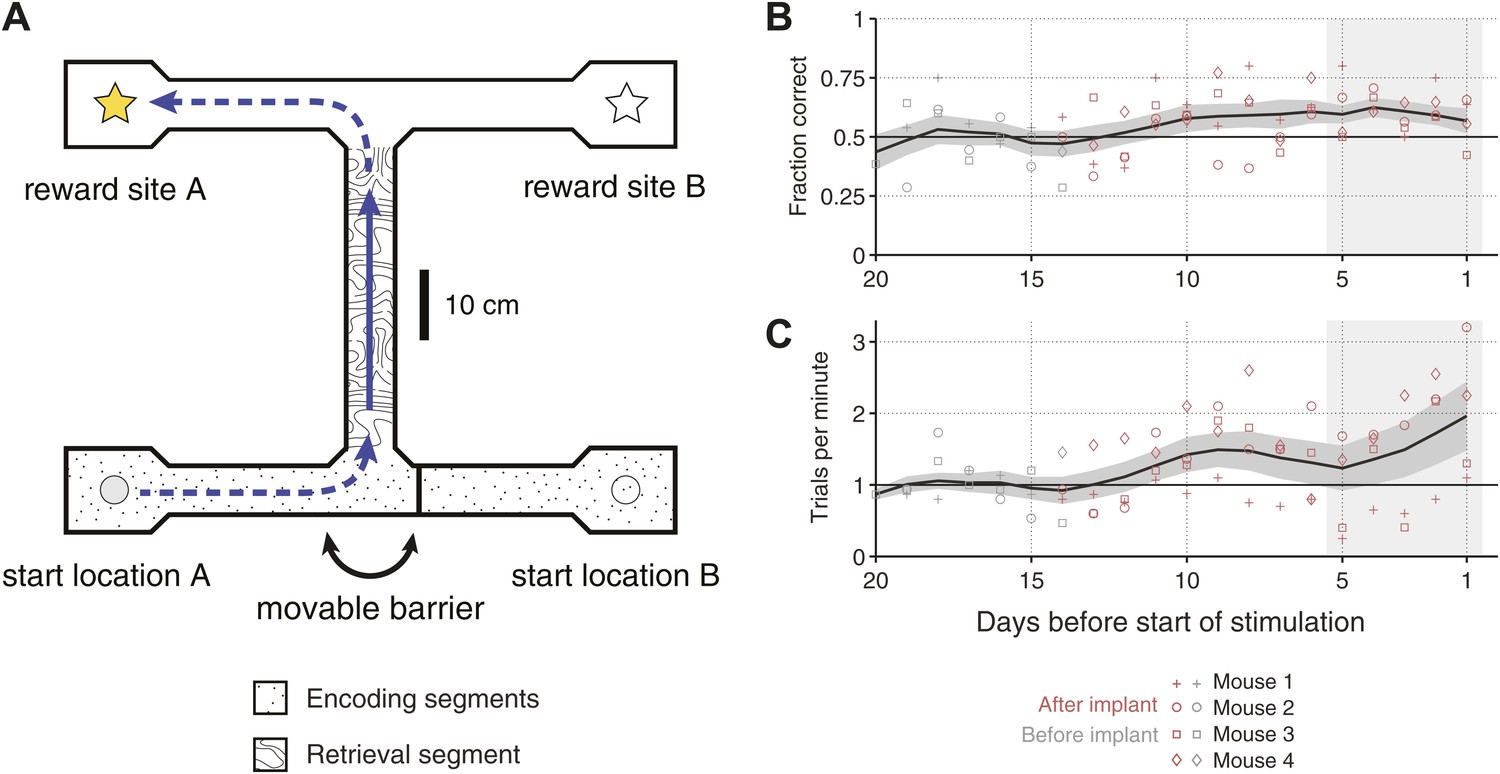
Overview of the behavioral task.
(A) Scale drawing of the end-to-end T-maze used in all experiments. On each trial, mice navigate through the ‘retrieval segment’ in the direction of the solid arrow and must choose between one of two reward sites. Reward is delivered for trajectories that involve two turns in the same direction (e.g., the ‘left/left’ trajectory shown). Once the reward site is reached, mice must travel back to one of two start locations in order to initiate the next trial. A movable barrier determines the start location for that trial, and hence which reward site will contain the food pellet. The barrier is repositioned randomly after each visit to a reward site (whether correct or incorrect). A second barrier (not shown) prevents mice from navigating between reward sites after a decision has been made. The maze is surrounded by 10 cm walls made of clear acrylic, through which distal cues are visible. (B) Fraction of correct trials in each session leading up to the start of optogenetic stimulation for N = 4 individual mice (open shapes) and the mean ± SEM. across all subjects (5-day running average). In the 5 days before the start of optogenetic stimulation (shaded region), all mice perform significantly above chance (p<0.05, based on p.d.f. of the binomial distribution with probability of 0.5). (C) Trials per minute for the same sessions as in C. Mean for last 5 days (shaded region) is 36.1 ± 18.3 trials per session per mouse.
Figure 2
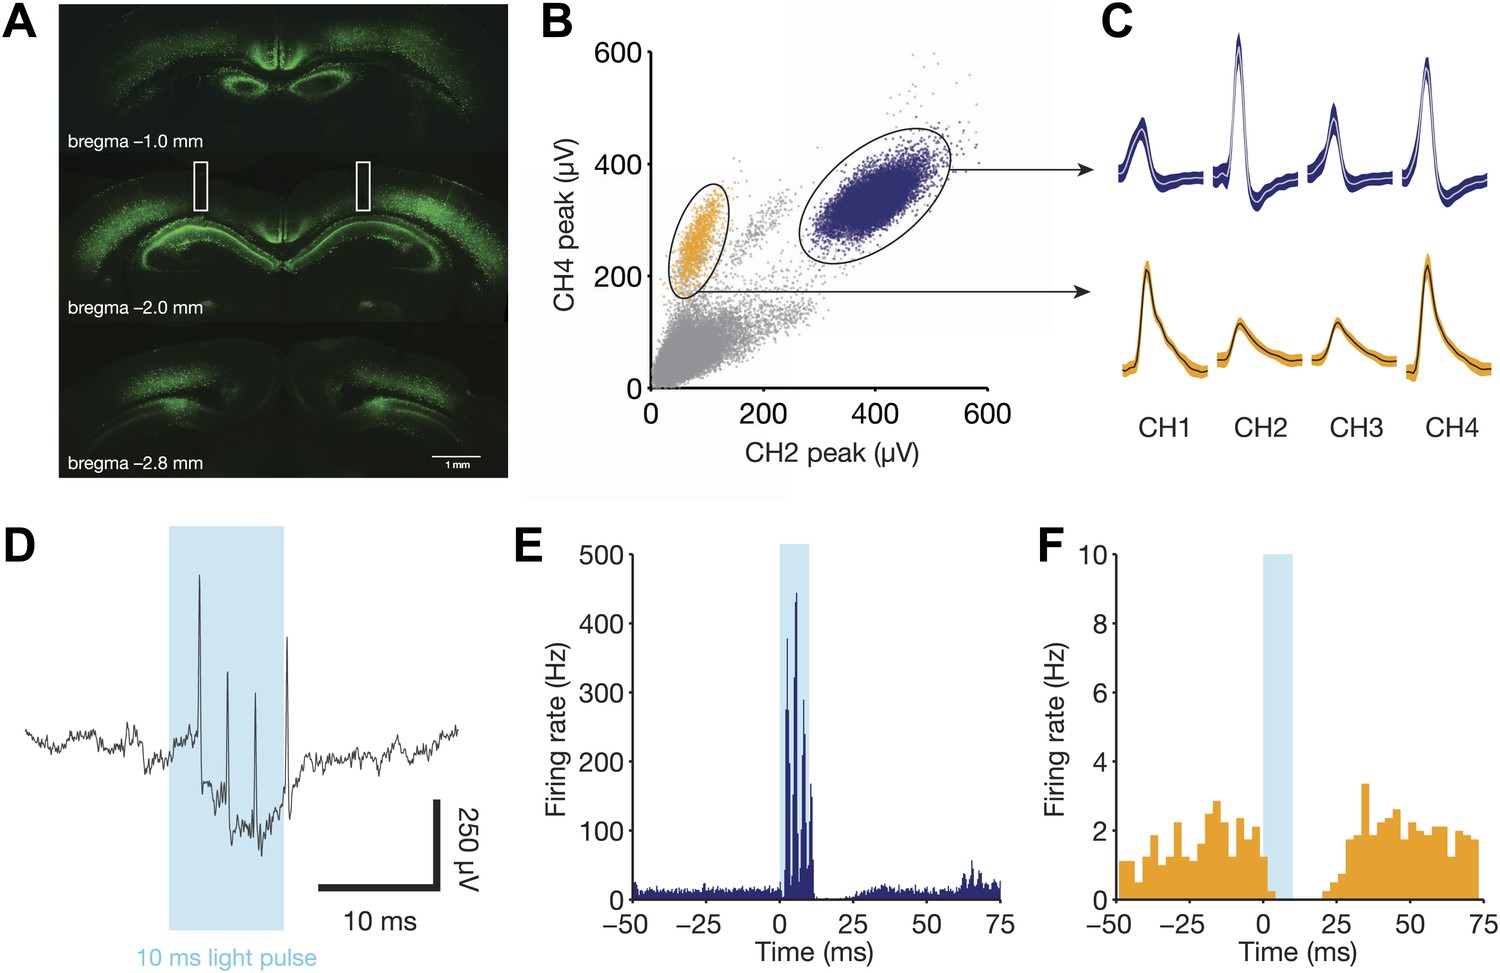
Direct recruitment of fast-spiking inhibition with light.
(A) Expression of ChR2-EYFP throughout the dorsal hippocampus. Note the strong labeling in stratum pyramidale, indicative of dense PV+ projections in this layer. Bilateral fiber optic lesions are marked with white rectangles, centered at ∼2 mm posterior to bregma and ∼1.75 mm lateral to the midline. (B) Projection plot of peak heights from a CA1 electrode containing a well-isolated fast-spiking unit (blue) and a well-isolated regular-spiking unit (yellow). (C) Mean waveforms (with SD) for each tetrode channel for the same units as in panel B. (D) Raw, broadband trace for a single trial, aligned to the 10 ms light pulse. Four light-evoked spikes from the fast-spiking unit are clearly identifiable. (E) Peri-stimulus time histogram for the fast-spiking unit in B, C, and D, aligned to the start of each light pulse (N = 1106 pulses from one session). This unit responds with 3–4 spikes per stimulus, then remains silent for a period of ∼15 ms following light offset. (F) Peri-stimulus time histogram for the regular-spiking unit in B and C, aligned to the start of each light pulse (N = 1106 pulses from one session). This unit is silenced for ∼25 ms following light onset.
Figure 3

Properties of theta-triggered stimulation.
(A) Schematic of steps involved in delivering closed-loop feedback. An event occurs in the brain (bottom), which is detected and digitized by the Open Ephys recording hardware (left), and sent to software for analysis (top). When the target event is detected, the software activates an LED (right) which delivers light to brain via implanted fiber optic cables (bottom). (B) Examples of raw and theta-bandpassed LFP during baseline trials (top), peak-triggered stimulation trials (middle), and trough-triggered stimulation trials (bottom). Vertical blue bars indicate the time at which 10 ms light pulses occur on each cycle. (C) Distribution of delays between detection of the actual theta peak (purple) or trough (teal) and the time of stimulus delivery. (D) Distribution of actual theta phases at which stimulation occurred, for both peak (purple) and trough (teal) trials. Peak-triggered stimulation tends to occur during the falling phase of theta, whereas trough-triggered stimulation occurs around the actual trough and rising phase. Phase was calculated for data filtered offline between 4 and 12 Hz, to eliminate the phase delays inherent in online filtering. (E) Distribution of pulses per trial for the retrieval segment of the track. (F) Same as E, but for encoding segments of the track. (G) Occupancy times in different segments of the track for trials with retrieval-segment stimulation. Values for peak-triggered and trough-triggered stimulation are shown in purple and teal, respectively (mean ± SD for N = 4 mice; ** = occupancy time decreased significantly for one mouse, p<0.005, Wilcoxon rank sum test with Bonferroni correction). (H) Occupancy times in different segments of the track for trials with encoding-segment stimulation. Values for peak and trough-triggered stimulation are shown in purple and teal, respectively (mean ± SD for N = 4 mice; ** = occupancy time decreased significantly for one mouse, p<0.005; † = occupancy time increased significantly for one mouse, and decreased significantly for a different mouse, p<0.05; Wilcoxon rank sum test with Bonferroni correction).
Figure 4
Electrophysiological changes induced by theta-triggered stimulation.
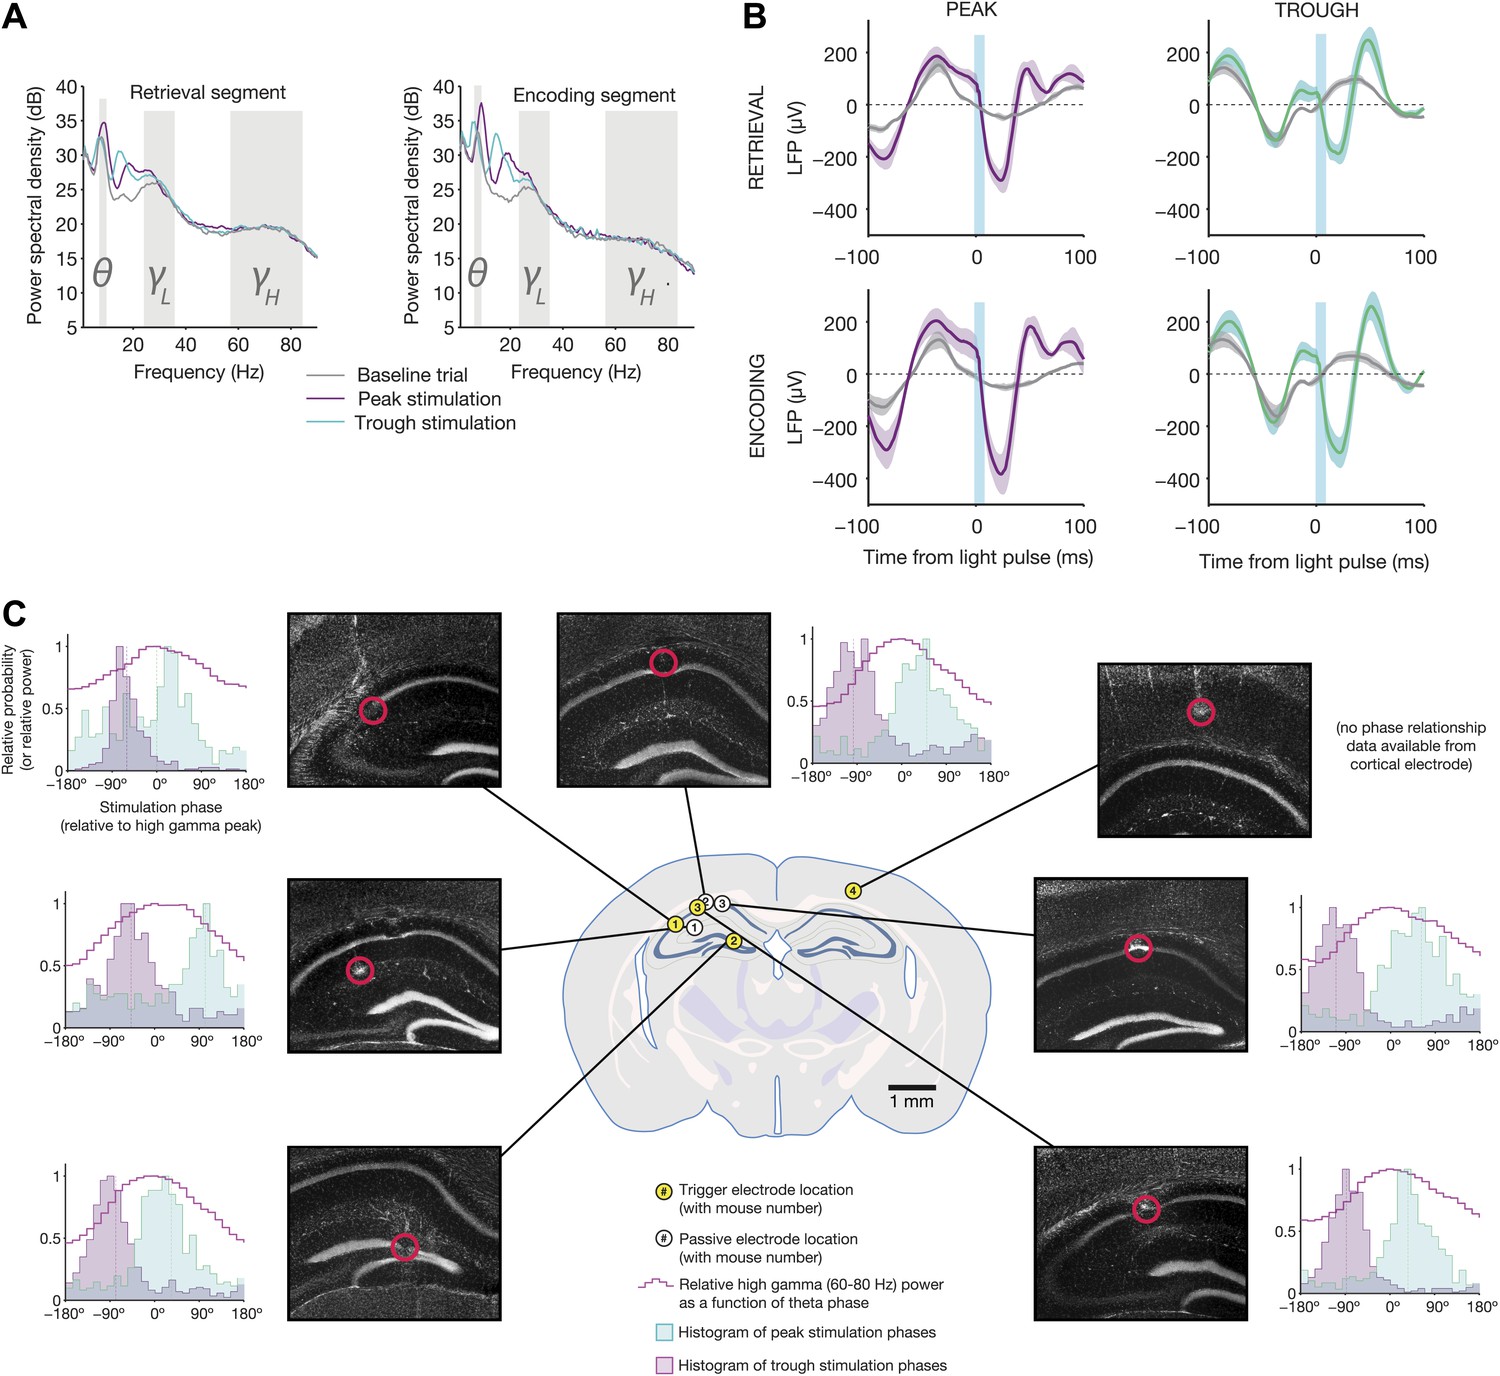
(A) Mean power spectra for baseline, peak-triggered stimulation, and trough-triggered stimulation trials, while mice were in the retrieval segment heading toward the reward arm (left) or the encoding segment prior to entering the trial start location at the end of the sample arm (right) (N = 4 electrodes from four mice used for triggering online feedback). Theta, low gamma, and high gamma frequency bands are highlighted. (B) Average light-evoked LFP response from N = 3 hippocampal electrodes for peak and trough-triggered stimulation trials (purple and teal traces, respectively), for both encoding and retrieval epochs (mean ± SEM). Gray traces indicate the average theta waveforms for baseline trials, aligned to the time a stimulus would have occurred, but for which no actual light pulse was present. (C) Locations of trigger electrodes (yellow) and passive recording electrodes (white) for four mice used in this experiment. The location of each lesion is indicated by red circles superimposed over histological sections (DAPI stain, grayscale image of blue channel). Next to each of the images is a histogram of peak and trough stimulation phases, relative to the peak of high gamma power on that electrode for baseline (no stimulation) trials (indicated by 0°). High gamma power (a signature of synchronization between hippocampus and medial entorhinal cortex (Colgin et al., 2009), provides an absolute indication of theta phase, against which the time of our optogenetic stimulation can be compared. In all electrodes (except for the one trigger electrode in cortex, where high gamma was not measured), trough stimulation occurs after the peak of high gamma power, while peak stimulation occurs before the peak of high gamma.
Figure 5
Behavioral modulation depends on both theta phase and task segment.
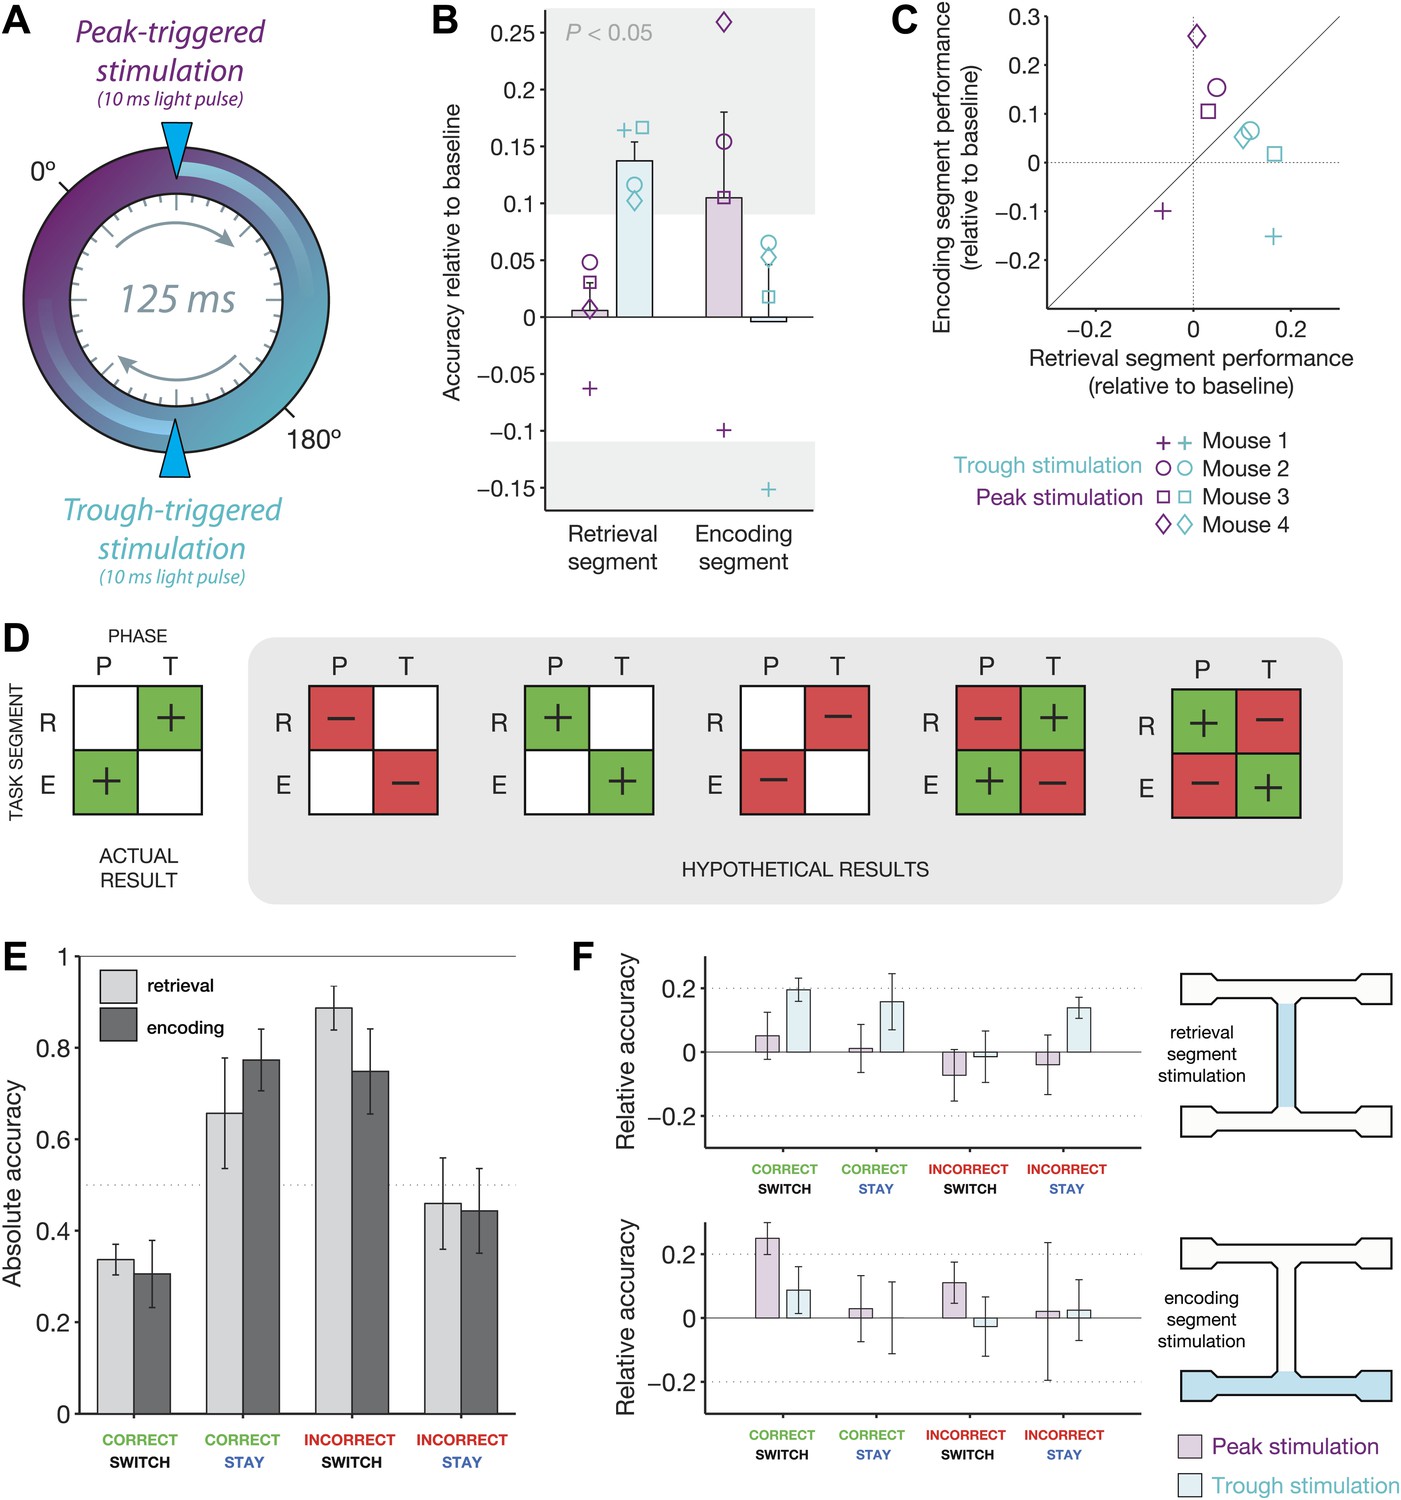
(A) Illustration of the two manipulations performed in this experiment. On any given ‘non-baseline’ trial, stimulation was triggered by the peak (purple phase) or trough (teal phase) of the 4–12 Hz theta rhythm. The resulting light pulses recruited inhibition for ∼25 ms, or approximately 1/5 of the 125 ms theta cycle. (B) Accuracy relative to baseline for four mice in four conditions: optogenetic stimulation triggered at the peak (purple) or trough (teal) of theta, in either the retrieval (left) or encoding (right) segments of the track. Mean ± SEM, with results for each mouse overlaid. Individual results in the gray regions are significantly different from baseline (p<0.05, p.d.f. of binomial distribution with probability equal to baseline accuracy). (C) Same data as in b, but represented on the same axes. Note that peak-triggered stimulation in the encoding segment consistently improves performance more than the same type of stimulation in the retrieval segment (points above diagonal line). The opposite effects are seen for trough-triggered stimulation. (D) Schematic of all possible ‘double-dissociation’ scenarios used for establishing bootstrap significance levels of the actual result. (E) Performance on baseline (no stimulation) trials for four different trial types: (1) mice are cued to switch arms after a correct choice (correct/switch), (2) mice are cued to return to the same arm after a correct choice (correct/stay), (3) mice are cued to switch arms after an incorrect choice (incorrect/switch), and (4) mice are cued to return to the same arm after an incorrect choice. Trials are grouped by retrieval stimulation or encoding stimulation conditions. For both conditions, changing trial type has a significant effect on performance: retrieval stimulation, χ2 = 8.4, p=0.038; encoding stimulation, χ2 = 8.1, p=0.044; Friedman test (nonparametric, repeated-measures ANOVA). (F) Change in performance with the addition of closed-loop optogenetic stimulation for the four trial types in E.
Figure 6
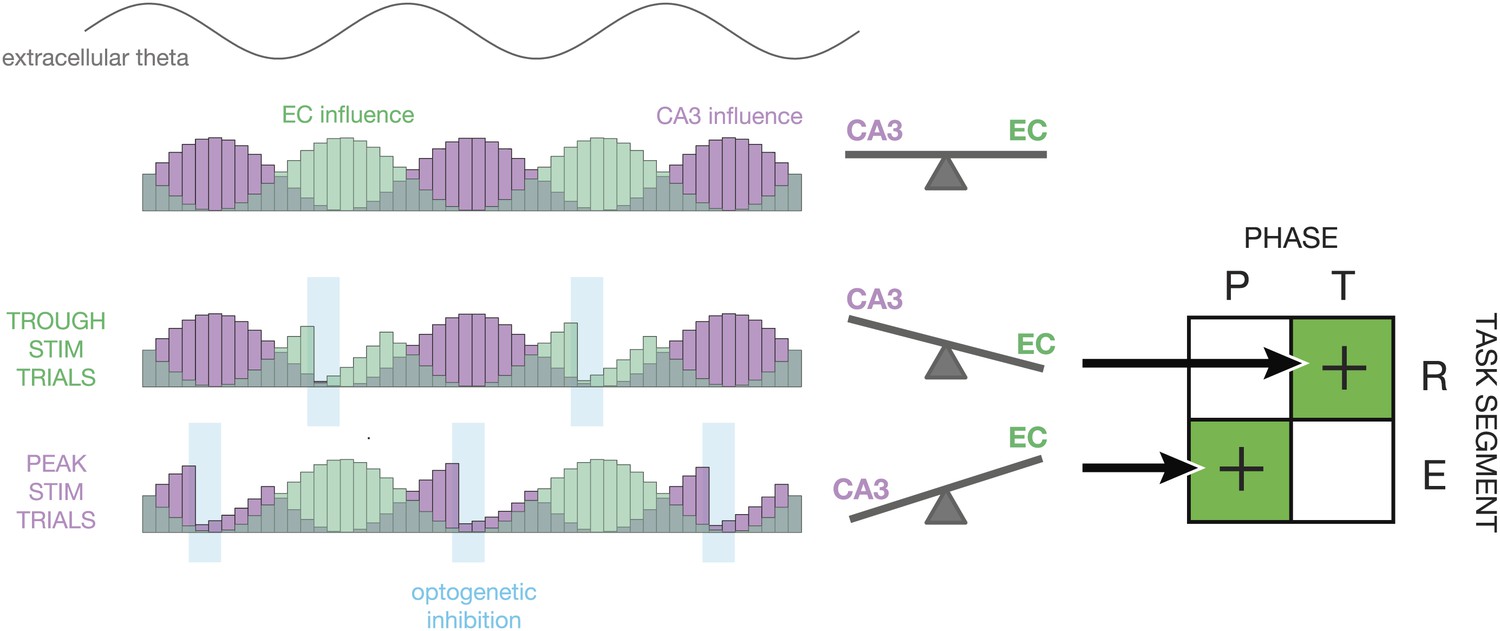
Proposed mechanism.
This diagram illustrates how the relative influence of CA3 vs entorhinal cortex (EC) inputs to CA1 could explain the experimental results. At the top, a sine wave indicates the phase of theta. Below, the purple and green histograms show the fluctuating influence of CA3 and EC on CA1 on each cycle. Levels represent averages; on individual cycles, one or the other may dominate (Colgin et al., 2009). When optogenetic inhibition is triggered on the trough of theta (T), it tends to reduce firing rates in CA1 during periods of high EC influence. This tips the balance in favor of CA3, thereby improving performance during periods of retrieval (R). When optogenetic inhibition is triggered on the peak of theta (P), it tends to reduce firing rates in CA1 during period of high CA3 influence. This tips the balance in favor of EC, thereby improving performance during periods of encoding (E). On the whole, our closed-loop manipulation may improve performance by reducing the influence task-irrelevant inputs as a function of both theta phase and maze region.
Tables
Table 1
Results for individual mice
| Retrieval | Encoding | |||||
|---|---|---|---|---|---|---|
| Baseline | Peak | Trough | Baseline | Peak | Trough | |
| Mouse 1 | 0.55 | 0.49 | 0.71 | 0.58 | 0.48 | 0.43 |
| p=0.09 | P=0.02 | p=0.07 | P=0.02 | |||
| Mouse 2 | 0.52 | 0.57 | 0.64 | 0.60 | 0.75 | 0.66 |
| p=0.09 | P=0.02 | P=0.01 | p=0.06 | |||
| Mouse 3 | 0.50 | 0.53 | 0.67 | 0.62 | 0.73 | 0.64 |
| p=0.10 | P=0.01 | P=0.03 | p=0.11 | |||
| Mouse 4 | 0.72 | 0.73 | 0.82 | 0.56 | 0.82 | 0.62 |
| p=0.12 | P=0.04 | P=0.0001 | p=0.08 | |||
-
Probability of a correct response for four mice under six conditions: baseline (no stimulation), peak-triggered stimulation, and trough-triggered stimulation in both the retrieval and encoding segments. p-values computed from the p.d.f. of the binomial distribution with chance levels equal to the baseline performance for that mouse. Significant changes (p<0.05) are highlighted in bold.
Download links
A two-part list of links to download the article, or parts of the article, in various formats.
Downloads (link to download the article as PDF)
Open citations (links to open the citations from this article in various online reference manager services)
Cite this article (links to download the citations from this article in formats compatible with various reference manager tools)
Enhancement of encoding and retrieval functions through theta phase-specific manipulation of hippocampus
eLife 3:e03061.
https://doi.org/10.7554/eLife.03061


