The transcriptional response to tumorigenic polarity loss in Drosophila
- University of California, Berkeley, United States
- Department of Biological Sciences, United States
Figures
Figure 1 with 1 supplement
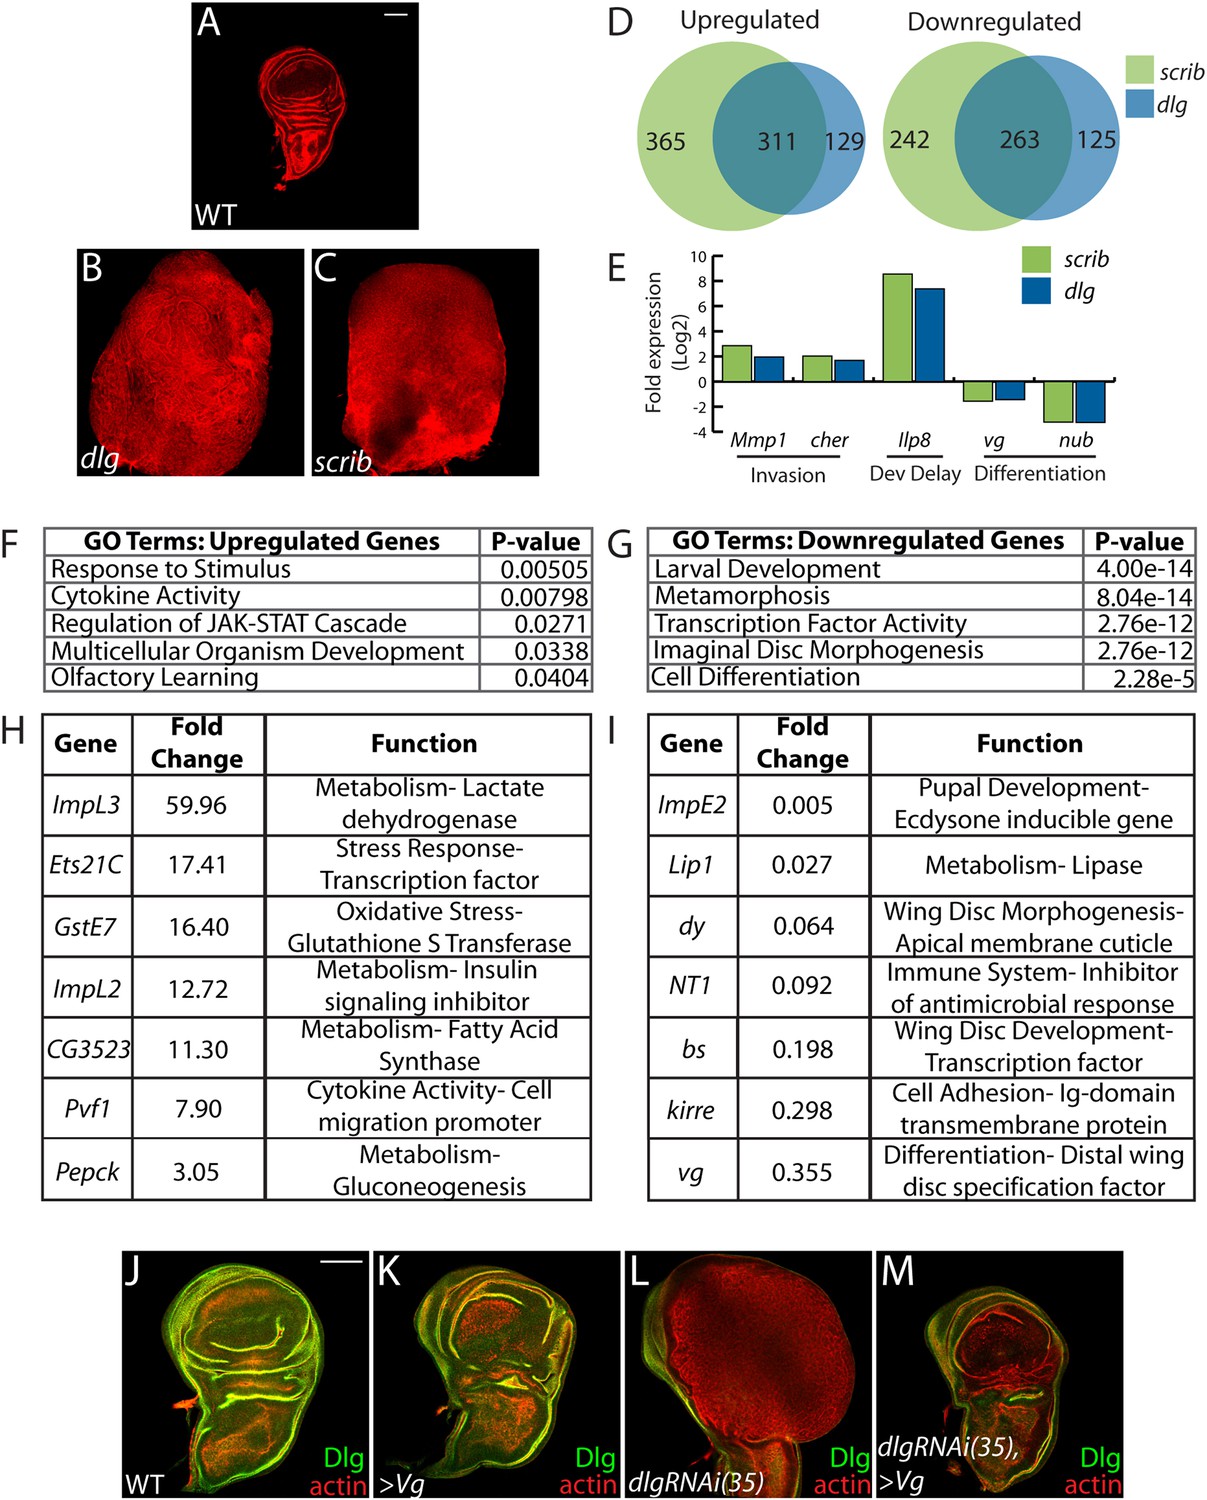
Transcriptome analysis of neoplastic tumors.
(A–C) F-actin staining reveals dramatic overgrowth and architecture defects of neoplastic dlg and scrib wing discs relative to WT. (D) Overlap of genes upregulated (left) or downregulated (right) in scrib and dlg tissues. (E) Genes previously implicated in neoplastic characteristics are differentially expressed. (F and G) Functional categories enriched in the upregulated and downregulated genes include markers of stress response and JAK/STAT pathway activation, and de-differentiation respectively. Selected overexpressed (H) and underexpressed (I) genes are shown. (J–M) Overexpression of Vg suppresses dlgRNAi-driven overgrowth and architecture defects. Dlg staining (green) demonstrates survival of Dlg-depleted wing cells. Scale bars: 100 μm.
Figure 1—figure supplement 1
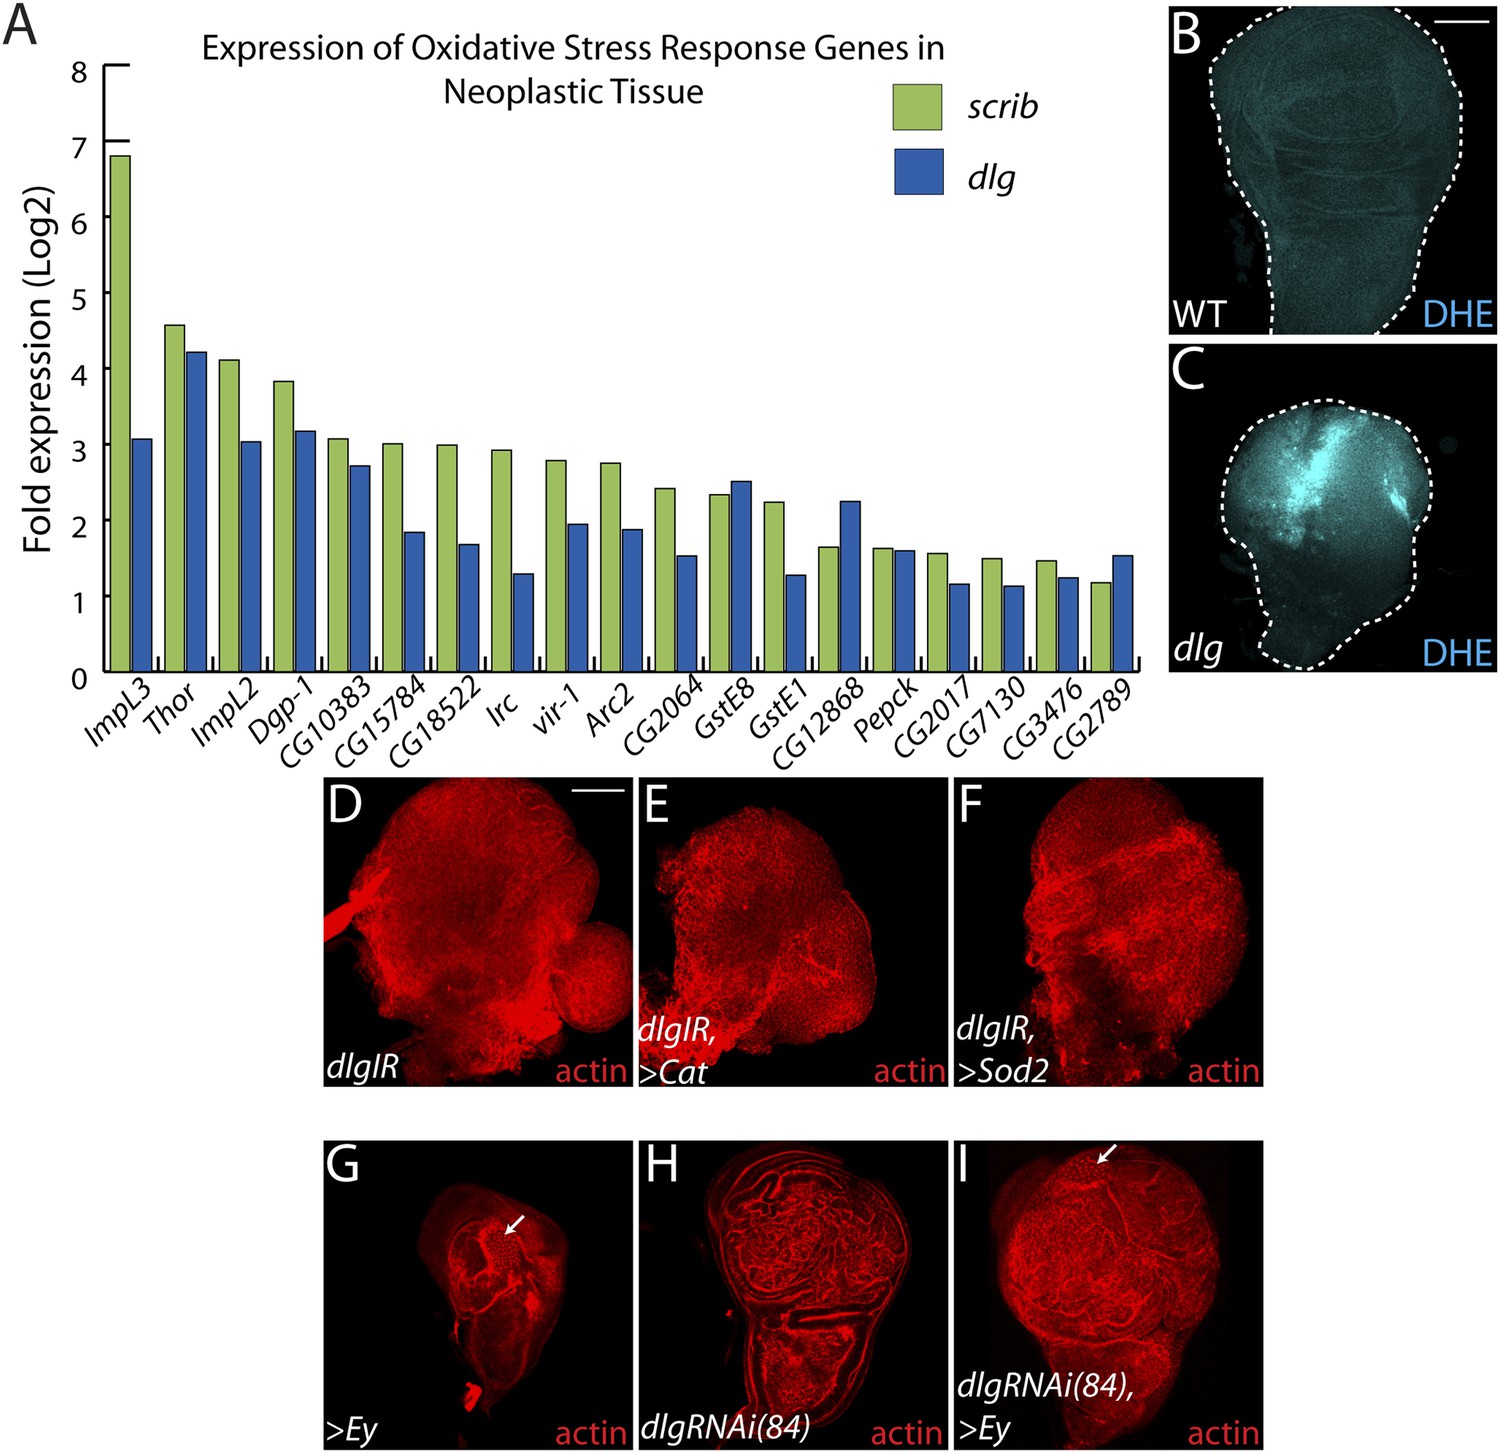
Decreasing oxidative stress or reexpressing eyelesss does not suppress neoplasia.
(A) 19 genes activated in response to oxidative stress are significantly upregulated upon polarity loss. (B–C) Loss of dlg leads to higher superoxide levels, as evidenced by increased DHE staining, relative to WT. (D–F) Expression of the anti-oxidant enzymes Cat or Sod2 has no effect on dlgRNAi-mediated overgrowth. (G–I) Ectopic expression of eyeless (eye), a master regulator of eye differentiation, induces photoreceptor formation in a small portion of wild-type and dlgRNAi(84)-expressing discs (arrows), and is unable to block overgrowth upon polarity disruption. Scale bars: 100 μm.
Figure 2 with 1 supplement
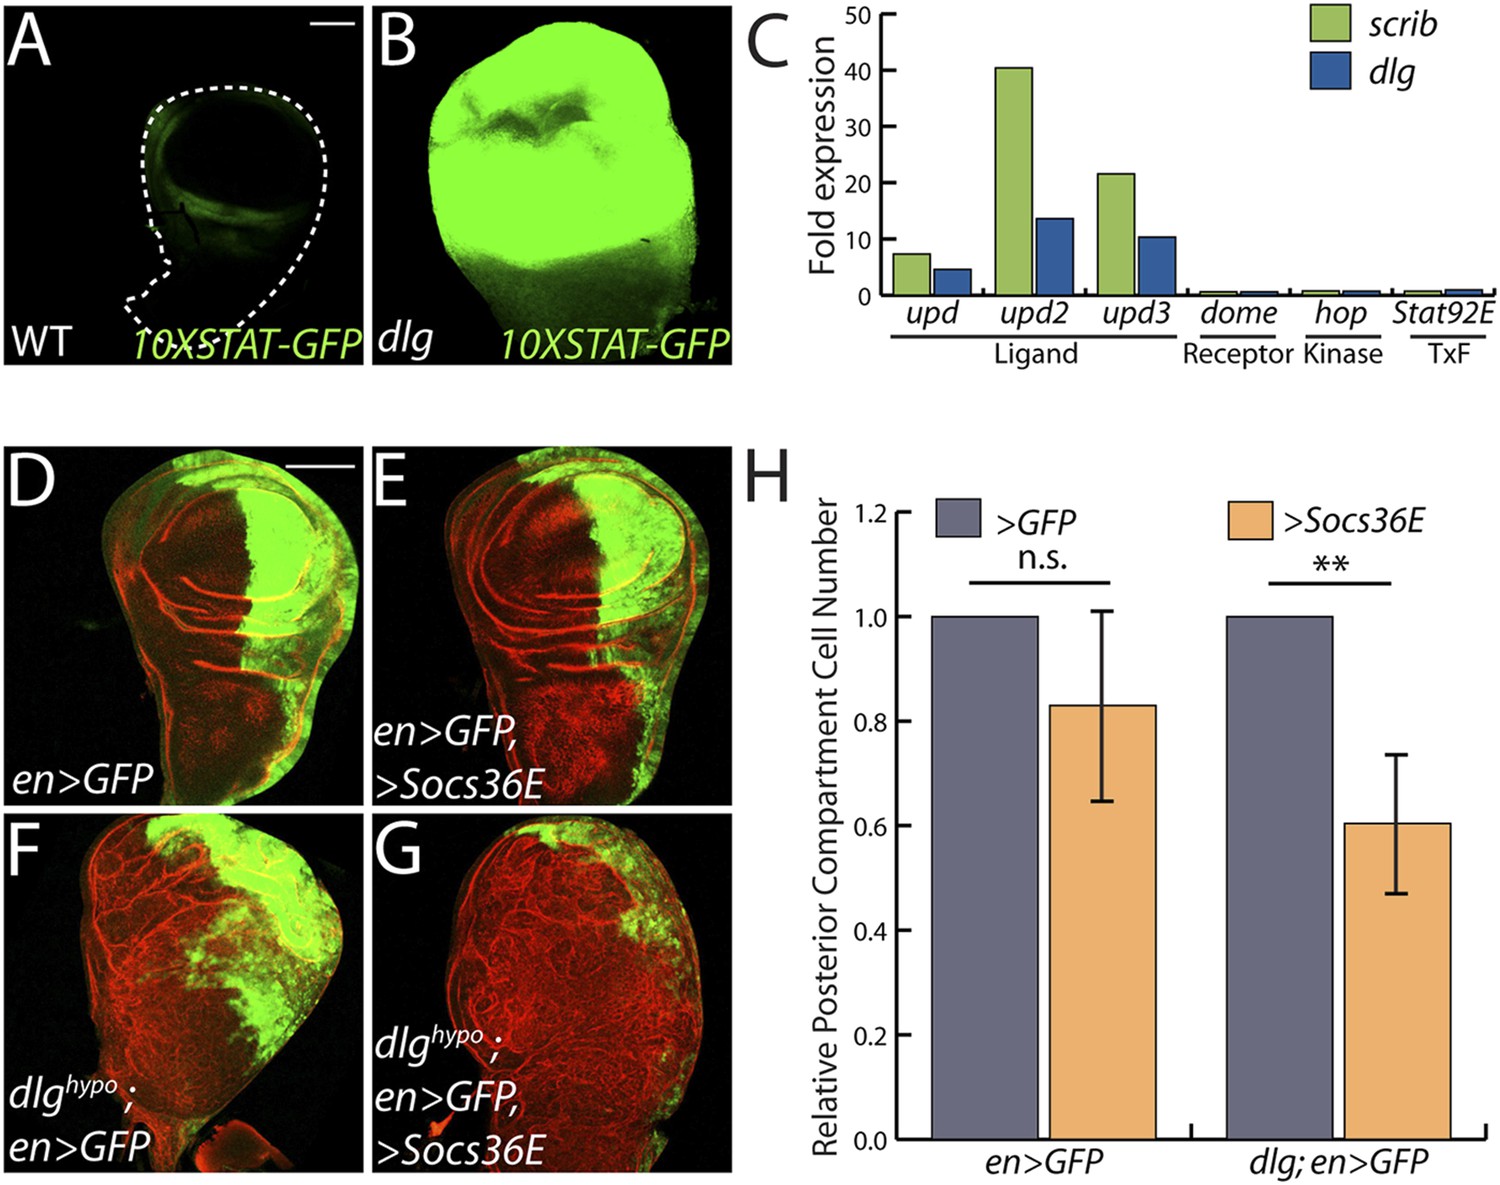
JAK/STAT activation drives overgrowth upon polarity loss.
(A and B) A JAK/STAT pathway reporter (green) is highly elevated throughout dlg as compared to WT discs, indicating strong pathway activation. (C) The ligand-encoding upd genes, but not other JAK/STAT pathway components, are transcriptionally upregulated in neoplastic tissues. (D–G) Reduction of JAK/STAT pathway activity via SOCS36E overexpression has no significant effect on WT growth, but suppresses overgrowth of dlghypo tissue. Actin (red) highlights cell outlines, while GFP (green) marks the engrailed-expressing domain. FACS-based quantification is shown in H (**p < 0.001). Scale bars: 100 μm.
Figure 2—figure supplement 1
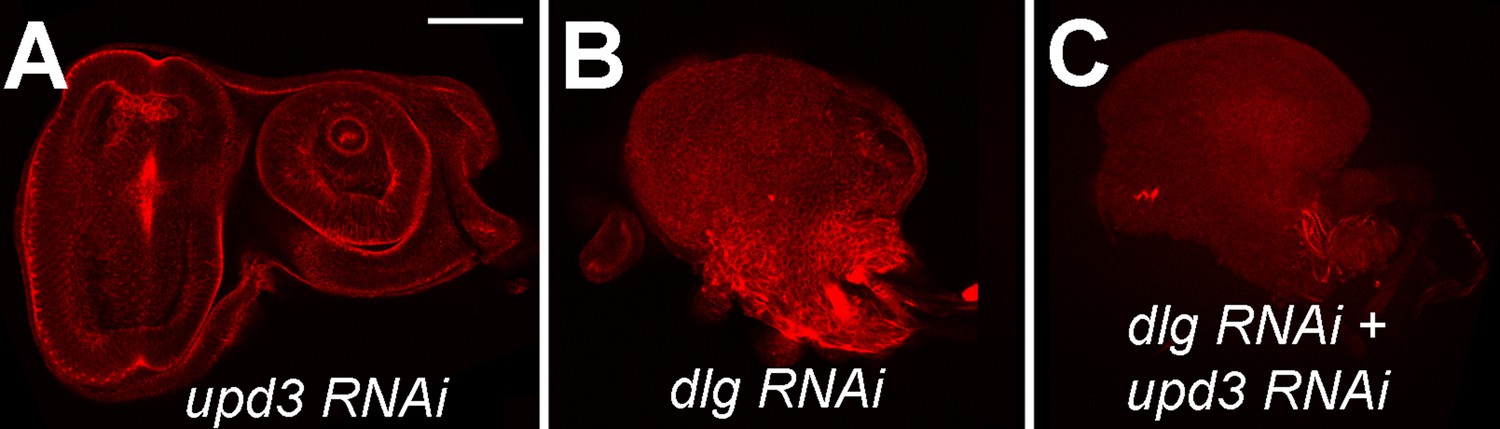
upd3 knockdown is not sufficient to prevent neoplastic tumors.
Eye imaginal discs expressing upd3 RNAi alone (A), dlg RNAi alone (B), and dlg RNAi + upd3 RNAi (C). Scale bar: 50 μm.
Figure 3 with 2 supplements
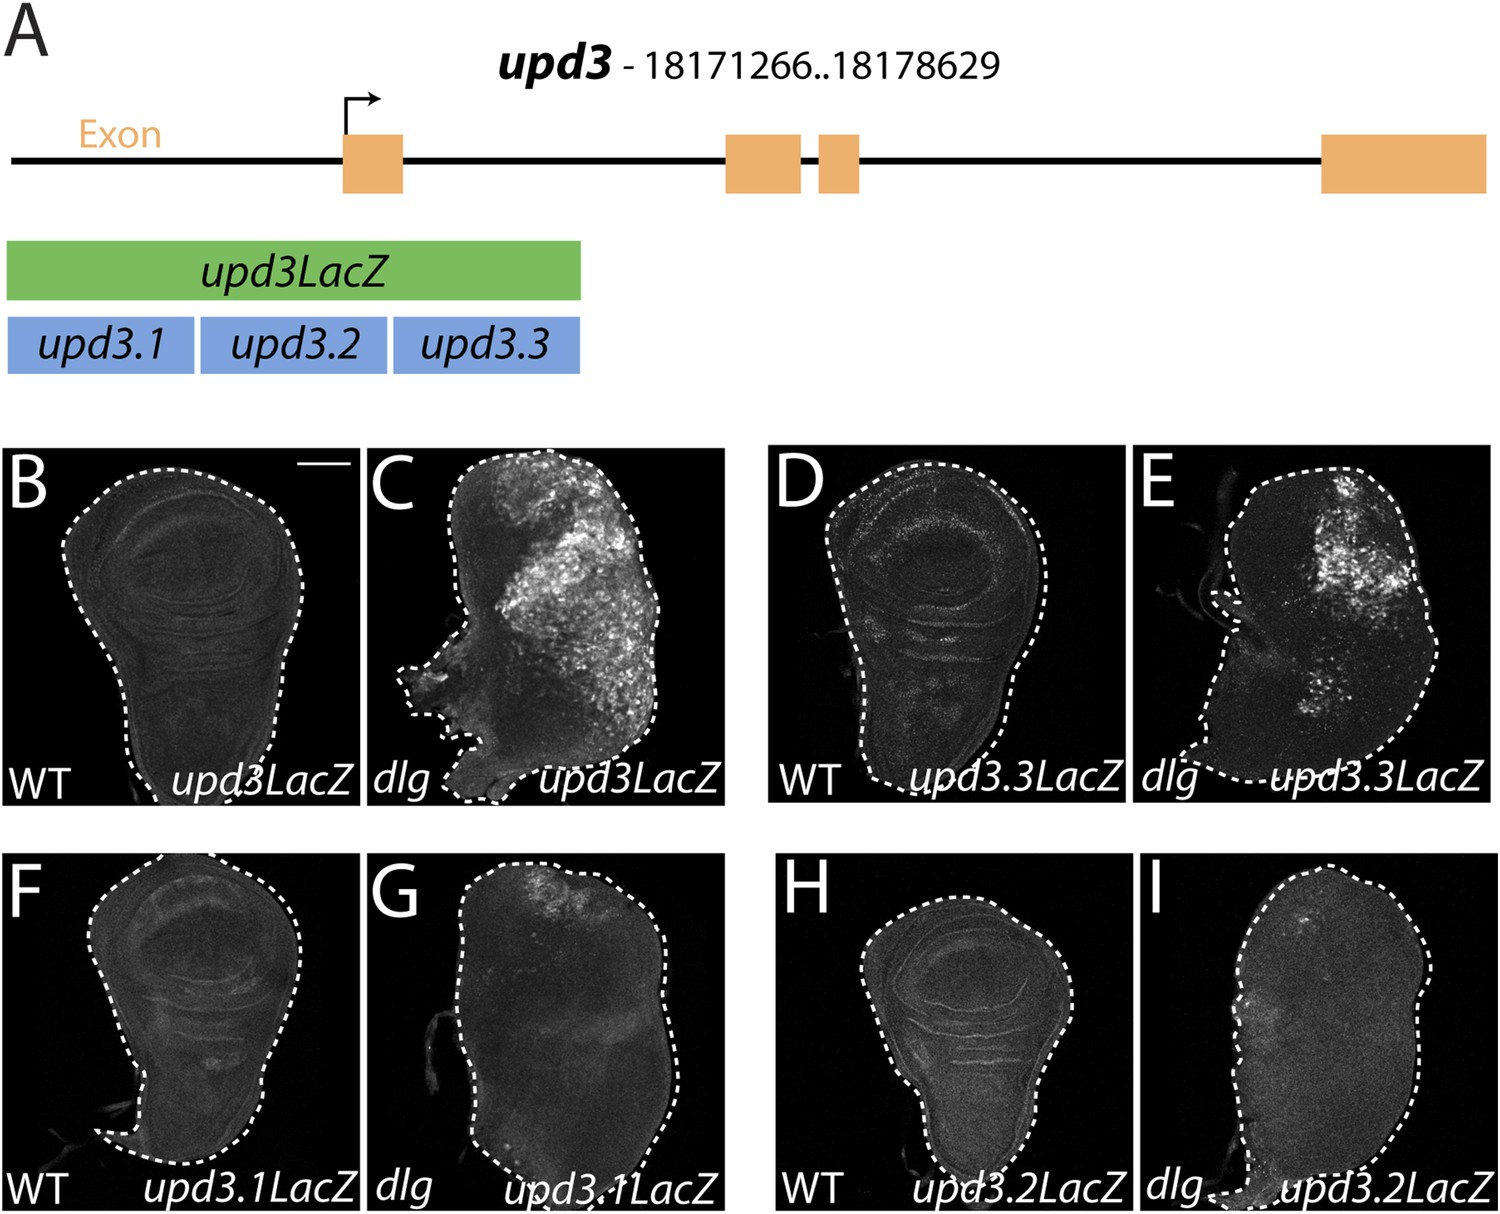
Identification of a polarity-responsive enhancer in upd3.
(A) Schematic of upd3 reporter constructs in relation to the corresponding genomic region. (B and C) 3 kb upd3LacZ is not expressed in WT, but is upregulated in dlg discs. (D and E) upd3.3LacZ sub-fragment is also silent in WT, but is upregulated in dlg like upd3LacZ. (F–I) Other sub-fragments are not significantly expressed in either WT or dlg. Scale bar: 100 μm.
Figure 3—figure supplement 1
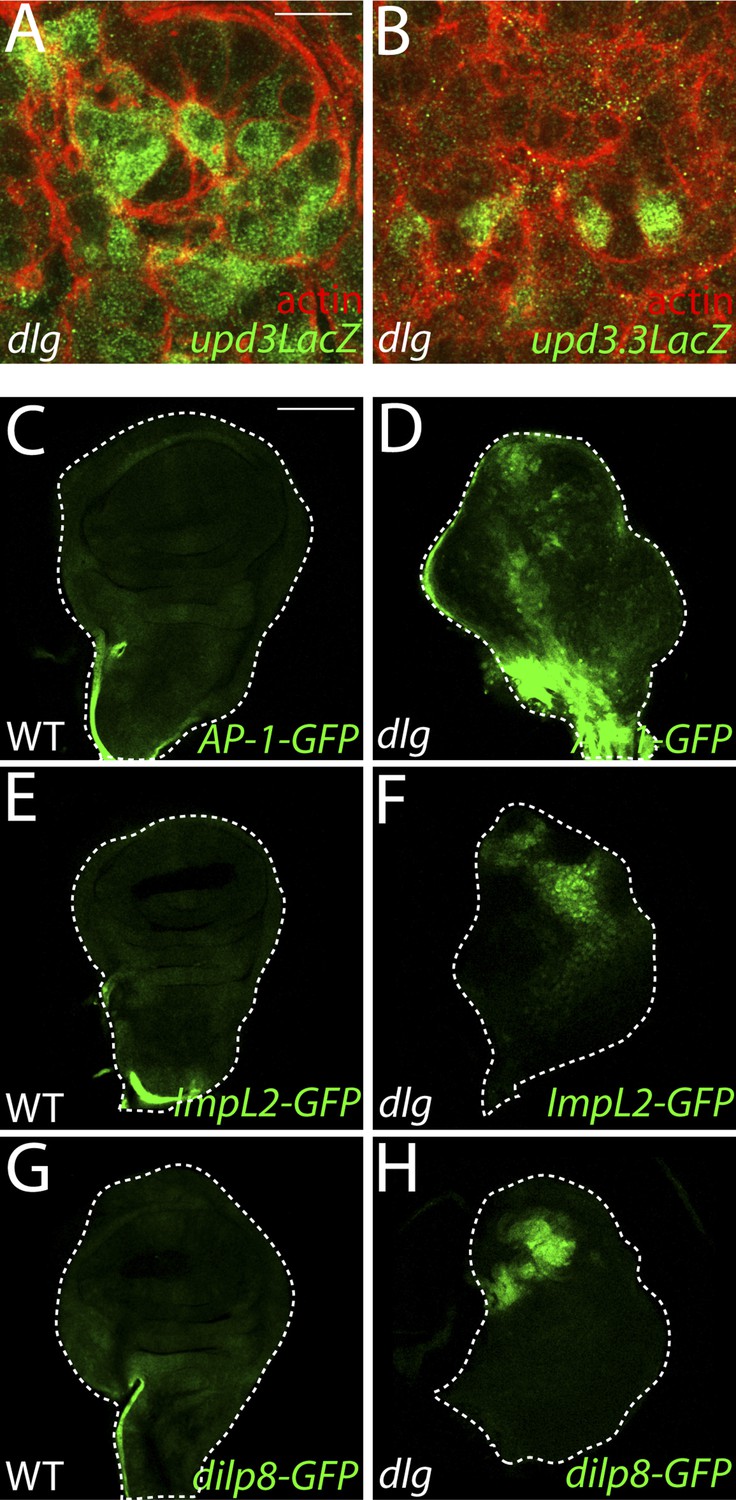
Imaginal expression of polarity-responsive target genes in neoplasia.
(A–B) The upd3LacZ and upd3.3LacZ reporters are expressed primarily in the disc proper, and not the hemocytes or the peripodial membrane. (C–H) The JNK pathway reporter AP-1-GFP, and transcriptional reporters for the polarity-sensitive targets ImpL2 and dilp8 are relatively silent in WT tissue, but active in a patchy pattern in dlg discs. Scale bars: A–B: 10 μm, C–H: 100 μm.
Figure 3—figure supplement 2
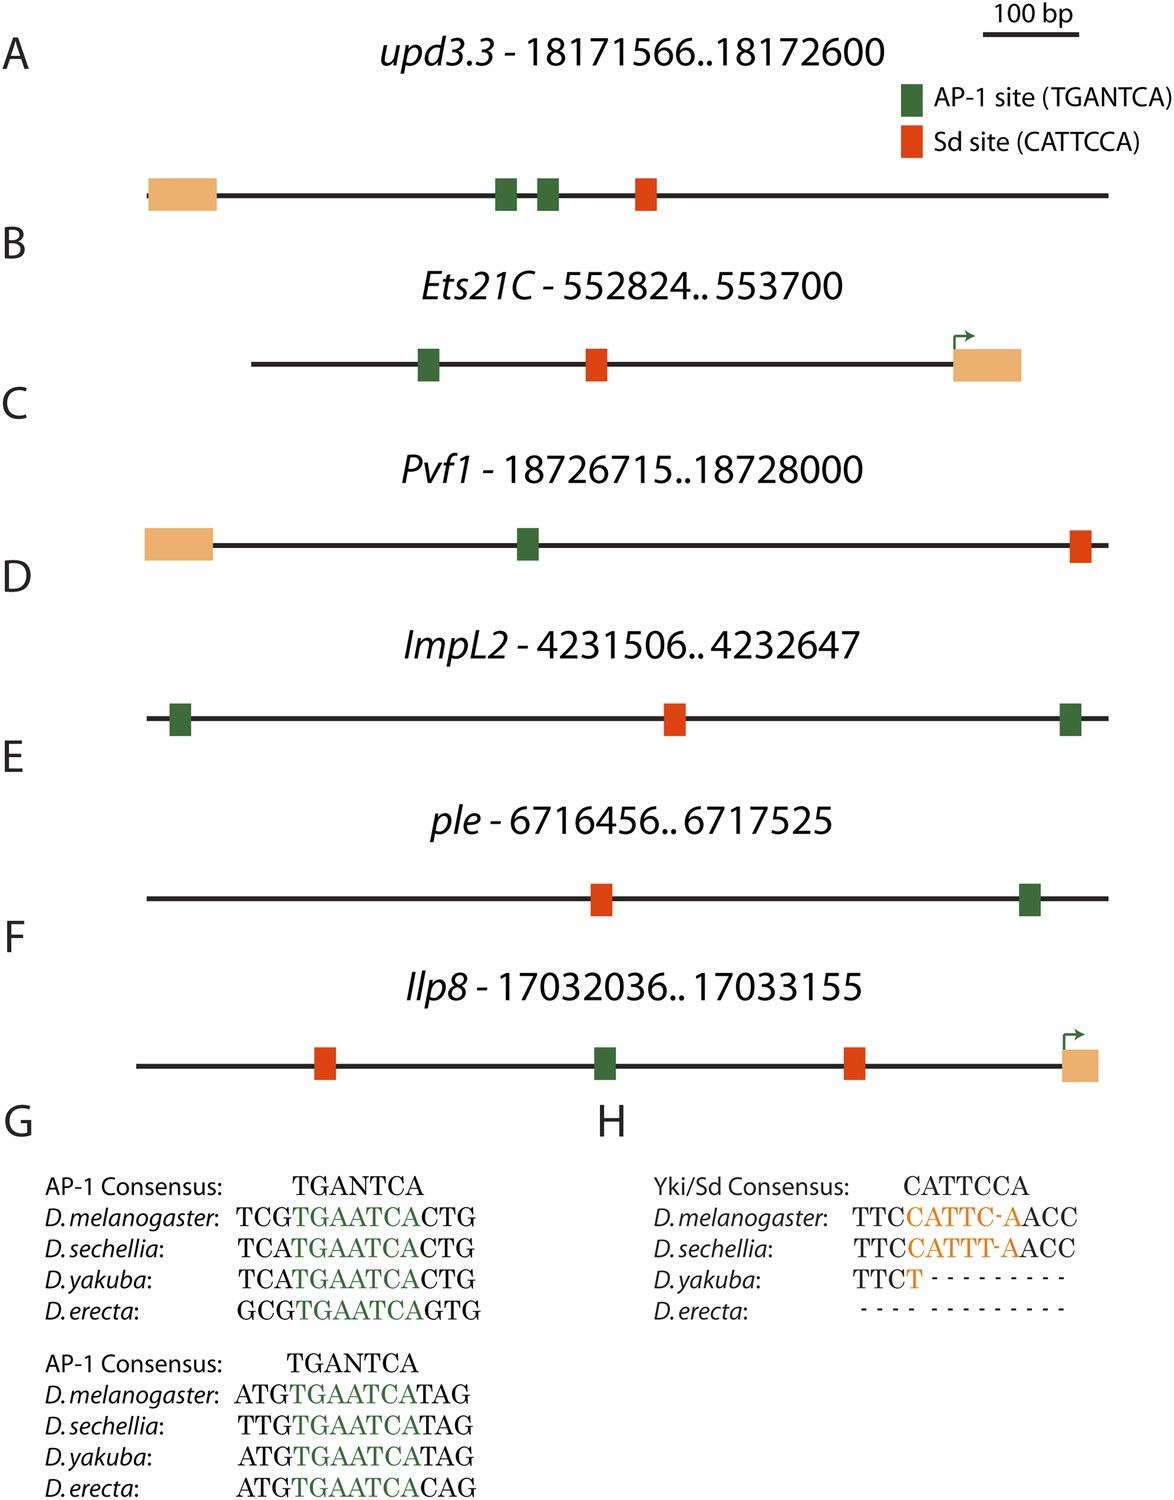
Conserved AP-1 and Sd binding sites in genes upregulated in neoplasia.
(A) The upd3.3 enhancer contains two evolutionarily conserved (between D. melanogaster, D. yakuba and D. erecta) AP-1 binding sites (green boxes), and one semi-conserved Sd binding site (red box). Conserved AP-1 and Sd binding sites are also evident in several neoplasia-induced genes that are also upregulated during wounding, including Ets21C (B), Pvf1 (C), ImpL2 (D), ple (E), and Ilp8 (F). Exons are denoted in orange and green arrows in Ets21C and Ilp8 mark the transcription start site. (G and H) The conservation of the AP-1 and Sd binding sites in upd3.3 is shown.
Figure 4 with 3 supplements
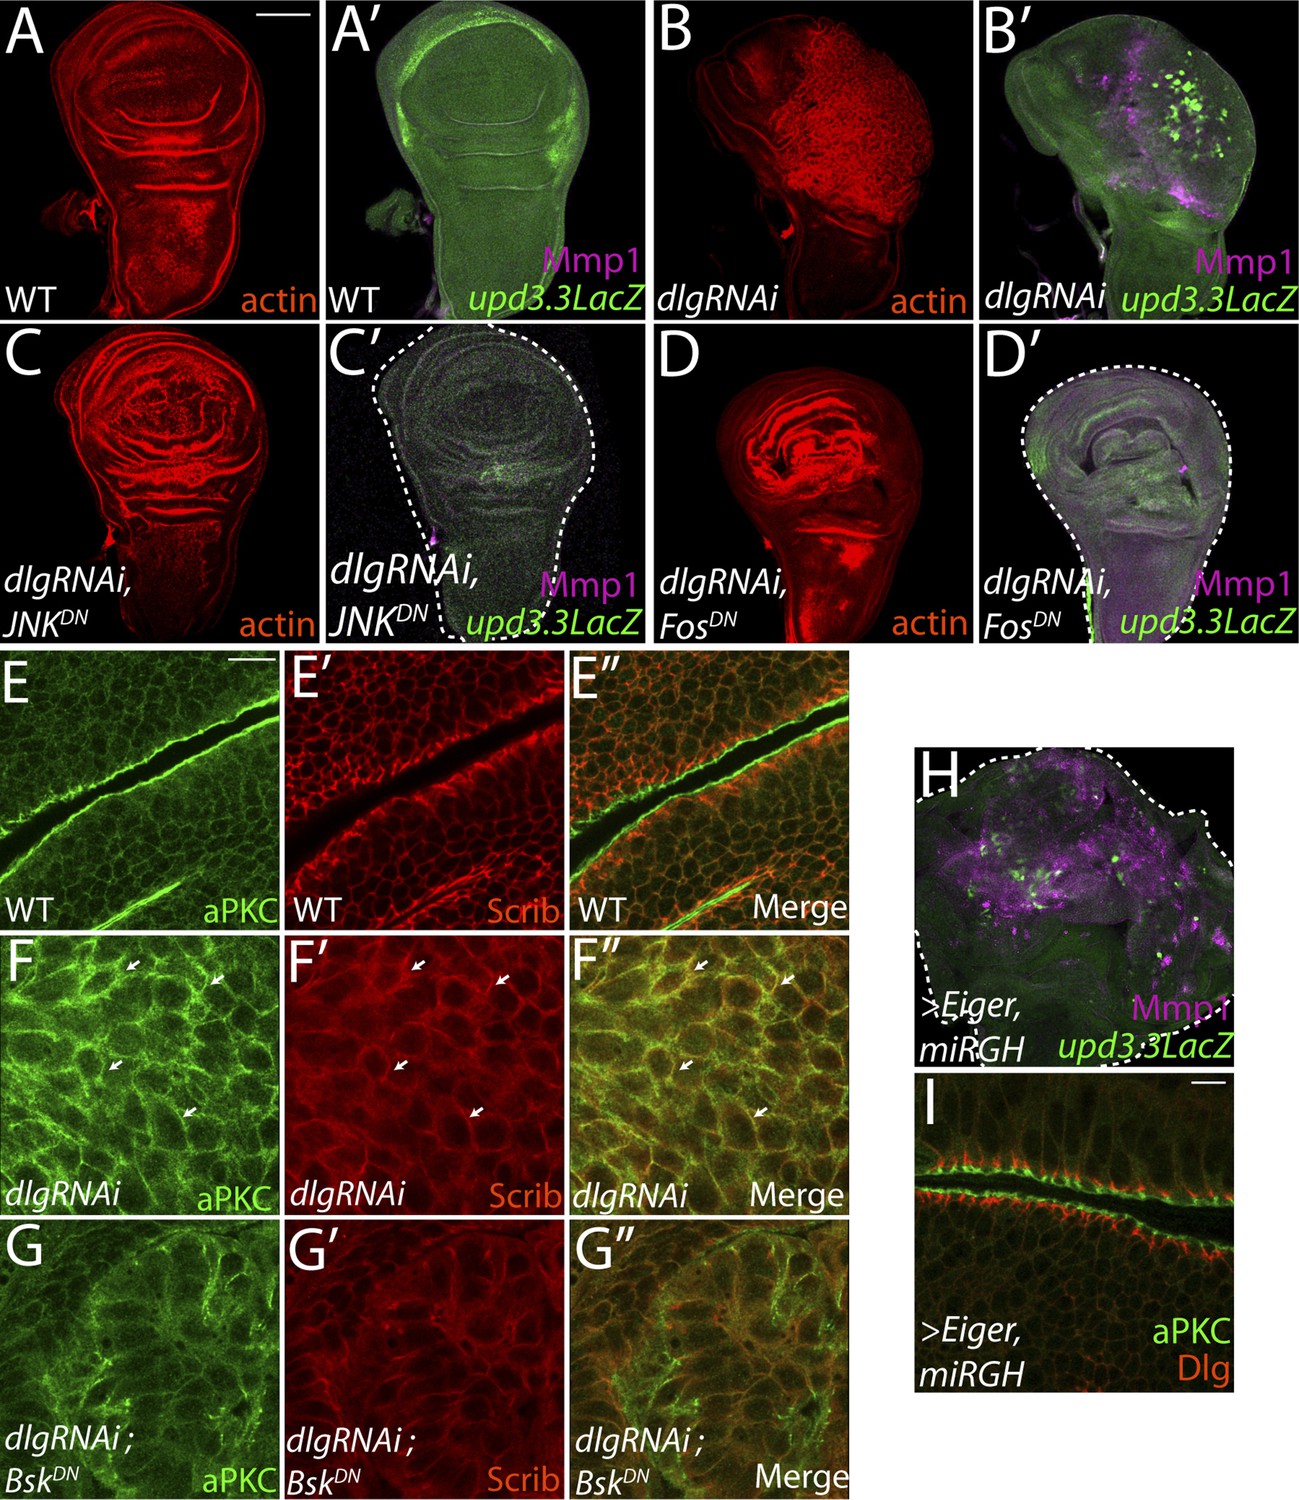
JNK-Dependent transcription is necessary for overgrowth and upd3.3 activation upon polarity loss.
WT wing discs (A) do not express either the JNK target Mmp1 or upd3.3LacZ (A′). Expression of dlgRNAi promotes overgrowth and disorganization (B), as well as Mmp1 and upd3.3LacZ upregulation (B′). Inhibiting AP-1 transcription with either JNKDN or FosDN restores normal disc size and architecture (C and D), and abrogates Mmp1 and upd3.3LacZ expression (C′ and D′). WT discs segregate apical aPKC and basolateral Scrib (E). dlgRNAi expression leads to apical domain expansion and co-localization of aPKC and Scrib (F, arrowheads). Co-expressing JNKDN and dlgRNAi restores the separation of aPKC and Scrib (G). Activation of JNK is sufficient, when apoptosis is blocked with miRGH, to drive upd3.3LacZ, Mmp1 and overgrowth but not to alter polarity (H and I). Scale bars: A–D, H: 100 μm, E–G, I: 10 μm.
Figure 4—figure supplement 1
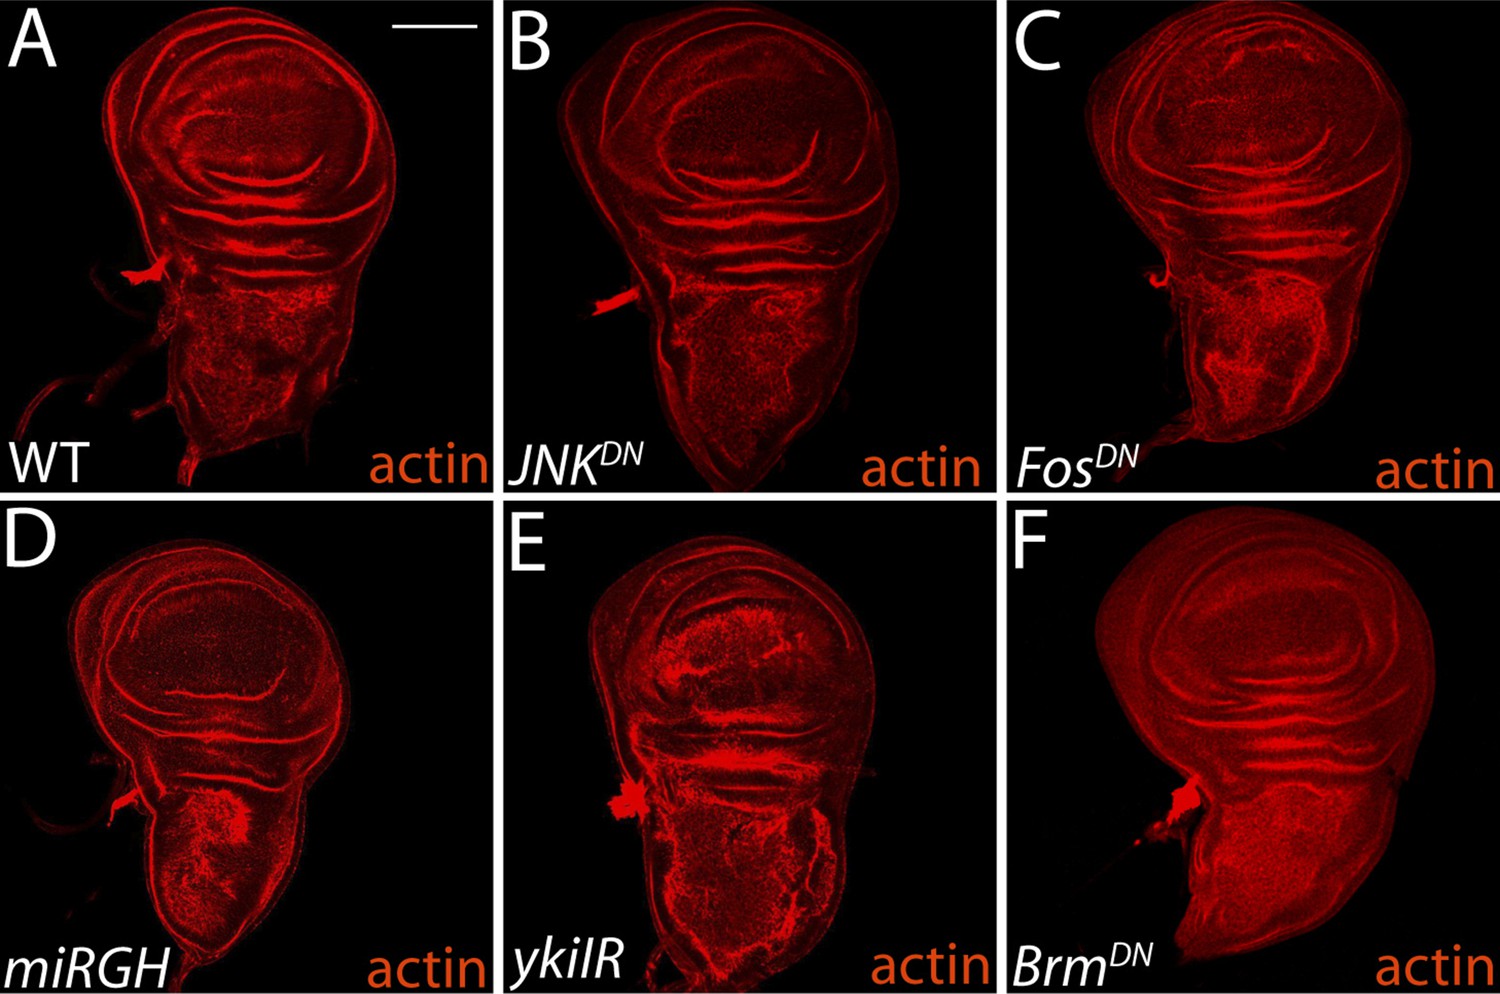
Inhibitor constructs do not significantly affect WT tissue growth and viability.
(A–B) Blocking JNK activity with JNKDN or FosDN (C) has no effect on normal growth or tissue architecture, relative to wild-type. Expression of miRGH does not affect normal tissue architecture or growth (D). Knockdown of Yki promotes mild architecture defects (E), while BrmDN expression has no phenotype (F). For all panels, transgenes were expressed in the dorsal wing pouch with the ms1096-GAL4 driver. Scale bar: 100 μm.
Figure 4—figure supplement 2
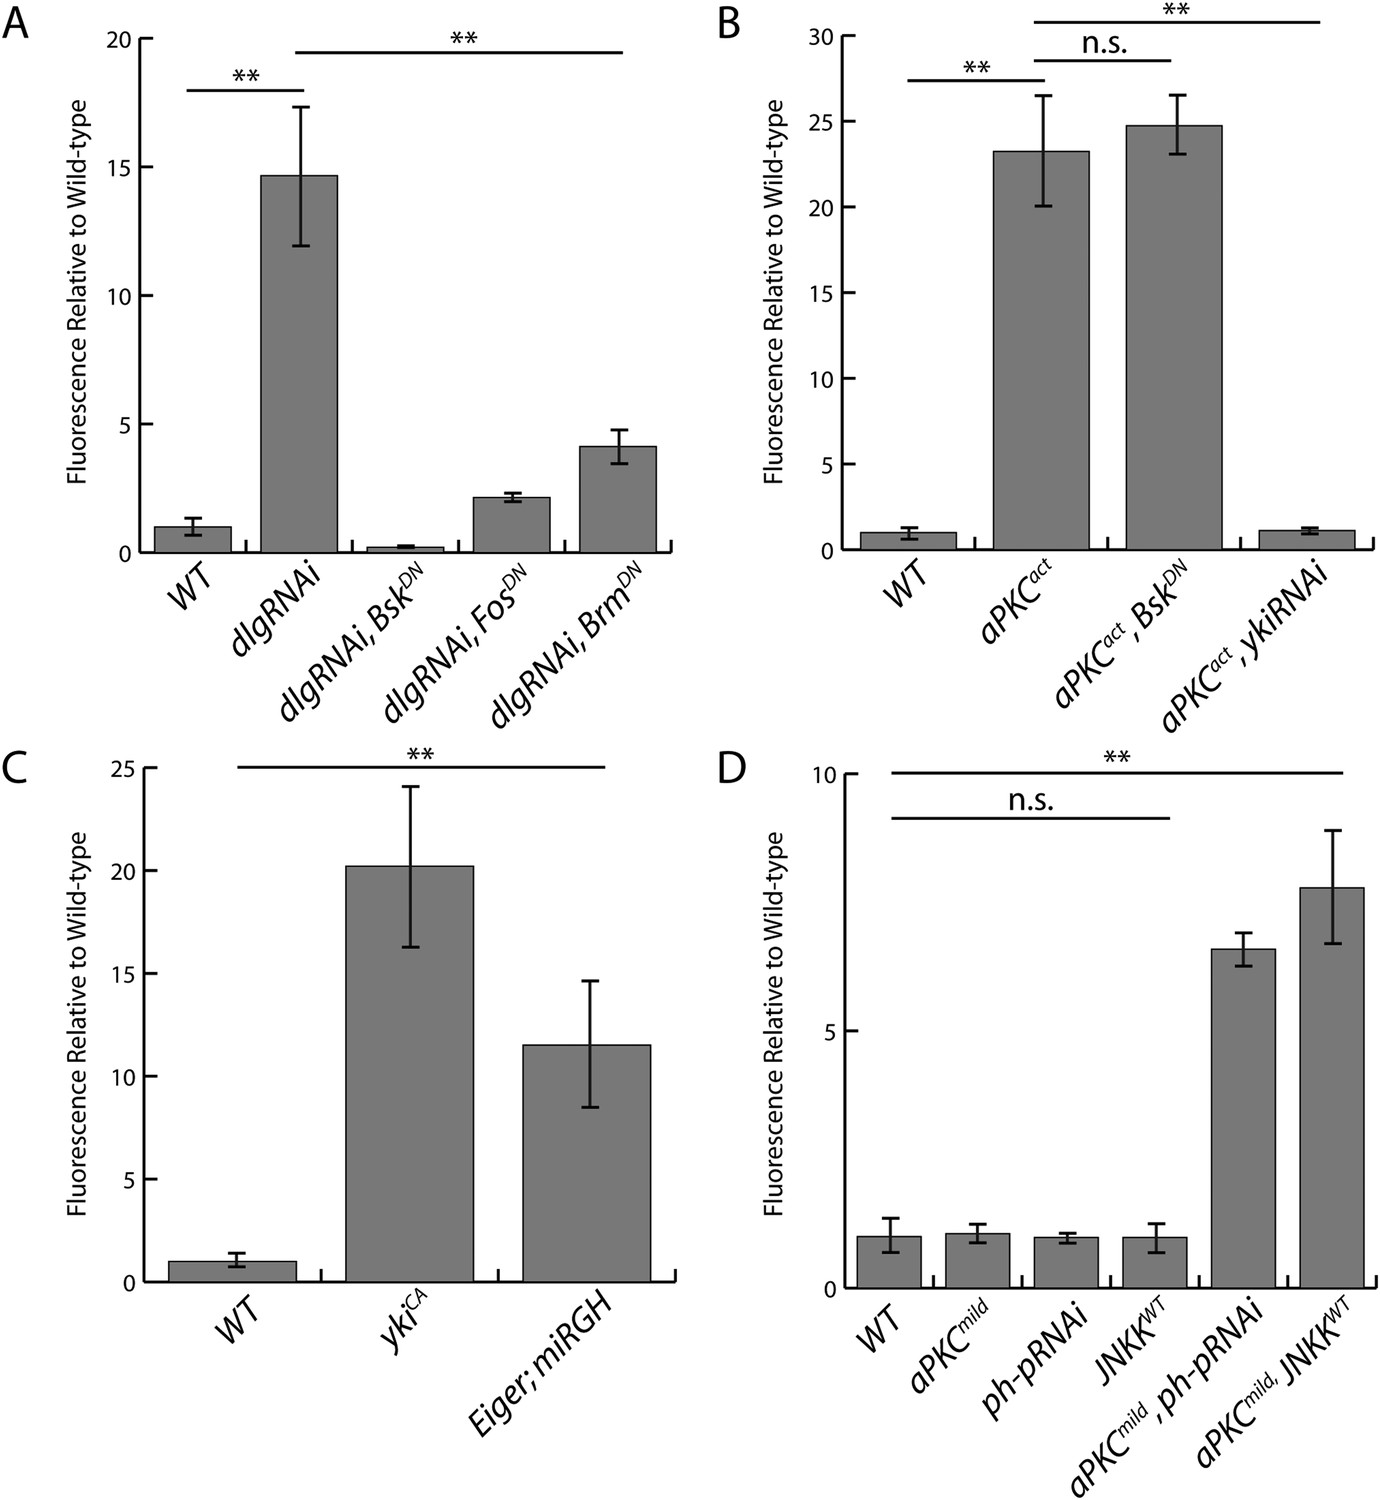
Quantification of upd3.3LacZ staining.
(A) Expression of dlgRNAi increases upd3.3LacZ fluorescence, which is suppressed by blocking JNK or Trx activity. (B) Expression of aPKCact stimulates upd3.3LacZ in a JNK-independent, but Yki-dependent manner. (C). Hyperactivation of Yki or JNK activity upregulates upd3.3LacZ expression. (D) Alone, expression of aPKCmild, ph-pRNAi, or JNKKWT does not activate upd3.3LacZ; however, co-expression of aPKCmild with ph-pRNAi or JNKKWT drives upd3.3LacZ. (**p < 0.001; n.s. = not significant).
Figure 4—figure supplement 3
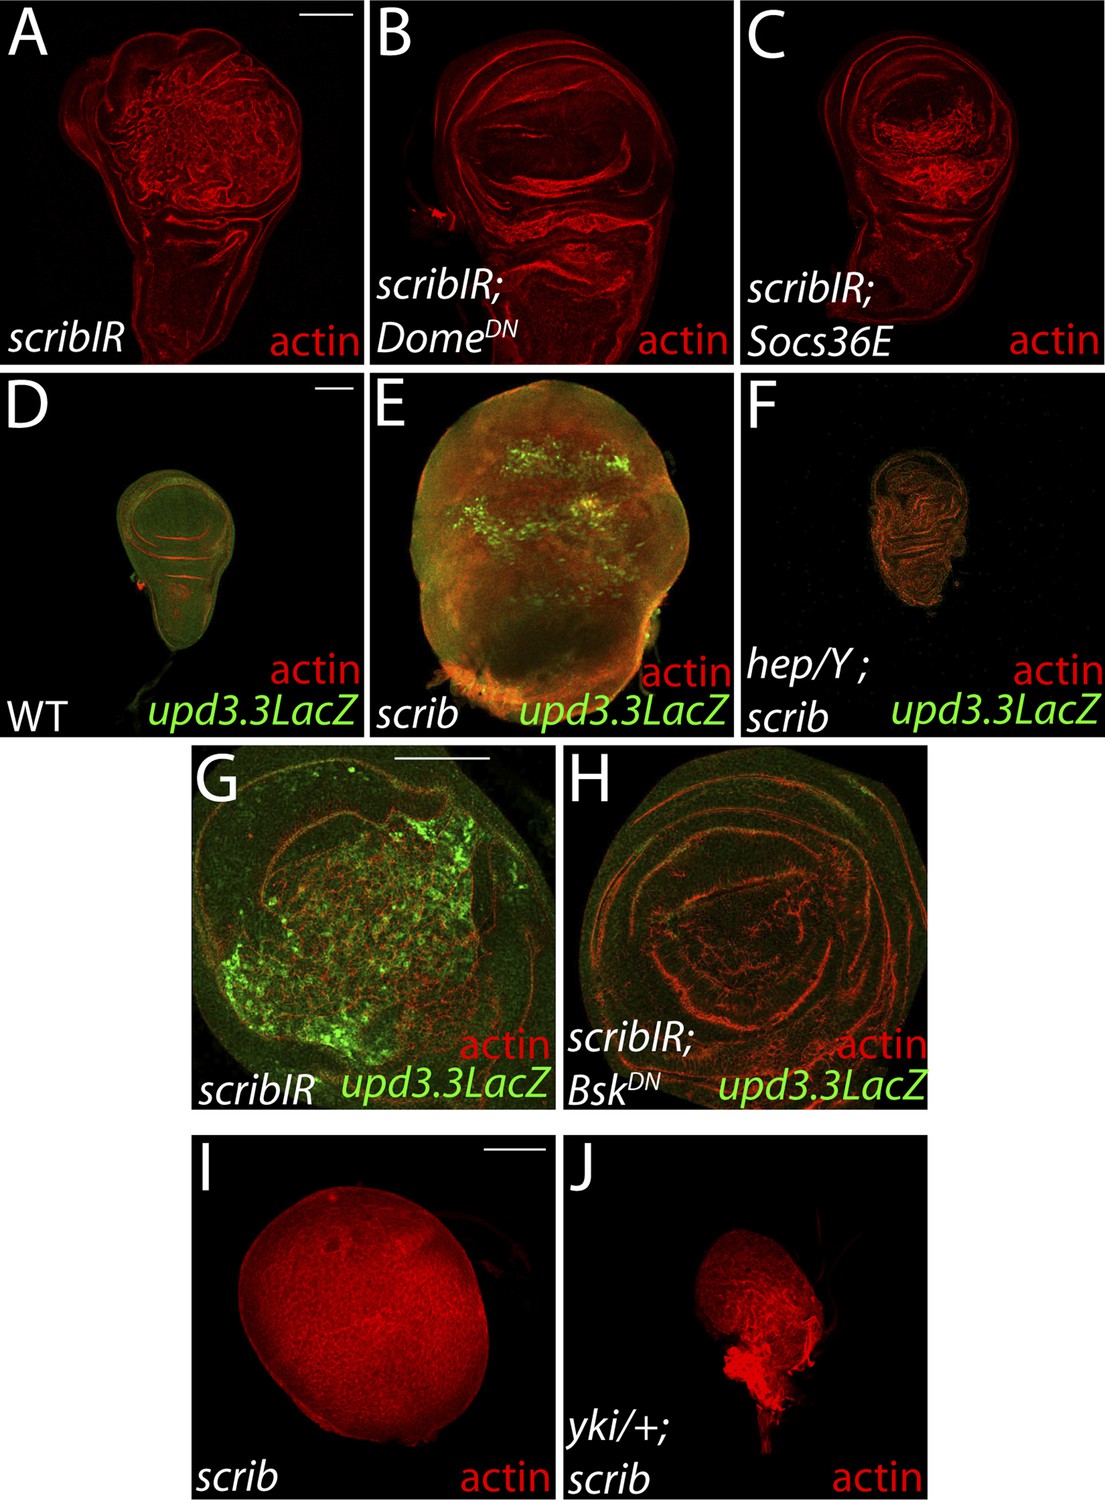
Neoplasia induced by scrib loss is also dependent on JAK-STAT, JNK, and Yki pathway activity.
(A–C) Reducing JAK-STAT activity with DomeDN or Socs36E attenuates scribIR-mediated overgrowth. (D–H) Blocking JNK pathway activation by depletion of the JNK kinase hep or overexpression of JNKDN suppresses the overproliferation, architecture defects and upd3.3LacZ activation induced by scrib loss. (I and J) Yki is necessary for neoplastic overgrowth of scrib tissue. Scale bar: 100 μm.
Figure 5 with 3 supplements
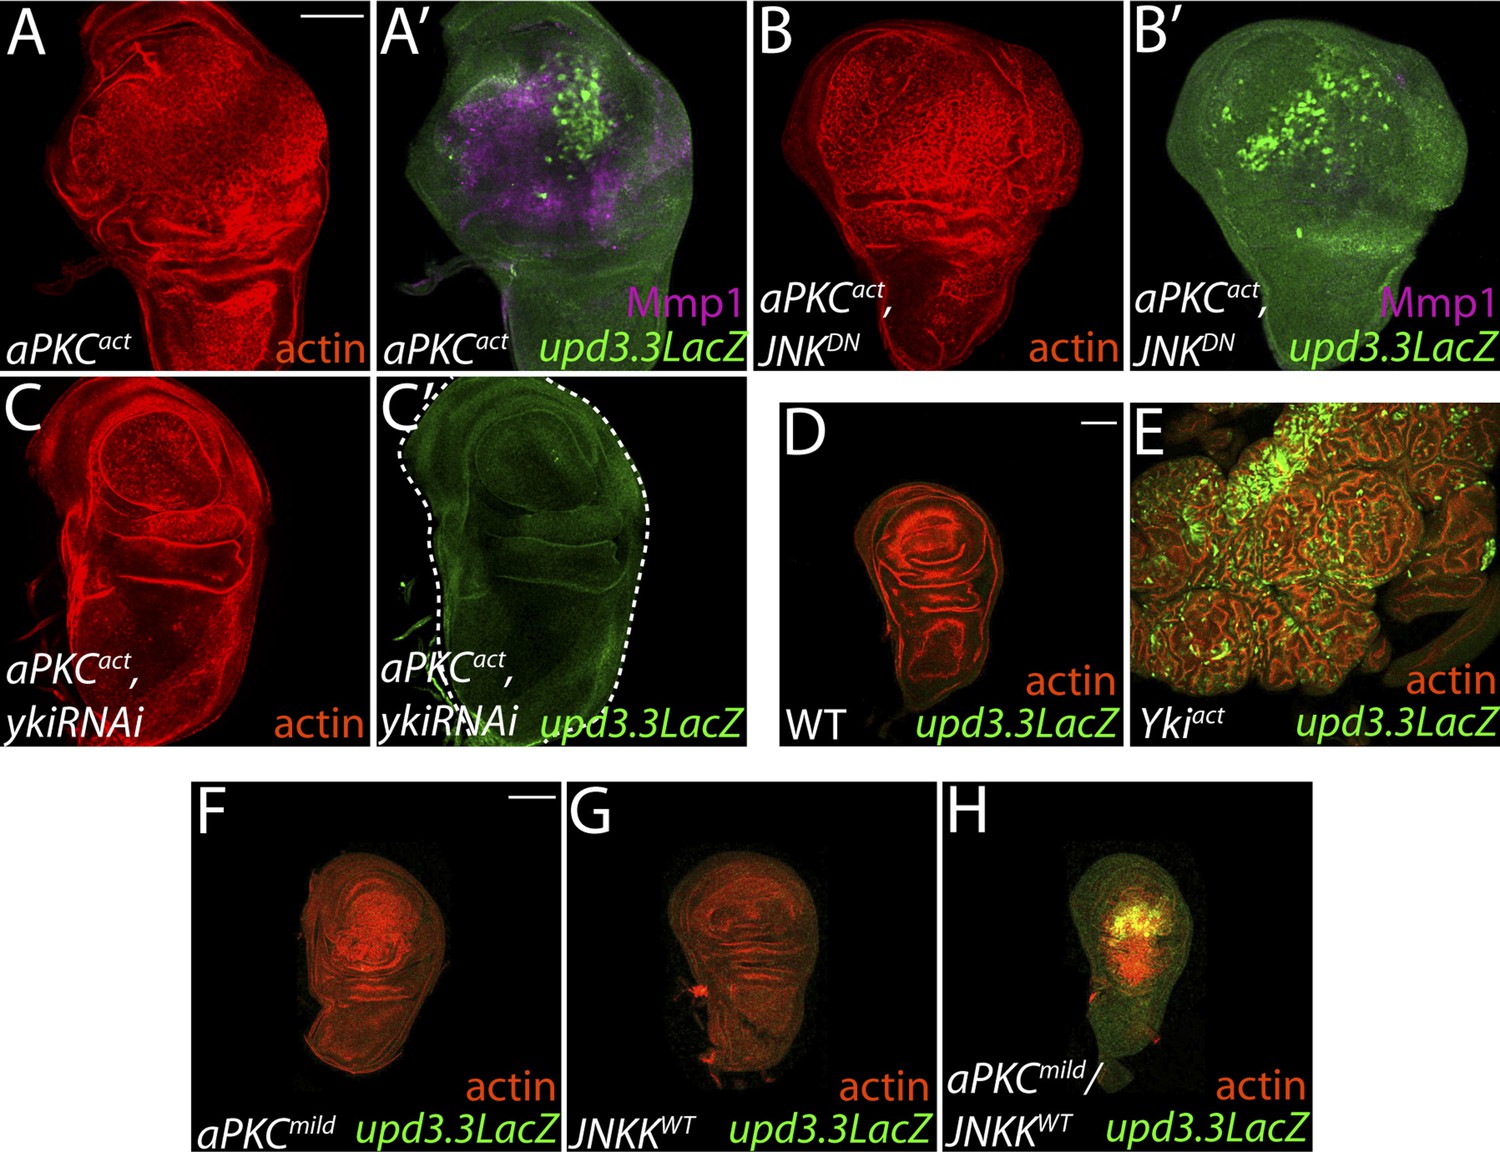
aPKC activity drives upd3.3LacZ activation in a yki-dependent manner.
(A) Expression of constitutively active aPKC (aPKCact) induces upd3.3LacZ and Mmp1 upregulation and neoplasia. (B) Expressing JNKDN suppresses Mmp1, but does not prevent aPKCact-mediated upd3.3LacZ activation or overgrowth. (C) Knockdown of yki blocks upd3.3LacZ and overgrowth upon ectopic aPKC activity, while constitutively active Yki drives upd3.3LacZ expression and tissue overgrowth relative to WT (D and E). Expression of a mildly-active form of aPKC (F) or JNK (G) alone cannot activate upd3.3, but together are sufficient for expression (H). Scale bars: 100 μm.
Figure 5—figure supplement 1
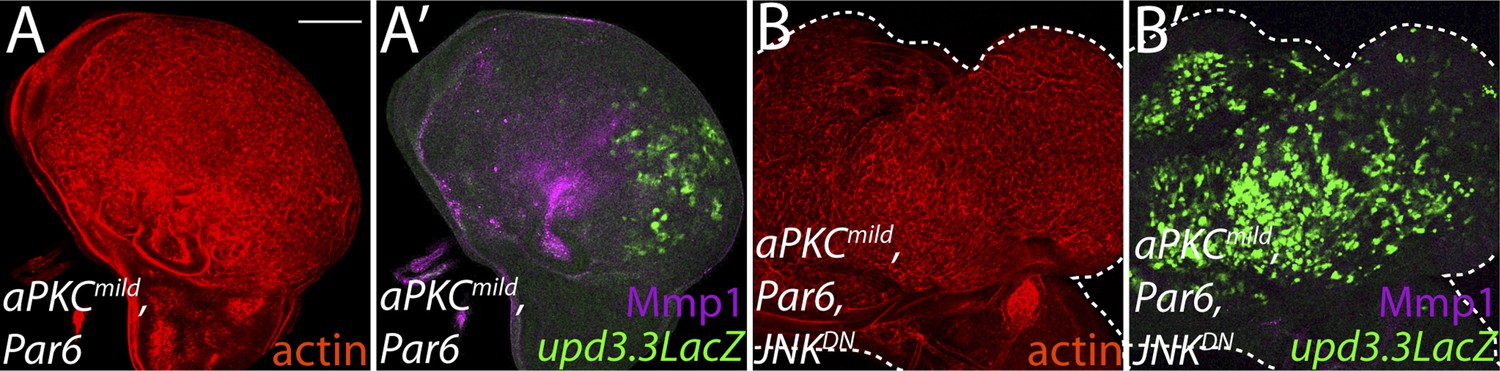
Ectopic aPKC activity drives upd3.3LacZ in a JNK-independent manner.
(A) Expression of aPKCmild and its partner Par6 drives upd3.3LacZ as well as strong overgrowth and Mmp1 expression in the wing pouch. (B) Co-expression of JNKDN does not suppress upd3.3LacZ activation or overgrowth though Mmp1 upregulation is abrogated. Scale bar: 100 μm.
Figure 5—figure supplement 2
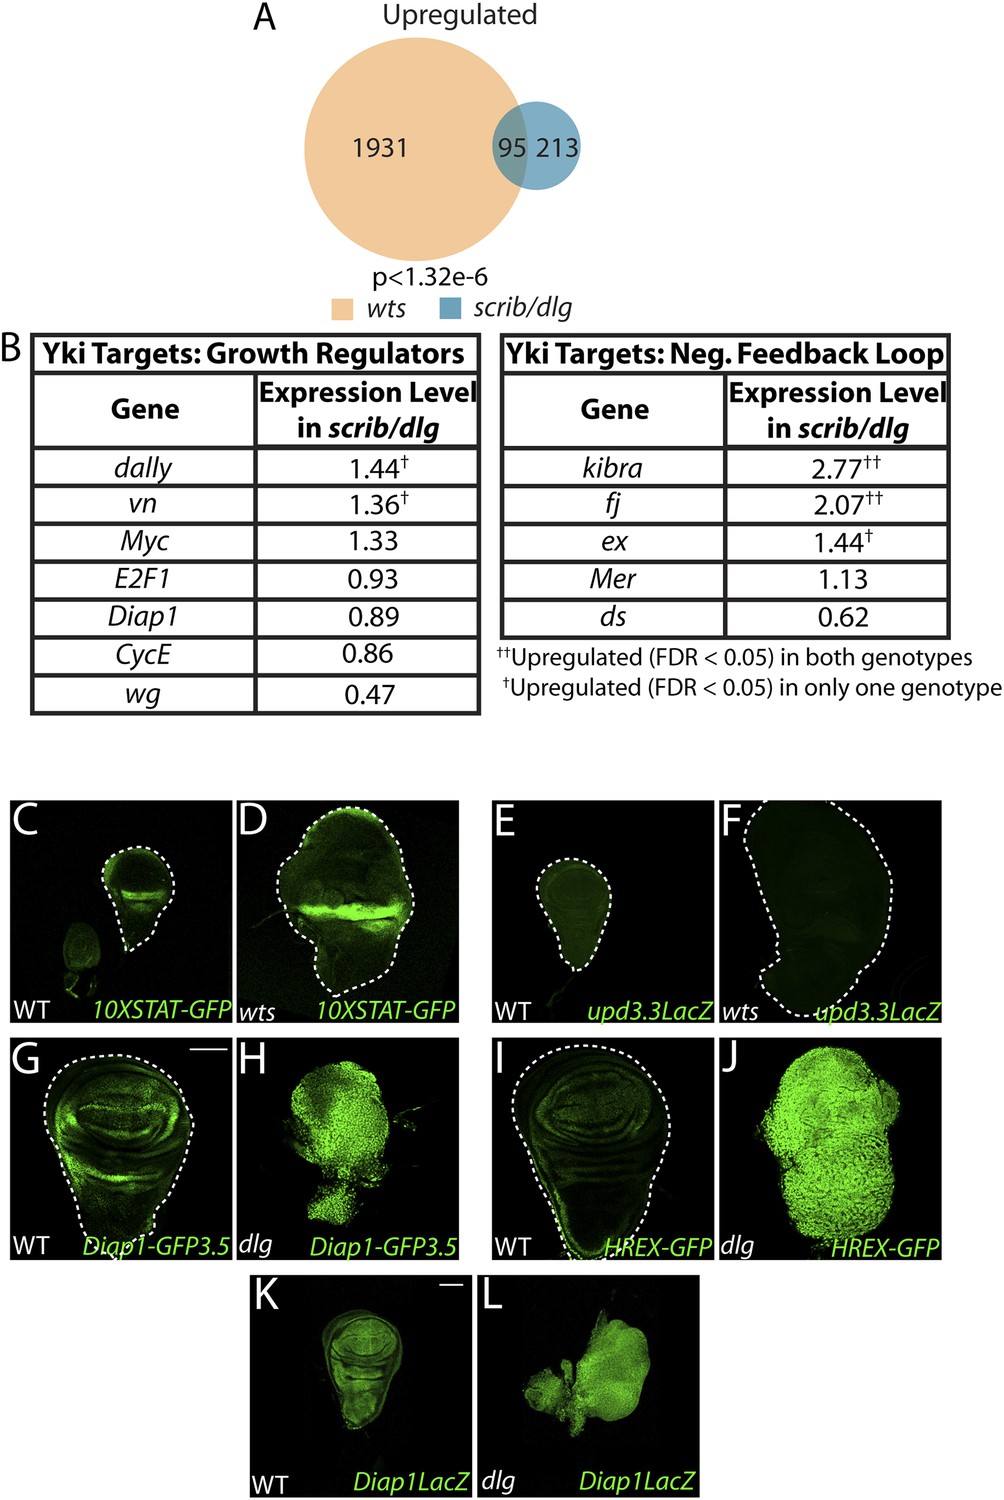
Scrib module and wts mutant expression profiles display limited overlap.
(A) Comparison of the Scrib module and wts mutant transcriptomes (see ‘Materials and methods’) reveals a limited degree of overlap. (B) Most canonical Yki growth targets are not upregulated in neoplastic tissues. (C–F) upd3.3LacZ and STAT signaling are not upregulated in wts discs. The transgenic Hpo pathway reporters Diap1-GFP3.5 (G–H) and HREX-GFP (I–J) are strongly upregulated in neoplastic tissue relative to WT; however, Diap1-LacZ (K–L), which is inserted into the endogenous locus, is only slightly increased. Scale bar: 100 μm.
Figure 5—figure supplement 3
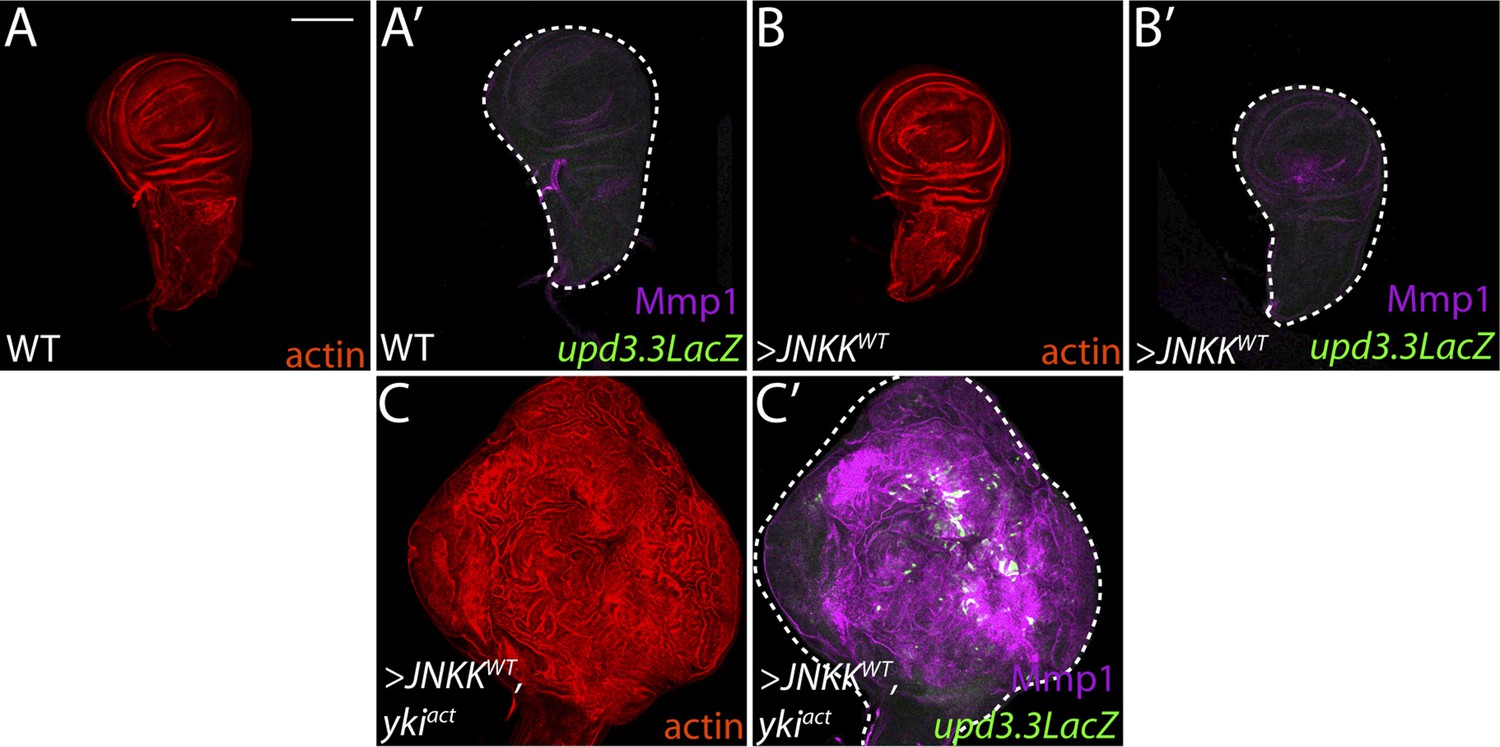
Co-activation of JNK and Yki are not sufficient to drive neoplasia.
(A–B) Ectopic expression of wild-type JNKK causes only slight morphological defects and upregulates Mmp1, but cannot activate upd3.3LacZ. (C) Co-expression of JNKK and Ykiact activates both upd3.3LacZ and Mmp1, but does not recapitulate polarity defects or neoplastic-like overgrowth. Scale bar: 100 μm.
Figure 6 with 1 supplement
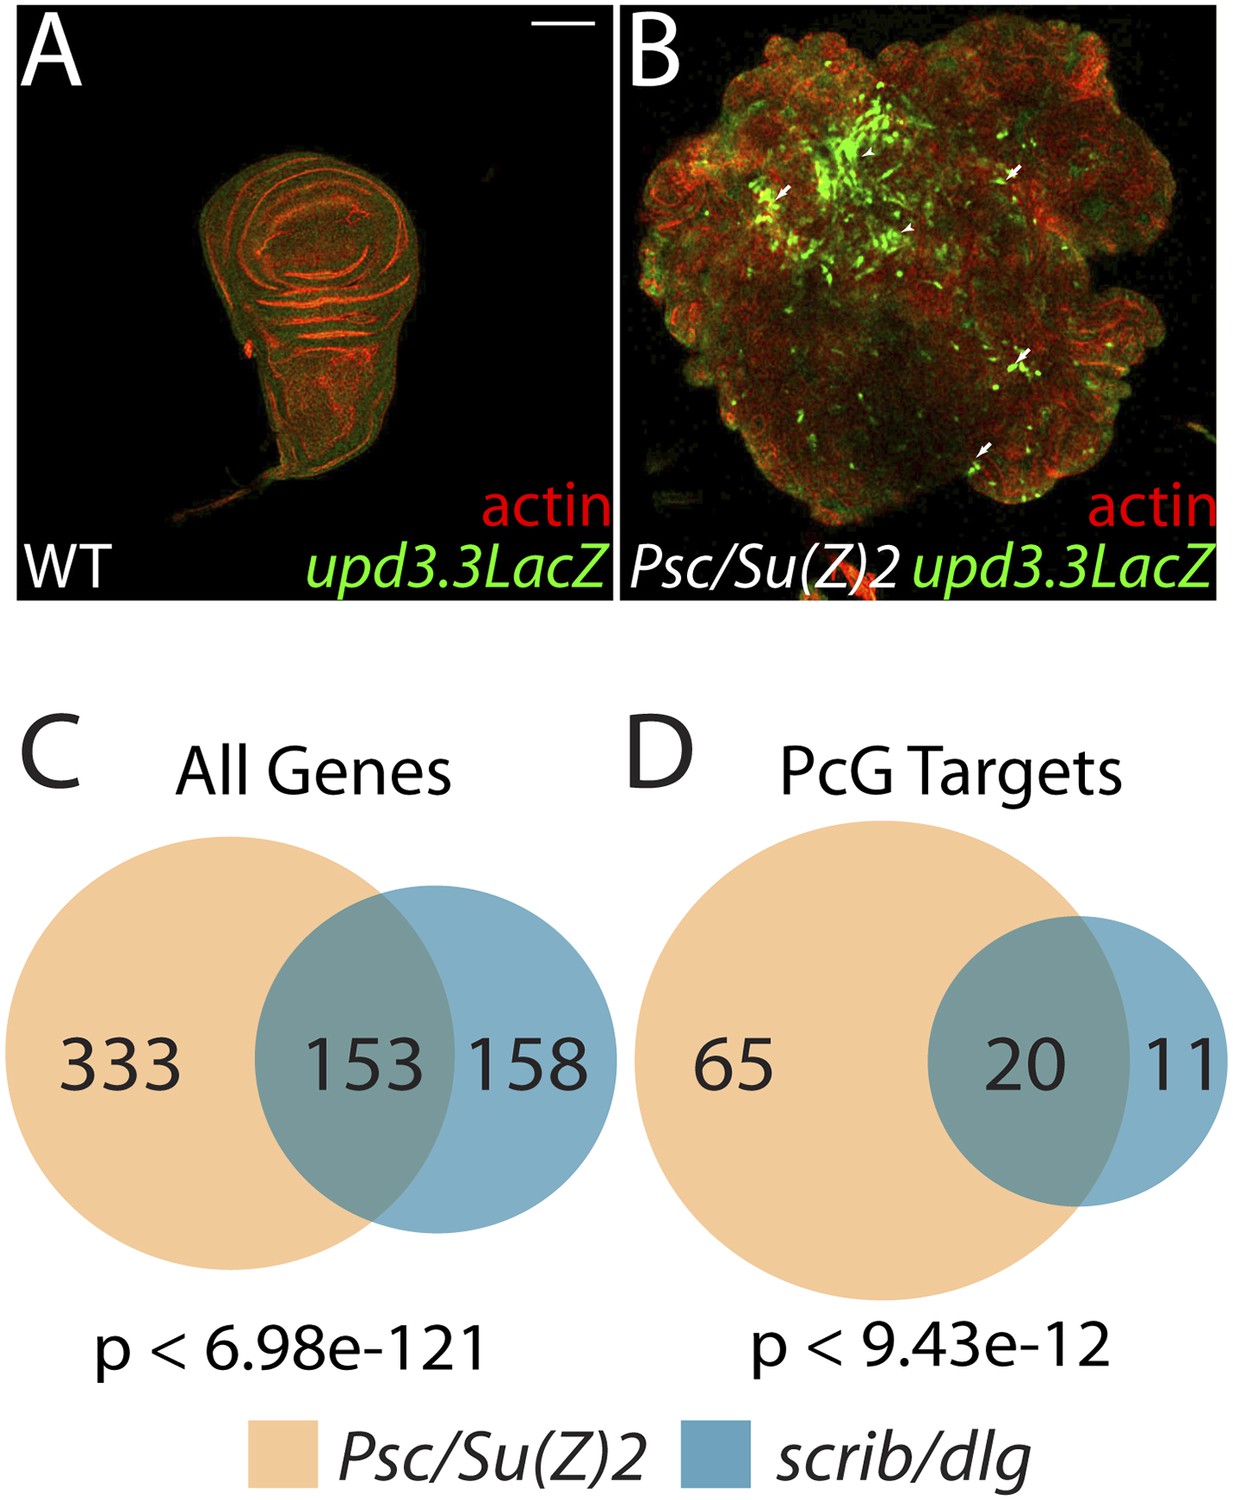
The Scrib module and PcGs regulate common targets.
(A and B) Loss of the paralogous PcGs Psc and Su(z)2 leads to activation of upd3.3lacZ, along with dramatic overgrowth and architecture defects. Activation is observed in areas of epithelial (arrows) and disrupted (arrowheads) organization. Comparison of all genes (C) and direct PcG targets (D) upregulated in Psc/Su(z)2 and Scrib module mutant tissues reveals statistically significant overlaps. Scale bar: 100 μm.
Figure 6—figure supplement 1
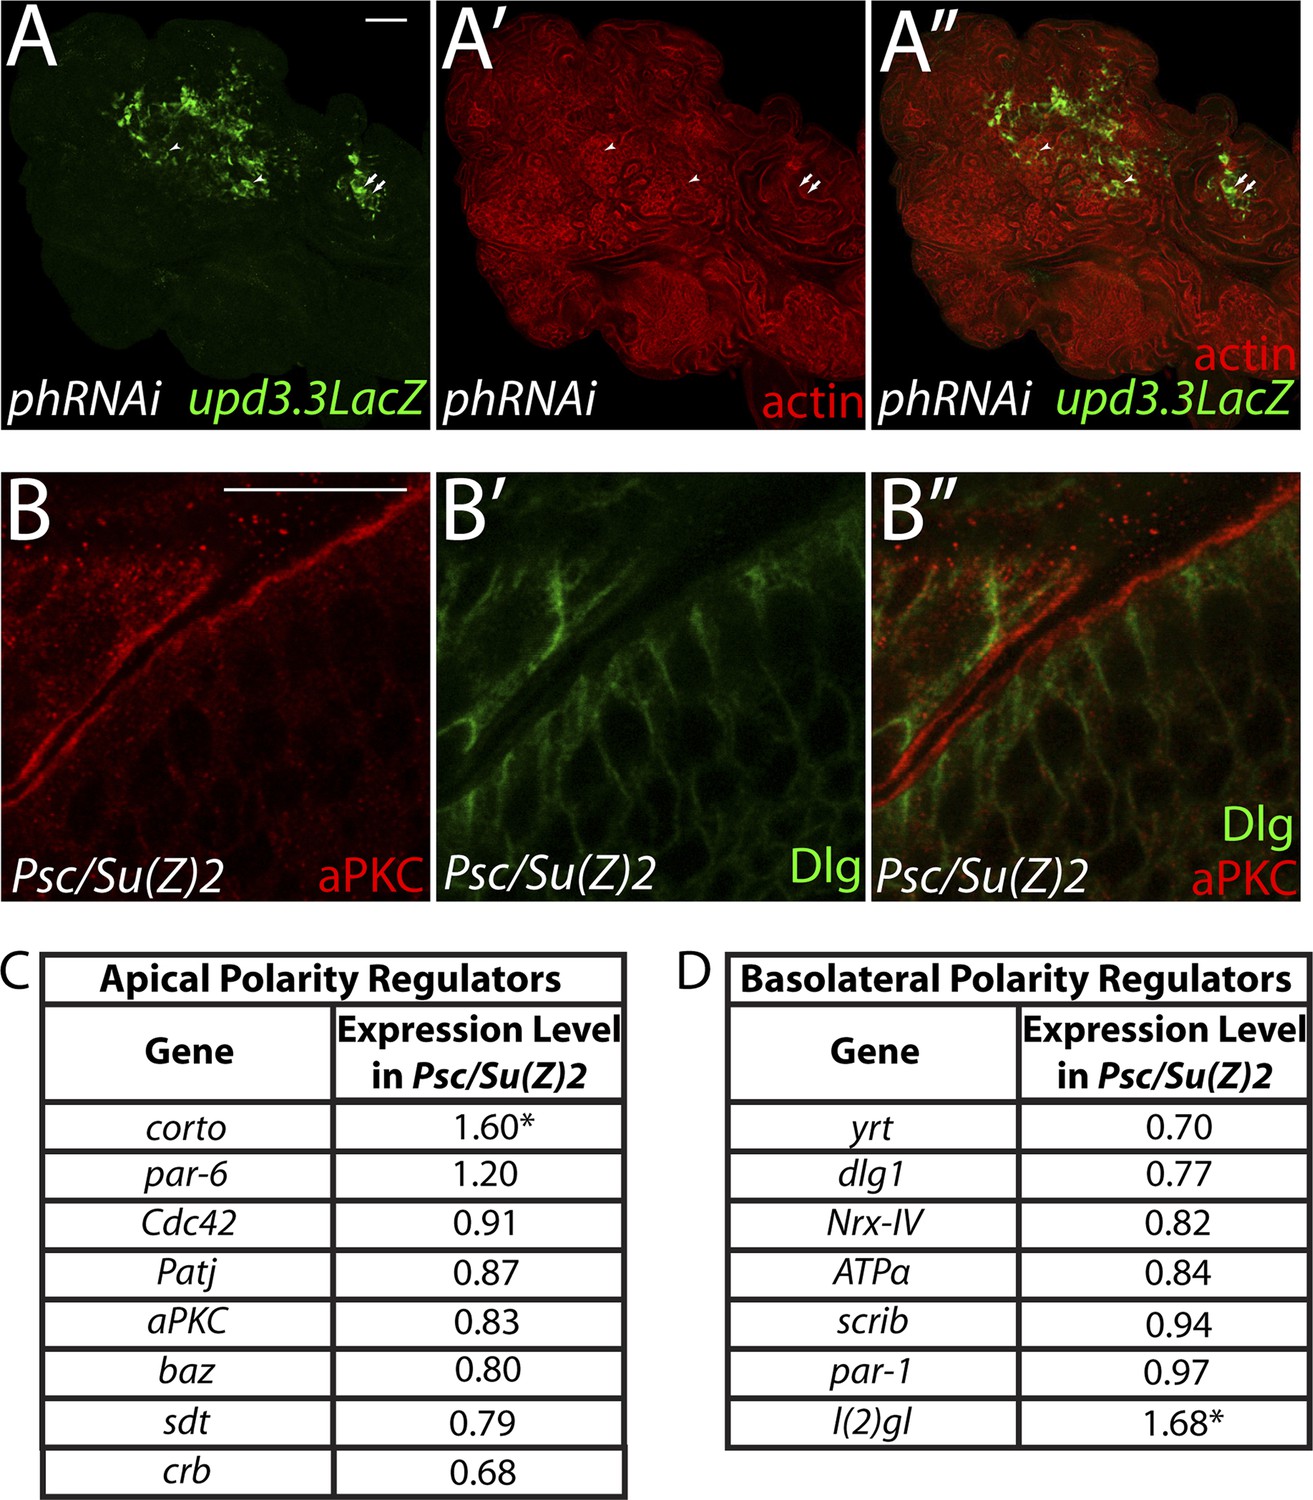
PcG depletion does not cause widespread loss of polarity.
(A) Depletion of the paralogous PcGs ph-p and ph-d leads to overgrowth and upd3.3LacZ activation, including in areas with mild architecture defects. Arrows show areas of upd3.3LacZ expression in areas with epithelial organization; arrowheads indicate reporter activation in regions with disrupted architecture. (B) Regions of Psc/Su(Z)2 mutant discs have normal polarity. (C and D) Most apical and basolateral regulatory genes are minimally changed in Psc/Su(Z)2 tissue. Scale bars: A: 100 μm, B: 10 μm.
Figure 7
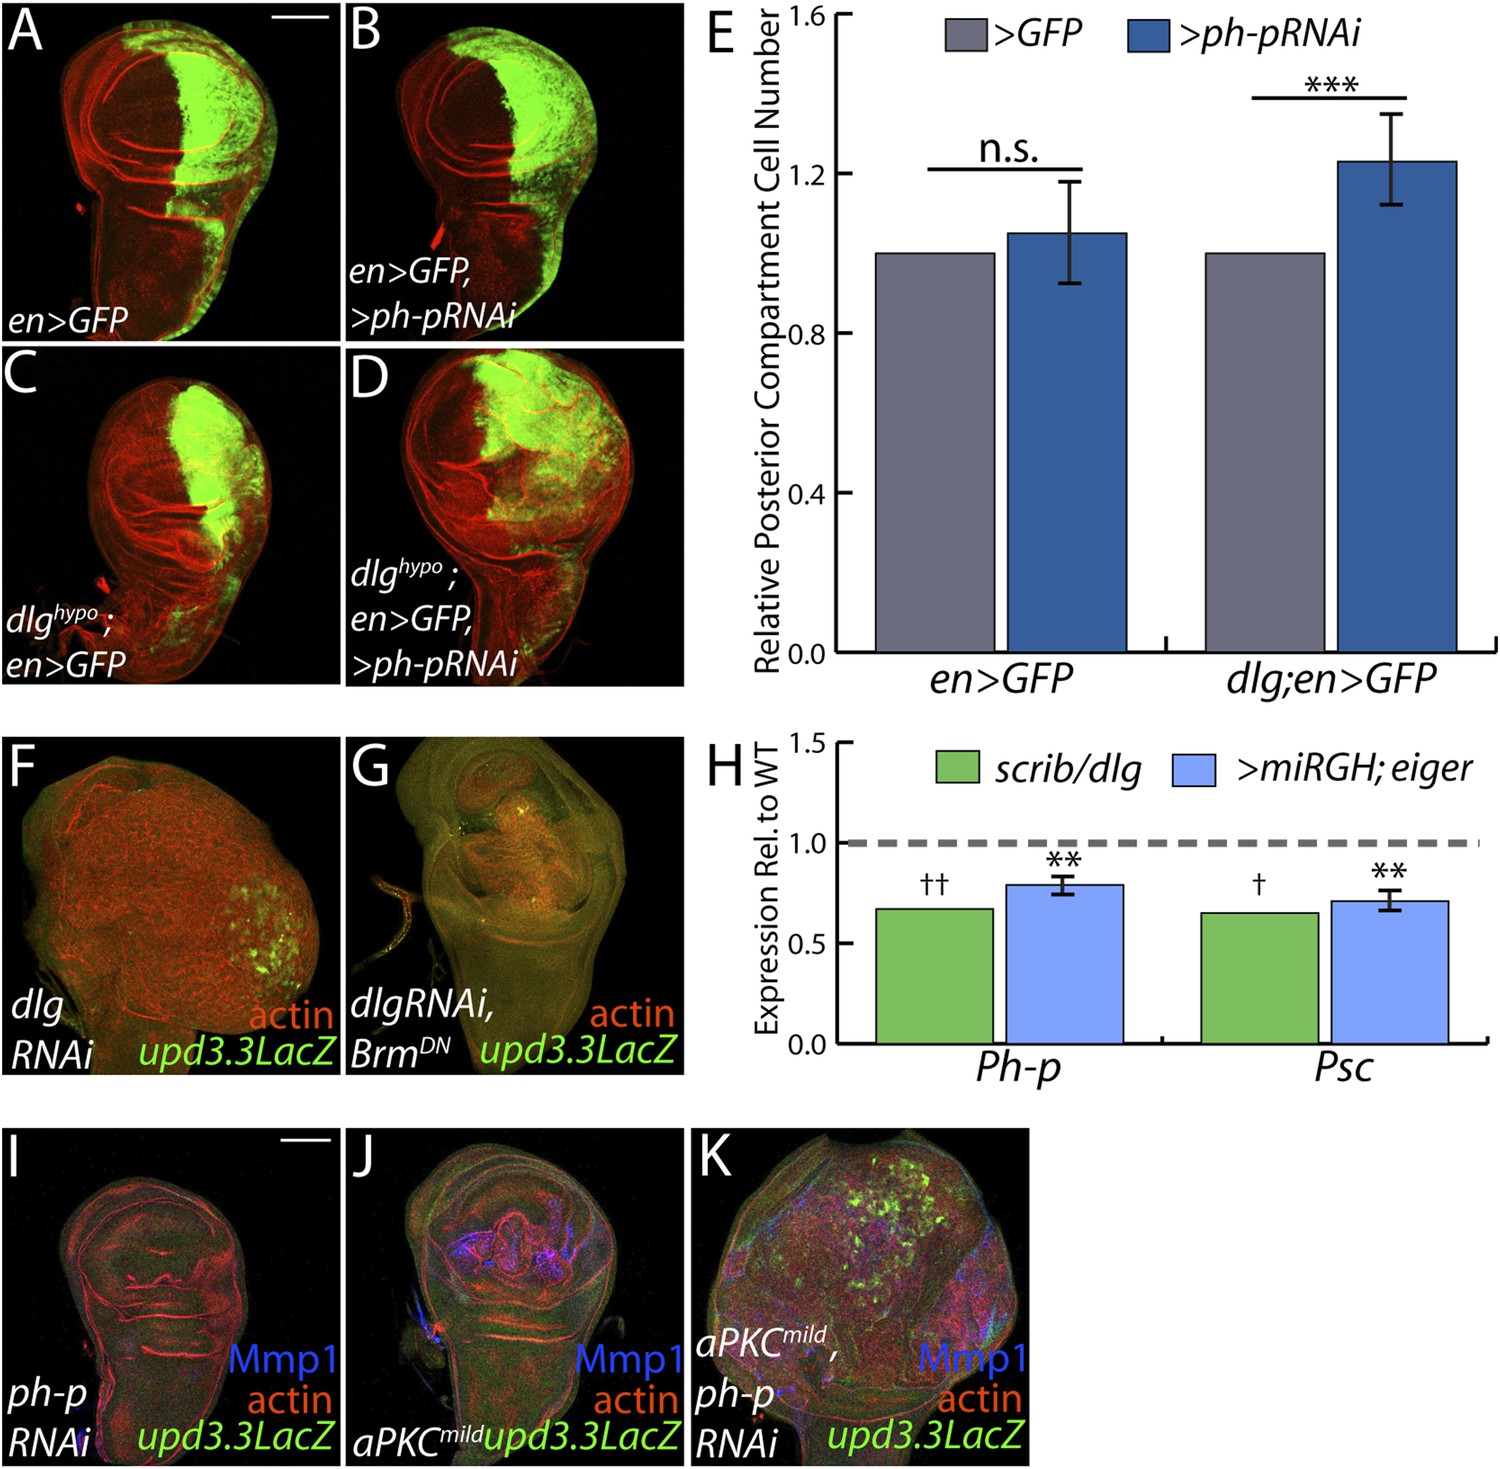
PcGs cooperate with Scrib module proteins to regulate growth.
(A–D) Knockdown of ph-p has little effect on WT growth but increases the growth of dlghypo tissue. Quantification is in E (***p < 0.0001). (F–G) BrmDN expression in dlgRNAi tissue decreases both upd3.3LacZ activation and overgrowth. (H) PcG components ph-p and Psc are downregulated in scrib and dlg mutant tissue (average in green), similar to levels observed upon JNK activation (blue). (**p < 0.005 ✝FDR < 0.05 in one genotype; ✝✝FDR < 0.05 in both genotypes) (I–K) Knockdown of ph-p or expression of a moderately active form of aPKC (aPKCmild) does not induce upd3.3LacZ, and aPKCmild induces only slight overgrowth. However, co-expression of these transgenes leads to strong overgrowth and upd3.3LacZ expression. Scale bar: 100 μm.
Additional files
-
Supplementary file 1
Transcriptome Analysis of scrib Tissue. Differential expression analysis of scrib versus white RNA-Seq data by DESeq. Each column contains the following information: Flybase ID- Flybase Gene Identifier; Gene Name- Name of each gene; baseMean_allconditions- Average normalized read count for that gene, across all samples, baseMean_white- Normalized read count for that gene in white tissue; baseMean_scribble- Normalized read count for that gene in scrib tissue; foldChange- Change of the gene in scribble, relative to white tissue; foldChangelog2- Logarithm to base 2 of the fold change; pval- p-value for the statistical significance of the fold change; padj- p-value adjusted for multiple testing with the Benjamini-Hochberg procedure, which controls for false discovery rate (FDR).
- https://doi.org/10.7554/eLife.03189.021
-
Supplementary file 2
Transcriptome Analysis of dlg Tissue. Differential expression analysis of dlg versus white RNA-Seq data by DESeq. Each column contains the following information: Flybase ID- Flybase Gene Identifier; Gene Name- Name of each gene; baseMean_allconditions- Average normalized read count for that gene, across all samples, baseMean_white- Normalized read count for that gene in white tissue; baseMean_discslarge- Normalized read count for that gene in dlg tissue; foldChange- Change of the gene in dlg, relative to white tissue; foldChangelog2- Logarithm to base 2 of the fold change; pval- p-value for the statistical significance of the fold change; padj- p-value adjusted for multiple testing with the Benjamini-Hochberg procedure, which controls for false discovery rate (FDR).
- https://doi.org/10.7554/eLife.03189.022
-
Supplementary file 3
Transcriptome Analysis of Psc/Su(Z)2 Tissue. Differential expression analysis of scrib versus white RNA-Seq data by DESeq. Each column contains the following information: Flybase ID- Flybase Gene Identifier; Gene Name- Name of each gene; baseMean_allconditions- Average normalized read count for that gene, across all samples, baseMean_iso- Normalized read count for that gene in iso42 tissue; baseMean_PscSuZ2- Normalized read count for that gene in Psc/Su(Z)2 tissue; foldChange- Change of the gene in scribble, relative to white tissue; foldChangelog2- Logarithm to base 2 of the fold change; pval- p-value for the statistical significance of the fold change; padj- p-value adjusted for multiple testing with the Benjamini-Hochberg procedure, which controls for false discovery rate (FDR).
- https://doi.org/10.7554/eLife.03189.023
-
Supplementary file 4
RNA-Seq alignment statistics. Table of combined number of 50-bp single-end sequencing reads for each sequencing replicate. Reads were considered ‘non-aligned’ if they had >2 mismatches relative to the reference genome, and ‘low complexity’ reads had multiple matches within the genome, reflecting sequencing reads from repeated DNA elements. Percentages listed refer to the number of reads for each category relative to the total number of reads.
- https://doi.org/10.7554/eLife.03189.024
-
Supplementary file 5
Contains the number of differentially expressed genes for each genotype.
- https://doi.org/10.7554/eLife.03189.025
-
Supplementary file 6
Contains the primer sequences used for quantitative PCR in Figure 7.
- https://doi.org/10.7554/eLife.03189.026
Download links
A two-part list of links to download the article, or parts of the article, in various formats.
Downloads (link to download the article as PDF)
Open citations (links to open the citations from this article in various online reference manager services)
Cite this article (links to download the citations from this article in formats compatible with various reference manager tools)
The transcriptional response to tumorigenic polarity loss in Drosophila
eLife 4:e03189.
https://doi.org/10.7554/eLife.03189


