A bacteriophage tubulin harnesses dynamic instability to center DNA in infected cells
- University of California, San Diego, United States
- Howard Hughes Medical Institute, University of California, San Francisco, United States
Figures
Figure 1

TIRF microscopy reveals polarity and dynamic instability in PhuZ filaments.
(A) Cy3 labeled PhuZ filaments exhibit treadmilling in the presence of GTP. Many filaments displayed non-uniform intensity (highlighted by arrows), which we used as stationary points to monitor growth and shrinkage of the ends independent of filament diffusion. With respect to the highlighted points, one end appears to grow while the other shrinks. (B–D) Polymerization of GTP-PhuZ filaments (green) off of GMPCPP stabilized PhuZ seeds (red) (see Methods). (B) Wide-field still image of PhuZ filaments growing unidirectionally off of GMPCPP stabilized seeds. (C) Montages of two representative PhuZ filaments undergoing dynamic instability. Periods of filament growth are followed by rapid disassembly back to the GMPCPP seed. (D) Kymographs of filaments from (C). Arrow indicates catastrophe event. Scale bars equal 2 μm.
Figure 2

Nucleotide hydrolysis destabilizes PhuZ filaments.
(A) Right-angle light scattering traces of D190A-PhuZ polymerization at 1.5 (purple), 2 (green), 2.5 (red), and 3 (blue) μM upon addition of 1 mM GTP. (B) Right-angle light scattering traces of PhuZ (red) or D190A-PhuZ (green) polymerized in 100 μM GTP. 3 mM GDP was added after polymerization reached steady state (arrow + GDP), and subsequent depolymerization was monitored. (C) Testing PhuZ polymerization by pelleting (see ‘Materials and methods’). Supernatants (S) and pellets (P) were analyzed by SDS-PAGE. Input PhuZ concentration indicated in µM. No detectable PhuZ polymer formed at concentrations as high as 200 μM. No detectable polymer formed in the absence of nucleotide (second from right), and PhuZ filaments were readily detected in the presence of 5 mM GTP (10 μM PhuZ shown right). (D) Pelleting of D190A-PhuZ in the presence of 5 mM GDP, 5 mM GTP, or no nucleotide. Nucleotide was added to 10 μM D190A-PhuZ and spun 80000X RPM for 20 min at 25°C. Supernatants (S) and pellets (P) were analyzed by SDS-PAGE. No detectable polymer was formed in the presence of GDP. In contrast, almost all of the protein was found in the pellet in the presence of GTP.
Figure 3
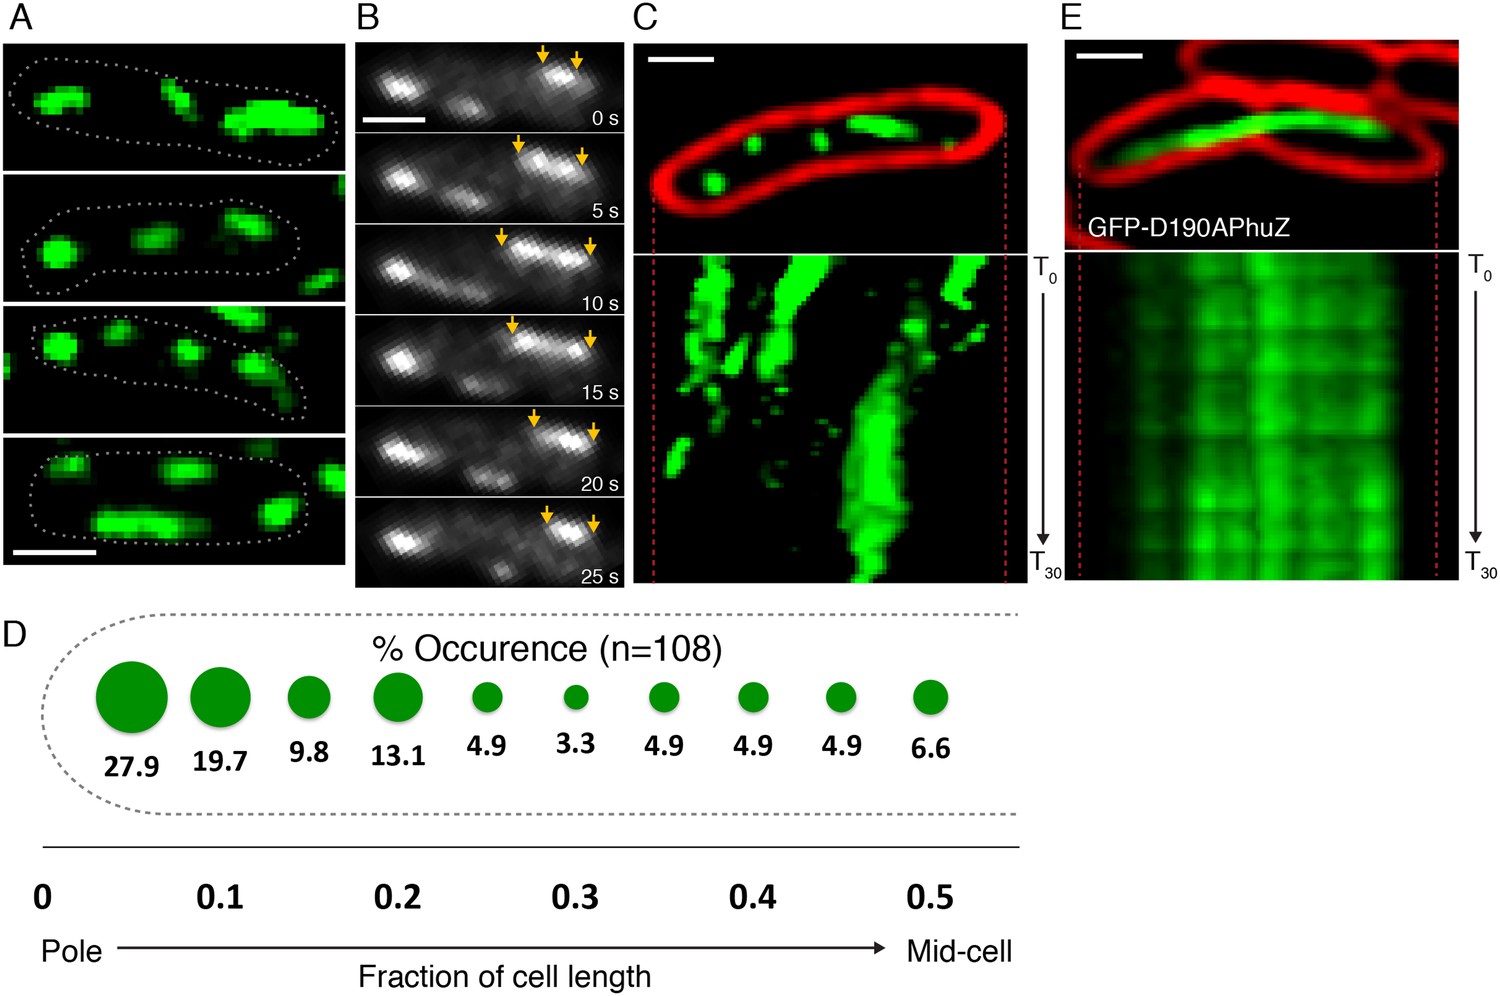
PhuZ filaments are distributed throughout the cell in the absence of phage.
(A) GFP-PhuZ expressed by itself (in the absence of phage infection) assembles relatively short filaments in P. chlororaphis. Four individual cells (outlined) with multiple filaments are shown. (B) Time-lapse microscopy of a single cell showing an example of a filament (yellows arrows) growing and shrinking over the course of 25 s. (C) Kymographs of GFP-PhuZ fluorescence intensity in a single cell throughout a 60 s window. (D) Relative positions of filament ends (closest to the cell pole) are expressed as fraction of cell length measured from a field of uninfected cells (n = 110) and plotted as a frequency distribution (fraction of population). (E) Kymograph of GFP-D190APhuZ fluorescence intensity in a single cell throughout a 60 s window. The white scale bar equals 1 micron.
Figure 4
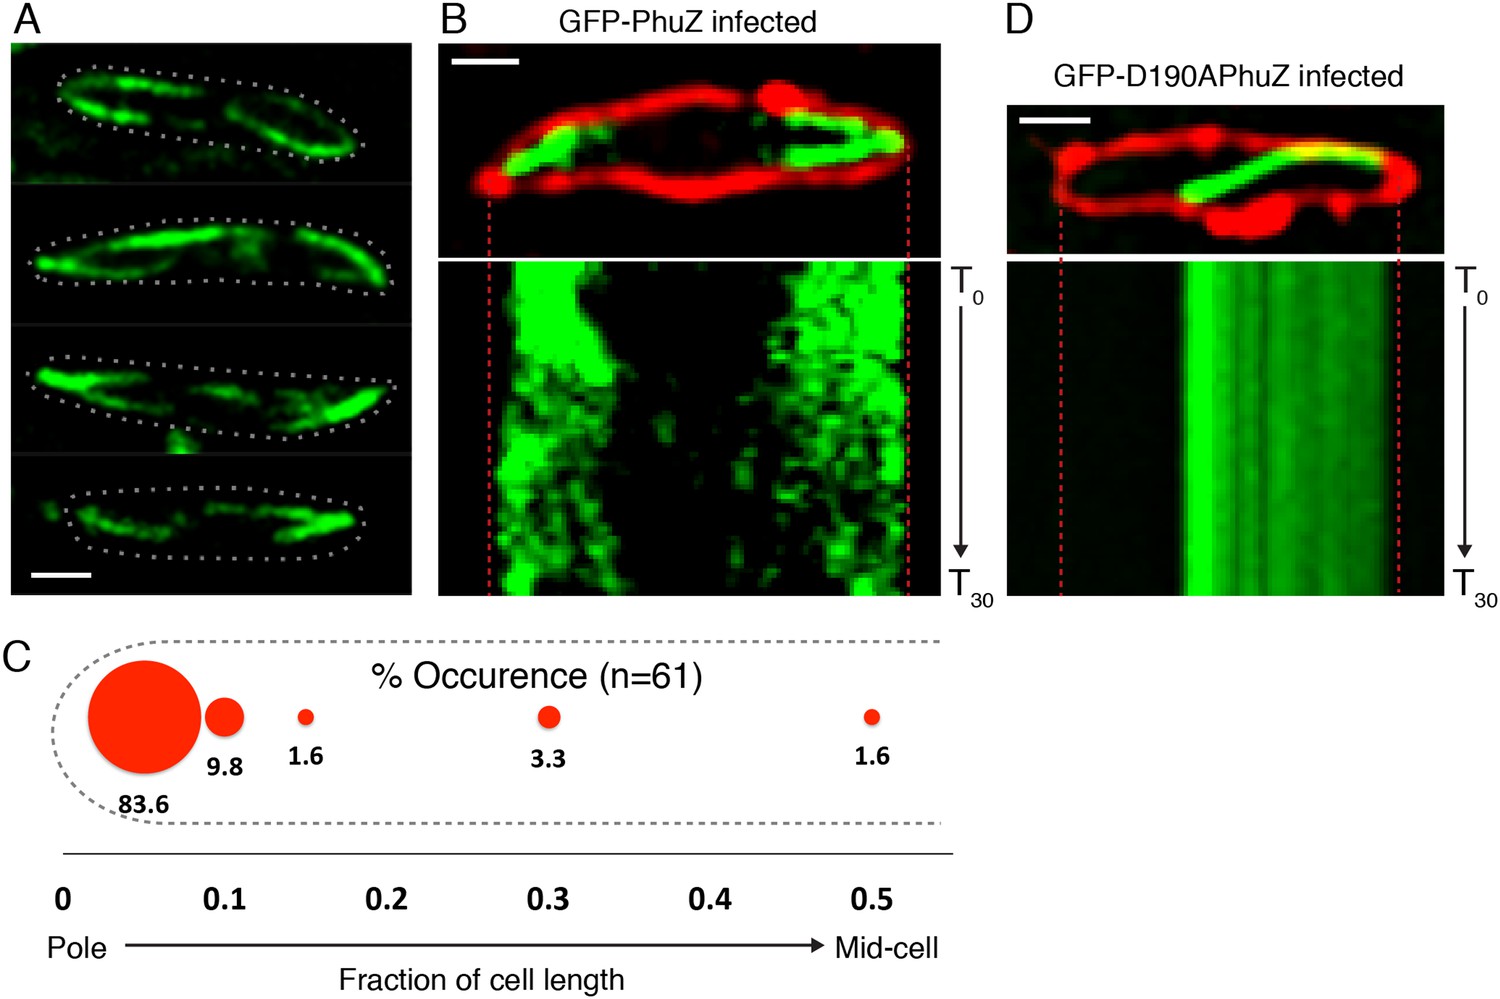
PhuZ forms a spindle composed of bipolar filaments in vivo.
(A) P. chlororaphis cells (outlined) that have been infected with phage 201ϕ2-1 for approximately 60 min have bipolar GFP-PhuZ spindles. (B) Kymograph of GFP-PhuZ fluorescence intensity in a single cell infected with phage 201ϕ2-1 throughout a 60 s window. (C) Relative positions of filament ends (closest to the cell pole) are expressed as fraction of cell length measured from several fields of infected cells at a single time point 60 min post infection (red, n = 60) and plotted as a frequency distribution (fraction of population). (D) Kymograph of GFP-D190APhuZ fluorescence intensity in a single cell infected with phage 201ϕ2-1 throughout a 60 s window. The white scale bar equals 1 micron.
Figure 5
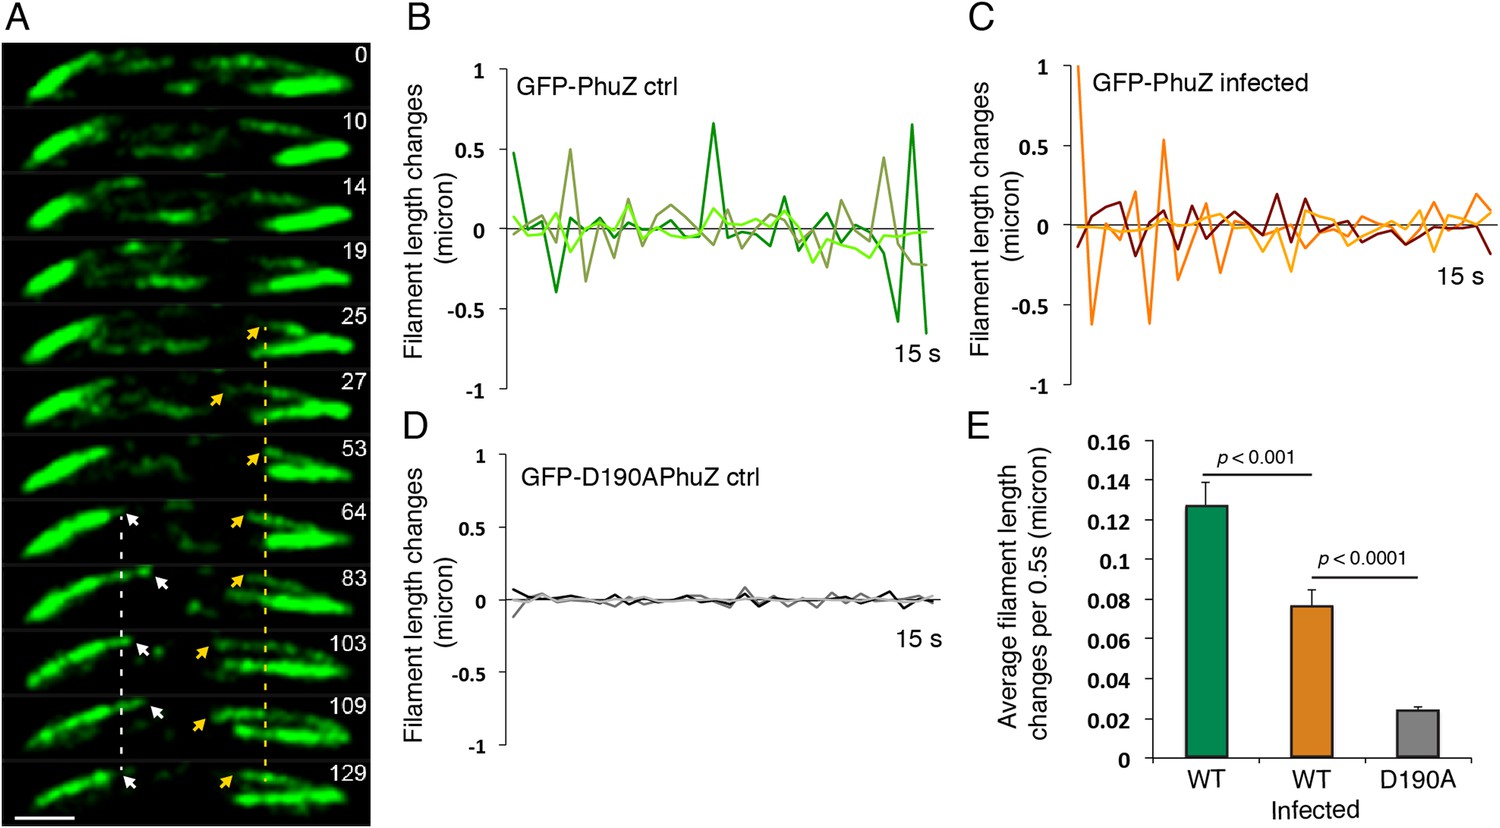
Filaments of the PhuZ spindle are dynamically unstable in vivo.
(A) Time-lapse sequence showing a single cell with a bipolar spindle over the course of 129 s. The filaments of the spindle can be observed to grow and shrink (arrows and Video 5). (B–D) Length changes of three representative GFP-PhuZ filaments, (B) GFP-PhuZ uninfected, (C) GFP-PhuZ infected, and (D) GFP-D190APhuZ ctrl, throughout 15 s window. The length of the filament was subtracted from the frame before it [n-(n-1)] and plotted over time. (E) Average of the absolute value of filament length changes per unit time (0.5 s).
Figure 6
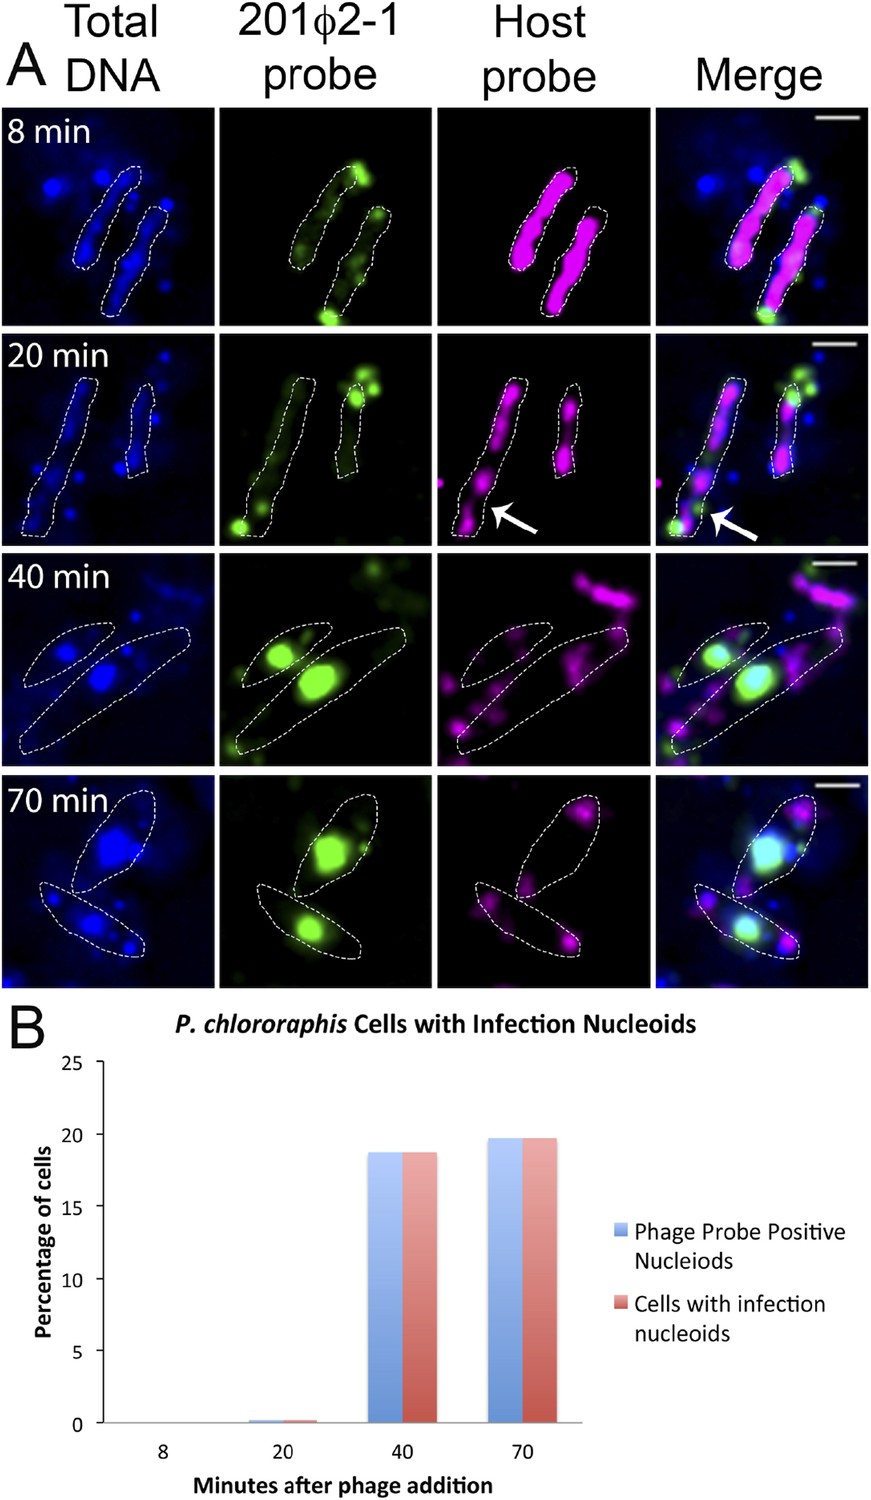
Fluorescence in situ hybridization (FISH) during phage infection.
(A) Infected P. chlororaphis cells were fixed and hybridized with DNA probes specific for either the host chromosomal DNA (pink, labeled with Cy3) or phage 201ϕ2-1 DNA (green, labeled with Cy3). Total DNA was stained with DAPI, shown in the first column. Scale bar equals 1 micron. Cells outlines are indicated with a white dotted line. By 40 min post infection, host DNA was mostly degraded and only small remnants of P. chlororaphis DNA was detectable, typically near the cell poles. (B) Graph describing development of infection nucleoids over time during infection. All infection nucleoids stained with phage probe.
Figure 7
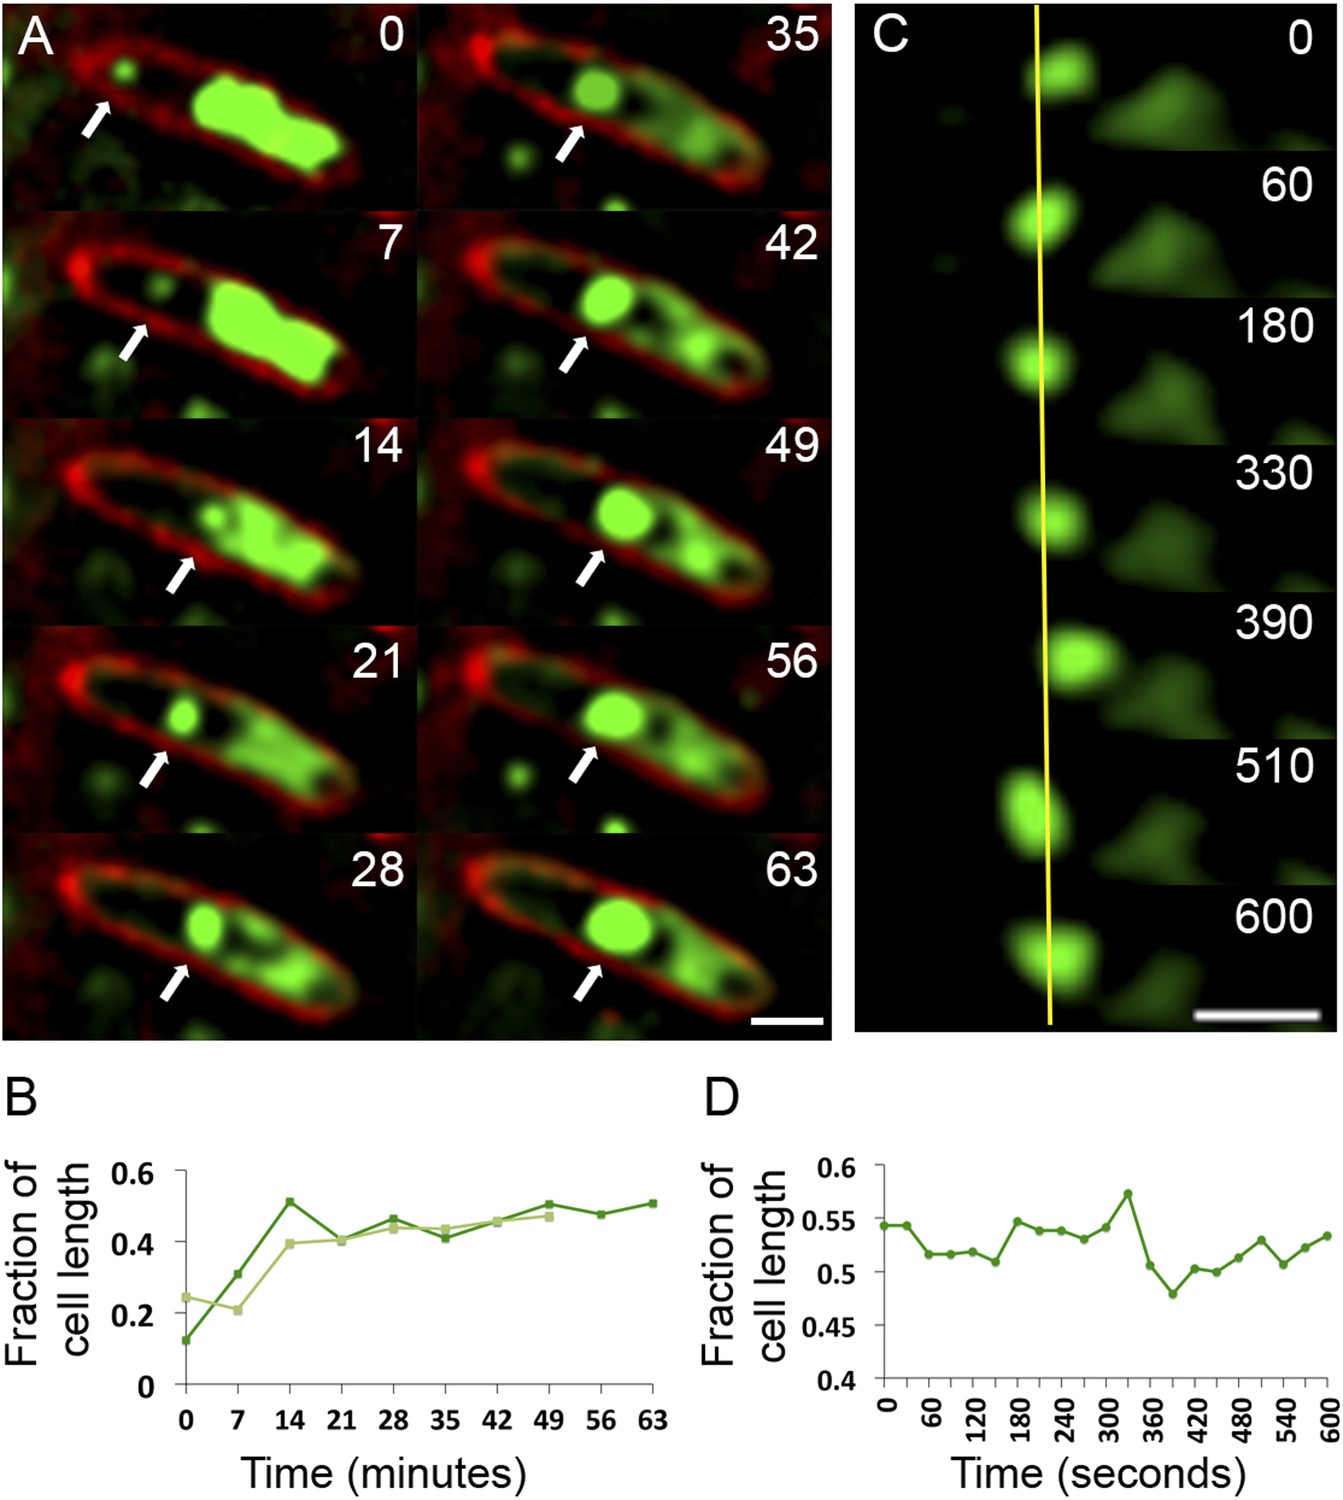
Observation of phage nucleoid migration by time-lapse microscopy.
(A) Time-lapse sequence showing development of a phage nucleoid (arrows) in a single cell over the course of 63 min. Membranes are stained red with FM 4-64 and the DNA is stained green with Syto16. At time zero, a small phage nucleoid (small green focus, arrow) is observed near the cell pole in P. chlororaphis infected with phage 201ϕ2-1. Over time the phage nucleoid moves to midcell while it increases in size. The host chromosome, which fills half of the cell at time zero (large green mass), is degraded during infection (Video 6). The scale bar equals 1 micron. (B) Position of the phage nucleoid in panel A (dark green) is recorded as fraction of cell length and plotted vs time. A second example of nucleoid migration is plotted in light green and is shown in Video 7. (C) Time-lapse showing a representative example of nucleoid oscillation in a late stage infected cell over the course of 600 s. (D) Position (expressed as fraction of cell length) of the phage nucleoid in panel C plotted vs time shows nucleoid movement. Scale bars equal 1 micron.
Figure 8
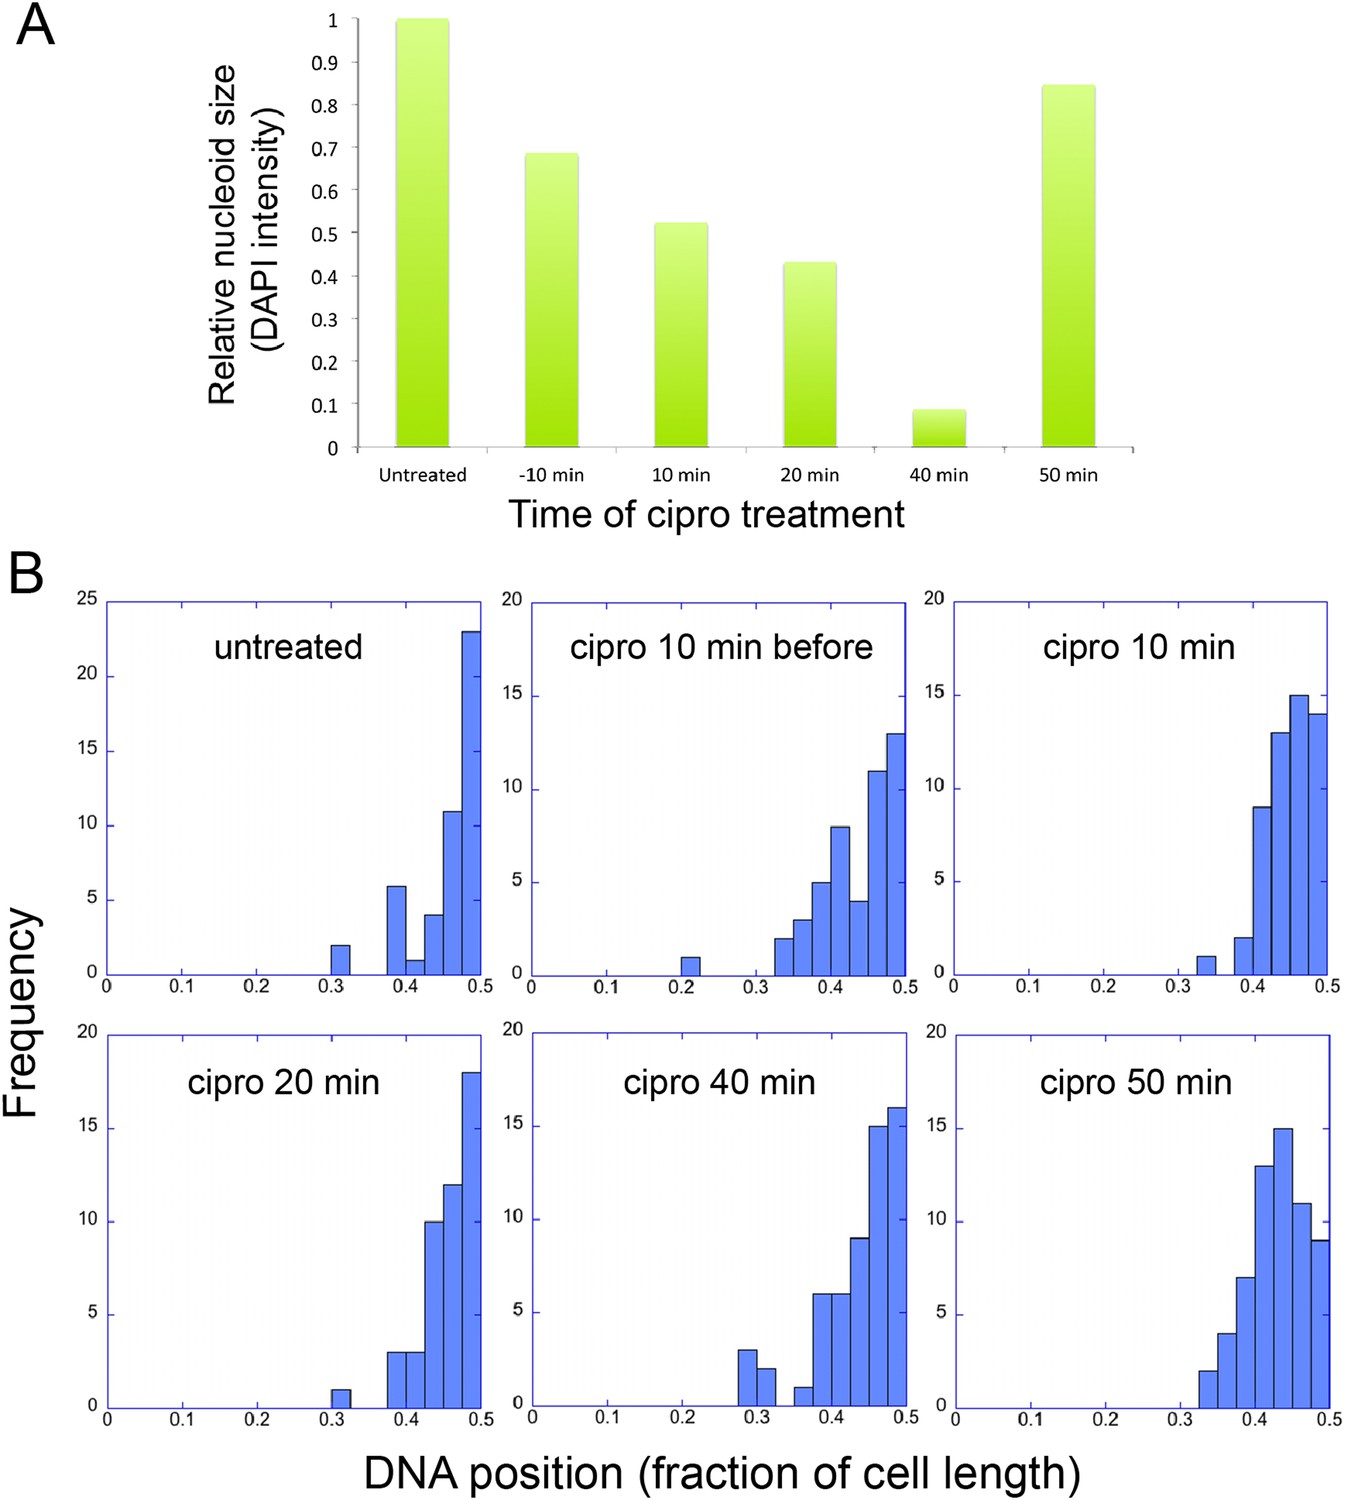
Infection Nucleoid Centering is Independent of DNA replication.
(A) DNA content of infection nucleoids was measured by DAPI staining. Cells were grown on an agarose pad and infected with phage 201ϕ2-1. Ciprofloxacin was applied to cells 10 min prior to infection or at various times (10, 20, 40, and 50 min) after infection. After 80 min of infection, cells were fixed and images were collected. Total DAPI intensity was measured for approximately 300 cells for each time point. The average total DAPI intensity was normalized to the value for untreated cells. The addition of ciprofloxacin inhibited phage nucleoid (DAPI intensity) growth when added during the first 40 of minutes phage infection, but had little effect on replication when added at 50 min, suggesting that by 50 min DNA replication was mostly completed or no longer dependent on DNA gyrase. (B) Histograms showing the position of phage DNA within the cell plotted as a fraction of cell length vs the percentage of the population (frequency) for each time point in (A). Although ciprofloxacin treatment inhibited phage DNA replication, it had no effect on phage DNA positioning.
Figure 9

Model of PhuZ bipolar spindle formation during lytic growth.
PhuZ is expressed early in lytic growth and forms dynamically unstable polymers anchored at the cell poles. Filaments polymerize unidirectionally, with GTP-bound (green) subunits adding to one end, to center the replicating phage DNA at midcell. Capsids assemble in the phage nucleoid for DNA packaging. We speculate that a yet to be identified organizing factor (purple triangles) is required for spindle assembly.
Videos
Video 1
TIRF microscopy of 2.5 μM Cy3-PhuZ (20% Cy3) filaments reveals PhuZ filaments are dynamic and translocate around the field of view. Filaments treadmill and undergo catastrophic depolymerization. Images were aquired every 250 ms for 75 s. Scale bar equals 2 μm.
Video 2
Close up of Cy3-labelled PhuZ showing annealing, severing, and depolymerization events. Images were acquired every 500 ms for 100 s. Scale bar equals 2 μm.
Video 3
Close up of Cy-3 labelled PhuZ filaments demonstrating a full depolymerization event. Zoom in from Video 1. Scale bar equals 2 μm.
Video 4
Dynamic instability and polarity of PhuZ filaments revealed by two-color TIRF microscopy. GMPCPP stabilized PhuZ seeds (20% Cy5, 5% biotin, red) were attached to biotin-PEG coated glass, and 1.5 μM Cy3-PhuZ (20% Cy3, green) and GTP were added. Green filaments are observed to grow from only one end of the seeds and exhibit dynamic instability. Images were acquired every 250 ms for 100 s. Scale bar equals 2 μm.
Video 5
Time-lapse movie of P. chlororaphis cells expressing GFP-PhuZ and infected with phage 201φ2-1 shows that PhuZ filaments form a spindle in which the centrally located ends of the filaments display dynamic instability. Arrows mark the ends of a filament in the left half of the cell. Images were captured 0.5 s apart for 2.5 min. Cells were grown on an agarose pad with 0.15% arabinose to express GFP-PhuZ from the arabinose promoter and then infected with phage.
Video 6
Time-lapse movie corresponding to the cell in Figure 4A showing development of a phage nucleoid in a single infected cell over the course of 63 min. The phage nucleoid first appears as a small green focus at the cell pole that migrates to the cell midpoint and develops into a very large infection nucleoid. Images were captured 7 min apart for 63 min. Cells were grown on an agarose pad containing Syto16 and then infected with phage. This example of nucleoid formation corresponds to the nucleoid shown in Figure 7A.
Video 7
Time-lapse movie showing development of a phage nucleoid in a single infected cell over the course of 49 min. This example of nucleoid formation and movement corresponds to one of the nucleoids reported in the graph in Figure 7C. The phage nucleoid first appears at the cell pole and then migrates to cell midpoint. Images were captured 7 min apart for 49 min. Cells were grown on an agarose pad containing Syto16 and then infected with phage.
Tables
Table 1
In vitro polymerization parameters
| Pol. Rate (µm/min*µM) | Plus-end Depol. Rate (µm/min) | Minus-end Depol. Rate (µm/min) | |
|---|---|---|---|
| PhuZ | 1.9 ± 0.1 (n = 40) | 108 ± 20 (n = 40) | 15 ± 5 (n = 40) |
| Mammalian tubulin | 0.2 (Hyman et al., 1992) | 13 (Walker et al., 1988) | 7.5 (Mitchison and Kirschner, 1984a) |
| Yeast tubulin | 0.18 (Gupta et al., 2002; Bode et al., 2003) | 103 (Gupta et al., 2002; Bode et al., 2003) | Not measured |
Download links
A two-part list of links to download the article, or parts of the article, in various formats.
Downloads (link to download the article as PDF)
Open citations (links to open the citations from this article in various online reference manager services)
Cite this article (links to download the citations from this article in formats compatible with various reference manager tools)
A bacteriophage tubulin harnesses dynamic instability to center DNA in infected cells
eLife 3:e03197.
https://doi.org/10.7554/eLife.03197


