A long non-coding RNA is required for targeting centromeric protein A to the human centromere
- Center for Cancer Research,National Cancer Institute, United States
Figures
Figure 1 with 2 supplements
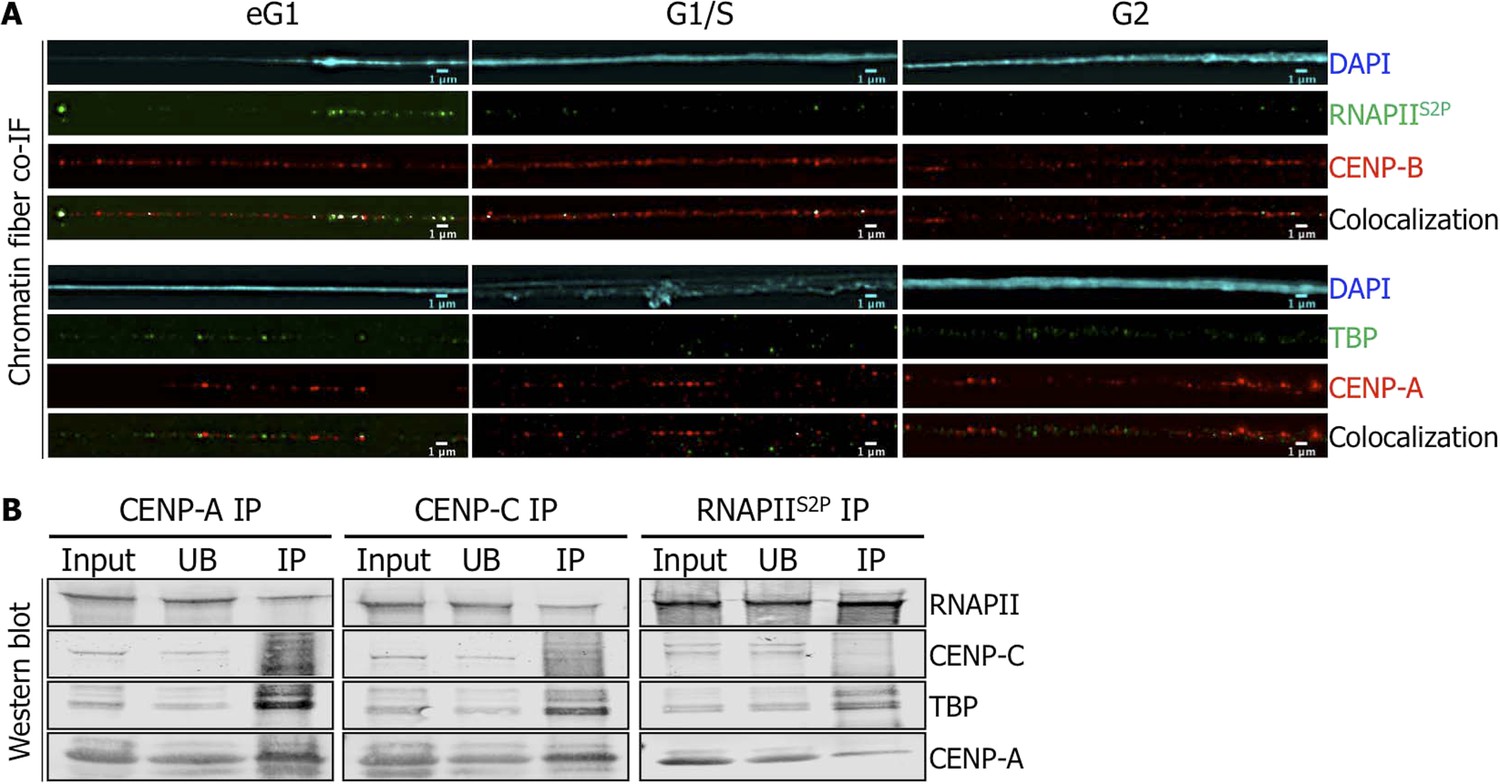
Active RNA Polymerase II (RNAPIIS2P) and TATA-box binding protein (TBP) are associated with centromeric chromatin at early G1 (eG1).
(A) Chromatin fibers prepared from synchronized HeLa cells at eG1, G1/S, and G2 phases were co-stained for RNAPIIS2P and TBP (green) with centromeric proteins CENP-B and CENP-A (red), respectively. The DAPI raw image is shown for a representative chromatin fiber (cyan). Three independent experiments were performed and in each, a minimum of five fibers were analyzed per slide (co-localization on the same chromatin fiber at eG1: between CENP-B and RNAPIIS2P = 10/15; and between CENP-A and TBP = 9/16). Scale bar: 1 μm. (B) CENP-A, CENP-C or RNAPIIS2P were immunoprecipitated, and co-purifying partners were detected on Western blots (1.5% of input and UB, 75% of IP). Co-IF, co-immunofluorescence; IP, immunoprecipitate; UB, unbound.
Figure 1—figure supplement 1
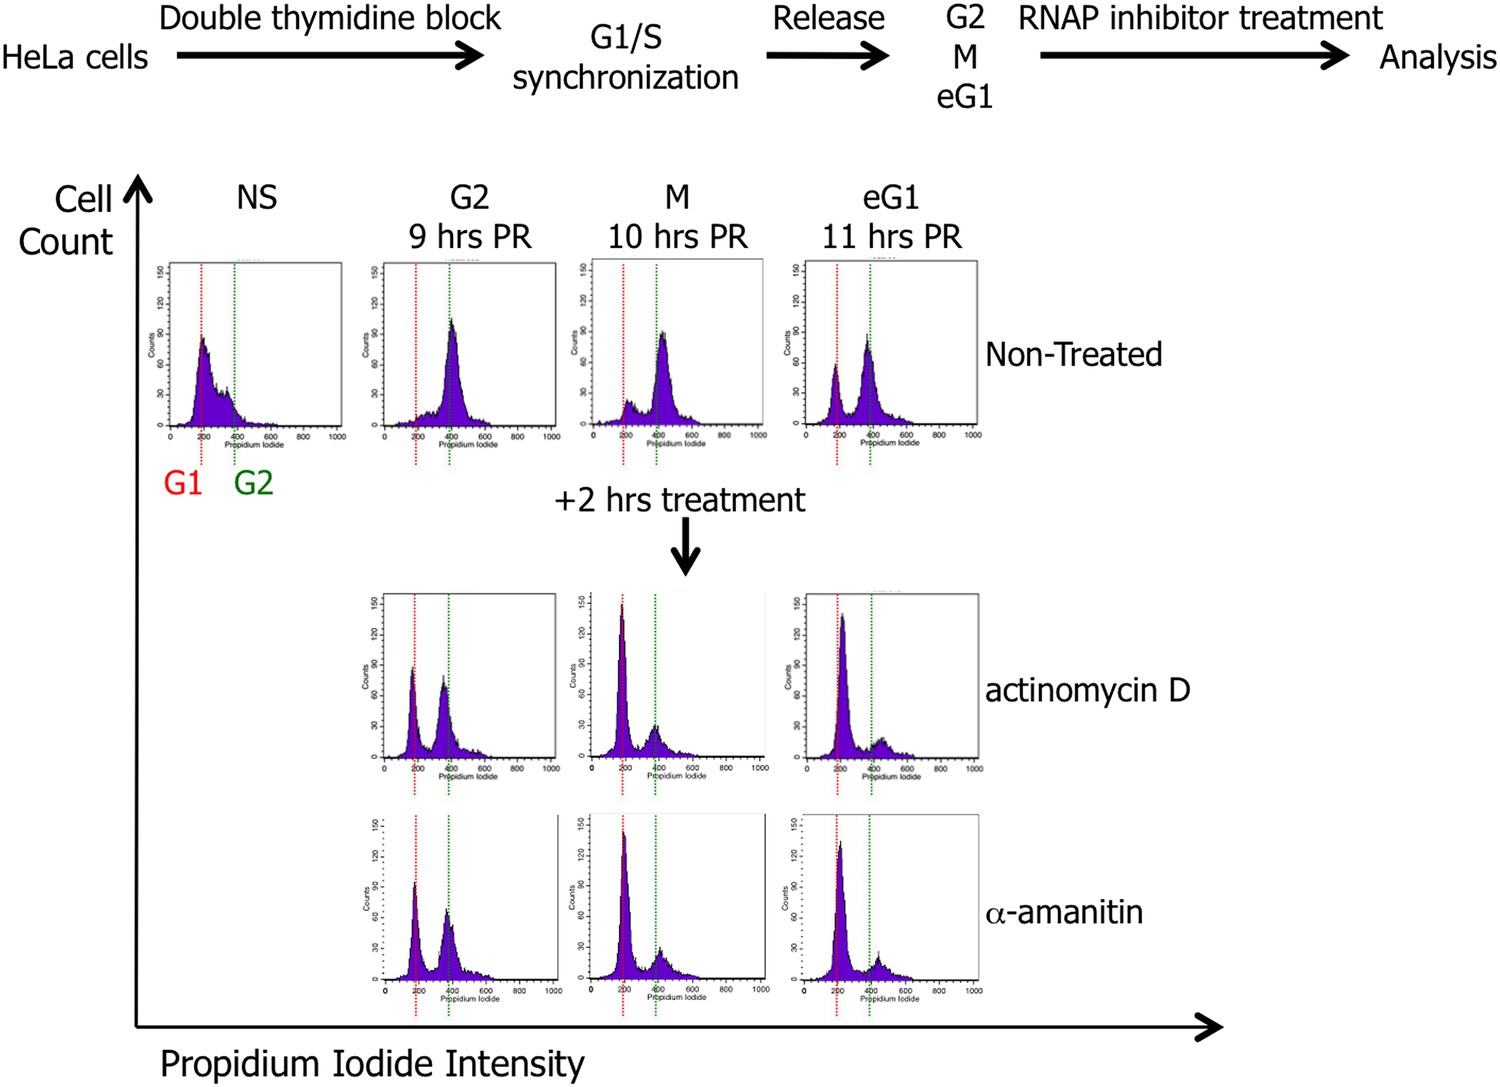
Scheme presenting the strategy for HeLa cell synchronization and treatment with drugs (actinomycin D or α-amanitin) inhibiting either RNA Polymerase I or RNA Polymerase II activity.
HeLa cells were synchronized in G1/S phase by two consecutives treatments of thymidine, and then released until G2 (9 hr), mitosis (M; 10 hr), and early G1 (eG1; 11 hr) cell cycle phases. The synchronization and the potential effect of actinomycin D or α-amanitin treatment (2 hr) were assessed by cell cycle analysis. NS, non-synchronized cells; PR, post-release.
Figure 1—figure supplement 2
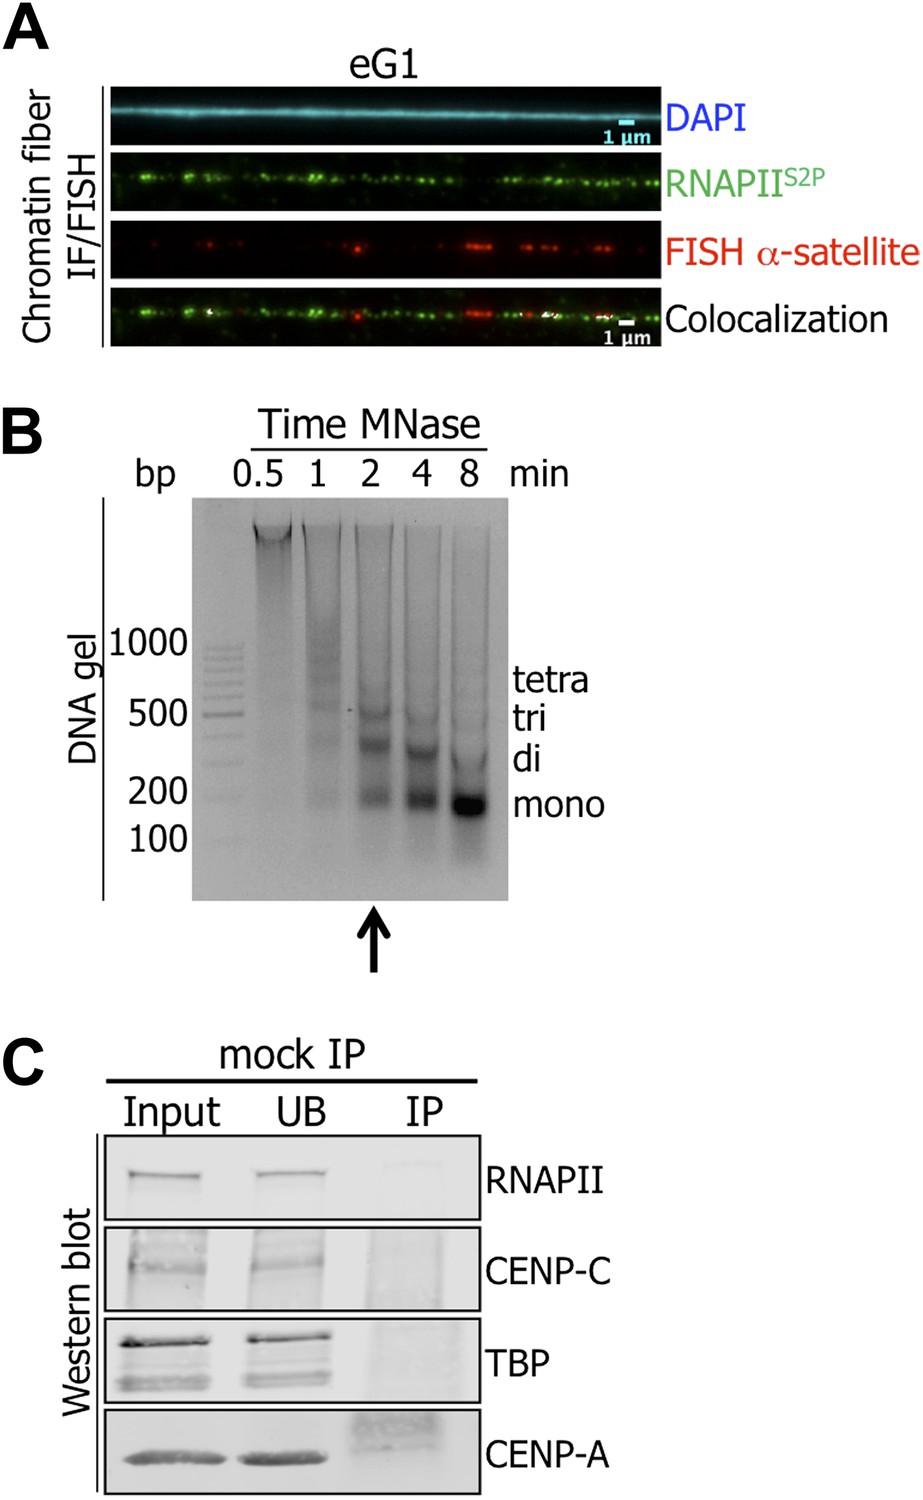
Active RNA Polymerase II (RNAPIIS2P) is associated with centromeric α-satellite sequences on chromatin fibers at early G1 (eG1).
(A) RNAPIIS2P (green) was co-stained with centromeric α-satellite DNA FISH probe (red) on chromatin fibers from eG1-synchronized cells. (cyan, DAPI). Three independent experiments were performed, and a minimum of five fibers were counted per slide (co-localization on the same chromatin fiber: between CENP-B and centromeric α-satellite DNA = 11/15). (B) The progressive accumulation of mono-nucleosomes after chromatin digestion (0.5–8 min) with MNase was analyzed on agarose gel. The arrow indicates the chosen MNase time used for experiments in the manuscript. (C) Chromatin extract was incubated in presence of agarose beads and co-precipitated proteins were analyzed on Western blot (1.5% of input and UB, 75% of IP). FISH, fluorescence in situ hybridization; co-IF, co-immunofluorescence; IP, immunoprecipitate; UB, unbound.
Figure 2
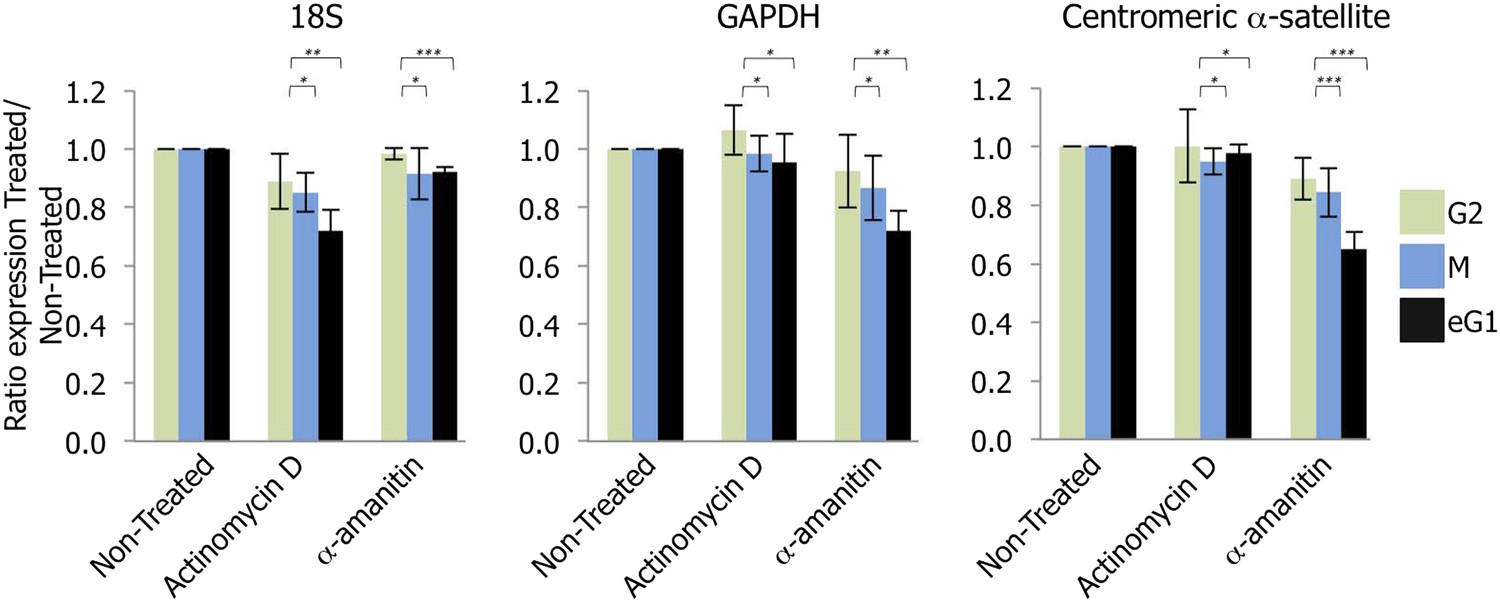
Transcription of centromeres is dependent on RNA Polymerase II (RNAPII) and occurs at early G1 (eG1).
G2 (green), mitotic (M; blue), and eG1 (black) synchronized cells were treated 2 hr with either actinomycin D or α-amanitin, to block RNA Polymerase I or RNAPII, respectively. After RNA purification and retro-transcription, expression levels of control target genes (18S rRNA and GAPDH) and centromeric α-satellite transcripts were assessed by semi-quantitative PCR. The graph represents the average of three biological replicates, the y-axis plots the ratio (± SD) of gene expression after treatment (actinomycin D or α-amanitin) compared to the non-treated condition. p-values indicating statistical significance are presented where appropriate above the histograms. *p>0.1, **0.001 < p < 0.05, and ***p<0.001.
Figure 3 with 1 supplement

RNA Polymerase II (RNAPII)-dependent transcription is required for the recruitment of CENP-A and its chaperone HJURP onto the centromere at early G1 (eG1).
(A) eG1 synchronized HeLa cells were treated or not (NT) with α-amanitin (α-ama) for 2 hr before staining for centromeric proteins CENP-A or CENP-B (green). The DAPI raw image is shown for a representative cell (cyan). Three independent experiments were performed and in each, a minimum of 30 cells were analyzed per slide. Scale bar: 5 μm. (B) Signal intensity of CENP-A and CENP-B spots from (A) was quantified using ImageJ, and relative ratios of α-amanitin vs non-treated conditions were determined. Means ± SD from three independent experiments is represented on the graph. Quantification values are tabulated in Supplementary file 1. (C) Centromeric proteins CENP-A and CENP-B (red) were co-stained with HJURP (green) and RNAPII phosphorylated on serine 2 (RNAPIIS2P, green), respectively, on centromeric chromatin fibers prepared from eG1 synchronized cells treated or not with α-amanitin for 2 hr (cyan, DAPI). Three independent experiments were performed and in each, a minimum of five chromatin fibers were analyzed per slide (co-localization on the same chromatin fiber after α-amanitin compared to non-treated: between CENP-B and RNAPIIS2P = 9/15 vs 10/15; and between CENP-A and HJURP = 2/15 vs 9/15). Scale bar: 1 μm. Co-IF, co-immunofluorescence.
Figure 3—figure supplement 1
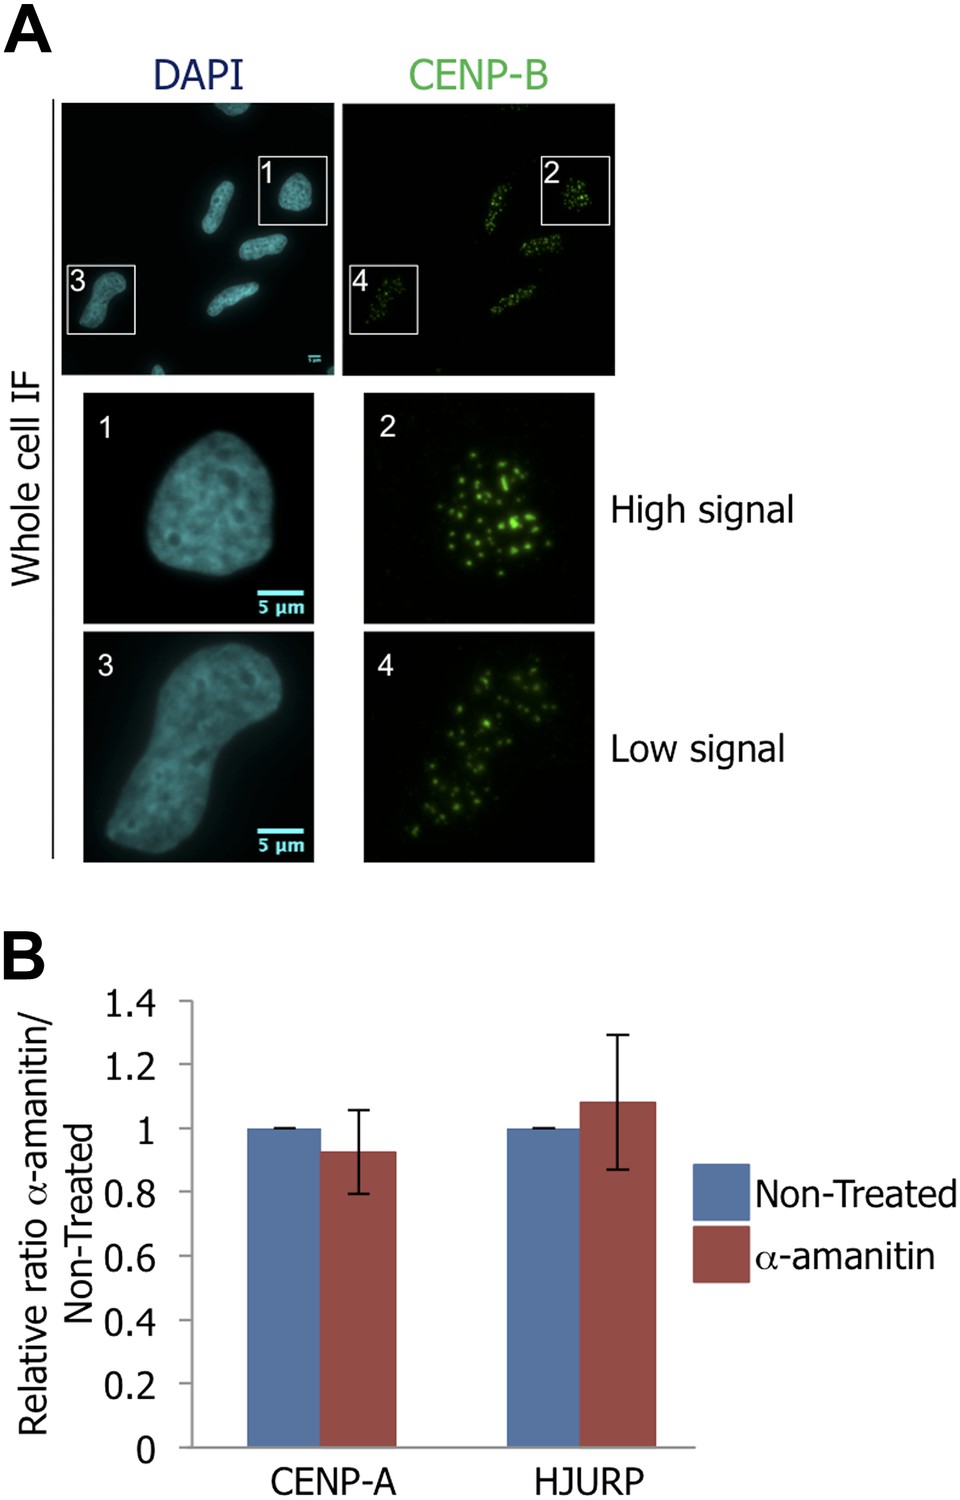
Inhibition of RNA Polymerase II-dependent transcription at early G1 (eG1) does not affect CENP-A and HJURP protein levels.
(A) eG1-synchronized HeLa cells were treated with α-amanitin for 2 hr before staining for centromeric protein CENP-B (green) and DAPI (cyan). The heterogeneity of the CENP-B signal on a picture is shown with magnification of one cell with high signal (1 and 2) and low signal (3 and 4). Scale bar: 5 μm. (B) eG1-synchronized cells were treated, or not, with α-amanitin (2 hr), before total protein extraction, and the expression levels of CENP-A and HJURP were quantified by Western blot. The graph represents the average of three biological replicates, the y-axis plots the ratio (±SD) of protein level after α-amanitin compared to the non-treated condition for CENP-A and HJURP Western blot, respectively. IF, immunofluorescence.
Figure 4 with 4 supplements
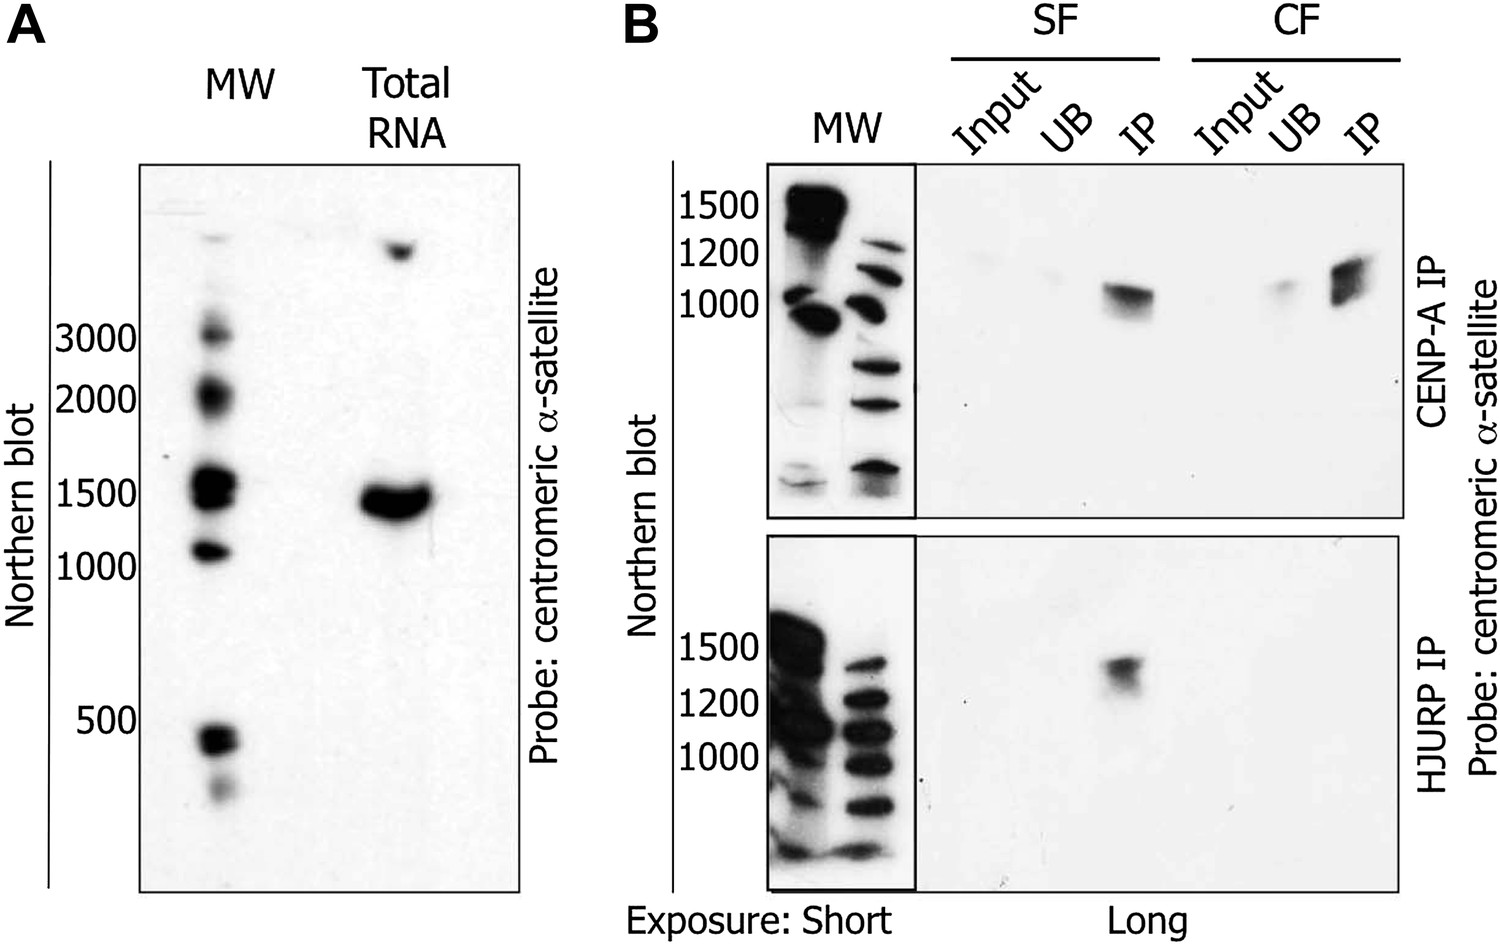
The pre-assembly soluble HJURP/CENP-A complex binds a 1.3 kb centromeric transcript at early G1 (eG1).
(A) Total RNAs from HeLa cells were separated on denaturing gel and visualized by Northern blot with radiolabeled centromeric α-satellite probes. (B) Co-immunoprecipitated RNAs by CENP-A or HJURP were analyzed by Northern blot as in (A). CF, chromatin fraction; IP, immunoprecipitate; MW, molecular weight; SF, soluble fraction; UB, unbound.
Figure 4—figure supplement 1
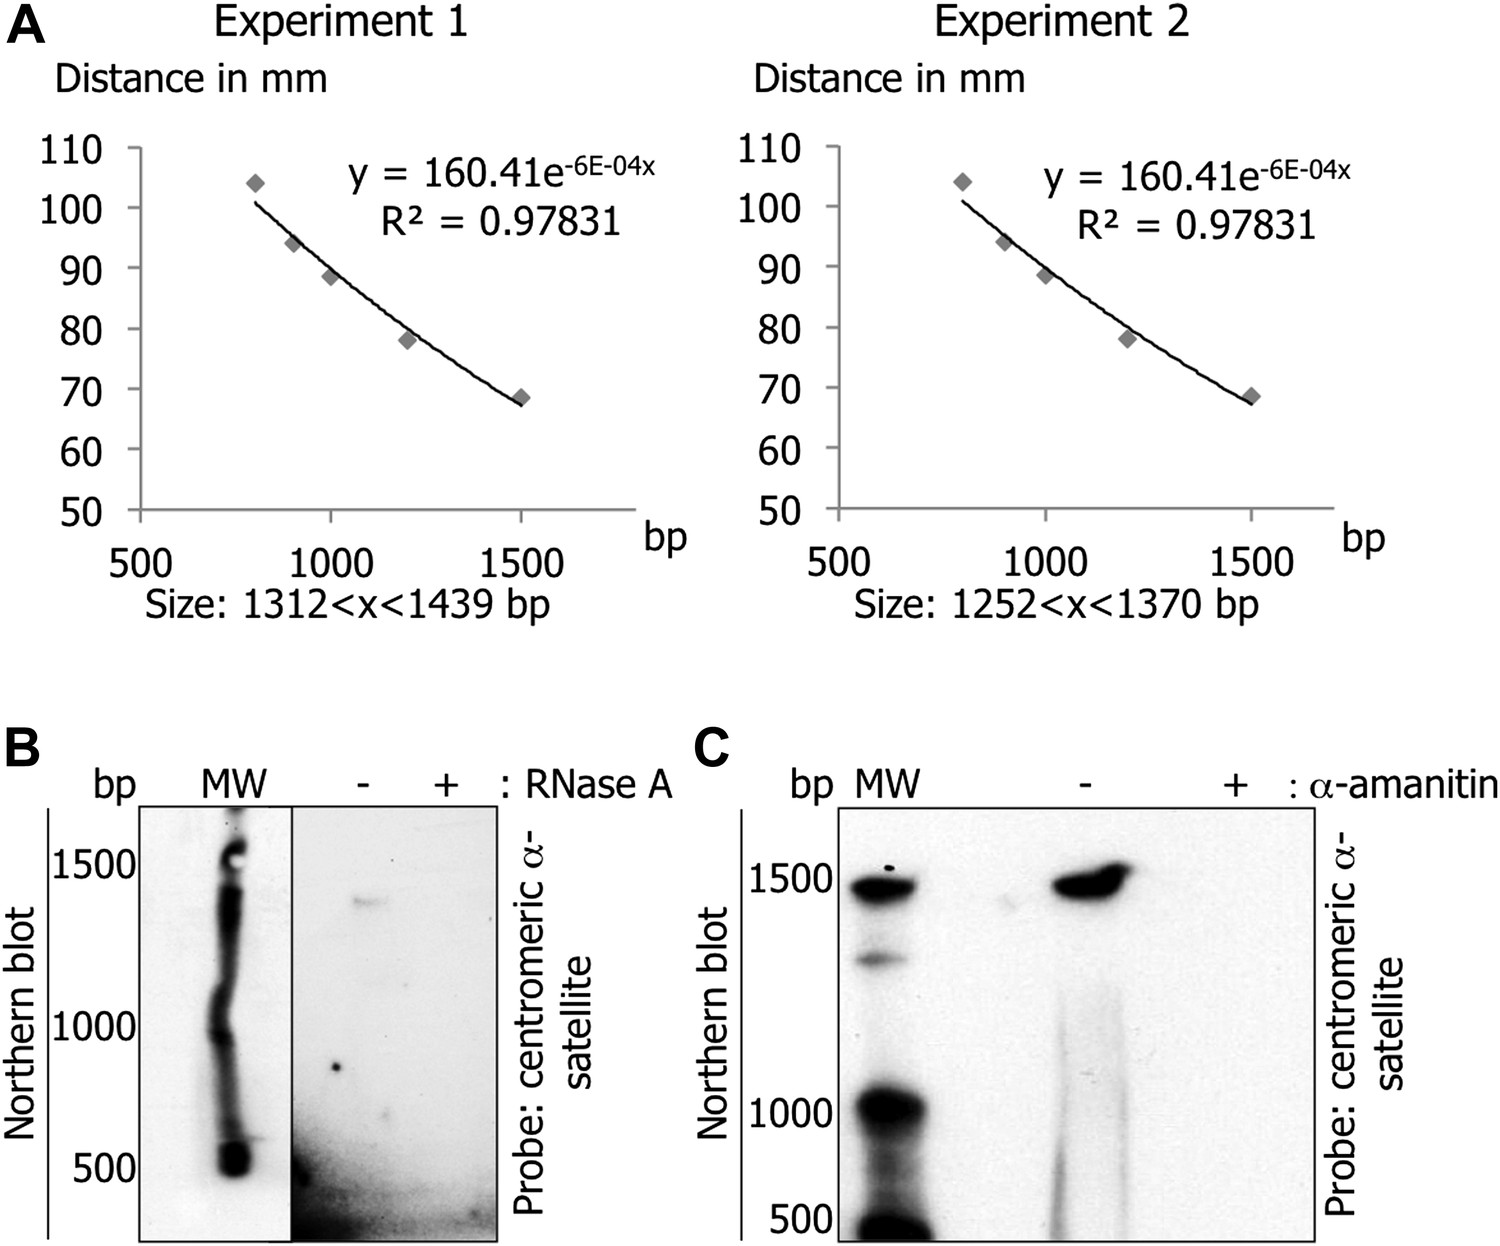
Centromeric transcripts are 1.3 kb in length.
(A) To determine the size of the centromeric α-satellite transcripts, the graph of the distance (in y) between the border of the Northern blot and each band of the molecular weight as a function of the number of bases was made. The distance of the centromeric α-satellite transcript band was analyzed using the standard curve from this graph to deduce its size. (B) Total RNAs treated with RNase A were separated on a denaturing gel, and revealed by Northern blot with radiolabeled centromeric α-satellite probes. (C) eG1-synchronized cells were treated, or not, with α-amanitin (2 hr). RNAs were processed and analyzed on Northern blot as in (B) to examine whether trace DNA contamination could yield the same band as in (A).
Figure 4—figure supplement 2
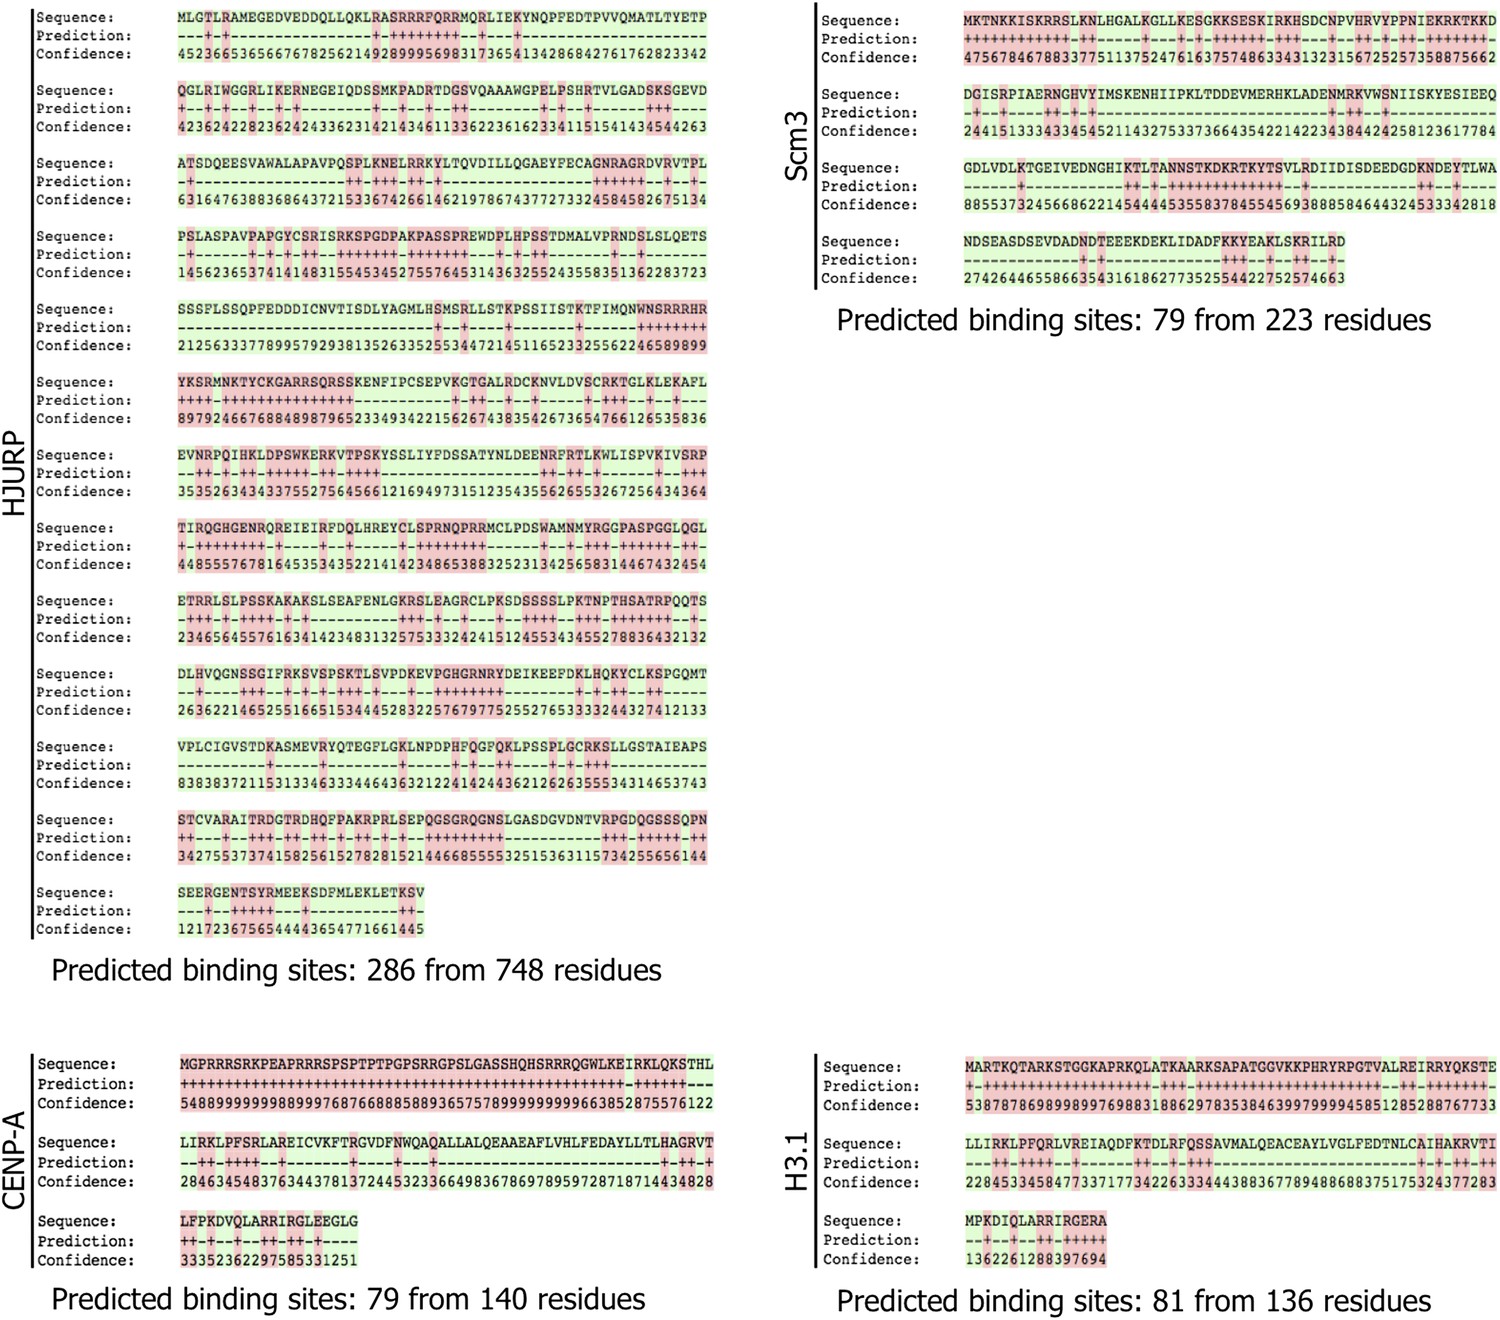
HJURP and CENP-A display potential RNA binding residues.
RNA binding residues in CENP-A, H3, Scm3, and HJURP were predicted by computational analysis using the BindN+ program. Binding residues are labeled with ‘+’ and in red, whereas non-binding residues are labeled with ‘−’ and in green. The confidence of binding potential ranges from low (0) to high (9).
Figure 4—figure supplement 3
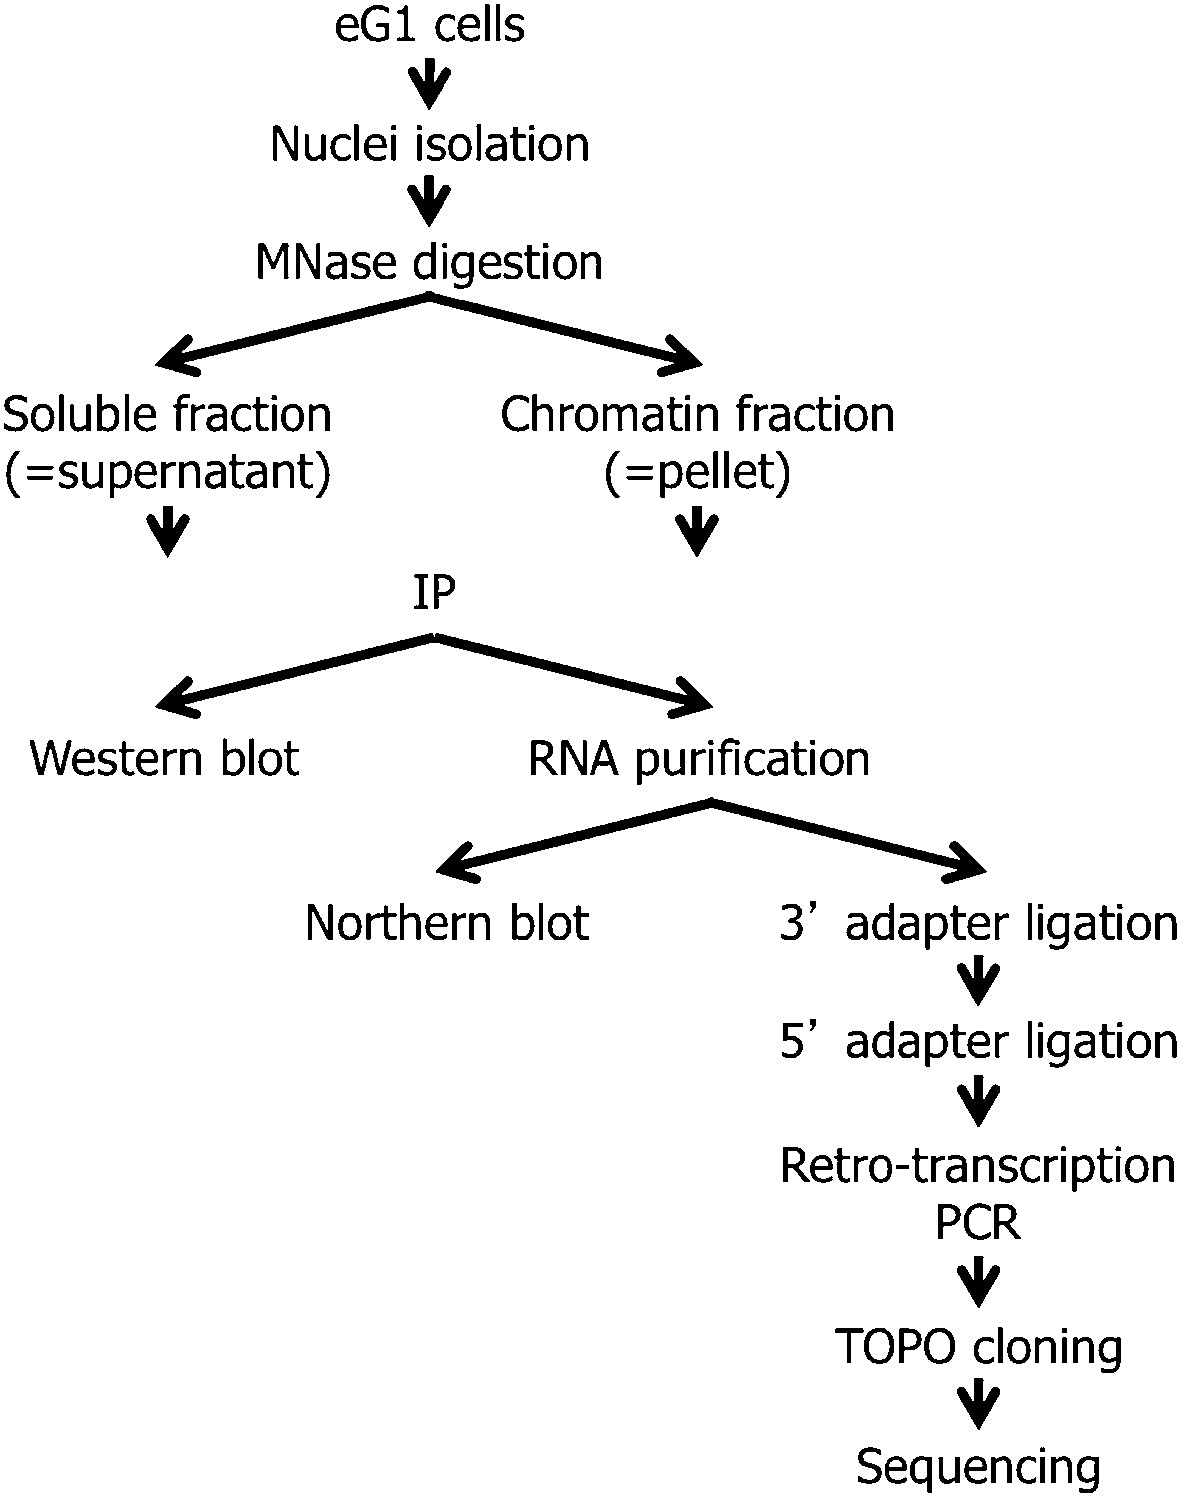
Scheme presenting the strategy for RNA-chromatin immunoprecipitation, RNA purification, and sub-cloning for sequencing.
https://doi.org/10.7554/eLife.03254.012
Figure 4—figure supplement 4
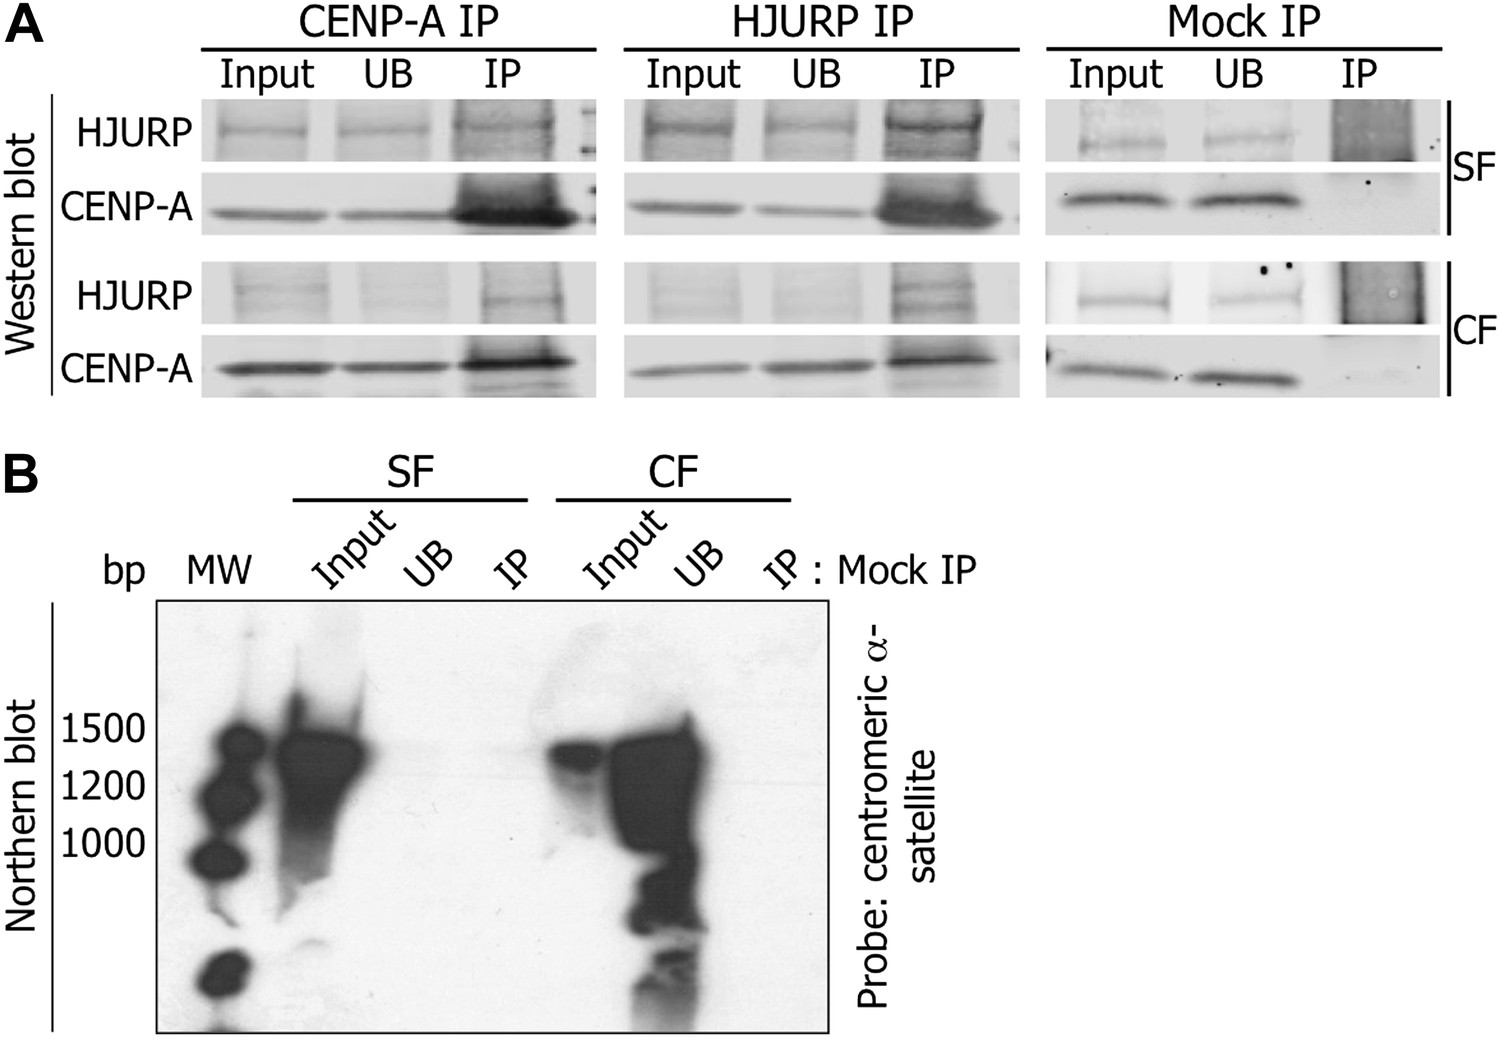
Mock IPs demonstrate specificity of the 1.3 kb RNA binding to CENP-A and HJURP.
(A) CENP-A and HJURP were immunoprecipitated from eG1 cells, separated on SDS-PAGE and revealed on Western blot (1.5% of input and UB, 100% of IP). To exclude non-specific binding of CENP-A or HJURP to the secondary beads, immunoprecipitation was performed with beads in the absence of antibody (mock IP). (B) RNAs immunoprecipitated from the mock IP in (A) were analyzed on Northern blot using radiolabeled centromeric α-satellite probes. CF, chromatin fraction; IP, immunoprecipitate; MW, molecular weight; SF, soluble fraction; UB, unbound.
Figure 5 with 5 supplements
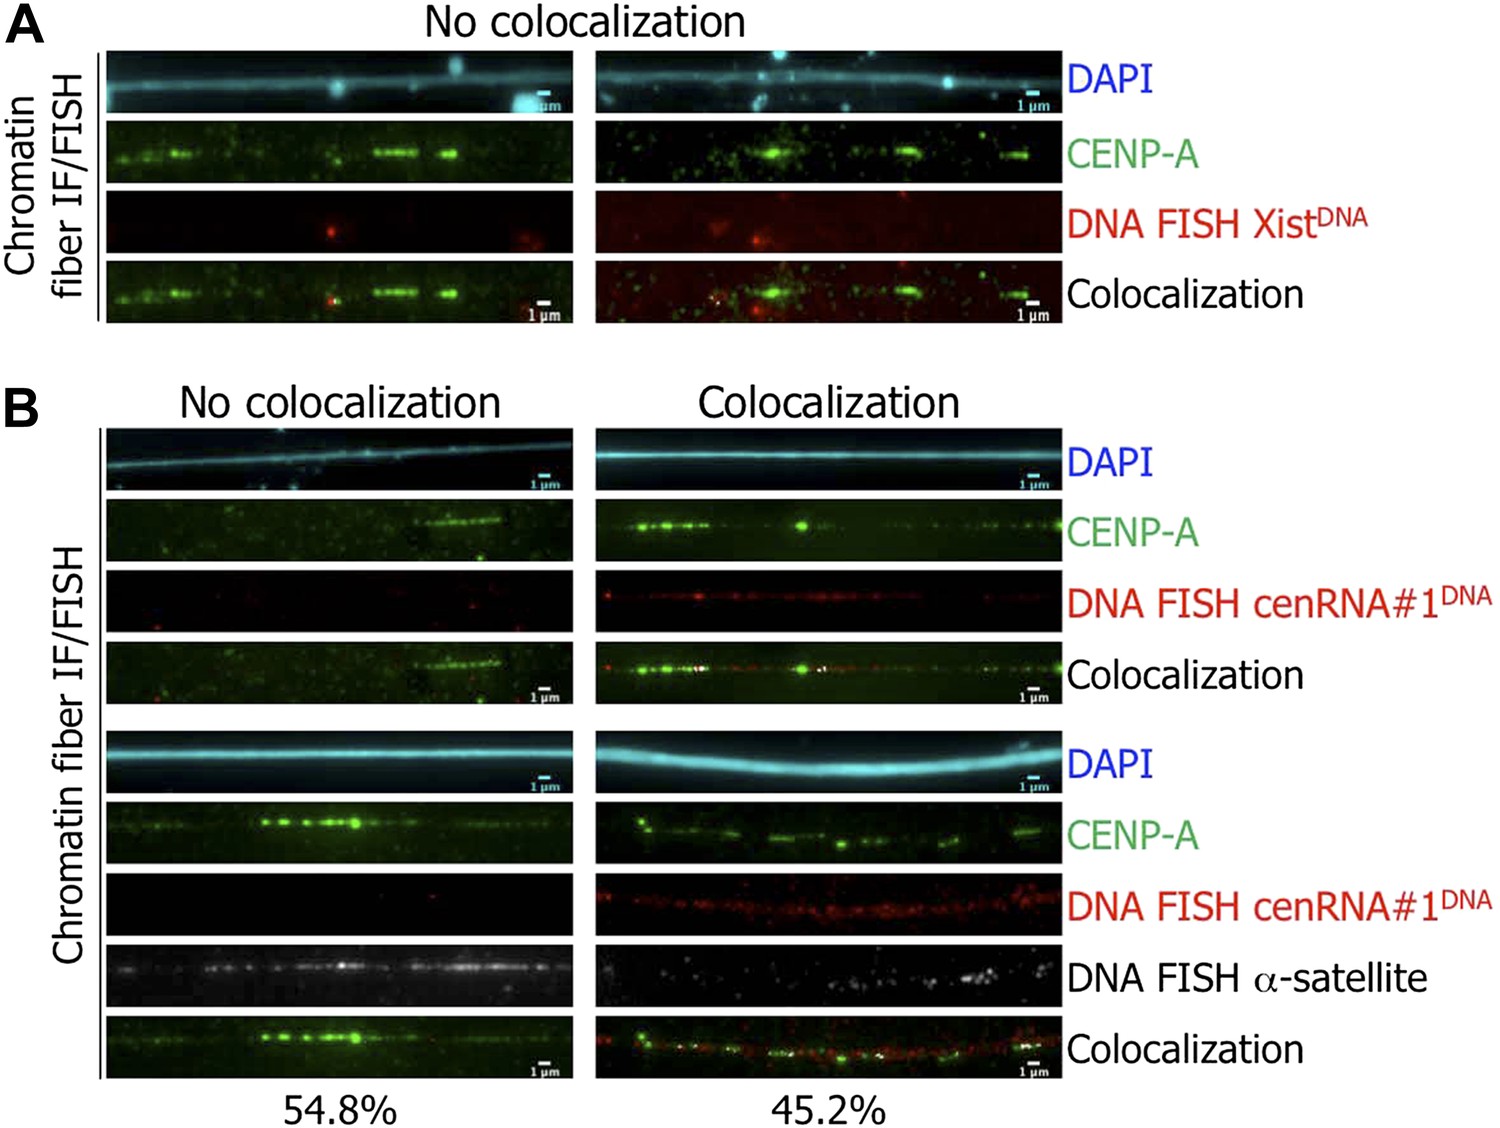
The identified cenRNA#1 transcript associated with CENP-A has a centromeric origin.
(A) CENP-A (green) was co-stained with Xist DNA FISH probe (FISH XistDNA, red) on chromatin fibers (cyan, DAPI). Two independent experiments were performed and in each, a minimum of eight chromatin fibers were analyzed per slide (co-localization on the same chromatin fiber between CENP-A and FISHXistDNA = 0/18). Scale bar: 1 µ m. (B) Chromatin fibers were either co-stained by IF/FISH with CENP-A (green) and cenRNA#1DNA (red), or IF/double-FISH with CENP-A (green), cenRNA#1DNA (red) and centromeric α-satellite probes (gray). The DAPI raw image is shown for a representative chromatin fiber (cyan). Two independent experiments were performed and in each, a minimum of eight chromatin fibers were analyzed per slide (co-localization on the same chromatin fiber between CENP-A and cenRNA#1DNA and FISH α-satellite compared to no co-localization = 9/20 vs 11/20). Scale bar: 1 µm. FISH, fluorescencein situ hybridization; IF, immunofluorescence.
Figure 5—figure supplement 1
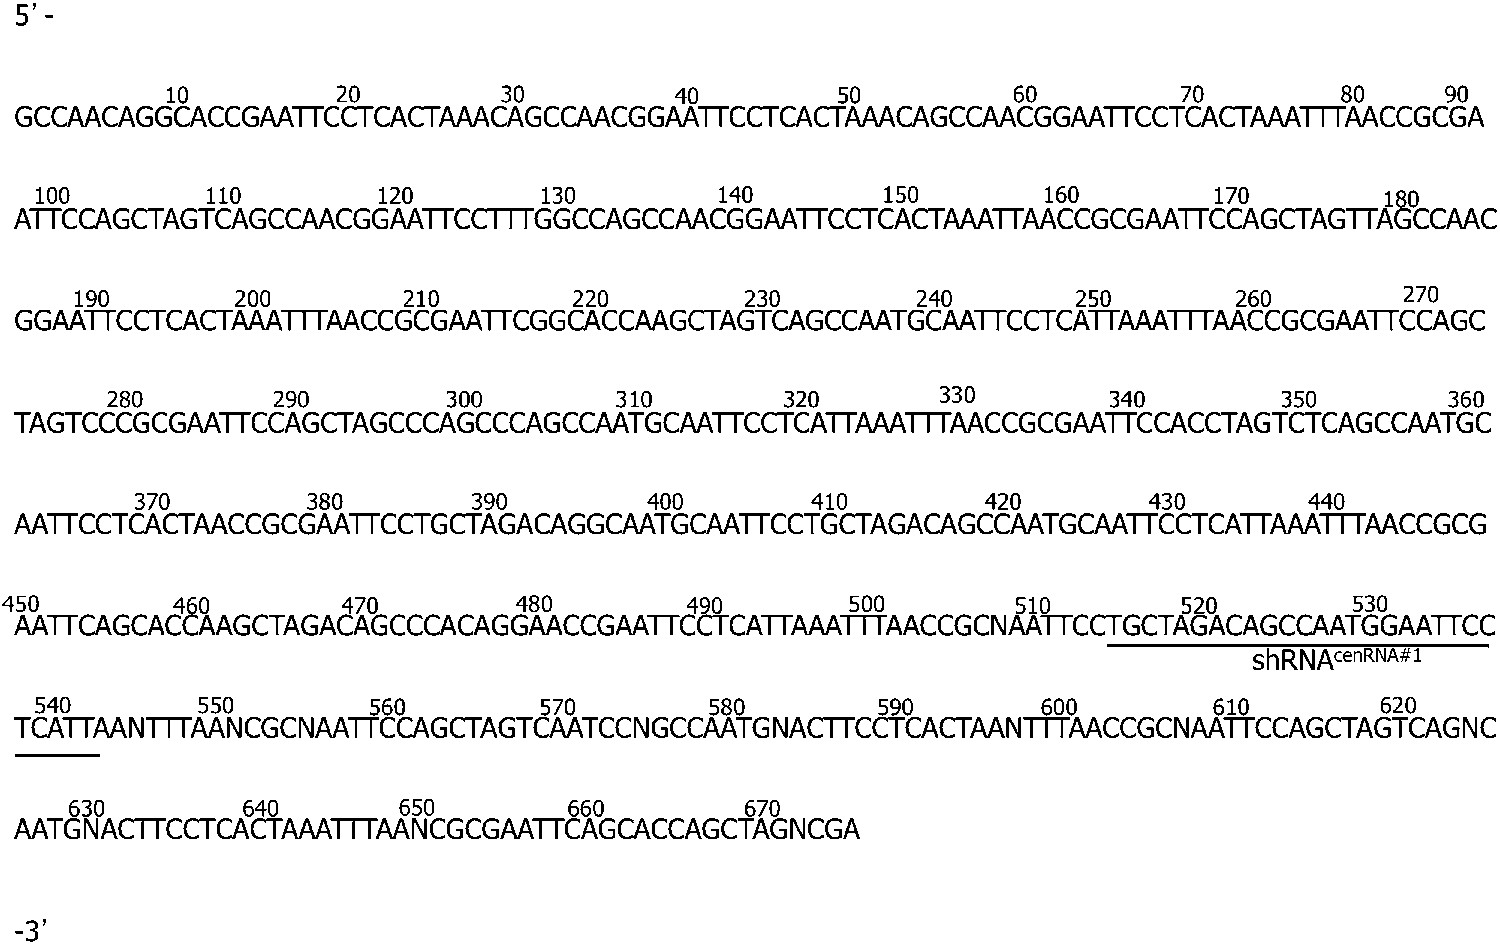
Sequence of cenRNA#1.
RNAs immunoprecipitated with CENP-A were retro-transcribed and subcloned. One 675 nucleotide long sequence called cenRNA#1 was obtained by sequencing, and is reported here. The sequence of shRNAcenRNA#1 is underlined.
Figure 5—figure supplement 2
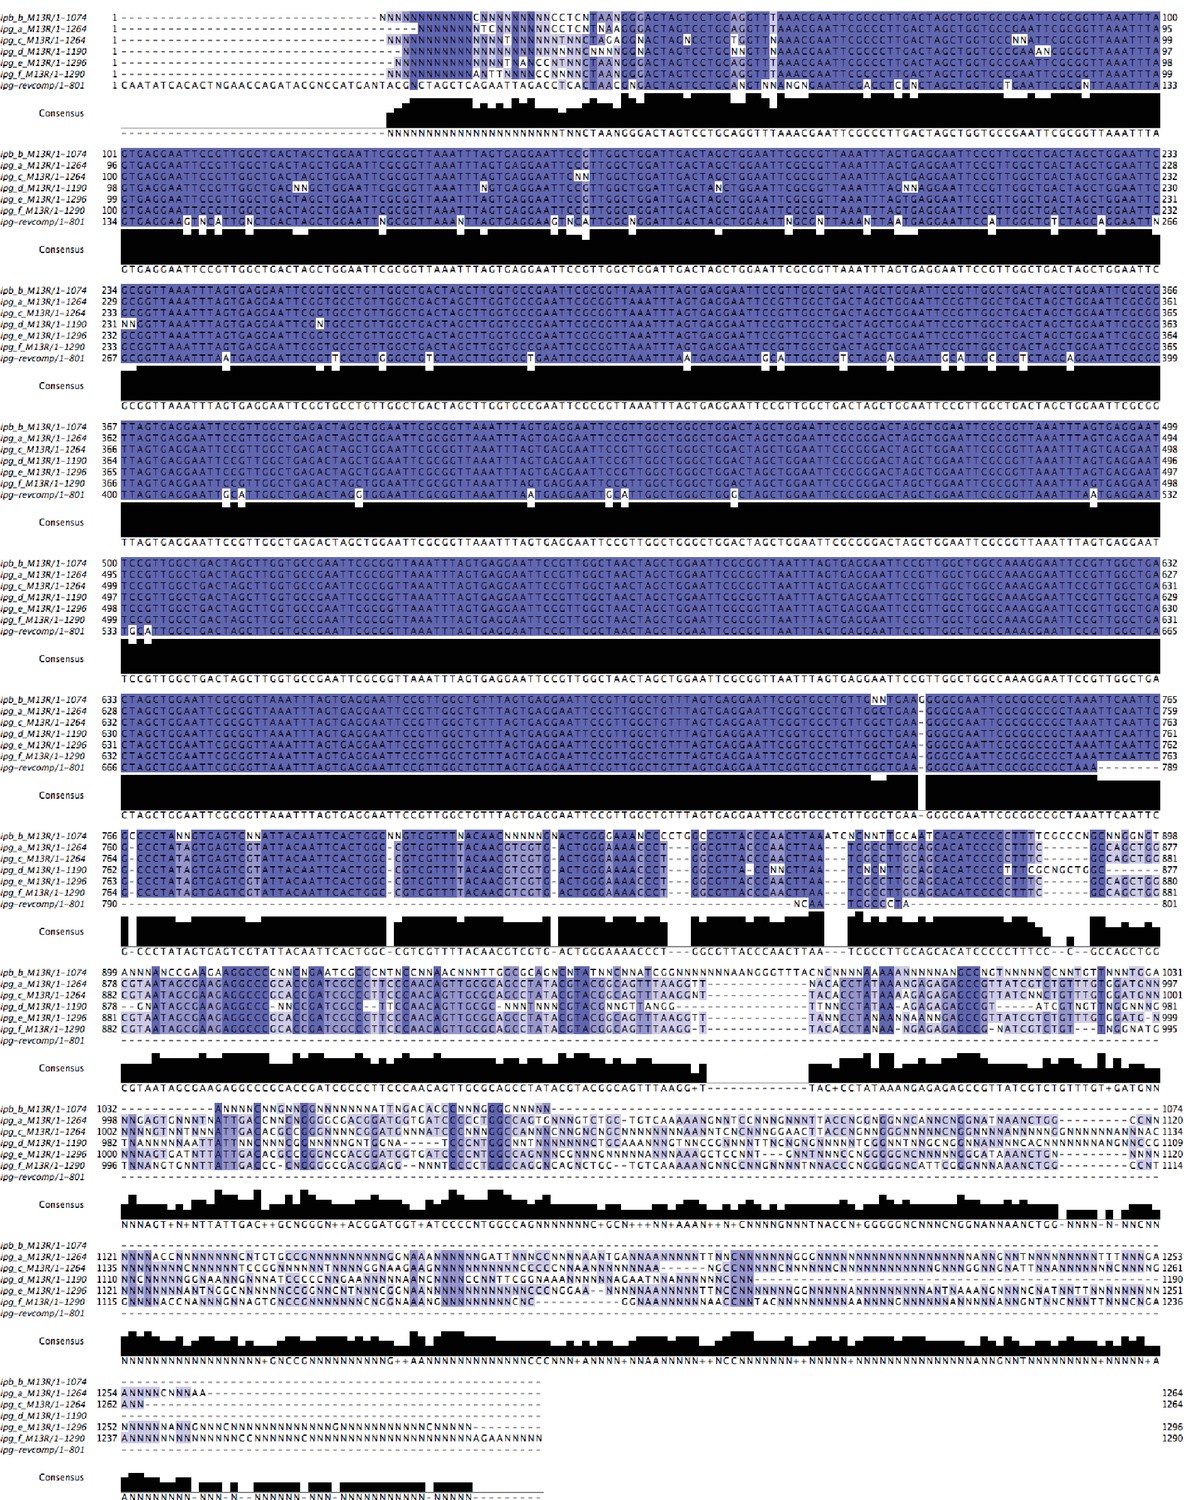
Alignment of the original cenRNA1 with new sequencing results.
Adjustment was performed when similar uncalled bases (12 N’s) or called bases (27) were found in the six clones (~6% of total sequence changed).
Figure 5—figure supplement 3
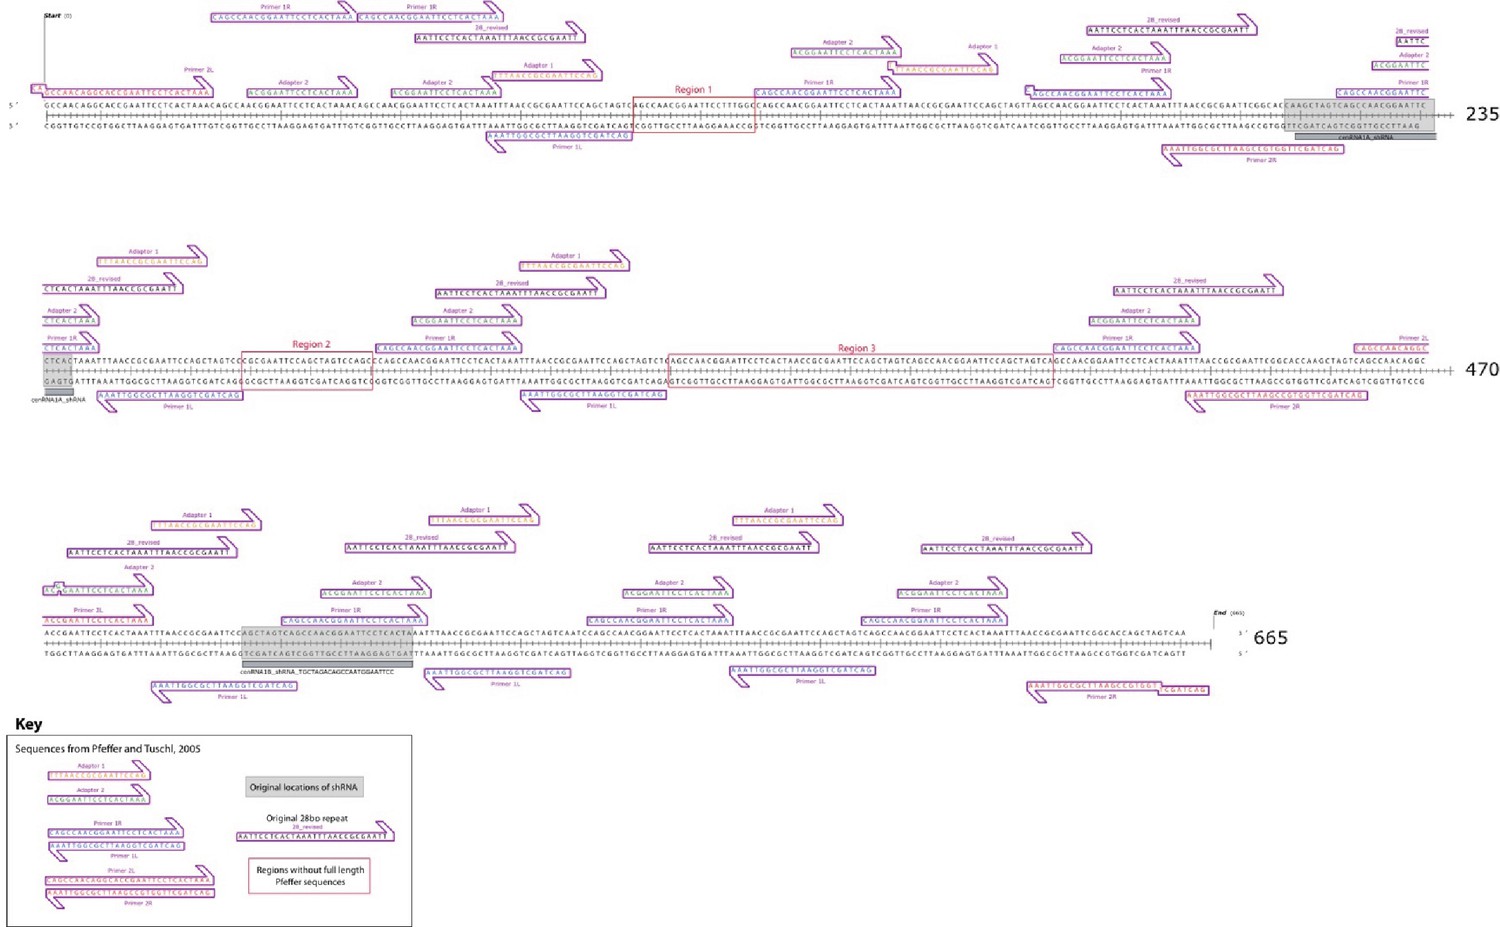
Map of re-sequenced cenRNA#1
Sequence alignments revealed that cenRNA#1 is principally composed of adapters used for cloning step described in (Pfeffer et al., 2005). Only full-length, 100% identical locations of Pfeffer et al. sequences are indicated (except at sequence ends).
Figure 5—figure supplement 4
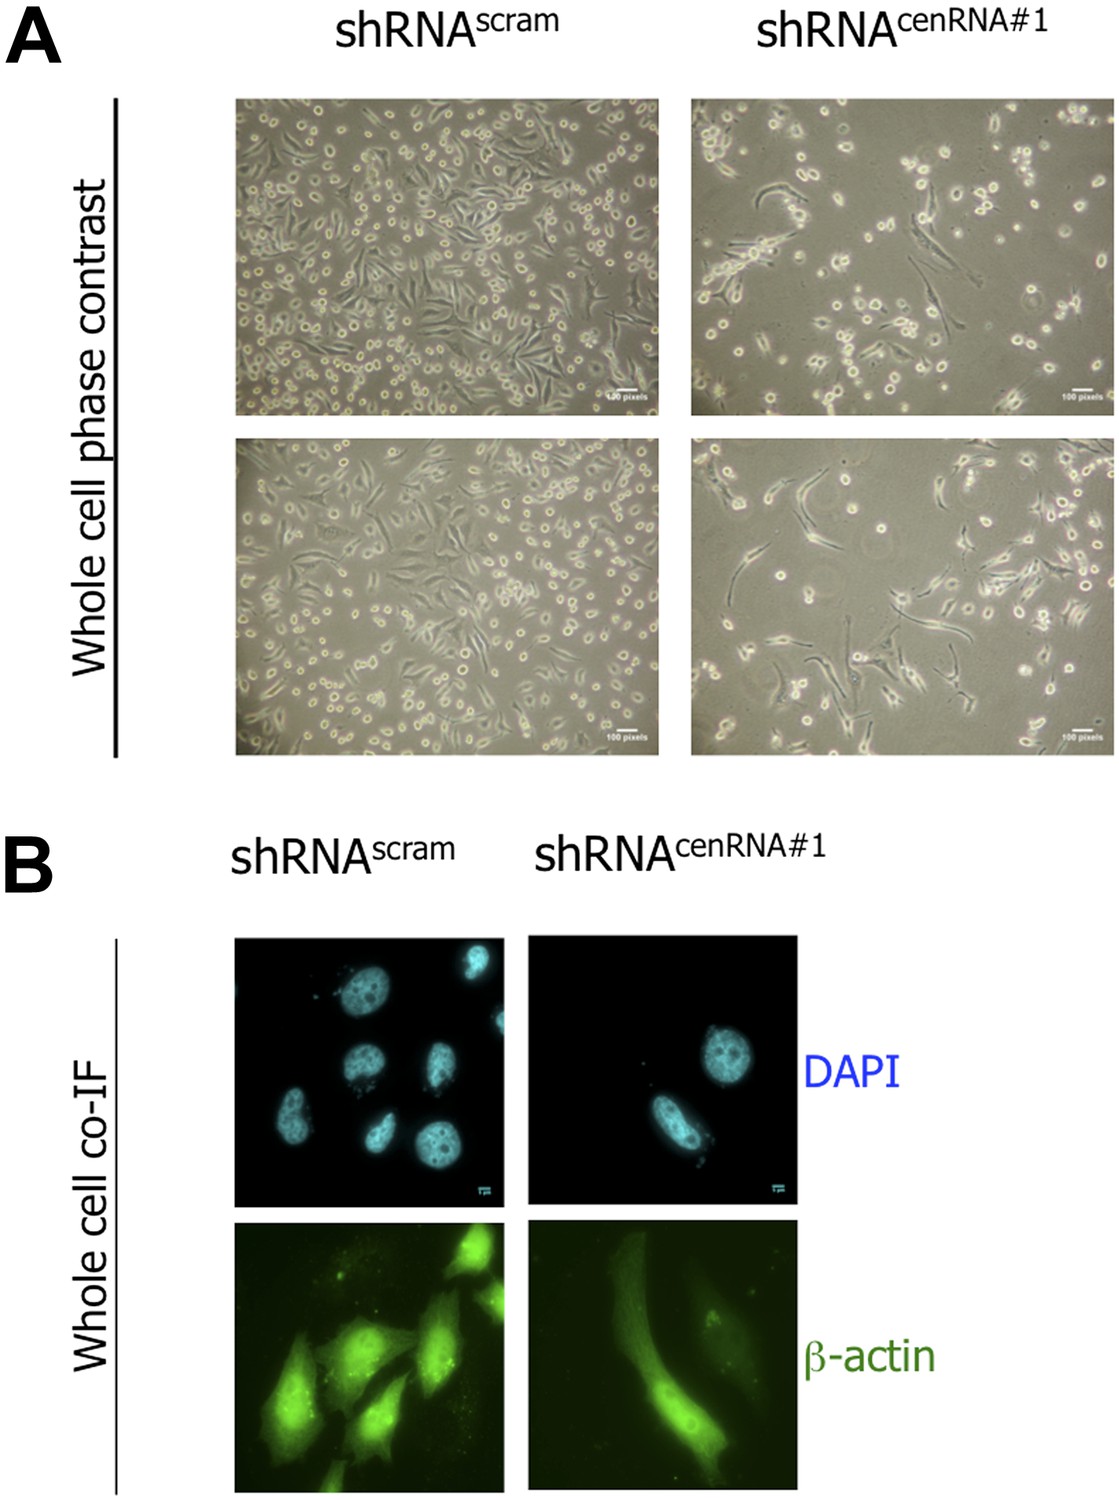
shRNAcenRNA#1-transfected cells have a cell survival defect.
(A) 6 days post-transfection of shRNAscram or shRNAcenRNA#1, cell morphology was observed by phase contrast microscopy. Scale bar: 100 pixels. (B) Cells were treated as in (A) and stained for β-actin (green) and DAPI (cyan) to reveal alterations in cell morphology. Scale bar: 5 μm. cDNA, complementary DNA; IF, immunofluorescence ; NT, non-treated.
Figure 5—figure supplement 5
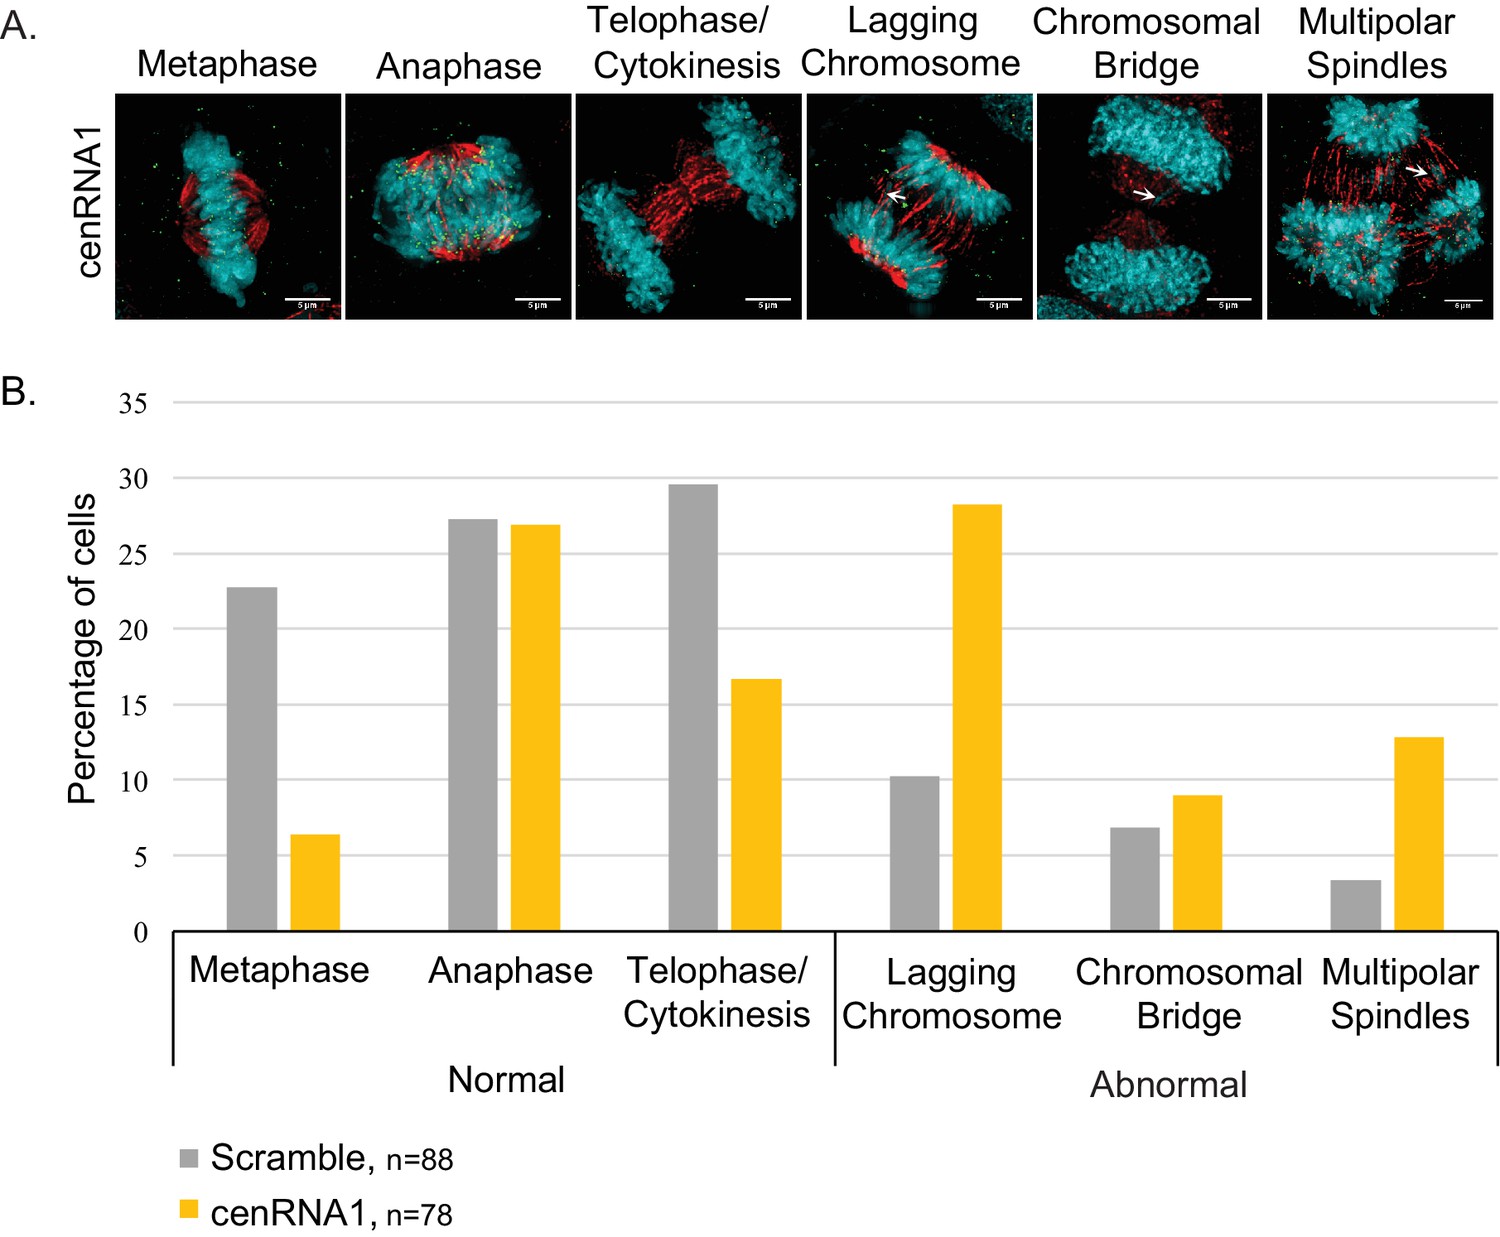
The down-regulation of cenRNA#1 leads to chromosome defects. shRNAcenRNA#1-transfected cells have a cell survival defect.
(A) Transfected HeLa cells with cenRNA#1 was synchronized at mitosis - early G1. Then, cells were stained for CENP-C (marker of centromeres) and α-tubulin (marker of mitotic spindle). Mitoses were categorized for their chromosome defects (lagging chromosomes, chromosomal bridges or multi-polar spindles-MPS). Scale bar: 5 µm. (B) Mitotic defects were counted and percentages were diagrammed.
Figure 6 with 2 supplements

Targeted down-regulation of centromeric α-satellite transcript results in mitotic defect.
(A) Six days post-transfection of empty vector, control scrambled (shRNAscram), or α-satellite shRNA (shRNAsat1, shRNAsat2), cell morphology was observed by phase contrast microscopy. Scale bar: 100 pixels. (B) Cells were treated as in (A) and stained for β-actin (green) and DAPI (cyan) to reveal alterations in cell morphology. Scale bar: 5 μm. (C) Cells were treated as in (A), synchronized in mitosis and stained for α-tubulin (green), CENP-B (red) and DAPI (cyan/blue). Three independent experiments were performed and in each, a minimum of 30 cells were analyzed per slide. Scale bar: 5 µm. IF: immunofluorescence.
Figure 6—figure supplement 1
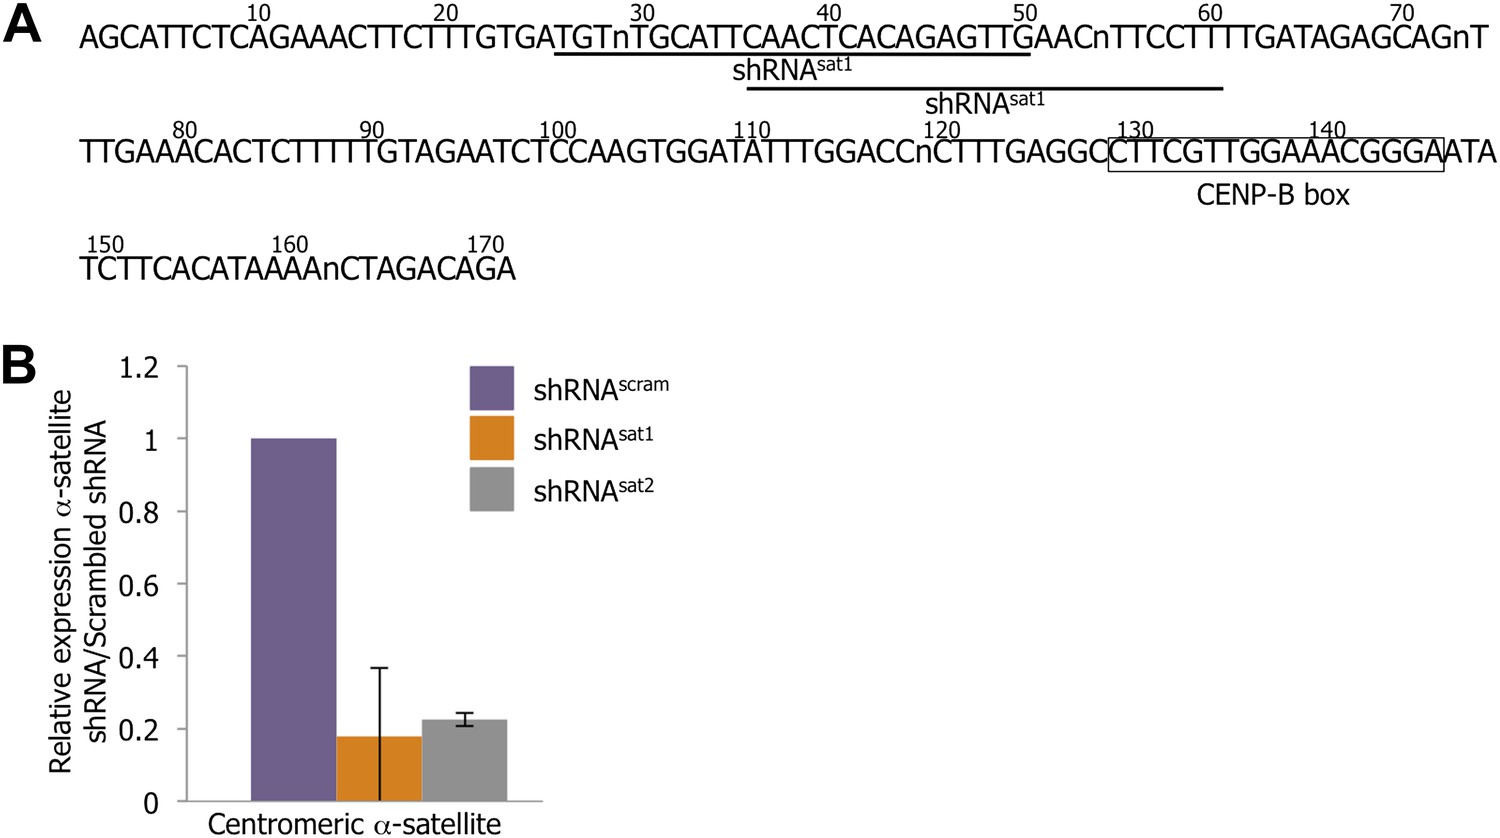
Down-regulation of centromeric RNAs by a targeted shRNA approach.
(A) The centromeric α-satellite consensus sequence was used to design α-satellite shRNA (shRNAsat1 and shRNAsat2) compared to control shRNA containing a scrambled sequence (shRNAscram). Residues of the CENP-B box are marked by a black box, and the sequences of shRNAsat1/2 are underlined. (B) Centromeric α-satellite transcript level after transfection of shRNAscram, shRNAsat1, or shRNAsat2 was measured by qtPCR. The graph represents the average of three biological replicates, with relative expression (±SD) of α-satellite transcript in shRNAsat-transfected cells compared to shRNAscram-transfected cells.
Figure 6—figure supplement 2
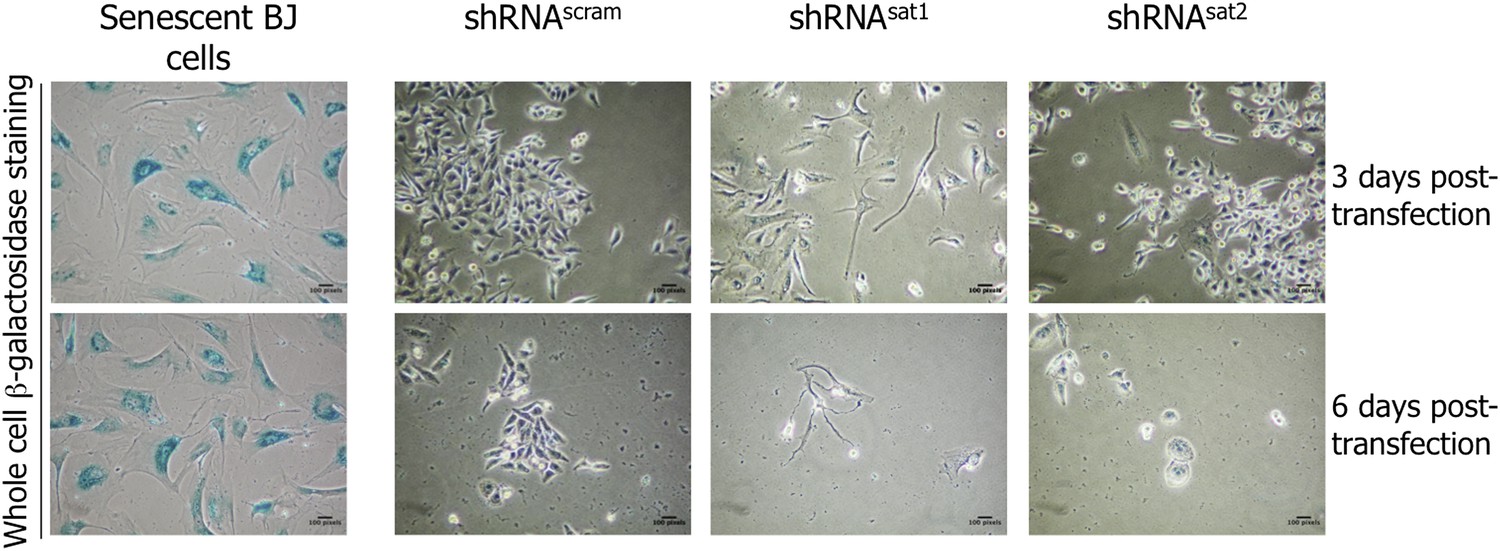
Down-regulation of centromeric transcripts does not induce senescence.
Six days post-transfection of empty vector, control scrambled (shRNAscram) or α-satellite shRNA (shRNAsat1 or shRNAsat2), the potential senescent status of transfected cells was tested by a β-galactosidase assay. Senescent BJ cells were used as positive control (blue).
Figure 7 with 1 supplement
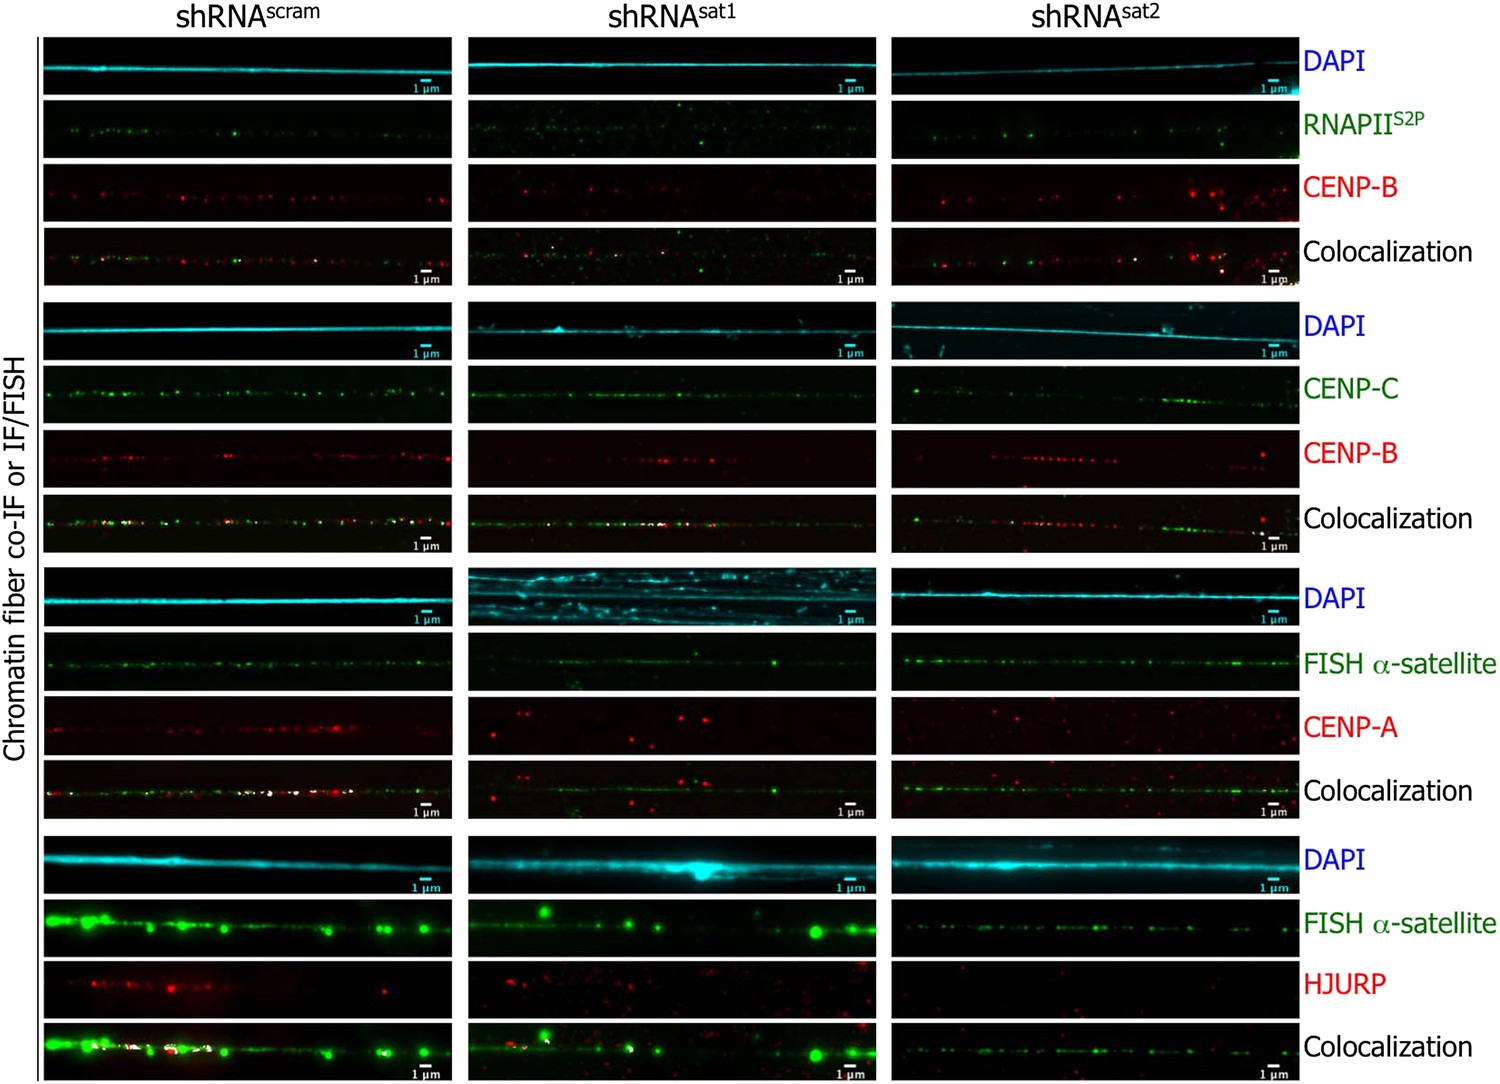
Targeted down-regulation of centromeric α-satellite abrogates HJURP/CENP-A targeting to centromeric chromatin at early G1 (eG1).
Chromatin fibers were prepared from shRNAscram, shRNAsat1, or shRNAsat2-transfected cells synchronized at eG1. To visualize centromeric domains, co-IF was performed for CENP-B (red), CENP-C (green) and RNA Polymerase II (phosphorylated on serine 2, RNAPIIS2P, green), whereas CENP-A (red) and HJURP (red) antibodies were co-stained with a DNA FISH probe against centromeric α-satellite DNA repeats (green). The DAPI raw image is shown for a representative chromatin fiber (cyan). Three independent experiments were performed and in each, five chromatin fibers were analyzed per slide (co-localization on the same chromatin fiber in shRNAsat1 or shRNAsat2-transfected cells: between CENP-B and RNAPIIS2P = 9/15 and 8/15; CENP-B and CENP-C = 14/15 and 13/15; between CENP-A and centromeric α-satellite DNA = 3/15 and 1/15; between HJURP and centromeric α-satellite DNA = 1/15 and 0/15, respectively). Scale bar: 1 µm. FISH, fluorescence in situ hybridization; IF, immunofluorescence.
Figure 7—figure supplement 1
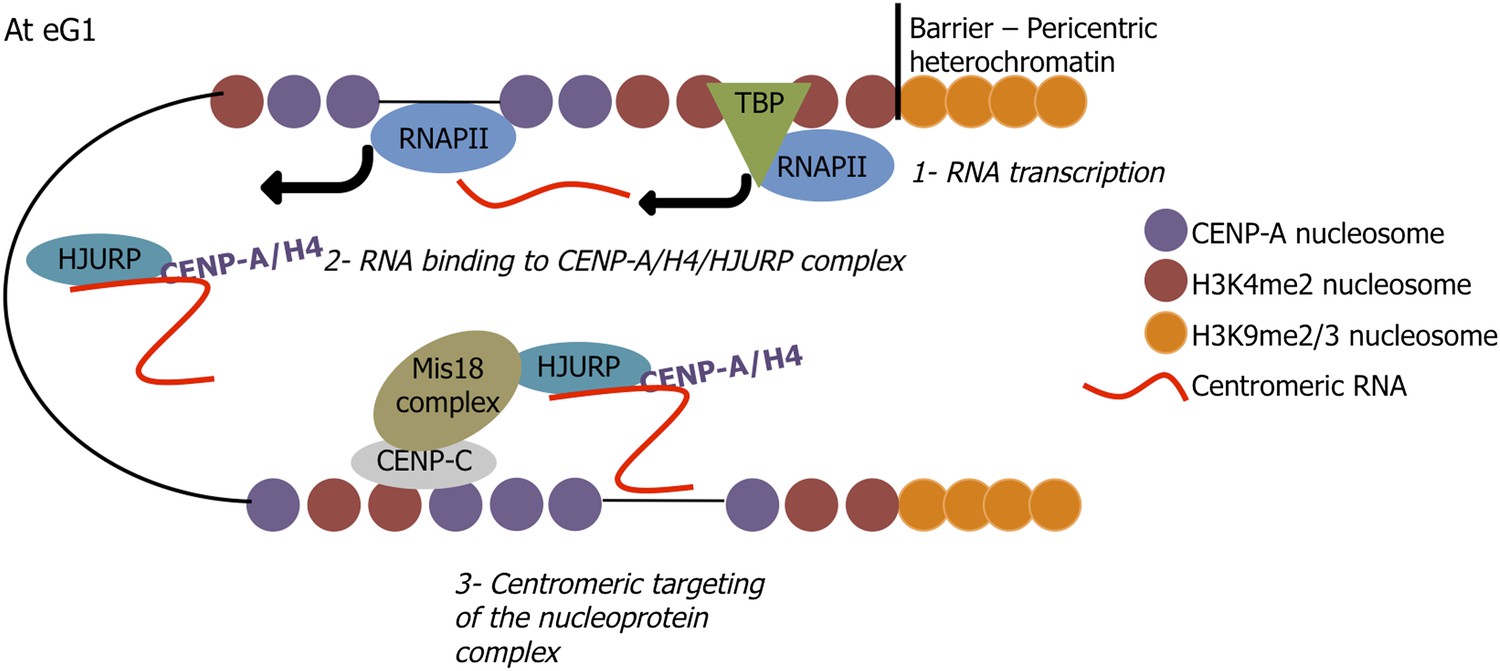
.A speculative model proposing a mechanism by which centromeric long non-coding RNAs target soluble HJURP/CENP-A complexes to centromeres at early G1 (eG1).
https://doi.org/10.7554/eLife.03254.021Additional files
-
Supplementary file 1
RNA Polymerase II inhibition results in CENP-A loss at centromere at early G1.
eG1 synchronized cells were treated 2 hr with or without α-amanitin and stained for centromeric protein CENP-A or CENP-B. After image acquisition, immunofluorescent signals were quantified using ImageJ.
- https://doi.org/10.7554/eLife.03254.022
-
Supplementary file 2
Alignment of cenRNA#1 28bp repeat to CENP-B box
- https://doi.org/10.7554/eLife.03254.028
-
Supplementary file 3
Best alignment hits for cenRNA#1 regions without contiguous full-length adapter sequences.
- https://doi.org/10.7554/eLife.03254.029
-
Supplementary file 4
List of databases and sequences questioned to identify cenRNA#1 origin.
- https://doi.org/10.7554/eLife.03254.030
-
Supplementary file 5
Best alignment hits for cenRNA#1 regions without contiguous full-length adapter sequences.
- https://doi.org/10.7554/eLife.03254.031
-
Supplementary file 6
Changes to cenRNA#1 shRNA sequence.
- https://doi.org/10.7554/eLife.03254.032
-
Supplementary file 7
Alignment of cenRNA#1 shRNA sequence.
- https://doi.org/10.7554/eLife.03254.033
-
Supplementary file 8
List of antibodies used in this study.
- https://doi.org/10.7554/eLife.03254.023
-
Supplementary file 9
List of LNA ASO sequences and LNA probes..
- https://doi.org/10.7554/eLife.03254.034
-
Supplementary file 10
List of primer sequences used in this study.
- https://doi.org/10.7554/eLife.03254.024
Download links
A two-part list of links to download the article, or parts of the article, in various formats.
Downloads (link to download the article as PDF)
Open citations (links to open the citations from this article in various online reference manager services)
Cite this article (links to download the citations from this article in formats compatible with various reference manager tools)
A long non-coding RNA is required for targeting centromeric protein A to the human centromere
eLife 3:e26016.
https://doi.org/10.7554/eLife.03254


