The topography of frequency and time representation in primate auditory cortices
- Newcastle University, United Kingdom
- University of Oxford, United Kingdom
Figures
Figure 1
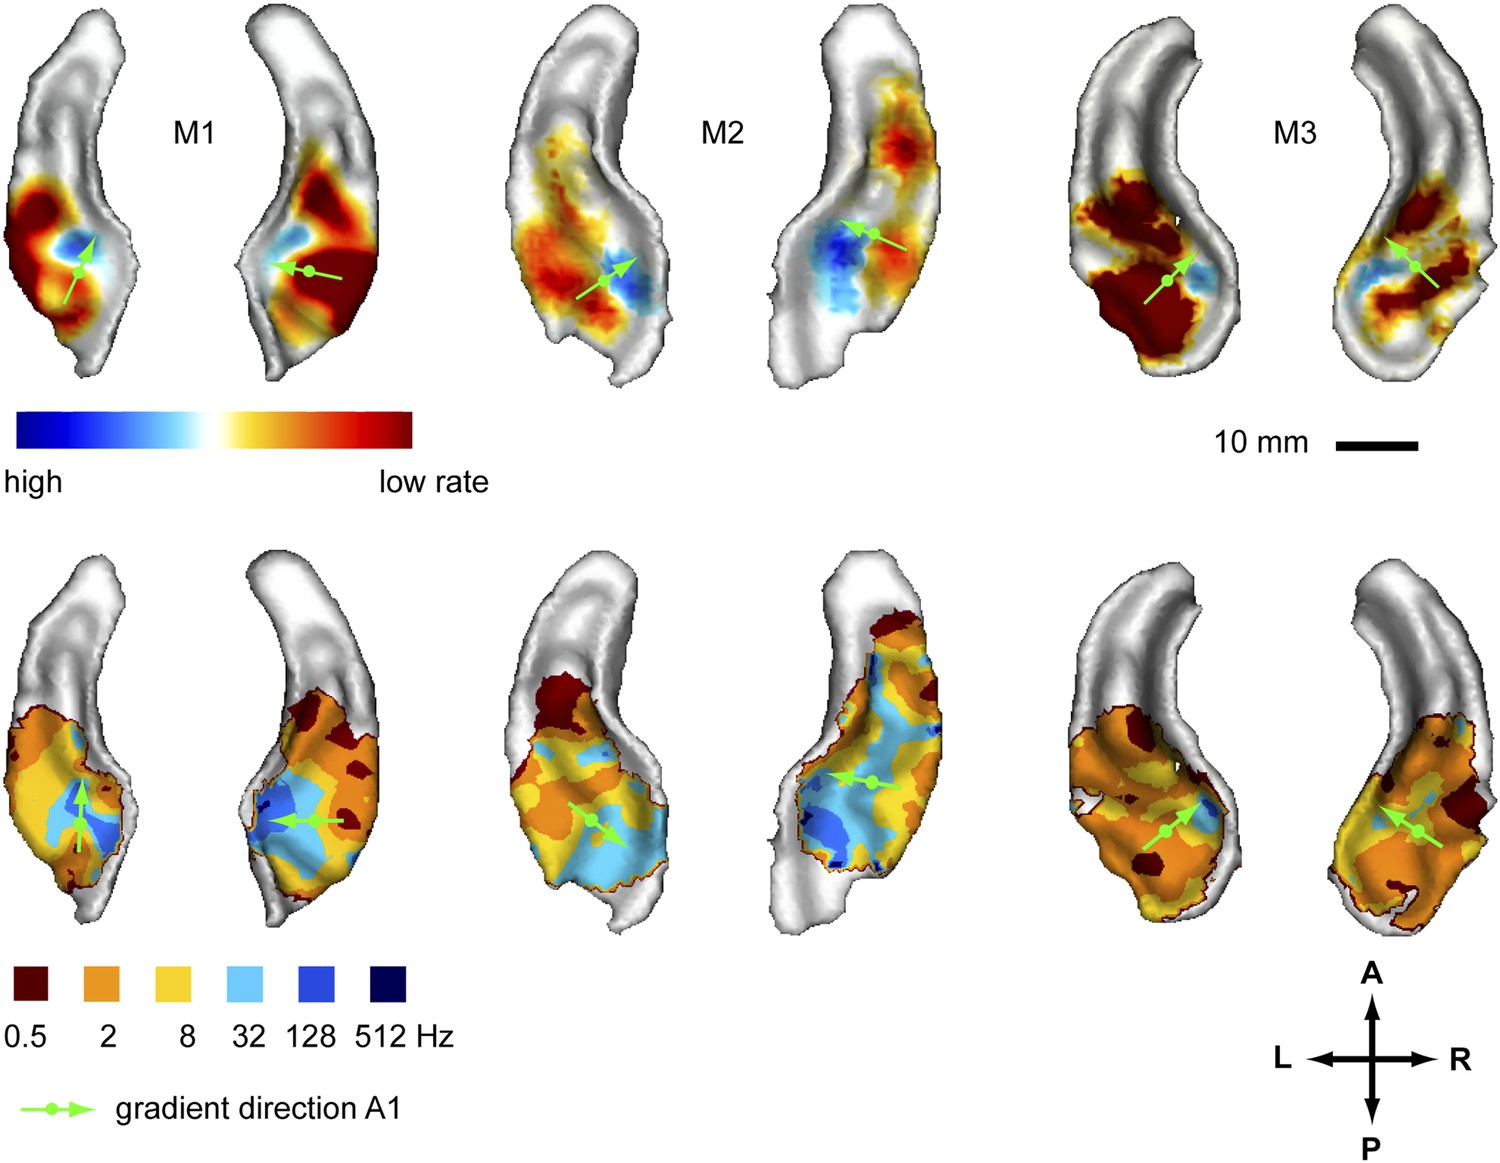
Representation of amplitude modulation rates in the auditory cortex.
Top panels: map showing contrast of low vs high rates (rate contrast map) projected on rendered surfaces of the superior temporal planes in three animals (M1-3). Green arrows indicate mean gradient direction of the contrast in auditory field A1 (gradient directions derived from 2D regression; see also Table 1). Green circles indicate the position of the centre of mass of A1. Bottom panels: map of preferred response to different rates (Best-rate map). A; anterior, P; posterior, L; left, R; right.
Figure 2
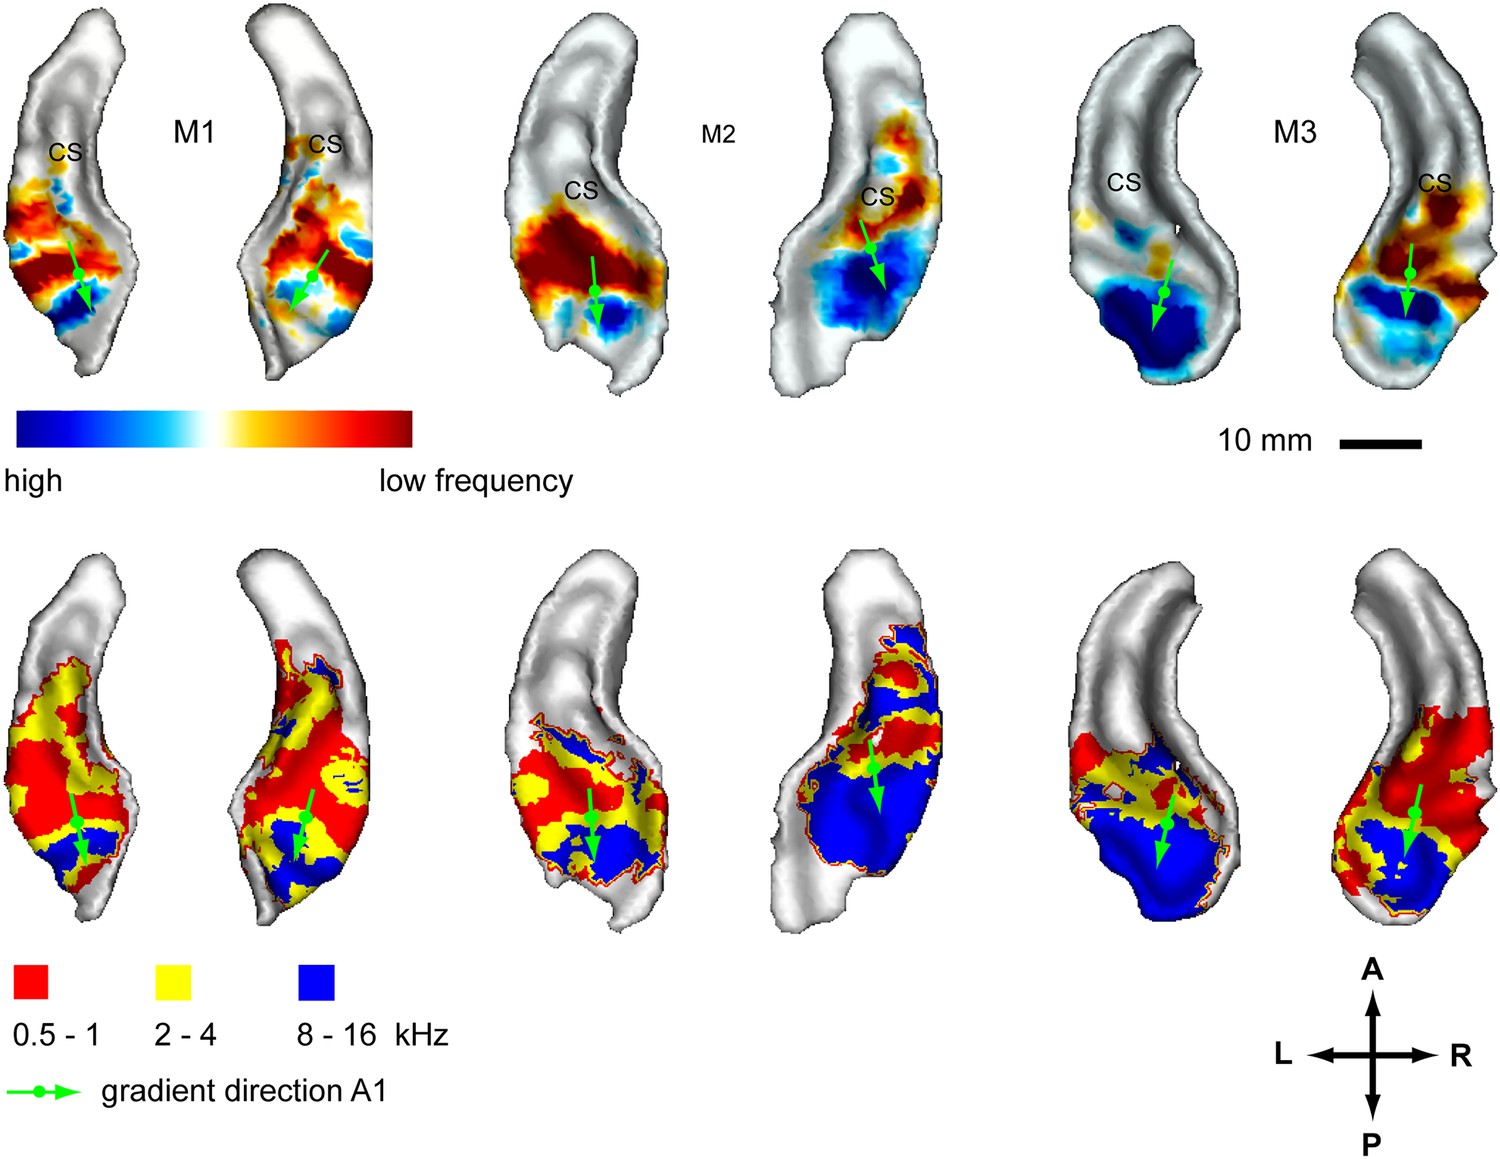
Representation of spectral frequency in the auditory cortex.
Top panels: map of contrast of low vs high frequency band (frequency-contrast map) projected on rendered surfaces of the superior temporal planes in three animals (M1-3). Green arrows indicate mean gradient direction of the contrast in auditory field A1. Green circles indicate the position of the centre of mass of A1. Bottom panels: map of preferred response to different frequency bands (Best-frequency map). A; anterior, P; posterior, L; left, R; right.
Figure 3
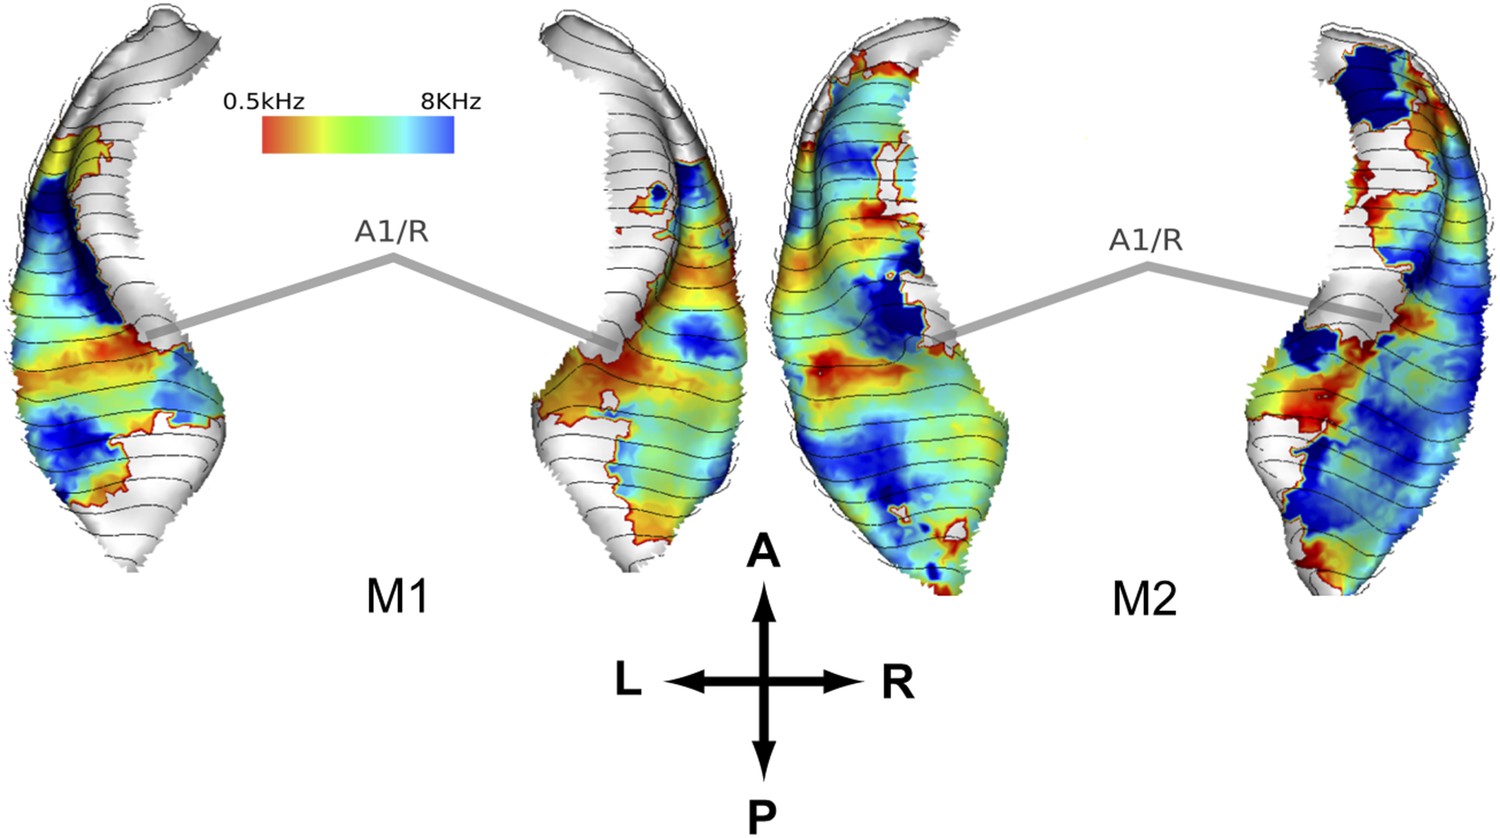
Representation of spectral frequency in the auditory cortex derived from ‘phase-encoded’ experiment.
Top panels: map of preferred response to nine different frequencies between 0.5–8 KHz projected on rendered surfaces of the superior temporal planes in two animals (M1, M2). Approximate border between A1 and R is marked by grey bars. A; anterior, P; posterior, L; left, R; right.
Figure 4
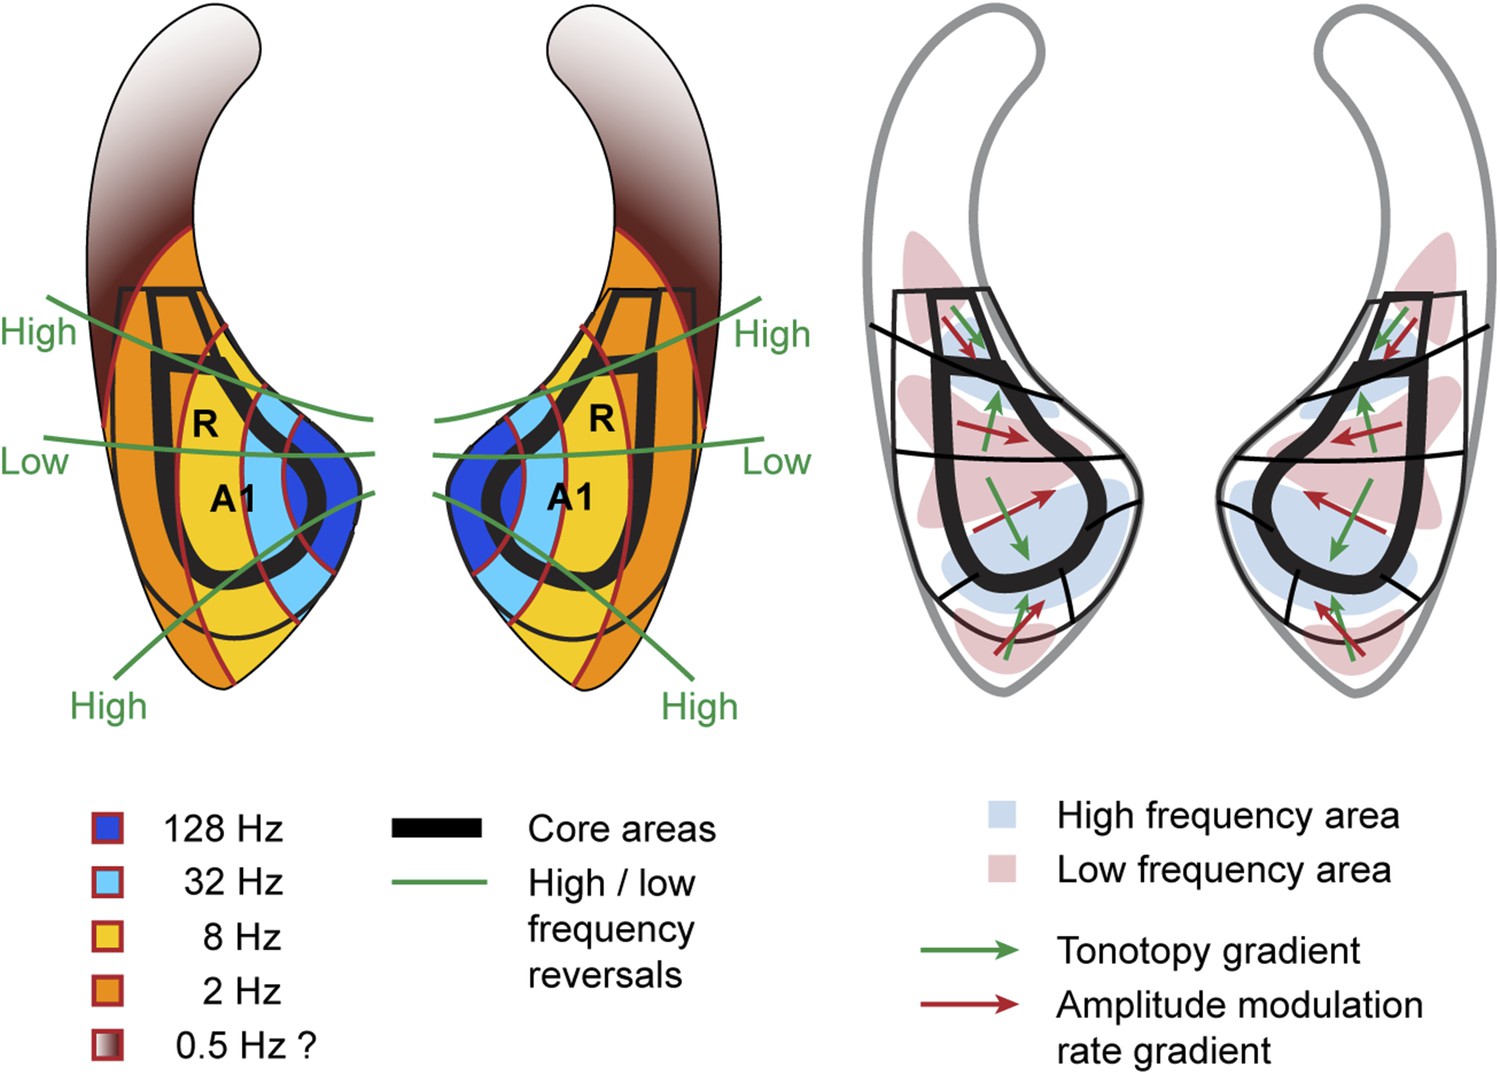
Schematic representation of amplitude-modulation-rate organisation in macaque auditory cortex.
Model of modulation rate organisation in context of functional-field borders and frequency reversals (left side). Schematic organisation of tonotopy with indication of main gradients for tonotopy and modulation rate in selected functional fields (right side).
Tables
Table 1
Directions and relative orientations of amplitude modulation rate and frequency gradients in selected auditory fields
| Animal | Hemis-phere | Field | Rel. angle (α) (degrees) | Frequency (degrees) | R2 | p-value | Rate (degrees) | R2 | p-value | N (vertices) |
|---|---|---|---|---|---|---|---|---|---|---|
| M1 | L | A1 | 137 | 162 | 0.796 | <1E-16 | 25 | 0.636 | <1E-16 | 84 |
| R | 73 | 155 | 0.546 | <1E-16 | 82 | 0.696 | <1E-16 | 101 | ||
| M2 | L | 120 | 175 | 0.927 | <1E-16 | 56 | 0.884 | <1E-16 | 154 | |
| R | 133 | 160 | 0.803 | <1E-16 | 66 | 0.750 | <1E-16 | 103 | ||
| M3 | L | 121 | 164 | 0.824 | <1E-16 | 43 | 0.699 | <1E-16 | 156 | |
| R | 128 | 175 | 0.722 | <1E-16 | 47 | 0.675 | <1E-16 | 87 | ||
| Average | 118.7 | 165.2 | 0.77 | 53.2 | 0.72 | 114.2 | ||||
| Std dev | 23.3 | 8.2 | 0.13 | 19.7 | 0.09 | 32.5 | ||||
| M1 | L | R | 81 | 38 | 0.106 | 1.40E-02 | 120 | 0.782 | <1E-16 | 88 |
| R | 140 | 23 | 0.391 | 2.89E-11 | 117 | 0.600 | <1E-16 | 107 | ||
| M2 | L | 51 | 29 | 0.697 | <1E-16 | 80 | 0.420 | 2.00E-09 | 102 | |
| R | 103 | 44 | 0.441 | 2.50E-10 | 147 | 0.660 | <1E-16 | 93 | ||
| M3 | L | 180 | 81 | 0.476 | 1.40E-10 | 100 | 0.255 | 4.20E-06 | 87 | |
| R | 148 | 9 | 0.611 | 4.20E-15 | 157 | 0.691 | <1E-16 | 73 | ||
| Average | 117.2 | 37.3 | 0.45 | 120.2 | 0.57 | 91.7 | ||||
| Std dev | 47.6 | 24.6 | 0.20 | 28.7 | 0.20 | 12.1 | ||||
| M1 | L | CL | 161 | 13 | 0.577 | 2.80E-04 | 148 | 0.587 | 1.70E-06 | 33 |
| R | 113 | 109 | 0.516 | 3.30E-07 | 138 | 0.264 | 1.90E-03 | 44 | ||
| M2 | L | 163 | 42 | 0.563 | 3.30E-07 | 155 | 0.582 | 2.00E-12 | 40 | |
| R | 102 | 14 | 0.552 | 5.70E-10 | 116 | 0.559 | <1E-16 | 58 | ||
| M3 | L | 168 | 27 | 0.795 | 3.30E-16 | 165 | 0.751 | 2.60E-14 | 48 | |
| R | 158 | 2 | 0.706 | 4.20E-11 | 156 | 0.768 | 4.20E-13 | 42 | ||
| Average | 144.2 | 34.5 | 0.62 | 146.3 | 0.59 | 44.2 | ||||
| Std dev | 28.8 | 39.0 | 0.11 | 17.4 | 0.18 | 8.4 |
-
Main gradient directions (relative to anterior-posterior axis) and the resulting relative angle (α) between the orientations of the amplitude modulation rate (Rate) and spectral frequency (Frequency) gradients in auditory fields A1, R and CL are listed for two hemispheres (L, R) in three animals (M1-3). Additionally, R2 values, p-values and number of data points (n) from the respective 2D regression analysis are included.
Additional files
-
Supplementary file 1
Directions and relative orientations of amplitude modulation rate and frequency gradients in selected auditory field (based on best rate/frequency maps). Main gradient directions (relative to anterior-posterior axis) and the resulting relative angle (α) between the orientations of the amplitude modulation rate (Rate) and spectral frequency (Frequency) gradients in auditory fields A1, R and CL are listed for two hemispheres (L, R) in three animals (M1-3). Additionally, R2 values, p-values and number of data points (n) from the respective 2D regression analysis are included. * No defined gradient direction due to single best frequency in field.
- https://doi.org/10.7554/eLife.03256.008
-
Source code 1
Custom matlab code.
This file includes a collection of custom matlab scripts that were used for analysis and data representation of the manuscript. It is highly recommended to contact the corresponding author for detailed instructions in the use of these scripts and attempts to recreate analysis procedures described in the manuscript.
- https://doi.org/10.7554/eLife.03256.011
Download links
A two-part list of links to download the article, or parts of the article, in various formats.
Downloads (link to download the article as PDF)
Open citations (links to open the citations from this article in various online reference manager services)
Cite this article (links to download the citations from this article in formats compatible with various reference manager tools)
The topography of frequency and time representation in primate auditory cortices
eLife 4:e03256.
https://doi.org/10.7554/eLife.03256


