Epigenetic modification of the PD-1 (Pdcd1) promoter in effector CD4+ T cells tolerized by peptide immunotherapy
- University of Edinburgh, United Kingdom
- University of Bristol, United Kingdom
Figures
Figure 1 with 1 supplement
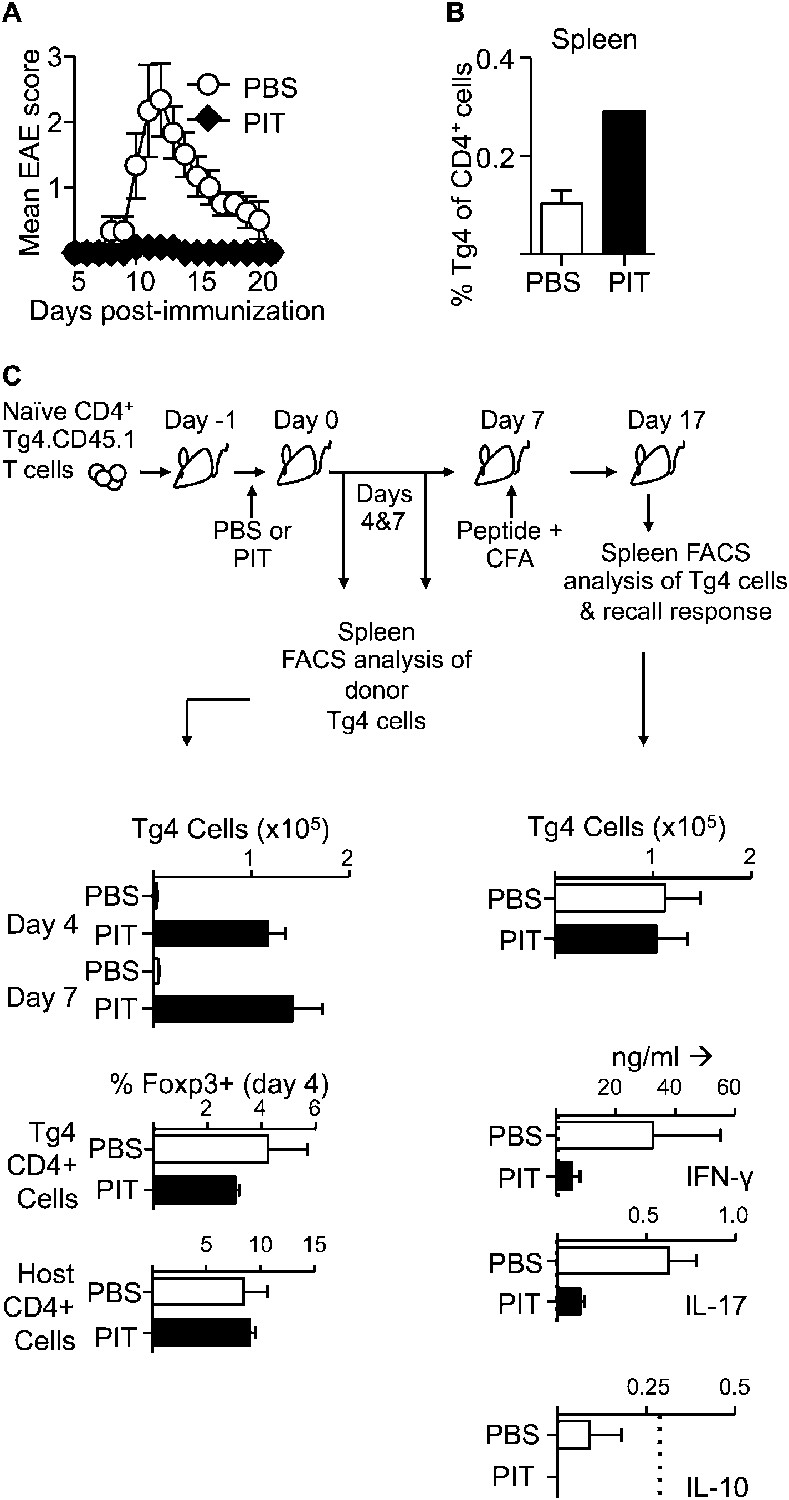
PIT induces unresponsiveness in naïve Tg4 cells.
(A, B) B10.PLxC57BL/6 mice received PBS or PIT i.v. 1 day after transfer of naïve CD4+ Tg4 cells. EAE was induced 7 days later by immunization with Ac1-9. (A) Mean clinical scores ± SEM. (B) Frequency of CD4+ Tg4 cells in the spleen at day 19 post-EAE induction (six mice per group, from one of three experiments giving consistent results). (C) Spleens were sampled four and 7 days after PIT/PBS for analysis of CD4+ Tg4 numbers and Foxp3 expression in host and donor CD4+ T cells (3–4 mice per group, from one of three experiments giving consistent results). A separate cohort were immunized on day 7 after PIT/PBS and spleens analyzed 10 days later for CD4+ Tg4 cell numbers and the production of IFN-γ, IL-17 and IL-10 by splenocytes in response to stimulation with 100 μM Ac1-9 (dotted lines represent cytokine levels for unstimulated controls) (four mice per group, from one of three experiments giving consistent results).
Figure 1—figure supplement 1
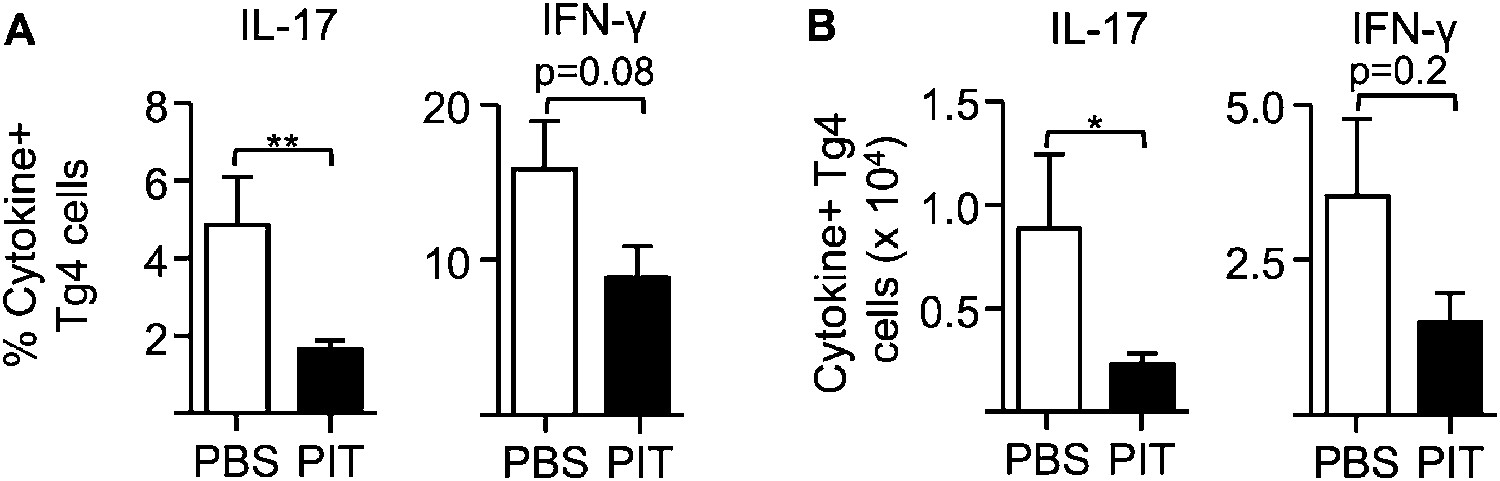
PIT reduces the frequency and number of pro-inflammatory cytokine producing Tg4 cells.
B10.PLxC57BL/6 mice received PBS/PIT 1 day after transfer of naïve CD4+Tg4 cells. 7 days later mice were immunized and spleens were taken for analysis 10 days after immunization. (A) Percentage and (B) numbers of IL-17+ and IFN-γ+ Tg4 donor cells upon recall stimulation with 20 μM Ac1-9. Data are from one of three experiments giving consistent results (four mice per group).
Figure 2 with 1 supplement
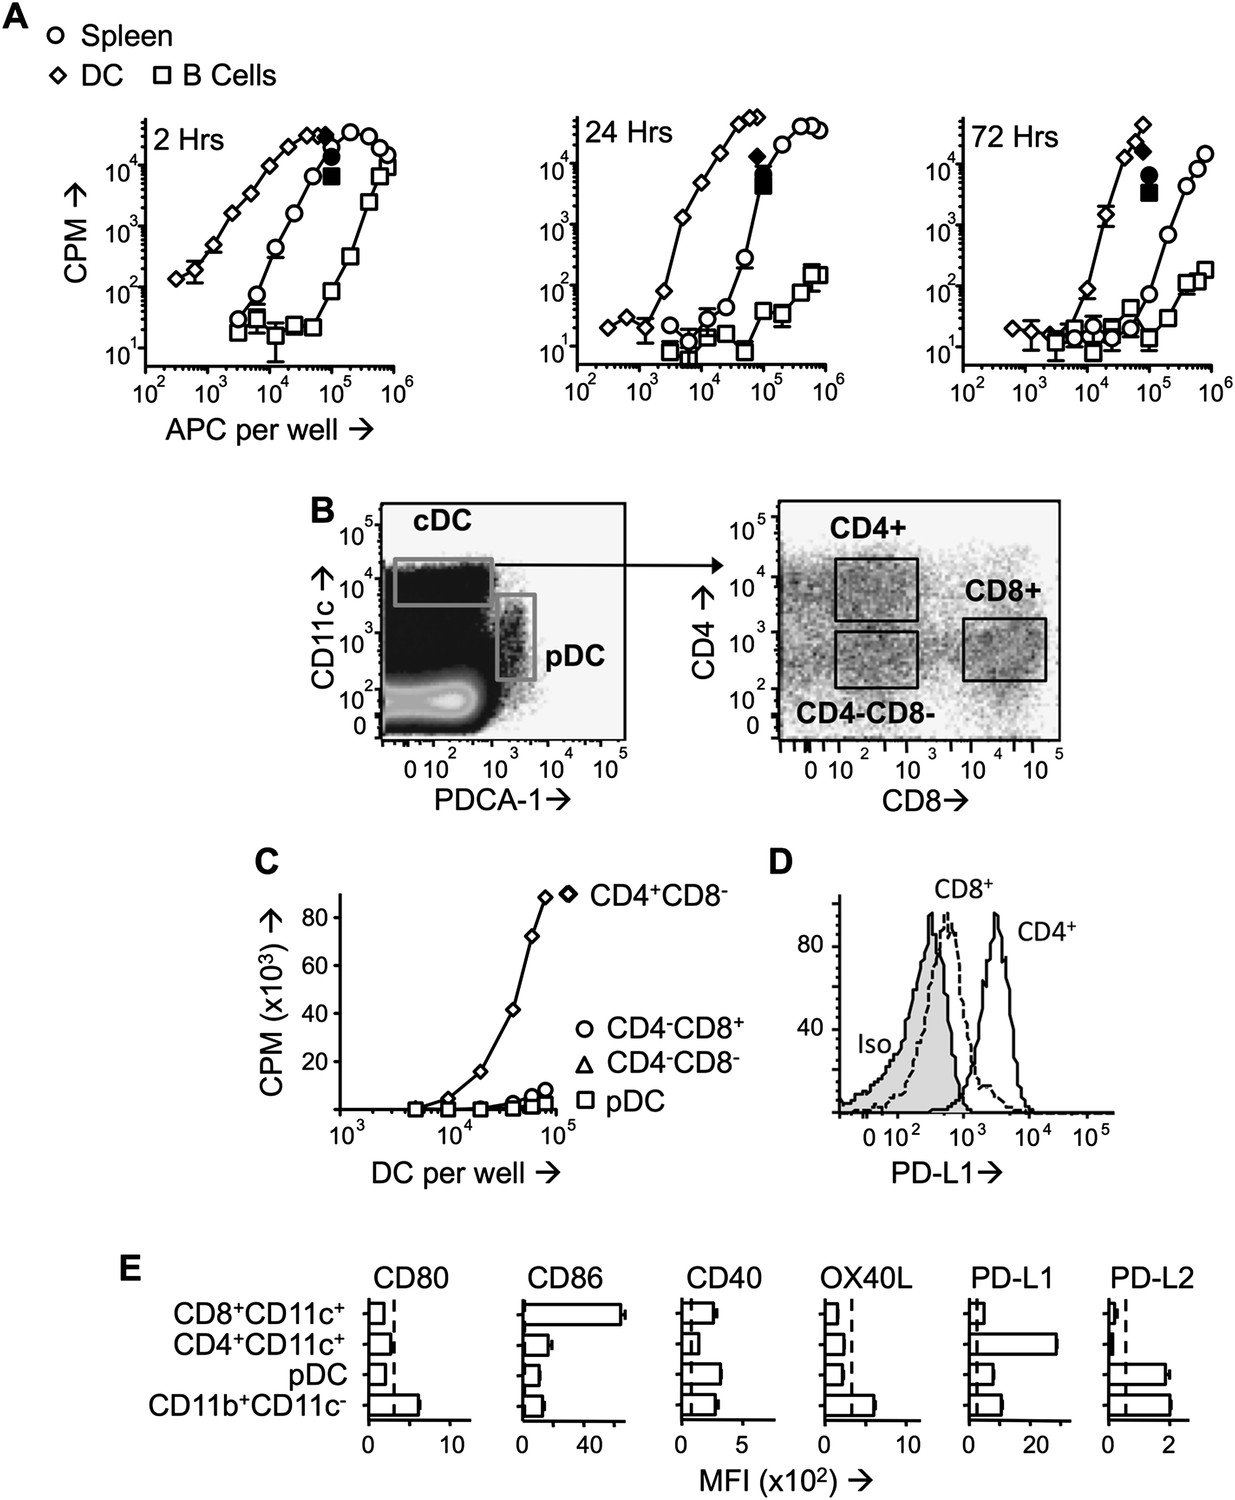
PD -L1hiCD4+ DC present tolerogenic pMHC complexes to T cells.
(A) B10.PL mice received PIT i.v. and splenocytes were isolated at the indicated times. B cells (CD11c−CD19+) and DC (CD11c+) were MACS-sorted and their ability to stimulate a Tg4.TCL was measured compared to whole splenocytes. Positive controls (solid symbols) show proliferative responses of Tg4.TCL to DC, B cells and splenocytes in the presence of 20 μM Ac1-9. Data are from one of three experiments giving consistent results. (B) Gating strategy for FACS-sorting of DC sub-sets from spleen isolated 1 day after PIT administration. (C) Proliferative responses of Tg4.TCL to increasing numbers of DC. Data are from one of three experiments giving consistent results. (D) Representative histograms of steady state expression of PD-L1, gated on CD11chiCD4+ and CD11chiCD8+ splenic DC. (E) MFI ± SEM of staining with mAb to co-stimulatory and co-inhibitory molecules on steady state splenic APC populations (four mice per group,, from one of two experiments giving consistent results, dotted lines represent MFI of isotype control staining).
Figure 2—figure supplement 1
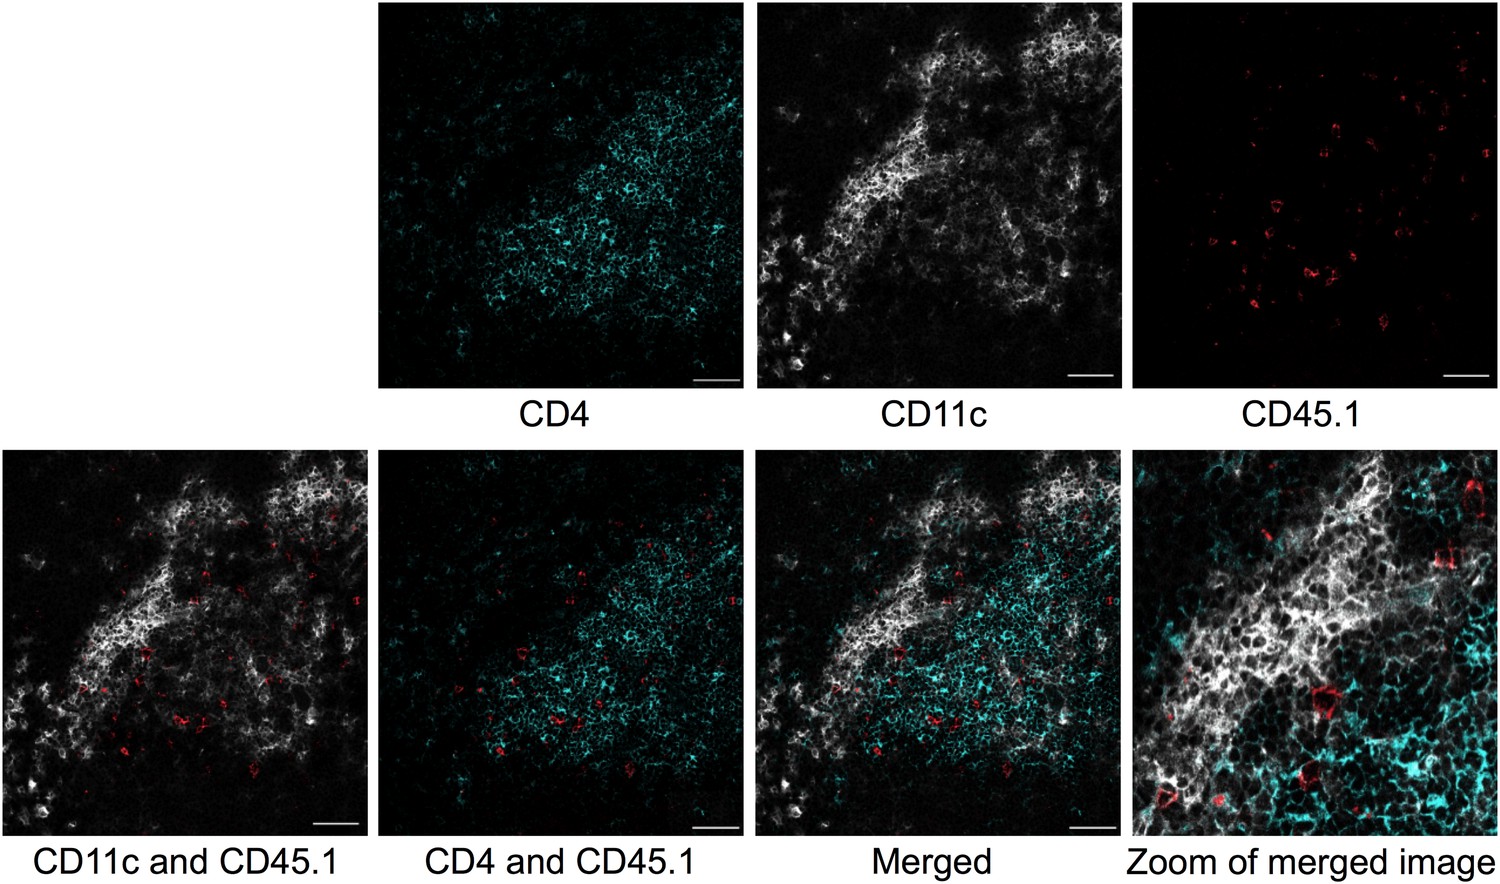
Colocalization of transferred naïve Tg4 cells with CD11c+ splenocytes.
Representative images of immunofluorescent localization of Tg4 cells. CD4+ Tg4 (CD45.1+) cells were transferred into CD45.2+ B10.PLxC57BL/6 hosts 1 day after PIT administration. Spleens were isolated and frozen 48 hr after cell transfer. Frozen sections were stained with CD4 (green), CD11c (white) and CD45.1 (red). Scale bars represent 50 μm.
Figure 3

PD-1 is required for the establishment and maintenance of tolerance in naïve CD4+ Tg4 cells.
(A–C) B10.PL mice received PBS/PIT 1 day after transfer of naïve CD4+ Tg4 cells. (A) Representative histograms of PD-1 expression gated on CD4+ Tg4 donor cells in spleen 4 days after PBS/PIT. (B) MFI of PD-1 staining gated on CD4+ Tg4 donor cells in spleen 4 and 7 days after PBS/PIT (4–6 mice per group, from one of three experiments giving consistent results, dotted line represents MFI of isotype control staining). (C) IFN-γ and IL-17 production in response to Ac1-9 by splenocytes isolated 7 days after PIT and cultured in the presence of anti-PD-1 or isotype (four mice per group, from one of three experiments giving consistent results, dotted lines represent cytokine levels for unstimulated cultures). (D) EAE in B10.PLxC57BL/6 mice that received PBS/PIT 1 day after transfer of naïve CD4+ cells from Tg4.PD-1+/+ or Tg4.PD-1−/− donors. EAE was induced 7 days after PBS/PIT by immunization with Ac1-9 (five mice per group, from one of three experiments giving consistent results).
Figure 4 with 2 supplements
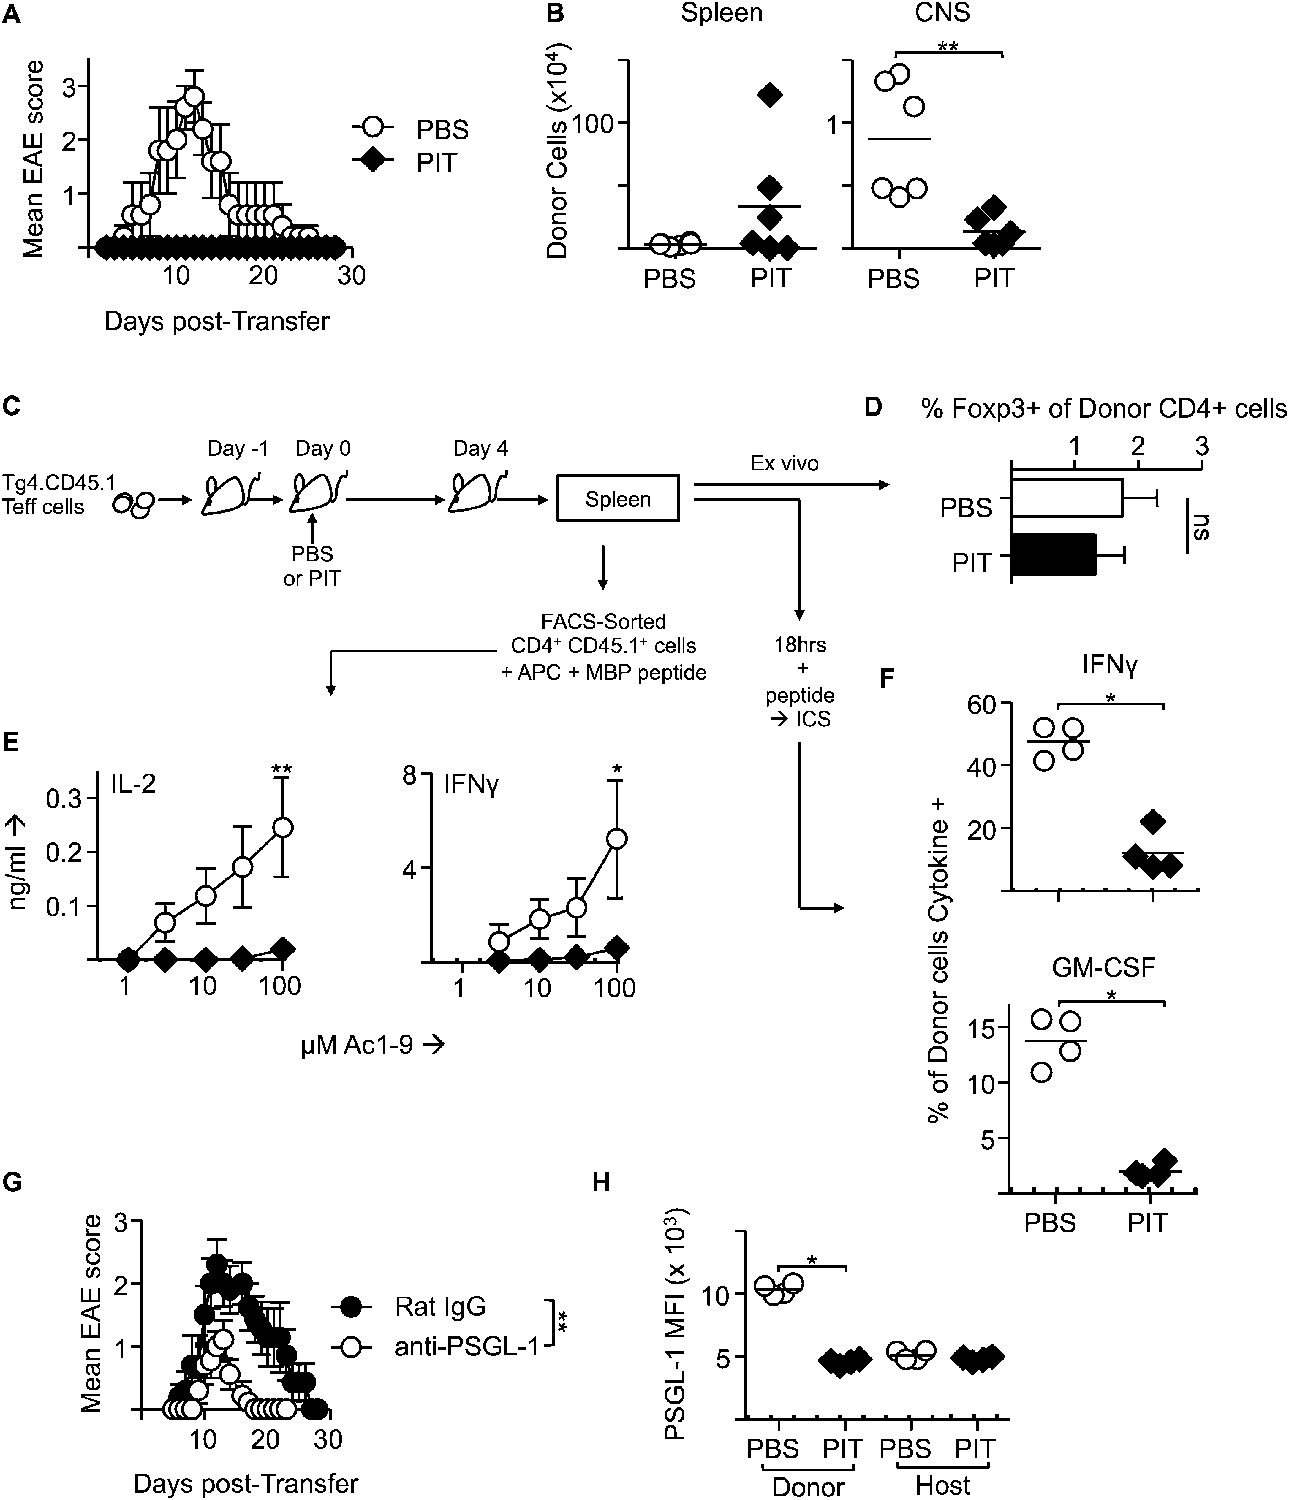
PIT induces tolerance in pathogenic Tg4 Teff cells.
(A) EAE in B10.PL mice that received PBS/PIT 1 day after transfer of Tg4 Teff cells (six mice per group, from one of five experiments giving consistent results). (B) Numbers of CD4+ Tg4 donor cells in spleen and CNS of PBS/PIT-treated mice sampled at the peak of EAE (six mice per group, from one of two experiments giving consistent results). (C) Tg4 Teff cells were transferred and spleens were sampled 4 days after PBS/PIT. (D) The frequencies of Foxp3+ cells amongst the donor Tg4 CD4+ Teff cells on day 4 after PBS or PIT. (E) Ac1-9-induced IL-2 and IFN-γ production by retrieved CD4+ Tg4 donor cells (FACS-sorted 4 days after PBS/PIT and cultured with irradiated B10.PLxC57BL/6 splenic APC) (four mice per group, from one of two experiments giving consistent results, dotted lines represent cytokine levels for unstimulated controls). (F) GM-CSF and IFN-γ production following overnight culture of splenocytes with Ac1-9 (gated on CD4+ Tg4 donor cells) (n = 4 per group, from one of four experiments giving consistent results, dotted lines represent cytokine levels for unstimulated controls). (G) Modulation of EAE by anti-PSGL-1 (50 μg given i.v. on alternate days from day 1 after Tg4 Teff cells). Teff cells were also incubated with 20 μg/ml of the relevant antibody for one hour prior to transfer. (n = 10 per group, from one of three experiments giving consistent results). (H) PSGL-1 expression by CD4+ host and Tg4 donor cells 4 days after PBS/PIT (four mice per group, from one of two experiments giving consistent results, dotted line represents MFI of isotype control staining).
Figure 4—figure supplement 1
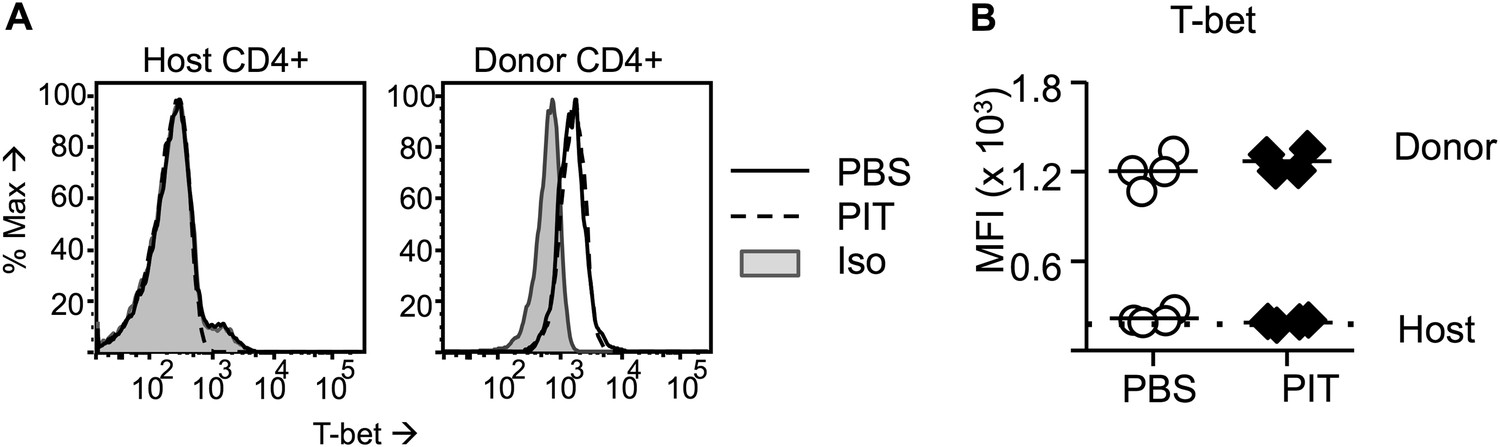
Pathogenic Tg4 Teff cells maintain T-bet after PIT.
(A, B) B10.PLxC57BL/6 mice received PBS/PIT 1 day after transfer of naïve CD4+ Tg4 cells. (A) Representative histograms of T-bet expression gated on CD4+ host or Tg4 donor cells in spleen 4 days after PBS/PIT. (B) MFI of T-bet staining gated on CD4+ host or Tg4 donors within the spleen 4 days after PBS/PIT (4 mice per group, from one of four experiments giving consistent results, dotted line represents MFI of isotype control staining).
Figure 4—figure supplement 2
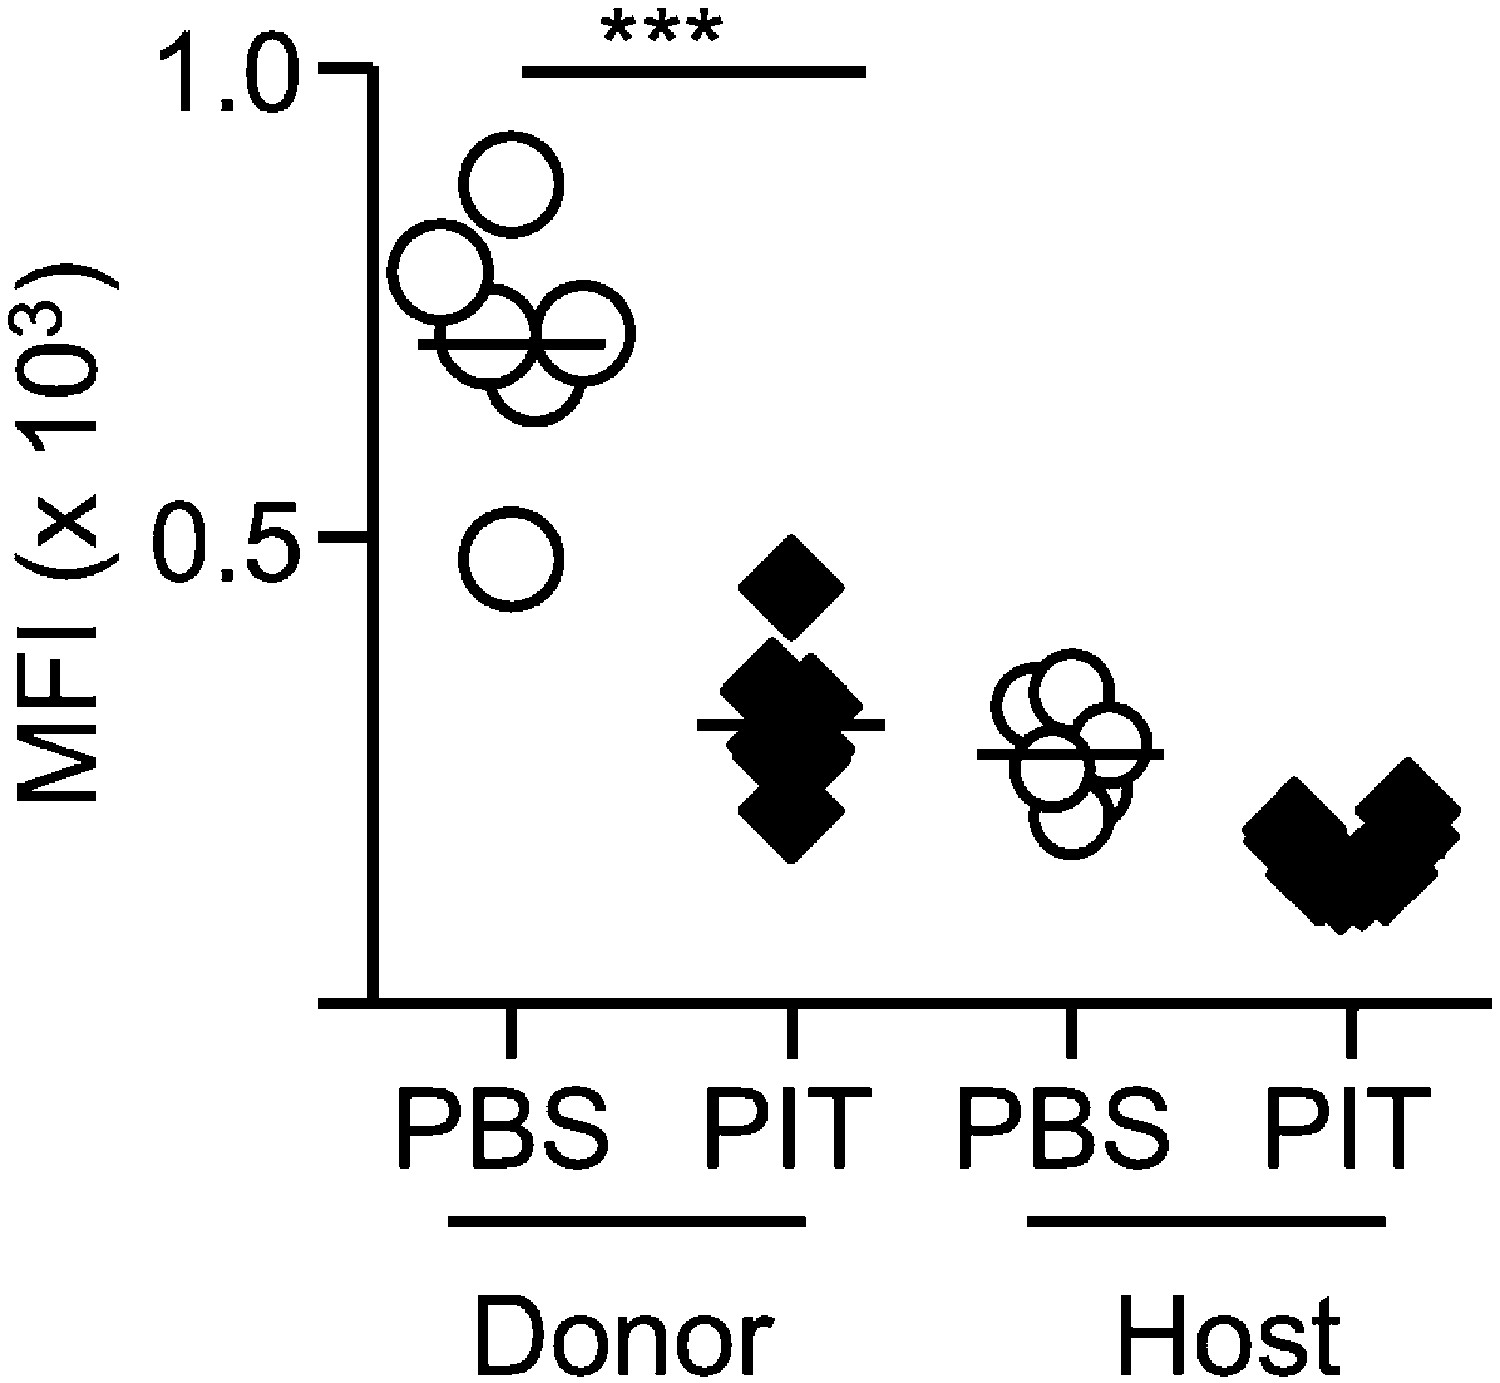
PIT reduces active PSGL-1 levels on Tg4 Teff cells.
B10.PLxC57BL/6 mice received PBS/PIT 1 day after transfer of Tg4 Teff cells. Splenocytes were isolated 4 days after PBS/PIT (n = 6–8 per group). Active PSGL-1 was detected using a P-selectin-hIgG fusion protein, followed by PE-anti-human IgG staining. Events were gated on CD4+ host or Tg4 donor cells. Dotted line represents staining with PE-anti-human IgG alone. Data are from one of two experiments giving consistent results.
Figure 5 with 8 supplements
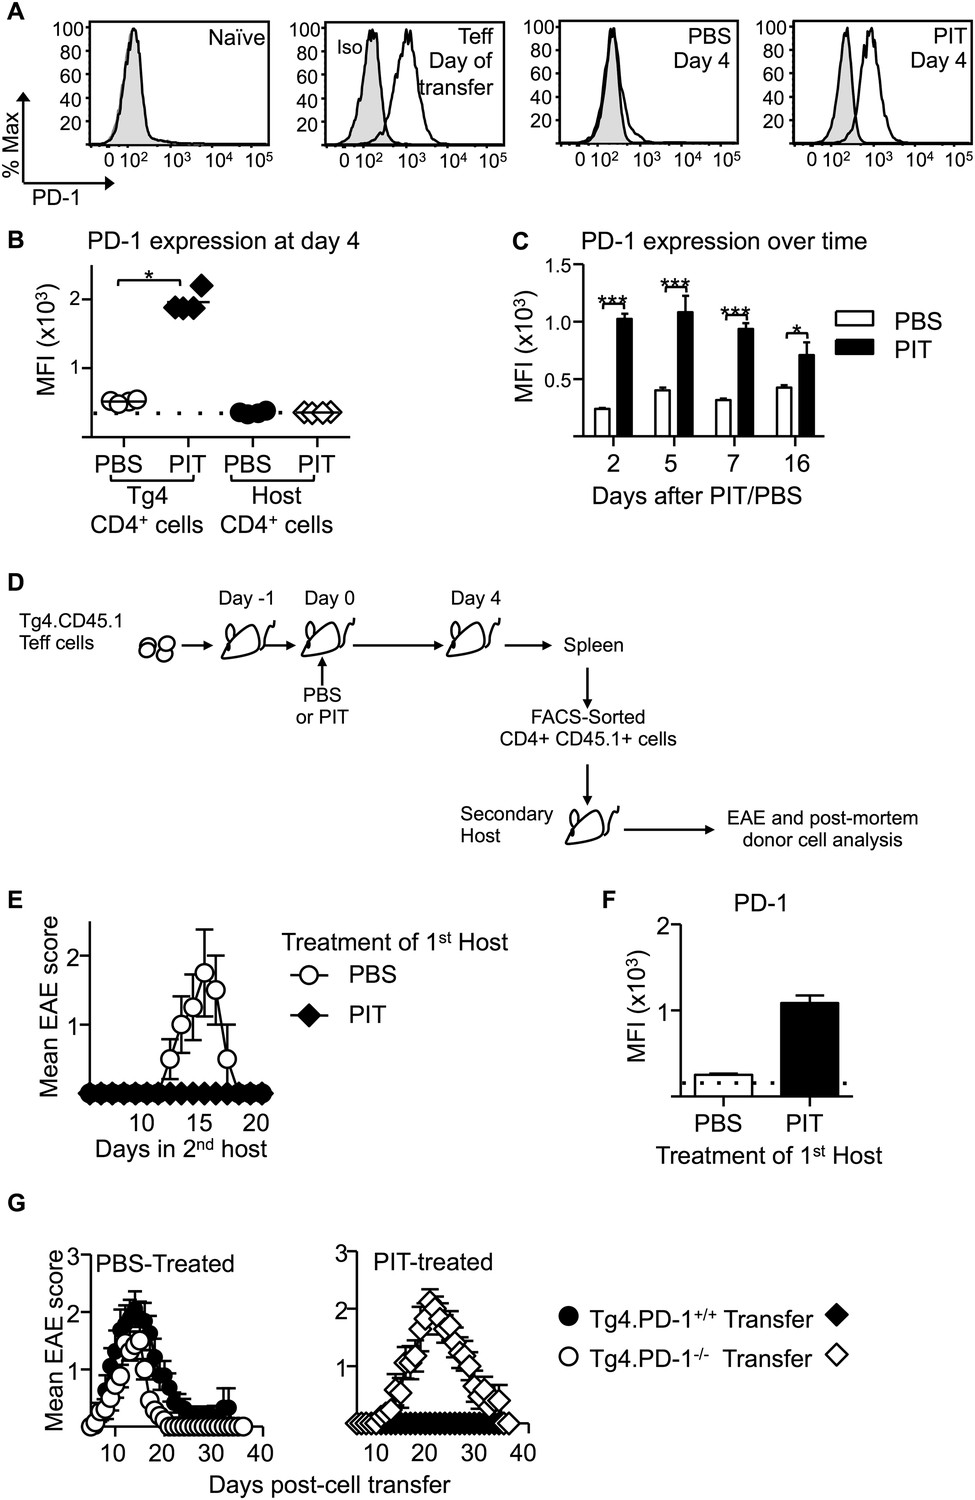
PD-1 expression is maintained by PIT and is required for tolerance.
(A) Representative histograms of PD-1 expression by CD4+ Tg4 cells sampled as naïve cells, Teff on day of transfer and Teff cells retrieved 4 days after PBS/PIT. (B) PD-1 expression (MFI) gated on CD4+ host cells and Tg4 donor cells from spleen 4 days after treatment (four mice per group, from one of four experiments giving consistent results, dotted line represents MFI of isotype control staining). (C) Time course of PD-1 expression on CD4+ Tg4 donor cells from PBS/PIT-treated mice (four mice per group). (D) B10.PLxC57BL/6 mice received PBS/PIT 1 day after transfer of Tg4 Teff cells. 4 days later CD4+ Tg4 donor cells were FACS-sorted and 2 × 10⁶ were transferred into secondary hosts that were not exposed to PIT (PTX was given on the same day). (E) EAE in secondary hosts (n = 4 for PBS; 21 for PIT, pooled from two experiments). (F) PD-1 expression gated on CD4+ Tg4 donor cells from spleens isolated 16 days after secondary transfer (dotted line represents MFI of isotype control staining). (G) EAE in B10.PLxC57BL/6 mice that received PBS/PIT 1 day after transfer of Teff generated from Tg4.PD-1+/+ or Tg4.PD-1−/− donors (n = 20–36 mice per group, pooled from three experiments).
Figure 5—figure supplement 1
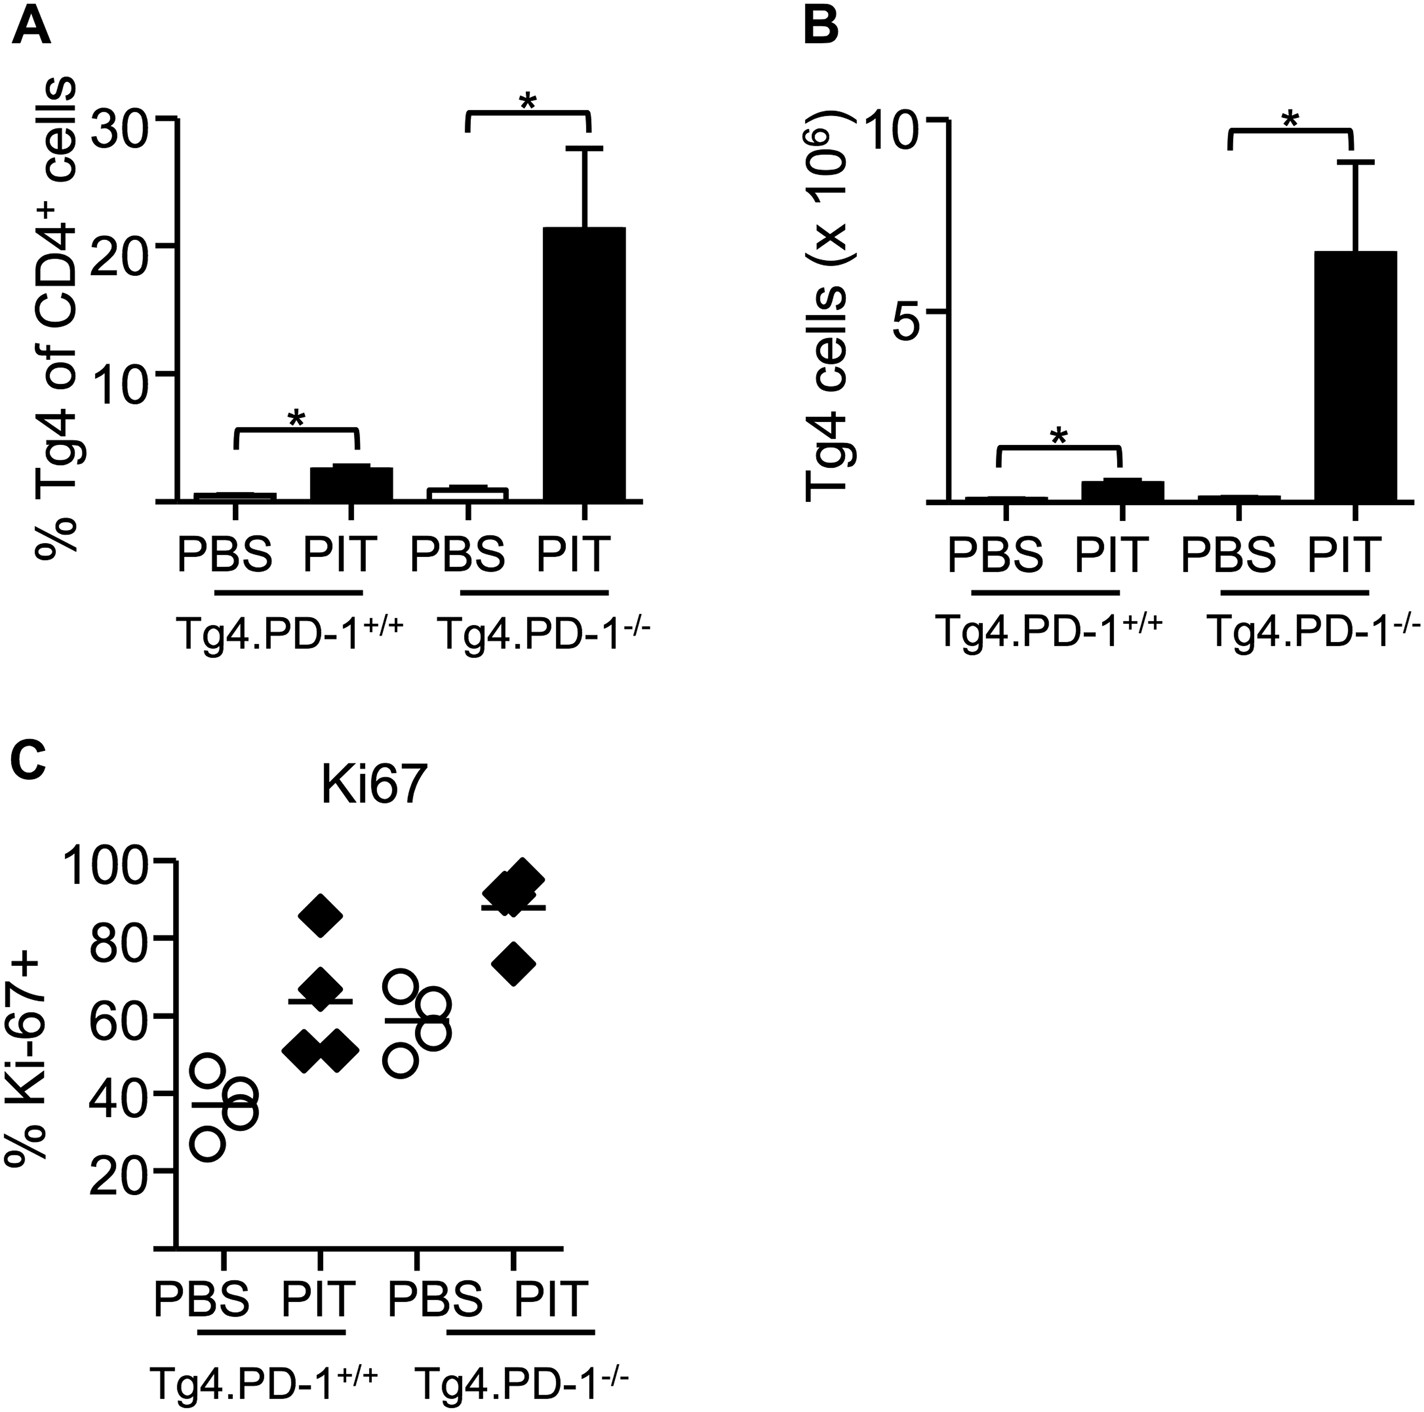
Elevated accumulation of Tg4.PD-1−/− Teff cells following PIT.
B10.PLxC57BL/6 mice received PBS or PIT 1 day after transfer of Tg4.PD-1+/+ or Tg4.PD-1−/− Teff cells. (A) Percentage and (B) numbers of CD4+ Tg4 cells within the spleen 4 days after PBS or PIT (12 mice per group), data are pooled from three experiments giving consistent results. (C) Percentage of Ki-67+ cells within the Tg4 CD4+ population (4 mice per group, from one of two experiments giving consistent results).
Figure 5—figure supplement 2
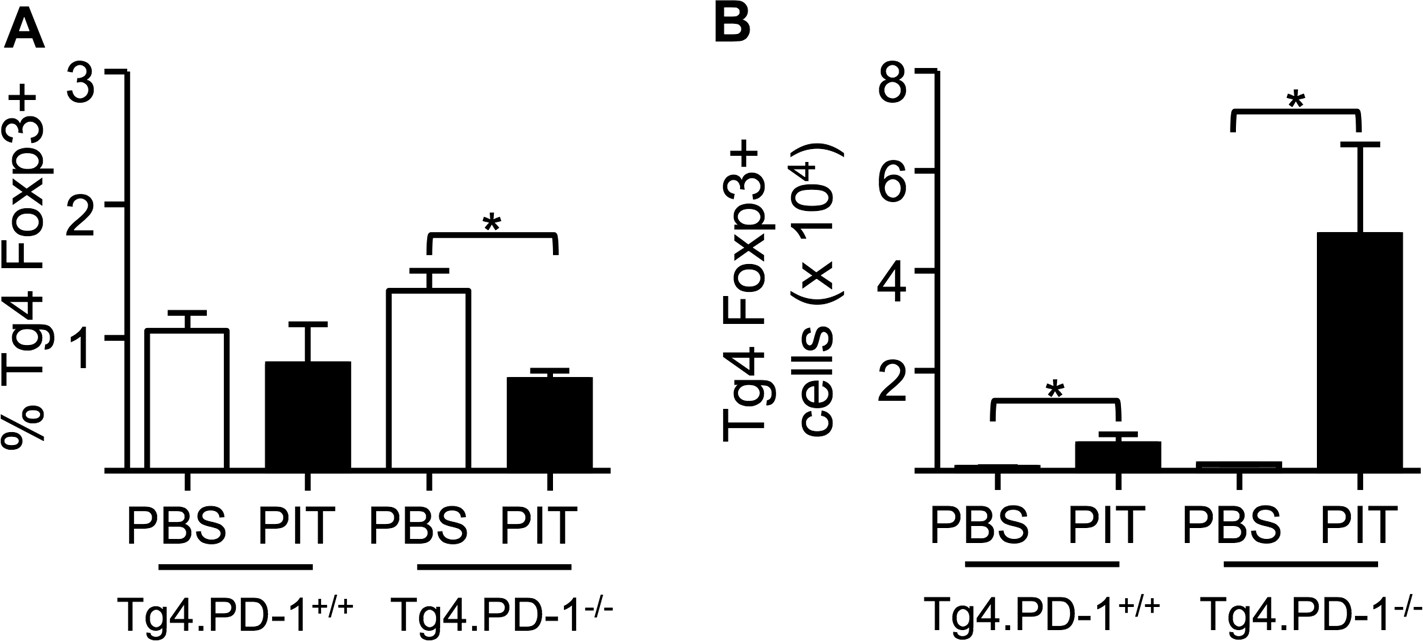
PIT does not increase the frequency of Foxp3+ Tg4 Teff cells.
B10.PLxC57BL/6 mice received PBS/PIT 1 day after transfer of Tg4.PD-1+/+ or Tg4.PD-1−/− Teff cells. (A) Percentage and (B) numbers of Foxp3+CD4+ Tg4 cells within the spleen 4 days after PBS/PIT. Data are pooled from three experiments giving consistent results (12 mice per group).
Figure 5—figure supplement 3
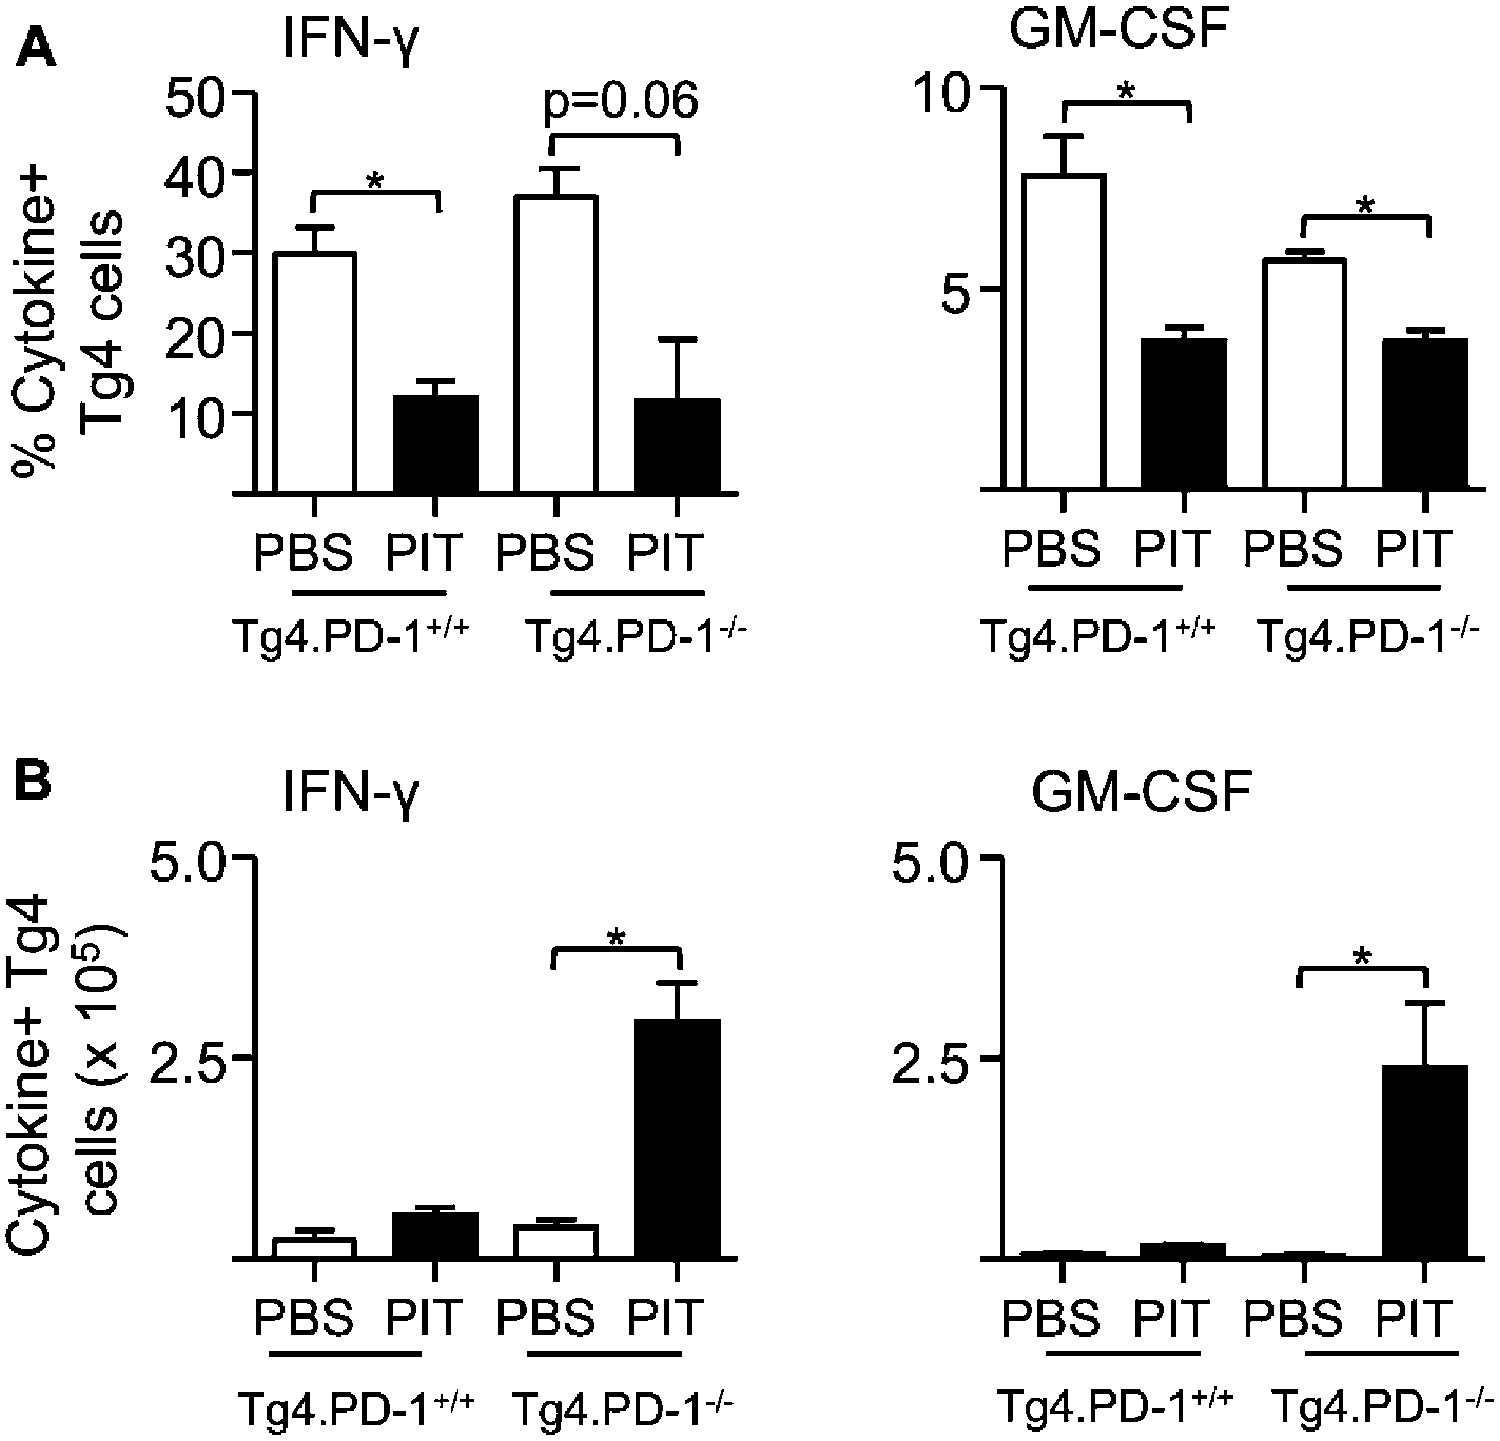
PIT limits the frequency of cytokine+ Tg4 Teff cells independently of PD-1.
B10.PLxC57BL/6 mice received PBS/PIT 1 day after transfer of Tg4.PD-1+/+ or Tg4.PD-1−/− Teff cells. Spleens were taken 4 days later for analysis (A) Percentage and (B) numbers of IFN-γ+ and GM-CSF+ CD4+ Tg4 cells following recall stimulation with 20 μM Ac1-9. Data are pooled from three experiments giving consistent results (12 mice per group).
Figure 5—figure supplement 4
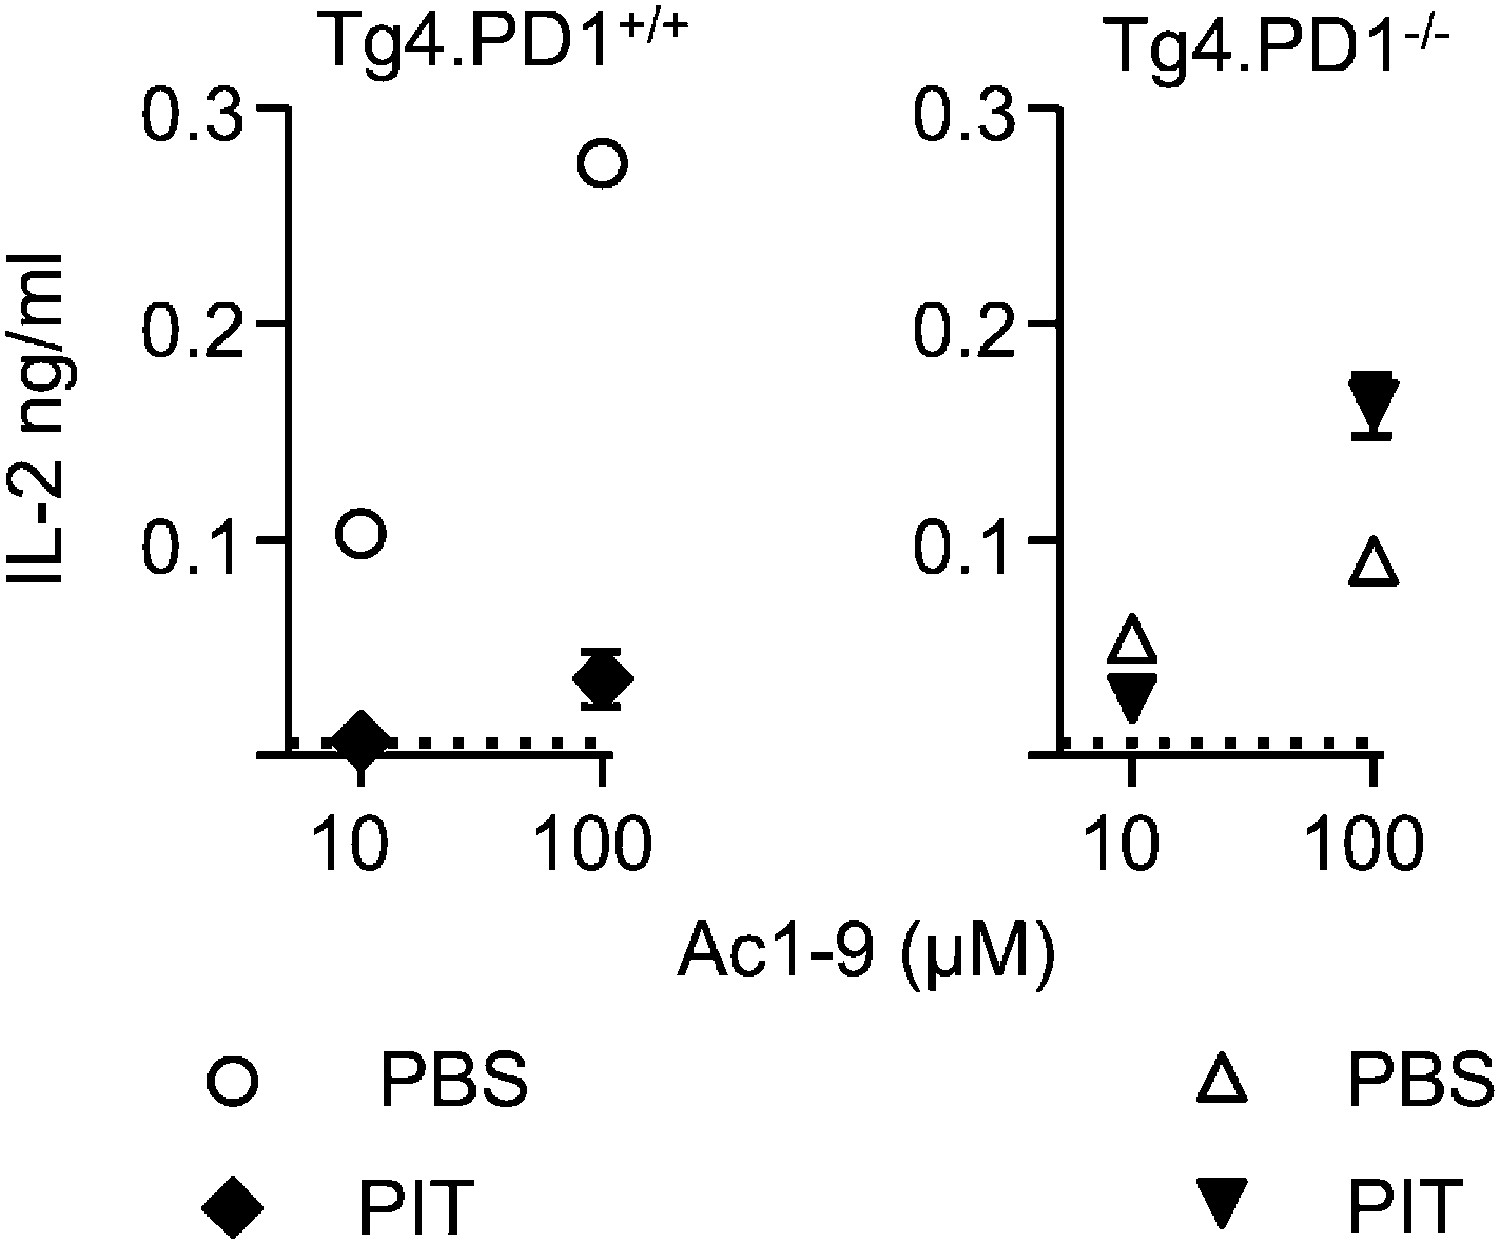
PIT-exposed Tg4.PD-1−/− Teff maintain their ability to produce IL-2.
B10.PLxC57BL/6 mice received PBS or PIT 1 day after transfer of Tg4.PD-1+/+ or Tg4.PD-1−/− Teff cells. Spleens were taken for analysis 4 days after PIT for retrieval of CD4+ Tg4 Teff (FACS-sorting). IL-2 production was measured after 48 hr culture with irradiated B10.PLxC57BL/6 splenic APC and MBP peptide, (dotted lines represent IL-2 levels from unstimulated cultures). Data (4 mice per group) are from one of two experiments giving consistent results).
Figure 5—figure supplement 5
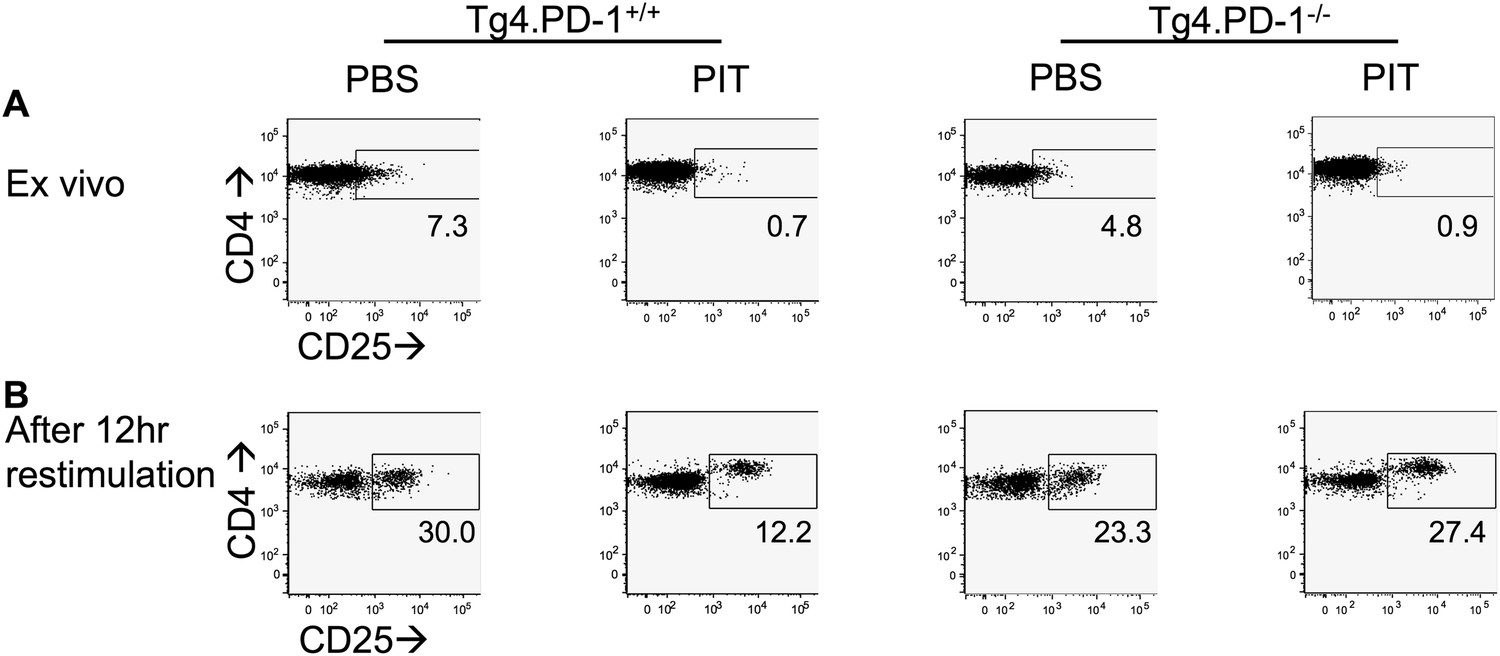
PD-1 limits CD25 up-regulation following recall stimulation of PIT-exposed Tg4 Teff.
B10.PLxC57BL/6 mice received PBS/PIT 1 day after transfer of Tg4.PD-1+/+ or Tg4.PD-1−/− Teff cells. Spleens were taken 4 days later for analysis. CD25 expression within the Tg4 CD4+ population (A) directly ex vivo and (B) 12 hr after recall stimulation with 20 μM Ac1-9.
Figure 5—figure supplement 6
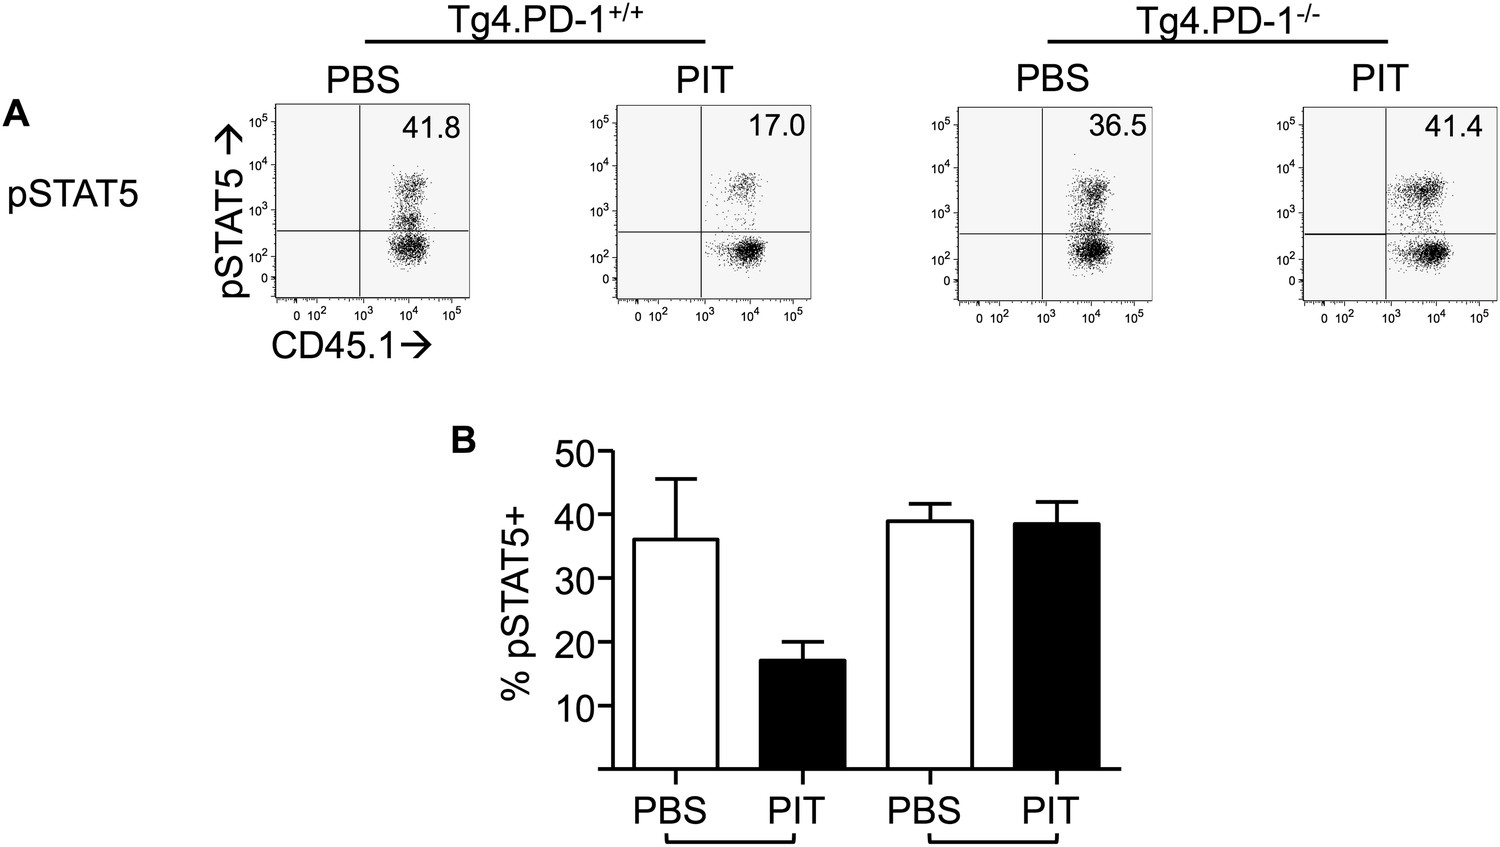
PD-1 limits phosphorylation of STAT5 in Tg4 Teff cells following PIT.
B10.PLxC57BL/6 mice received PBS/PIT 1 day after transfer of Tg4.PD-1+/+ or Tg4.PD-1−/− Teff cells. Spleens were taken 4 days later for analysis. Cells were stimulated for 12 hr with 20 μM Ac1-9, to allow upregulation of CD25, before 15-min exposure to IL-2 and detection of pSTAT5. (A) Representative plots of pSTAT5 staining. (B) Percentage of pSTAT5+ cells within the Tg4 CD4+ population. Data (4 mice per group) are from one of two experiments giving consistent results.
Figure 5—figure supplement 7
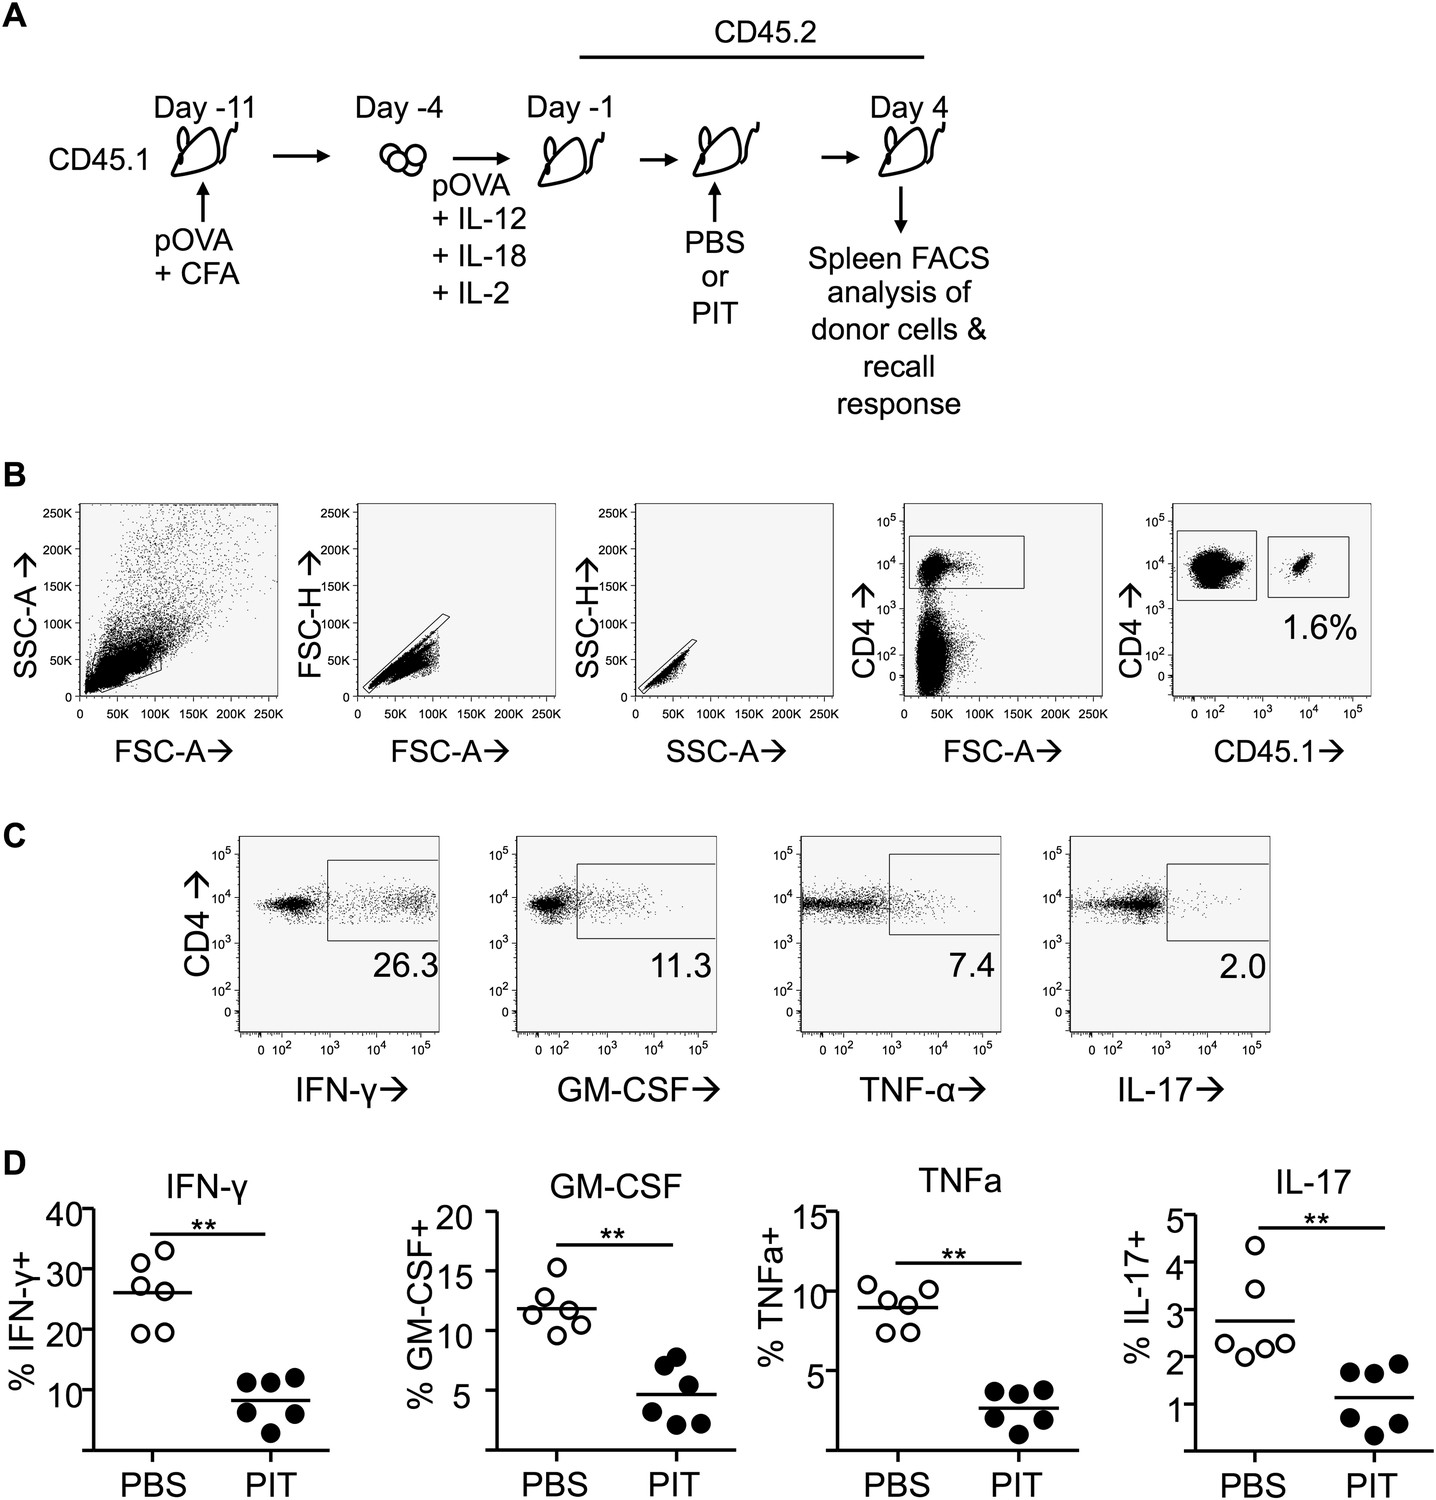
PIT limits effector cytokine production by polyclonal Teff cells.
(A) CD45.1 mice were immunized with pOVA/CFA and Teff cells generated by restimulation of draining lymph node cells with pOVA + cytokines. Teff cells were transferred into C57BL/6 (CD45.2) host mice prior to administration of pOVA or PBS and splenocytes were retrieved on day 4 (B) Gating strategy for identification of CD45.1+ donor cells within the spleen. (C) Representative plots of intracellular detection of GM-CSF, IFN-γ, TNF-α and IL-17 within the donor CD4+CD45.1+ population following recall stimulation with pOVA. (D) Percentage of cytokine+ cells within the donor Teff population. Data (6 mice per group) are from one of two experiments giving consistent results.
Figure 5—figure supplement 8
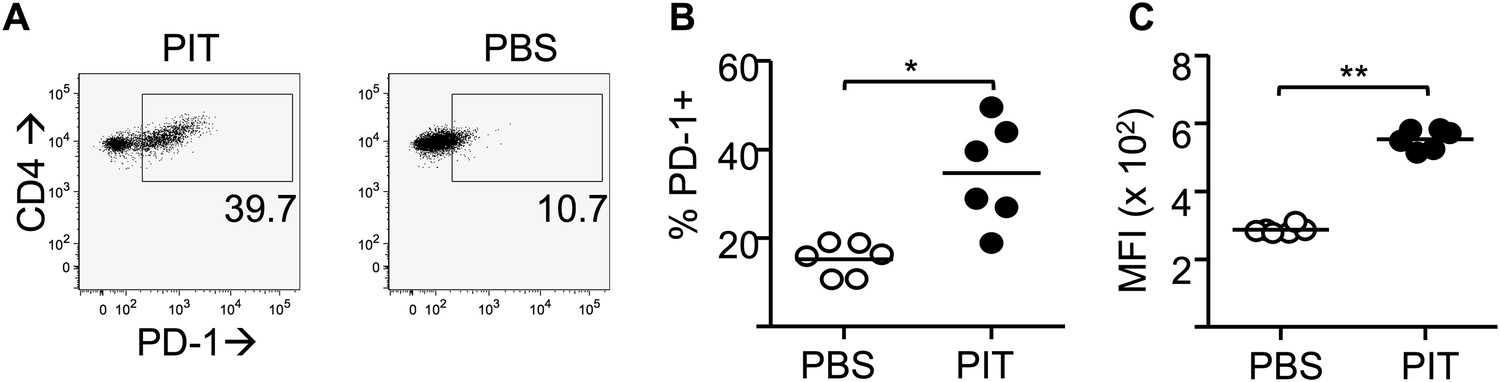
PIT drives PD-1 expression in polyclonal Teff cells.
Splenocytes from host mice as described in Figure 5—figure supplement 6 and analysed on day 4. (A) Representative plots of PD-1 staining on CD4+ donor Teff cells after PIT/PBS. (B) Percentage of PD-1+ cells within the donor CD4+ population. (C) MFI of PD-1 staining within the PD-1+ population. Data (six mice per group) are from one of two experiments giving consistent results.
Figure 6
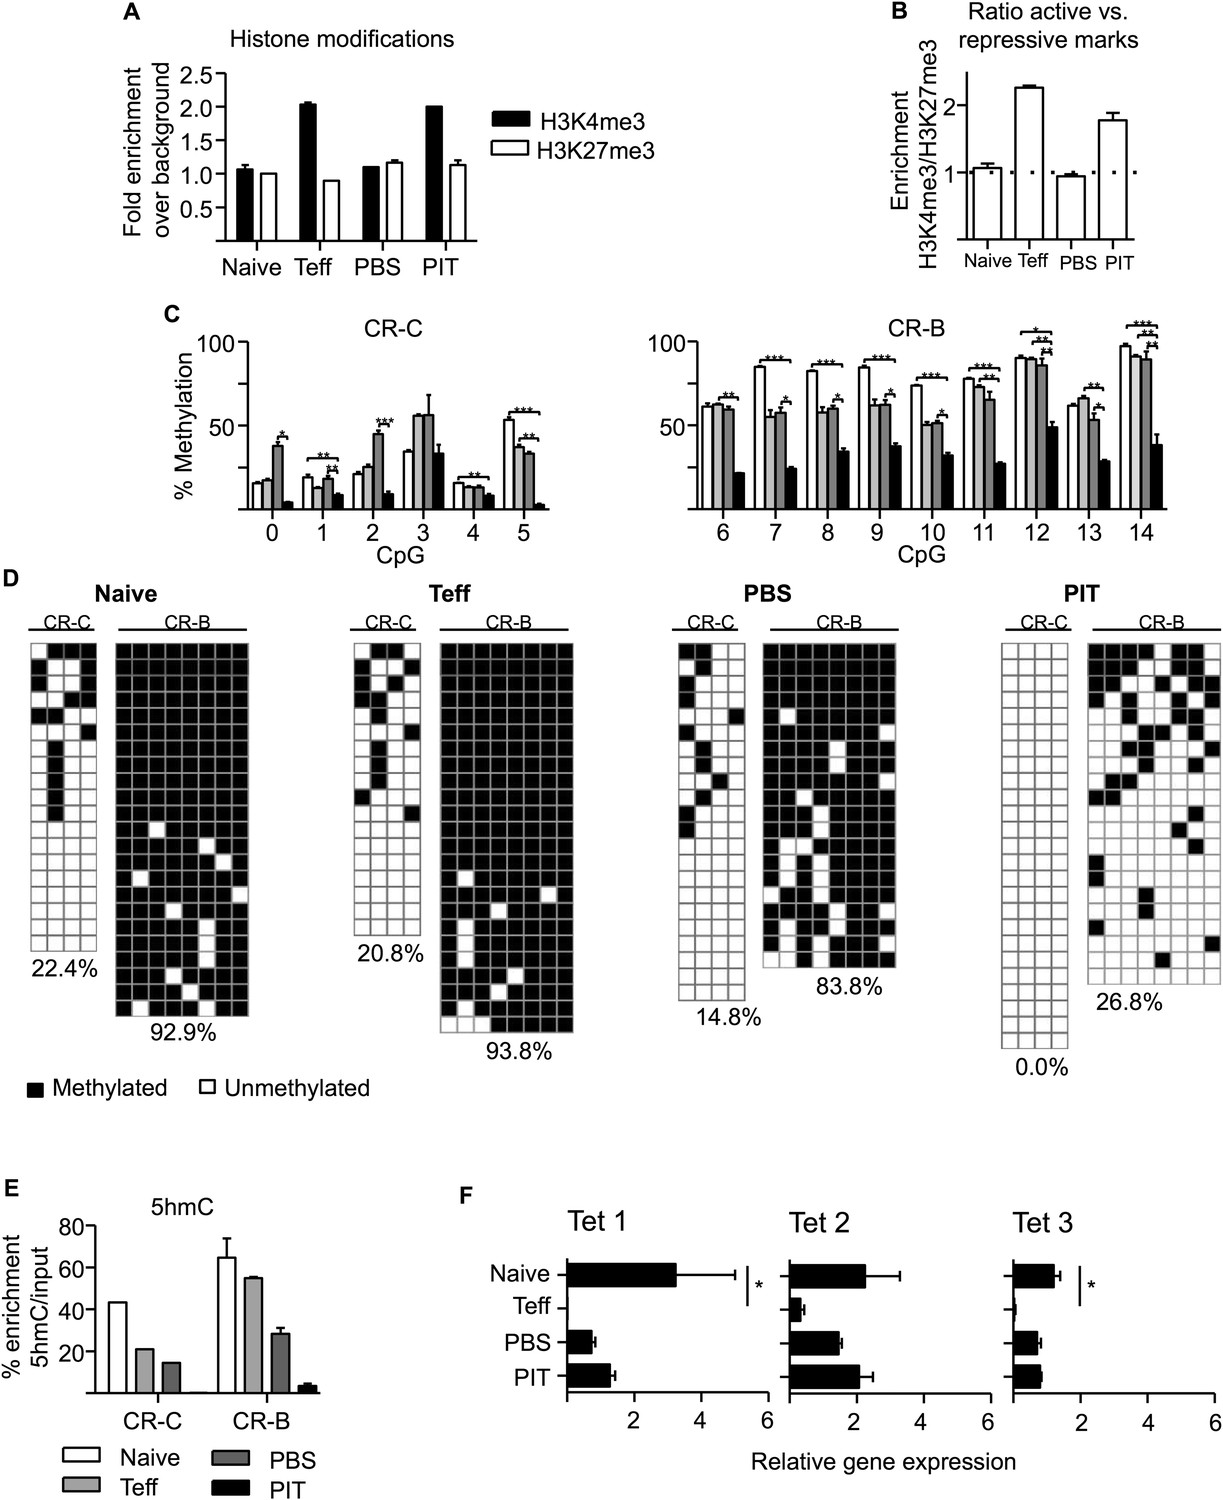
PIT induces epigenetic modification of the Pdcd1 promoter.
CD4+ Tg4 T cells were isolated as naïve cells, Teff on day of transfer and cells retrieved 4 days after either PBS or PIT for analysis of the CR-C and CR-B regions. (A, B) Histone modifications (H3K4me3 and H3K27me3) were analysed at CR-C and CR-B by ChIP and qPCR. Data in (B) show the ratio of H3K4me3 over H3K27me3 fold-enrichment over background and are representative of two independent experiments. (C, D) DNA methylation status determined by pyrosequencing (C) and bisulfite sequencing (D) (data are from two (C) or one (D) bisulfite conversions, four or more mice per group). (D) Methylated (black) and unmethylated (white) CpGs. Vertical columns represent individual CpGs (1–4 for CR-C and 7–14 for CR-B). Horizontal rows represent individual cloned alleles. (E) 5hmC enrichment at CR-C and CR-B as measured by 5hmC DNA Immunoprecipitation and qPCR. Data are from two experiments using pooled samples. (F) Total RNA was extracted from the isolated cell populations and expression levels of TET1, TET2 and TET3 were measured by qPCR. Values are expressed relative to housekeeping gene (GAPDH) and are representative of three experiments.
Author response image 1
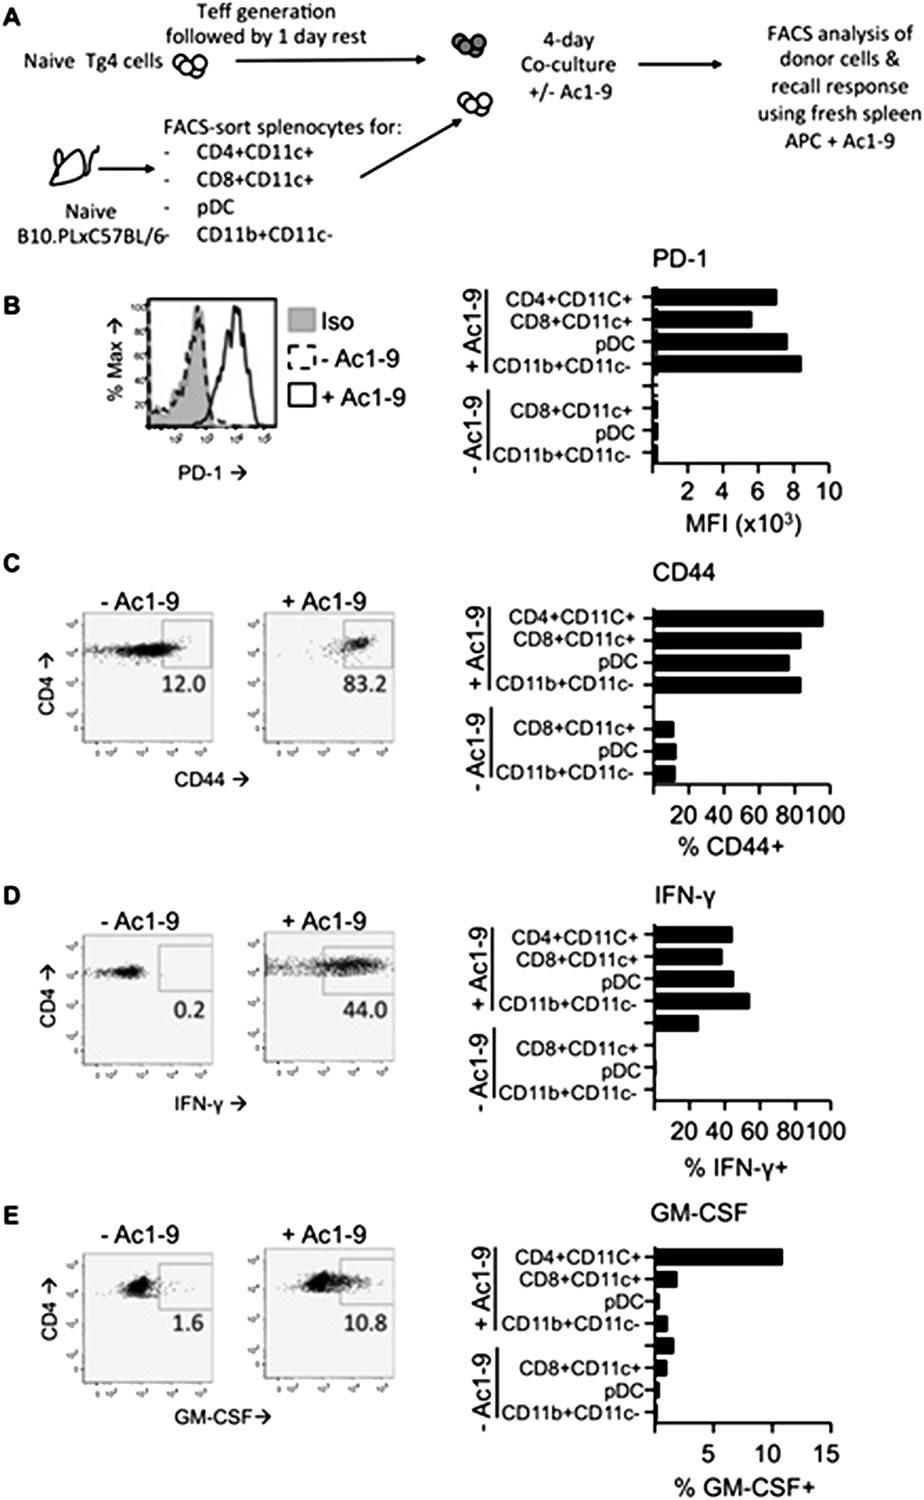
In vitro DC: T cell cultures. Tg4 Teff (CD45.1) were rested for one day prior to culture with FACS-sorted APC populations from the spleens of C57BL/6xB10.PL (CD45.2) mice in the presence of absence of 2µg/ml Ac1-9. Cells were analyzed four days later. B & C PD-1 and CD44 expression on Tg4 Teff cells. D & E effector cytokine production after overnight recall stimulation with 20µg/ml Ac1-9 and fresh irradiated C57BL/6xB10.PL splenocytes.
Tables
Table 1
Primer sequences for pyrosequencing analysis
| PDCD1 region | Assay | CpG | PCR primers 5′-3′ | Sequencing primer 5′-3′ | Product length (bp) |
|---|---|---|---|---|---|
| CR-C | 1 | 1 and 2 | F: AGGTATAAAGGAGGTTTTGTAATAGT | GAGGTTTTGTAATAGTTAGG | 186 |
| R: CCTCAACCACCCAAATTCAAA-BIO | |||||
| 2 | 3, 4, 5 | F: TGGGTGGTTGAGGTAGTT | GTTGAGGTAGTTGTTAGAT | 253 | |
| R: CACCTCACCTCCTACTTATCTCT-BIO | |||||
| 3 | 6 | F: TGTTTATTTTAGGGTGGTGAGATTTAT | GTTAGGTATTATGTATGTATATAAG | 221 | |
| R: TAAAAACCCACCTCACCTCCTACTT-BIO | |||||
| CR-B | 1 | 8, 9, 10, 11 | F: AAAGGAAGAAAAGTTTTAAGAGAAAGTAAG | CTATCCCACATACTCC | 167 |
| R: ACCCAACTATCCCACATACT-BIO | |||||
| 2 | 12, 13, 14, 15 | F: GGGTTTTTGTTTTTTAGTAGTAAAGGATTA | ATTAAGGTATAGTTTAGGGTA | 164 | |
| R: AAAACCAAACTCTTATCCCTTTAAAA-BIO | |||||
| 3 | 16 and 17 | F: GGTAGGGGAGGGTTTAGT | GTTTTGGGAGTTAAGG | 193 | |
| R: TCCTCTCCATTTCTAACCCCTCTTATA-BIO | |||||
| 4 | 7 | F: AGGGTAGTAGAGTTAGTAAATTTAAGATA | AGTAGAGAAAATAGTGAGAT | 103 | |
| R: CTCTTAAAACTTTTCTTCCTTTCAAAATAC-BIO |
Table 2
Primer sequences for bisulfite sequencing and RT-PCR
| Region | Assay | CpG | PCR primers 5′-3′ | Product length (bp) |
|---|---|---|---|---|
| CR-C* | 0–4 | F: ATAAAGGTATAAAGGAGGTTTTG | 363 | |
| R: CCTAACTAACTAATCATTTCT | ||||
| CR-C (nested)* | 1–4 | F: GAGGGGATTTTTTTAGTTTTTGT | 289 | |
| R: AATTTAATCATTCTACTCTCT | ||||
| CR-B* | 7–14 | F: GAAAGGAAGAAAAGTTTTAAG | 332 | |
| R: AAACTAAAACCAAACTCTTATCC | ||||
| CR-B (nested)* | 7–14 | F: GTTTTTTTGAATTTATAGGGGTG | 276 | |
| R: ACTCTTATCCCTTTAAAAAAT | ||||
| CR-C† | 1 | 3–5 | F: AGTTGCCAGATGGTTTCCAG | 154 |
| R: CTGGGGCATTCTGATGATTT | ||||
| CR-B† | 1 | 10–14 | F: CGGGTCCTAGGAAATGTTCA | 236 |
| R: GCCAGACTCTTGTCCCTTTG | ||||
| 2 | 7–10 | F: TACAGGGGTGTCTGGAGAGG | 156 | |
| R: ATGCCCTGAGCTATGCCTTA | ||||
| GAPDH† | F: CCACTCCCCTTCCCAGTT | 147 | ||
| R: CCTATAAATACGGACTGC |
-
*
Primer sequences for bisulfite sequencing.
-
†
Primer sequences for RT-PCR.
Download links
A two-part list of links to download the article, or parts of the article, in various formats.
Downloads (link to download the article as PDF)
Open citations (links to open the citations from this article in various online reference manager services)
Cite this article (links to download the citations from this article in formats compatible with various reference manager tools)
Epigenetic modification of the PD-1 (Pdcd1) promoter in effector CD4+ T cells tolerized by peptide immunotherapy
eLife 3:e03416.
https://doi.org/10.7554/eLife.03416


