Cell cycle constraints on capsulation and bacteriophage susceptibility
- Institute of Genetics and Genomics in Geneva, University of Geneva, Switzerland
- Institute of Life Sciences, Université catholique de Louvain, Belgium
Figures
Figure 1
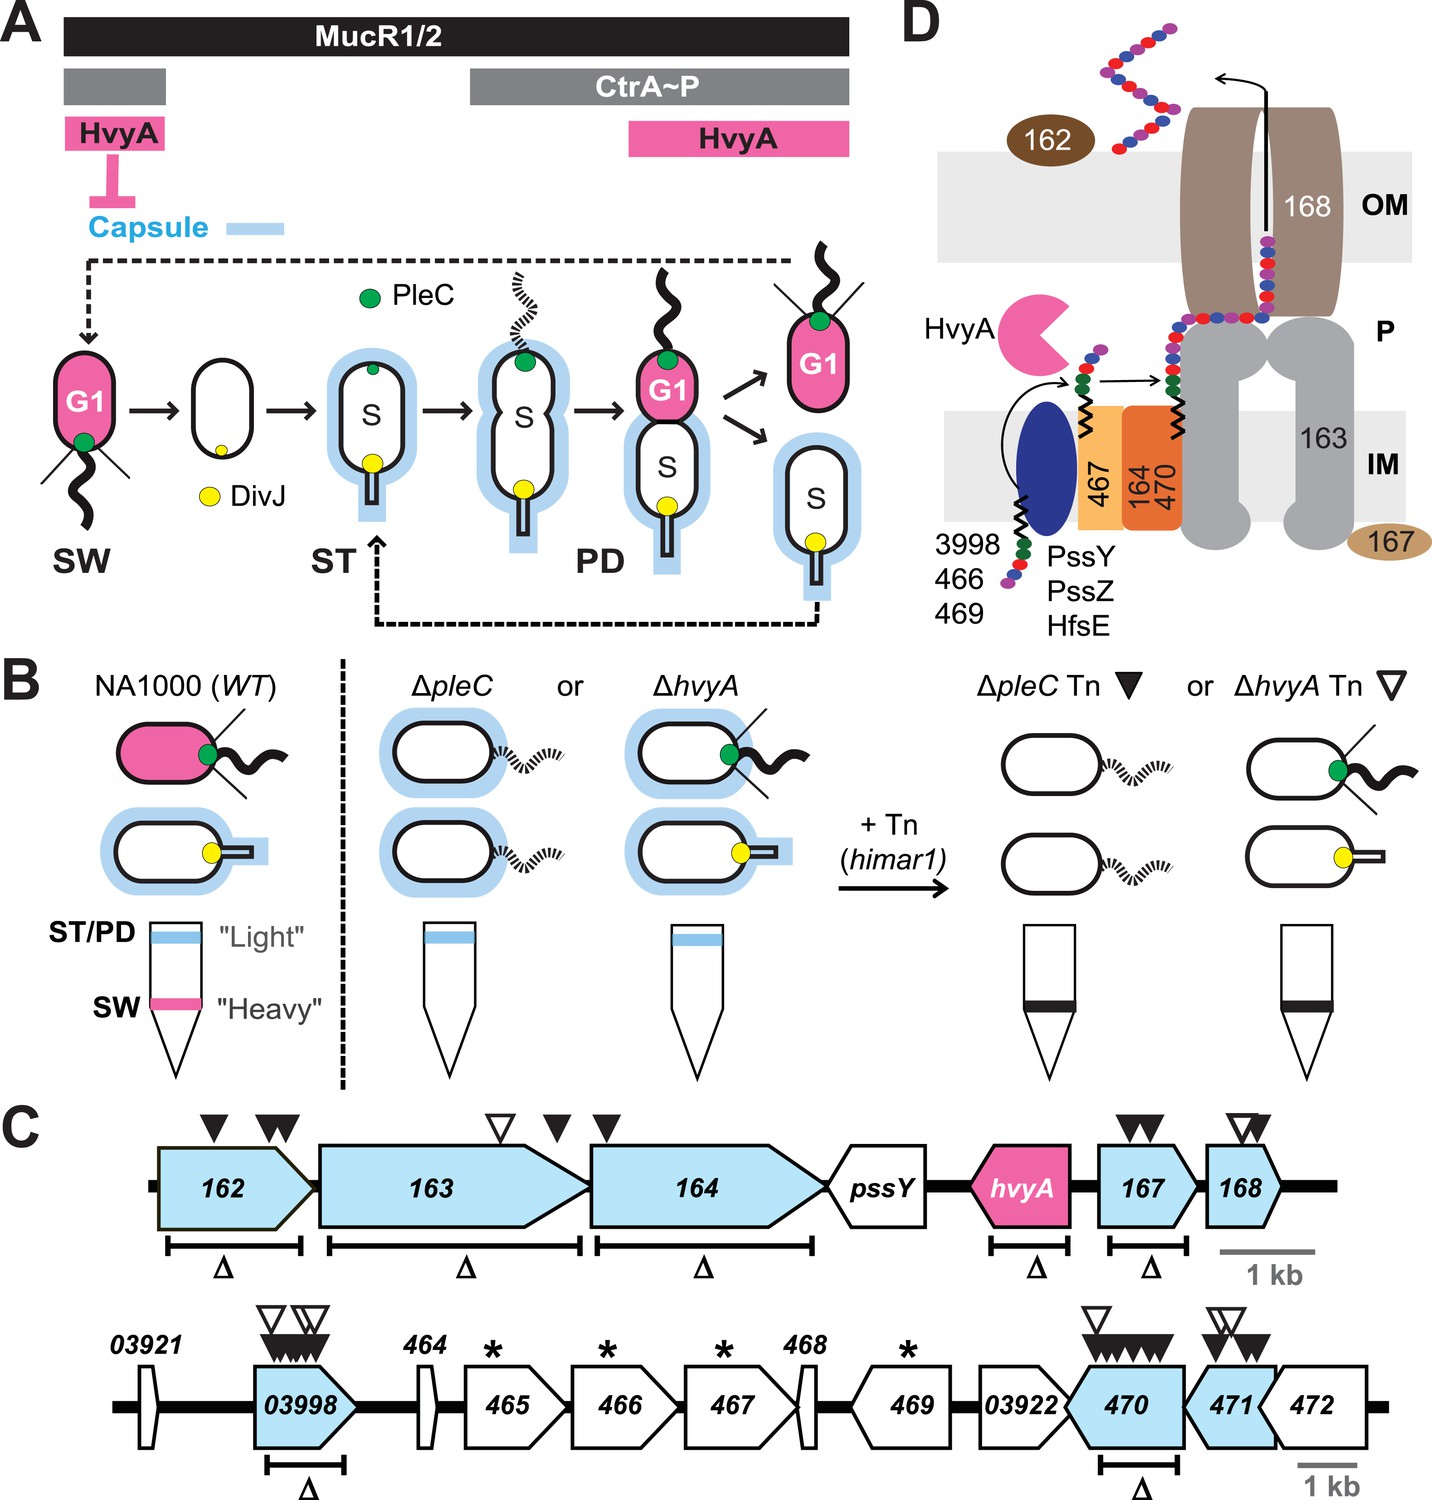
Capsulation of Caulobacter cells is cell cycle regulated.
(A) Schematic of the Caulobacter cell cycle and the regulatory interactions that determine the presence/absence of the capsule (in blue). Phosphorylated CtrA (CtrA∼P) and MucR1/2 control expression of hvyA. The antagonistic kinase/phosphatase pair, DivJ (yellow dot) and PleC (green dot), indirectly influences CtrA∼P and partitions with the stalked (ST) cell chamber or swarmer (SW) cell chamber, respectively. PleC promotes CtrA∼P accumulation in the SW cell. HvyA prevents encapsulation in SW cells. Pink denotes HvyA accumulation in the SW (G1) cell compartment. Light blue indicates the presence of the capsule in ST(S) and pre-divisional (PD) cells. (B) Schematic of cell buoyancy upon centrifugation on density gradient for WT Caulobacter cells (left). SW cells sediment in the lower band (‘heavy’, in pink) whereas ST and PD cells sediment in the upper band (‘light’, in blue). ΔpleC and ΔhvyA cells are ‘light’ due to the constitutive presence of capsule (middle). Upon transposon mutagenesis with himar1 Tn, we isolated ‘heavy’ non-capsulated mutants by cell density centrifugation (right). (C) Caulobacter loci identified by the cell density screen. The upper panel represents the CCNA_00162-CCNA_00168 locus and the lower panel the CCNA_03921-CCNA_00472 locus on the mobile genetic element of Caulobacter NA1000. The fragment deleted for each in-frame deletion is indicated (Δ). Black triangles indicate Tn insertions obtained in the ΔpleC background and white triangles indicate Tn insertions obtained in the ΔhvyA background. CCNA_00166 (hvyA) is shown in pink, and the genes hit by our buoyancy screen for ‘heavy’ mutants are in blue. The asterisks show the ORFs identified as essential by Christen et al. (2011). (D) Schematic of capsule polymerisation/export system based on the one for group 1 CPS in E. coli (Collins and Derrick, 2007). Putative functions were attributed to Caulobacter proteins based on the homology and conserved domains. CCNA_03998, CCNA_00466, and CCNA_00469 are putative glycosyltransferases; PssY, PssZ, and HfsE are polyisoprenylphosphate hexose-1-phosphotransferases; CCNA_00467 is a putative flippase; CCNA_00165 and CCNA_00470 are polymerases; CCNA_00163 and CCNA_00167 have homology to the tyrosine autokinase Wzc and its phosphatase Wzb, respectively, that regulate polymerisation and export; CCNA_00168 is the putative outer membrane lipoprotein required for translocation of the polysaccharide across the outer membrane.
Figure 2 with 5 supplements

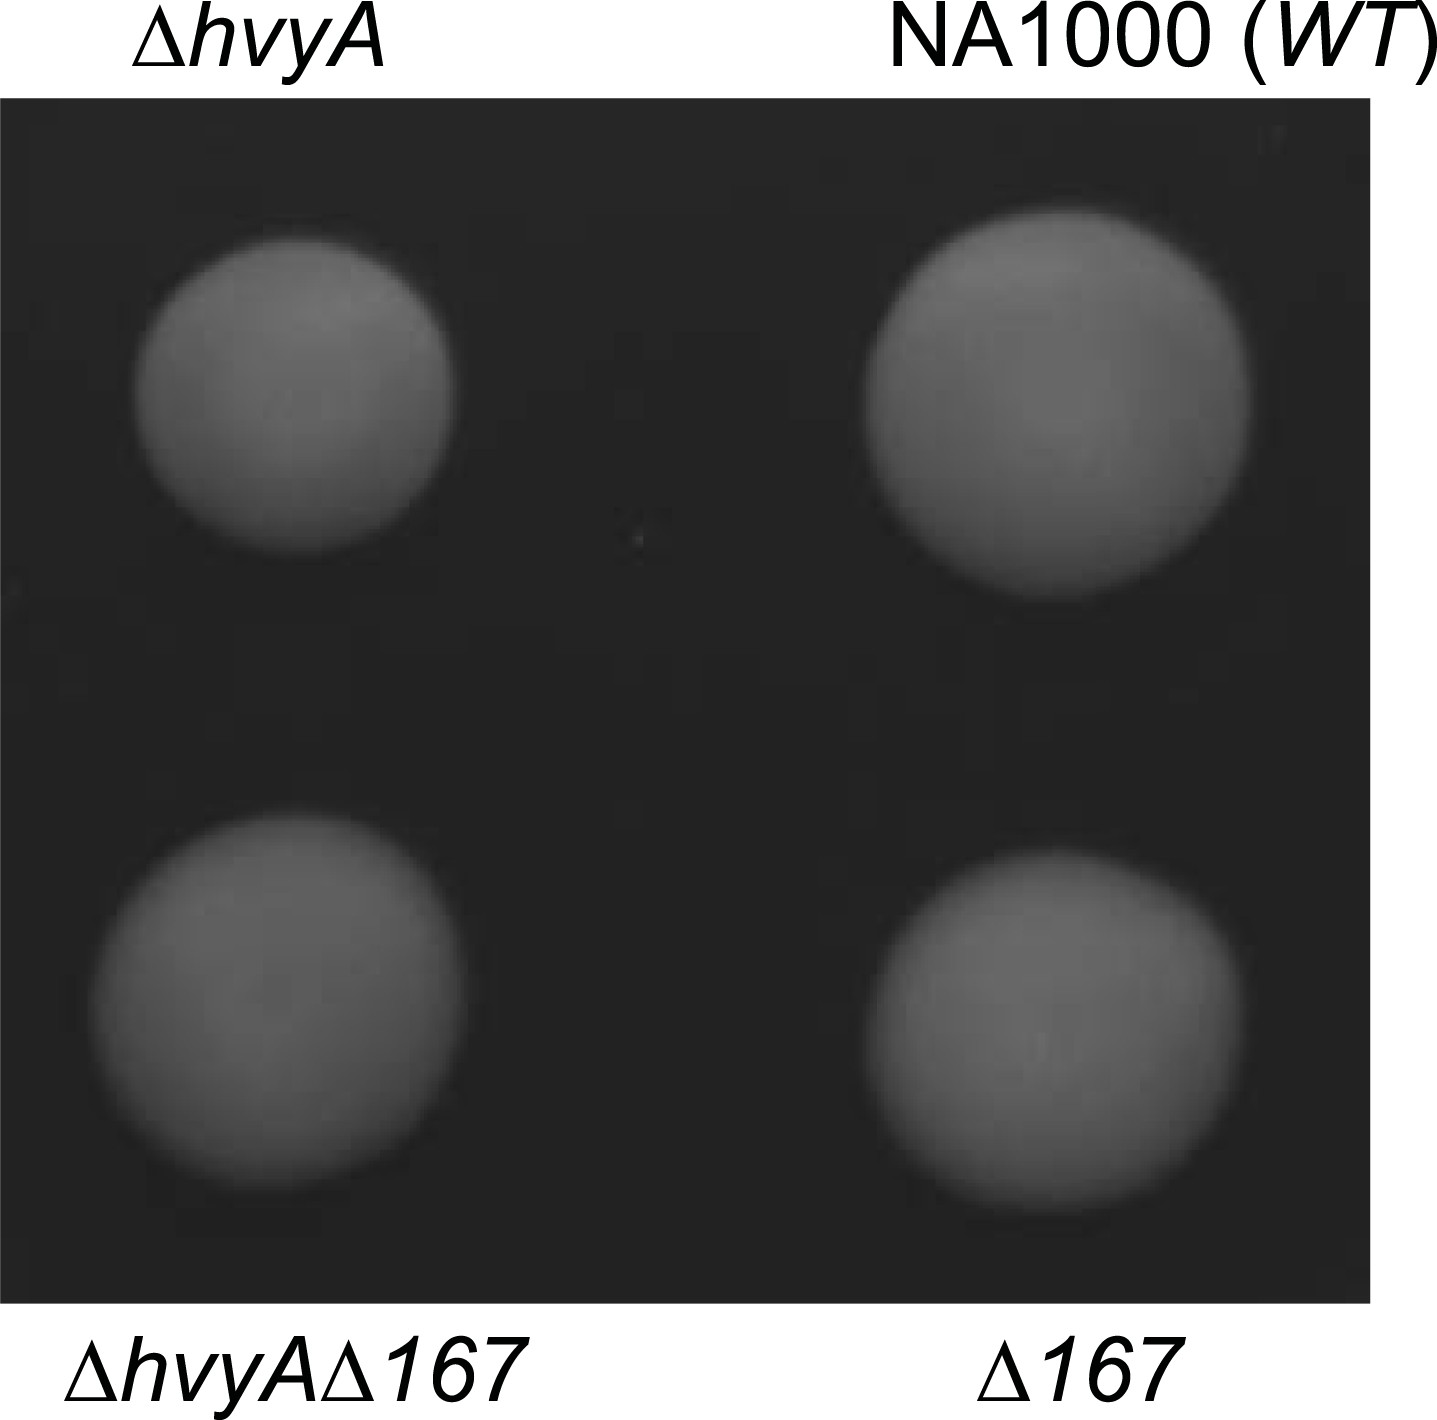
Capsulation affects buoyancy, mucoidy, and bacteriophage sensitivity.
(A) Sensitivity to bacteriophage φCr30 and buoyancy of Caulobacter WT (NA1000) and different mutant strains. Mutation in CCNA_00163 or CCNA_00470 restores sensitivity to φCr30 in ΔpleC and ΔhvyA mutant backgrounds. ΔpleC, ΔhvyA, and the double mutant ΔpleC ΔhvyA are ‘light’, whereas mutation in CCNA_00163 or CCNA_00470 renders cells ‘heavy’ (also in a ΔpleC or ΔhvyA background). (B) Mucoidy of Caulobacter WT (NA1000) and different mutant strains plated on PYE medium supplemented with 3% sucrose. WT, ΔpleC, and ΔhvyA are highly mucoid, whereas mutations in CCNA_00163 or CCNA_00470 confer a ‘rough’ non-mucoid phenotype in all three backgrounds (WT, ΔpleC, and ΔhvyA). (C) Mucoidy of Caulobacter WT (NA1000), ΔpleC, or ΔhvyA cells over-expressing hvyA under control of Pvan on a medium copy number plasmid (pMT335) or Pxyl on a low copy number plasmid (pMT375). Over-expression of hvyA confers the typical non-mucoid ‘rough’ colony phenotype on PYE agar plates supplemented with 3% sucrose, while the WT, ΔpleC, and ΔhvyA cells have a mucoid ‘smooth’ colony appearance. Sensitivity to bacteriophage φCr30 and buoyancy of Caulobacter WT (NA1000), ΔhvyA, ΔpleC, and ΔmucR1/2 strains carrying pMT335-hvyA or pMT375-hvyA are shown in Figure 2—figure supplement 1–2. RsaA extracted from the same Caulobacter strains shown in Figure 2 is displayed in Figure 2—figure supplement 3. The effect of proteinase K treatment on CCNA_00168 in Caulobacter WT, ΔhvyA, and ΔCCNA_00163 is shown in Figure 2—figure supplement 4. The effect of the ΔhvyA mutation on swarming motility of Caulobacter is shown in Figure 2—figure supplement 5.
Figure 2—figure supplement 1
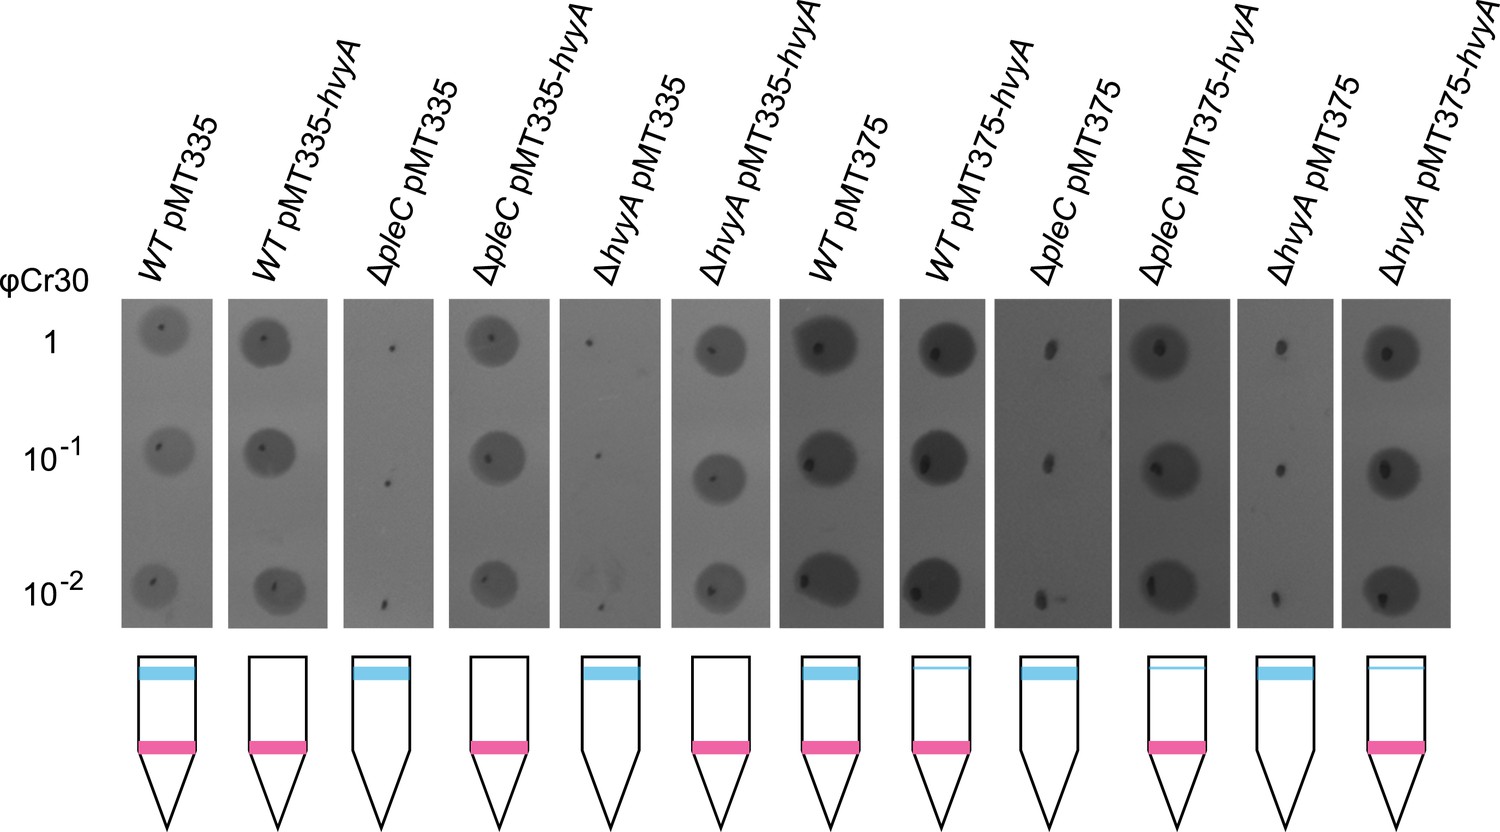
Over-expression of hvyA renders ΔpleC cells ‘heavy’ and sensitive to φCr30.
Sensitivity to φCr30 and buoyancy of C. crescentus WT, ΔpleC or ΔhvyA cells harbouring hvyA on plasmid, under control of Pvan (pMT335, medium copy number) or Pxyl (pMT375, low copy number). Over-expression of hvyA restores sensitivity to φCr30 and ‘heavy’ cell buoyancy to the ΔpleC or ΔhvyA cells.
Figure 2—figure supplement 2
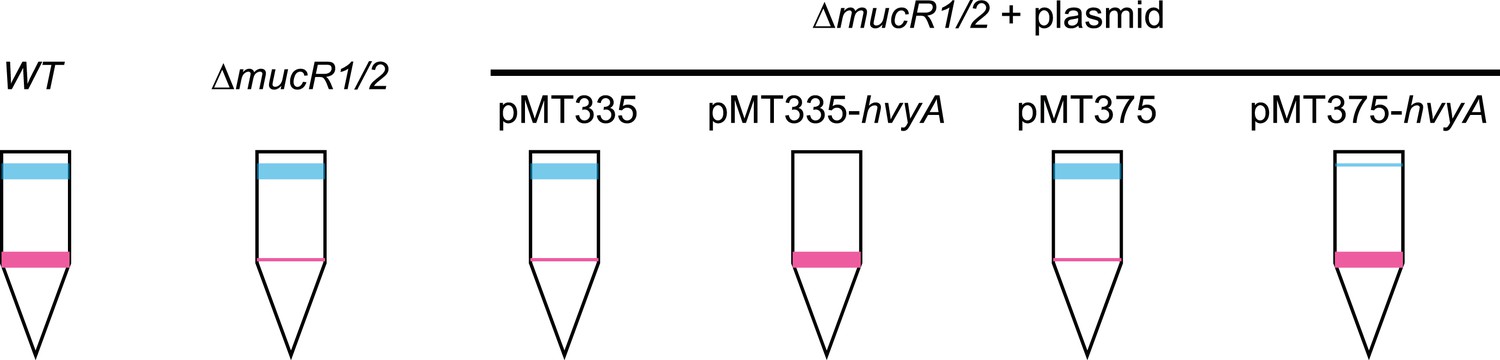
Over-expression of hvyA renders ΔmucR1/2 cells ‘heavy’. Buoyancy of ΔmucR1/R2 cells harbouring hvyA on plasmid.
Over-expression of hvyA from Pvan or Pxyl restores the ‘heavy’ phenotype to ΔmucR1/R2 cells.
Figure 2—figure supplement 3
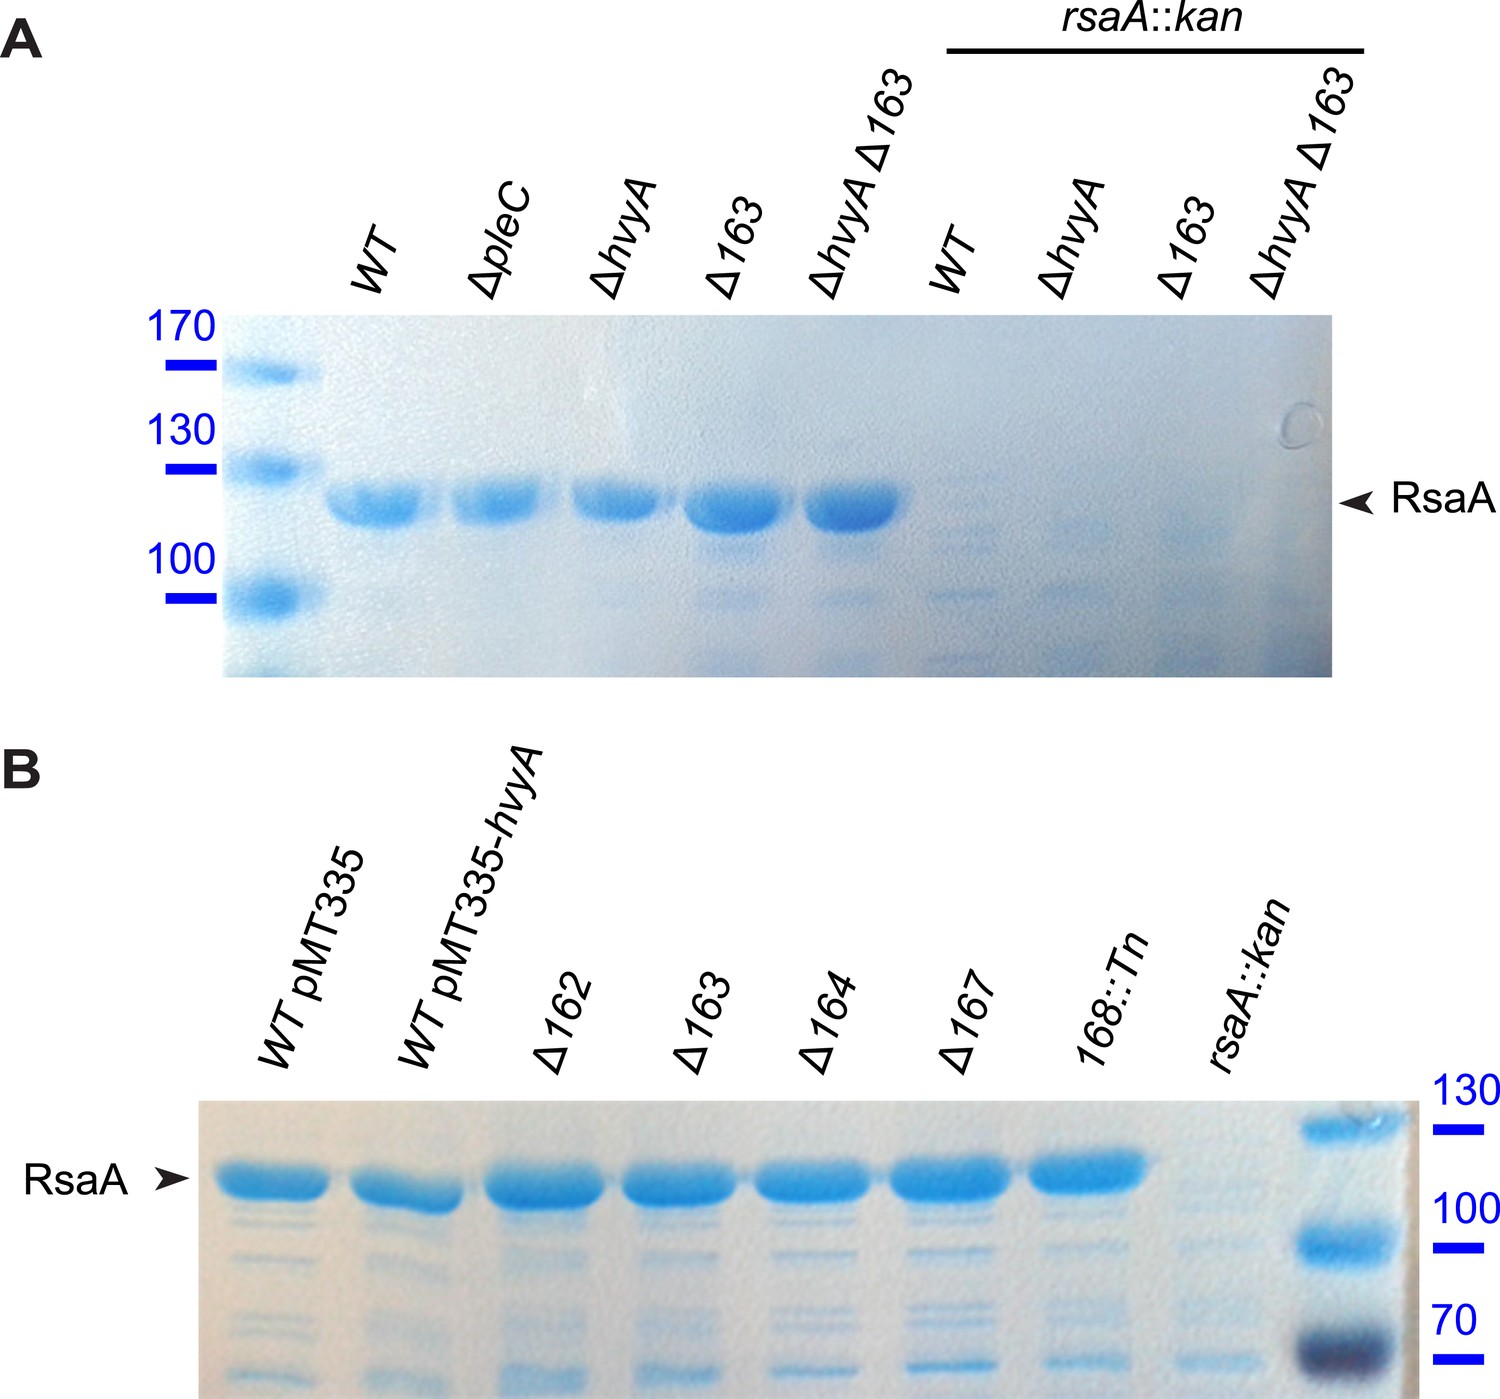
S-layer is correctly assembled in Caulobacter mutants affected in capsule production.
(A) RsaA, the main component of Caulobacter S-layer, is present in mutants affected in capsule synthesis/export. RsaA was extracted by EGTA treatment and run on 7.5% SDS-PAGE, followed by Coomassie staining. Mutations in pleC, hvyA, or CCNA_00163 do not affect the presence of RsaA. Molecular size standards are indicated in blue on the left, with the corresponding values in kDa. RsaA is indicated by the arrowhead on the right. (B) The amount of RsaA extracted by EGTA treatment is not affected by hvyA over-expression or in mutants affected in capsule synthesis/export. Proteins extracted by EGTA treatment were run on 7.5% SDS-PAGE, followed by Coomassie staining. Molecular size standards are indicated in blue on the right, with the corresponding values in kDa. RsaA is indicated by the arrowhead on the left.
Figure 2—figure supplement 4
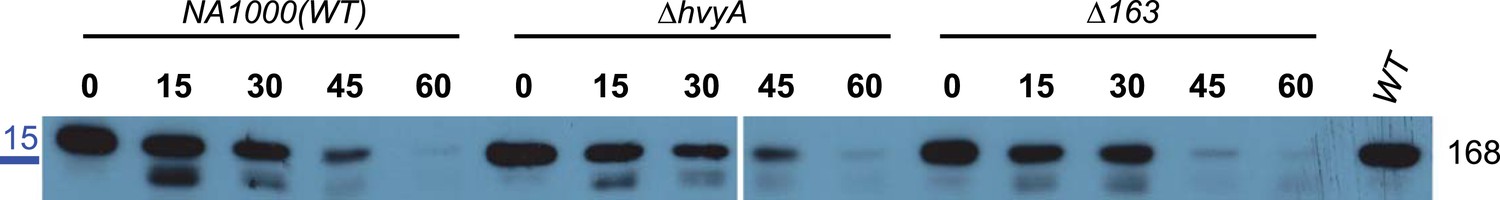
Capsule protects cell surface proteins from proteinase K treatment.
Immunoblot anti-CCNA_00168 (outer membrane protein) on whole cells (WT, ΔhvyA, or ΔCCNA_00163) treated with proteinase K. Samples were taken at different time points (0, 15, 30, 45, and 60 min) after adding proteinase K. The immunoblot shows that CCNA_00168 is degraded by proteinase K more rapidly in the non-capsulated ΔCCNA_00163 mutant than in WT or ΔhvyA cells. This indicates that the absence of the capsule in the ΔCCNA_00163 mutant strain makes the proteins in the outer membrane more accessible to proteinase K. Molecular size standards are indicated in blue on the left, with the corresponding values in kDa.
Figure 2—figure supplement 5
Loss of hvyA affects swarming motility.
ΔhvyA cells show a motility defect on soft agar plate (PYE supplemented with 0.3% agar). We hypothesize that encapsulation of SW cells in the ΔhvyA mutant could interfere with flagellar rotation, as mutation of ΔCCNA_00167 restores WT motility to the ΔhvyA cells.
Figure 3 with 3 supplements
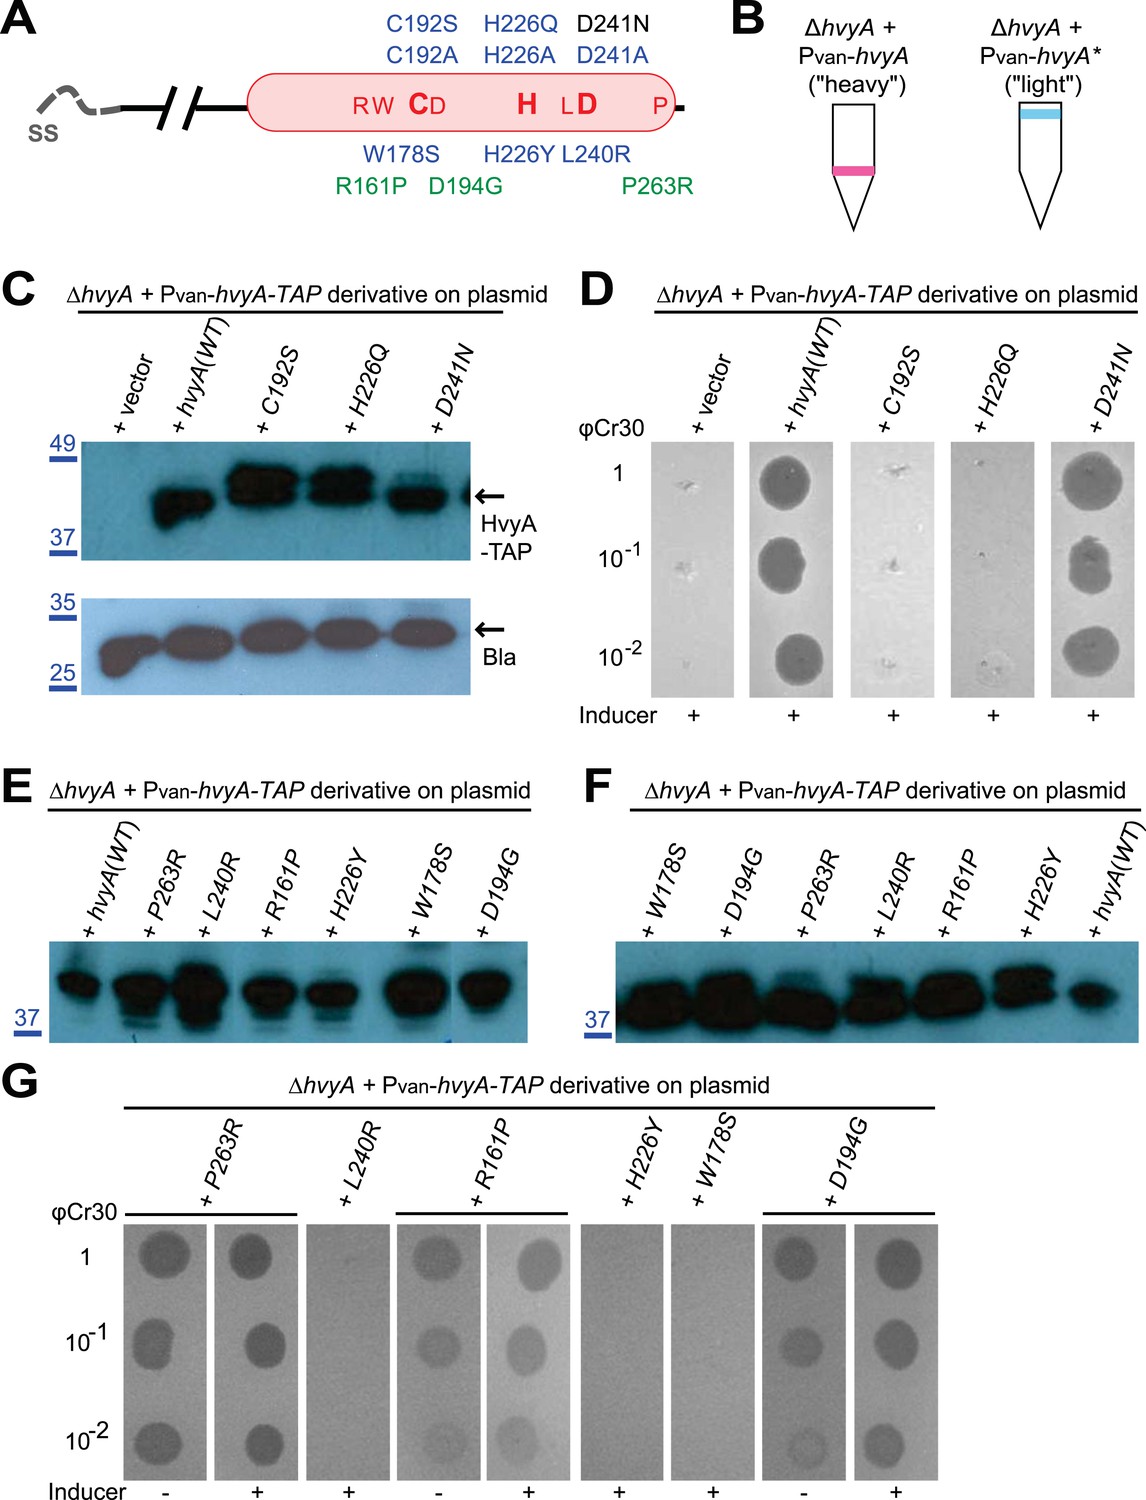
HvyA is a bacterial transglutaminase-like cysteine protease (BTLCP) homologue and its catalytic activity is required for function.
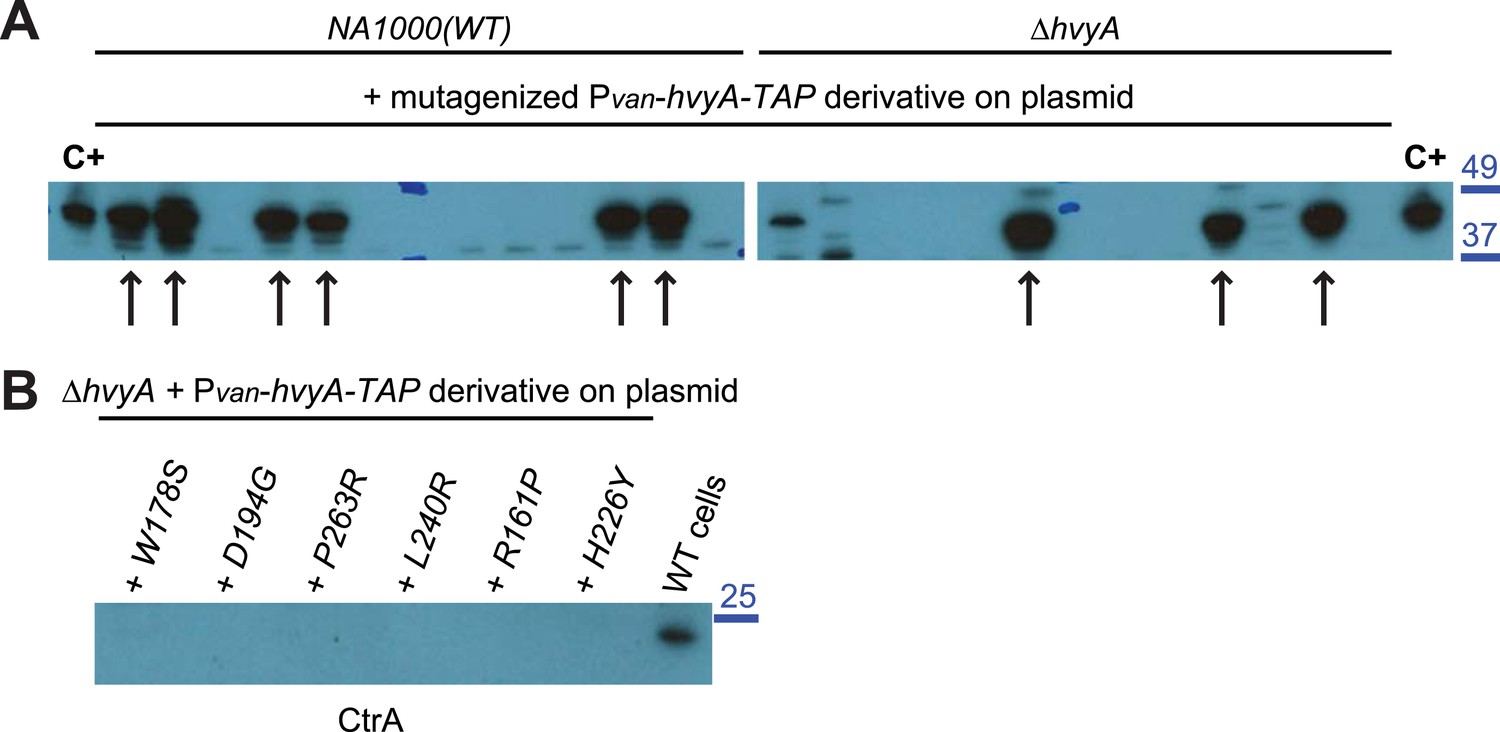
(A) Schematic of HvyA domains: signal sequence (SS) and BTLCP domain (in red) are indicated. C192, H226, and D241 constitute the putative catalytic triad (C192S/A, H226Q/A, and D241A alleles are non-functional; the D241N allele is functional, consistently with some BTLCP family members having a C/H/N catalytic triad). Residues identified in the buoyancy screen for non-functional variants are indicated below (blue, non-functional; green, partially functional). (B) Schematic of the buoyancy screen for HvyA non-functional variants. The Pvan-hvyA::TAP fusion (on plasmid) was subjected to random mutagenesis, then introduced into Caulobacter cells that were subjected to multiple rounds of enrichment for ‘light’ phenotype by centrifugation on density gradient. (C) Immunoblot anti-HvyA-TAP on periplasmic proteins extracted by EGTA treatment. The HvyA alleles mutated in putative catalytic residues are expressed and exported to the periplasm like the WT protein. Immunoblot against Caulobacter β-lactamase (CCNA_02223, Bla on the lower panel) is a control for periplasmic proteins. Molecular size standards are indicated in blue on the left, with the corresponding values in kDa. (D) ΔhvyA strains harbouring hvyA catalytic mutants under control of Pvan on plasmid were tested for sensitivity to φCr30. Over-expression of the C192S or H226Q alleles does not restore sensitivity to φCr30, indicating that these alleles are non-functional. (E) Immunoblot anti-HvyA-TAP on ΔhvyA cells harbouring mutagenized Pvan-hvyA-TAP and selected for ‘light’ buoyancy. The Pvan-HvyA-TAP mutant alleles selected are still over-expressed. Molecular size standards are indicated in blue on the left, with the corresponding values in kDa. (F) Immunoblot anti-HvyA-TAP on EGTA fractions of the same clones shown in panel (E). The HvyA-TAP mutant alleles selected are exported to the periplasm like WT HvyA-TAP. Molecular size standards are indicated in blue on the left, with the corresponding values in kDa. (G) ΔhvyA strains harbouring hvyA variants under control of Pvan on pMT335 were tested for sensitivity to φCr30. The L240R, H226Y, and W178S alleles do not restore sensitivity to φCr30, whereas the P263R, R161P and D194G variants partially restore sensitivity to φCr30. The alignment of BTLCPs protein sequences from Caulobacter (HvyA), S. meliloti (SMc00998), S. fredii NGR234 (NGR_c12490), and P. fluorescens (PFL_0130) is shown in Figure 3—figure supplement 1. Immunoblots against HvyA-TAP, CtrA, and β-lactamase on whole lysates and EGTA fractions of cells expressing HvyA point mutants are shown in Figure 3—figure supplement 2–3.
Figure 3—figure supplement 1
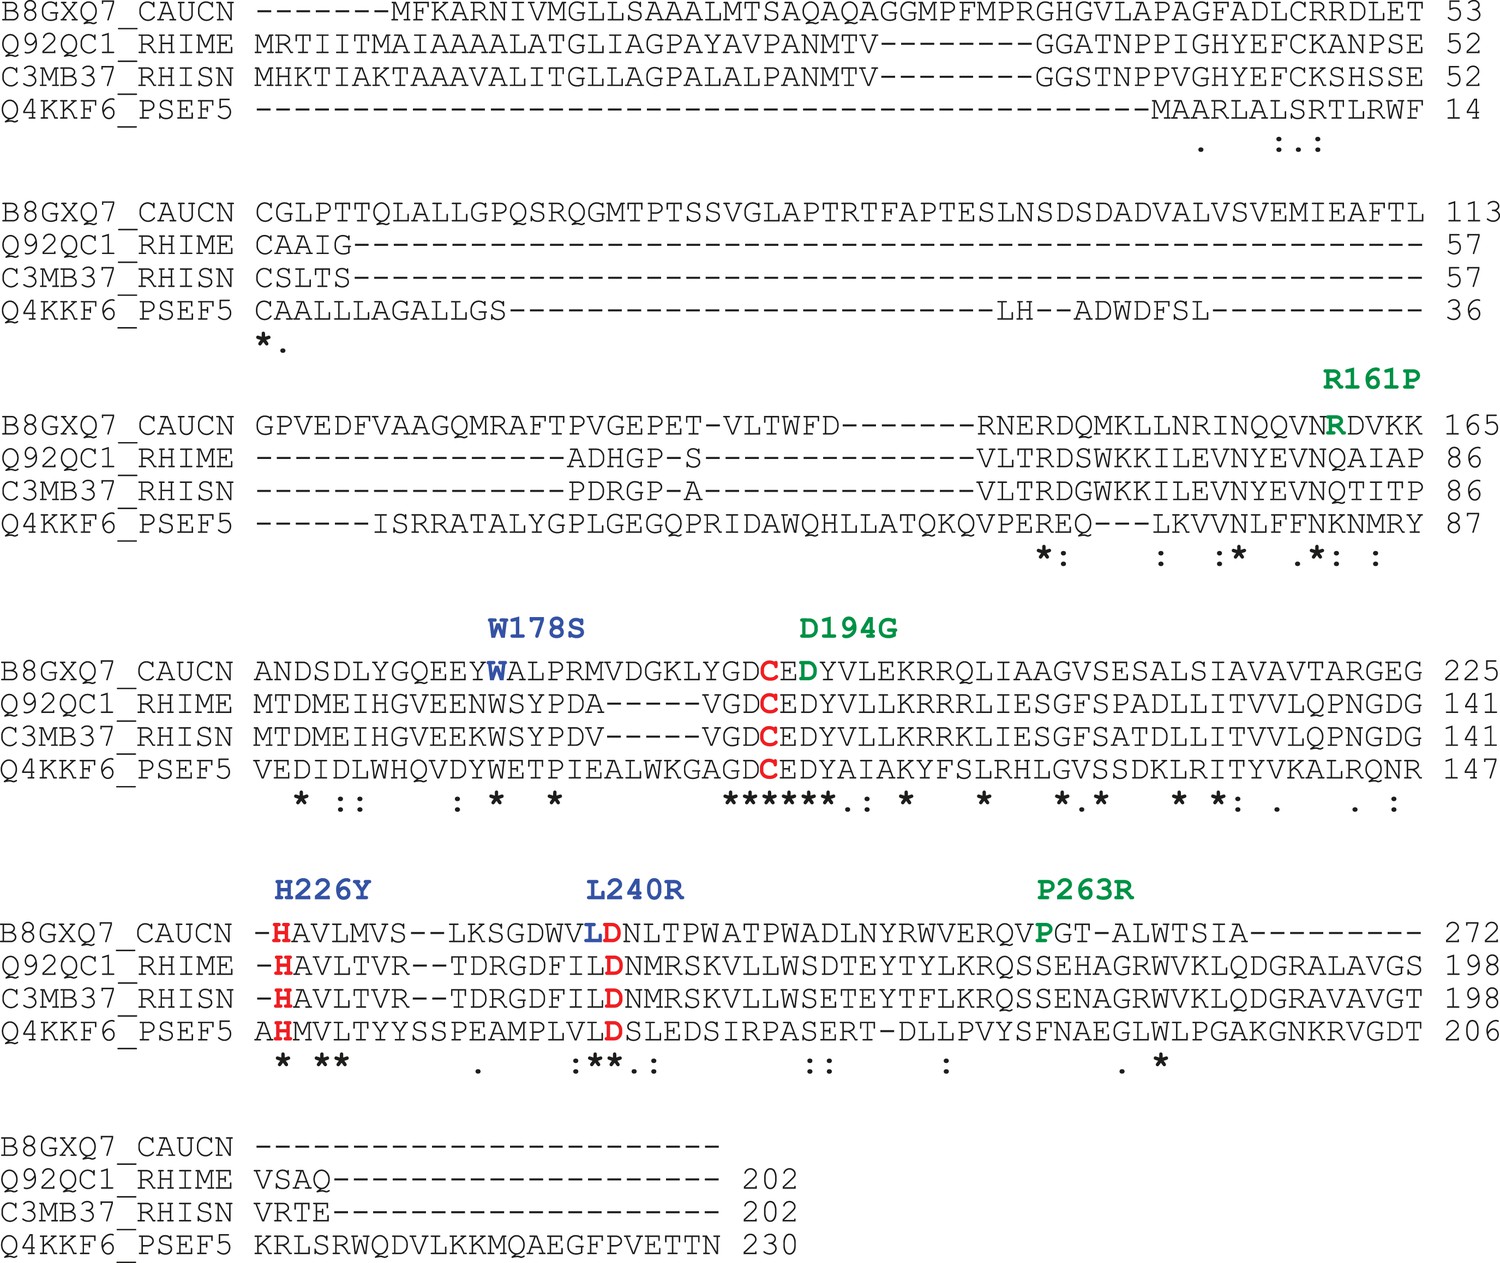
Conservation of the BTLCP domain in HvyA orthologs.
Alignment of protein sequences for members of the BTLCP family. CAUCN, C. crescentus HvyA; RHIME, S. meliloti SMc00998; RHISN, S. fredii NGR_c12490; PSEF5, P. fluorescens PFL_0130. The three putative catalytic residues are indicated in red. The residues identified by our buoyancy screen for HvyA loss-of-function are indicated in blue (non-functional) and green (partially functional) above the sequence.
Figure 3—figure supplement 2
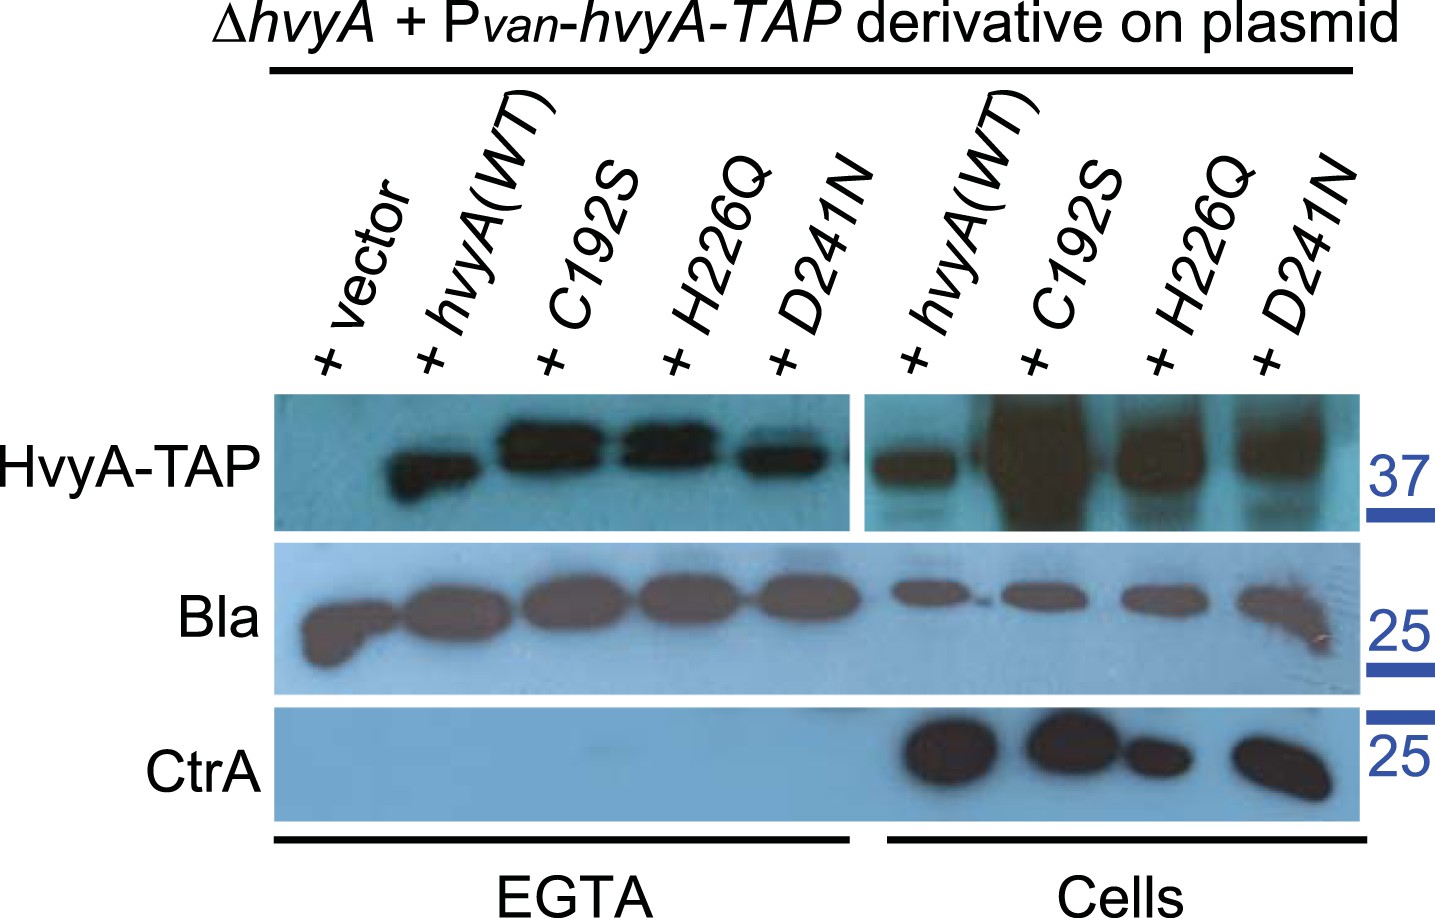
Catalytic HvyA-TAP mutants are still exported to the periplasm.
Immunoblots on total proteins (right) and EGTA fractions (left) of ΔhvyA cells harbouring Pvan-hvyA-TAP derivatives on plasmid (WT or catalytic mutants). All the variants tested were produced and exported to the periplasm. Immunoblot anti-CCNA_02223 (β-lactamase, Bla) was used as control for the periplasmic proteins and immunoblot anti-CtrA as control for cytoplasmic proteins. Molecular size standards are indicated in blue on the right, with the corresponding values in kDa.
Figure 3—figure supplement 3
Over-expression of HvyA-TAP alleles.
(A) Immunoblot anti-HvyA-TAP on WT and ΔhvyA cells harbouring mutagenized Pvan-hvyA-TAP derivatives on plasmid. Mutagenized Pvan-hvyA-TAP was introduced in WT or the ΔhvyA strain and ‘light’ cells were selected by centrifugation on density gradient. ‘Light’ clones were tested by immunoblot in order to verify that the HvyA-TAP fusion was still expressed. The clones indicated by arrows were selected for sequencing the hvyA-TAP and identify the mutations. Cells harbouring WT Pvan-hvyA-TAP were used as control (C+) for the immunoblot. Molecular size standards are indicated in blue on the right, with the corresponding values in kDa. (B) Immunoblot anti-CtrA on EGTA fractions of ΔhvyA cells harbouring Pvan-hvyA-TAP derivatives on plasmid (WT or mutants). CtrA is a cytoplasmic protein and it is not released by EGTA treatment. The samples shown in this immunoblot are the same shown in Figure 3F. Molecular size standards are indicated in blue on the right, with the corresponding values in kDa.
Figure 4
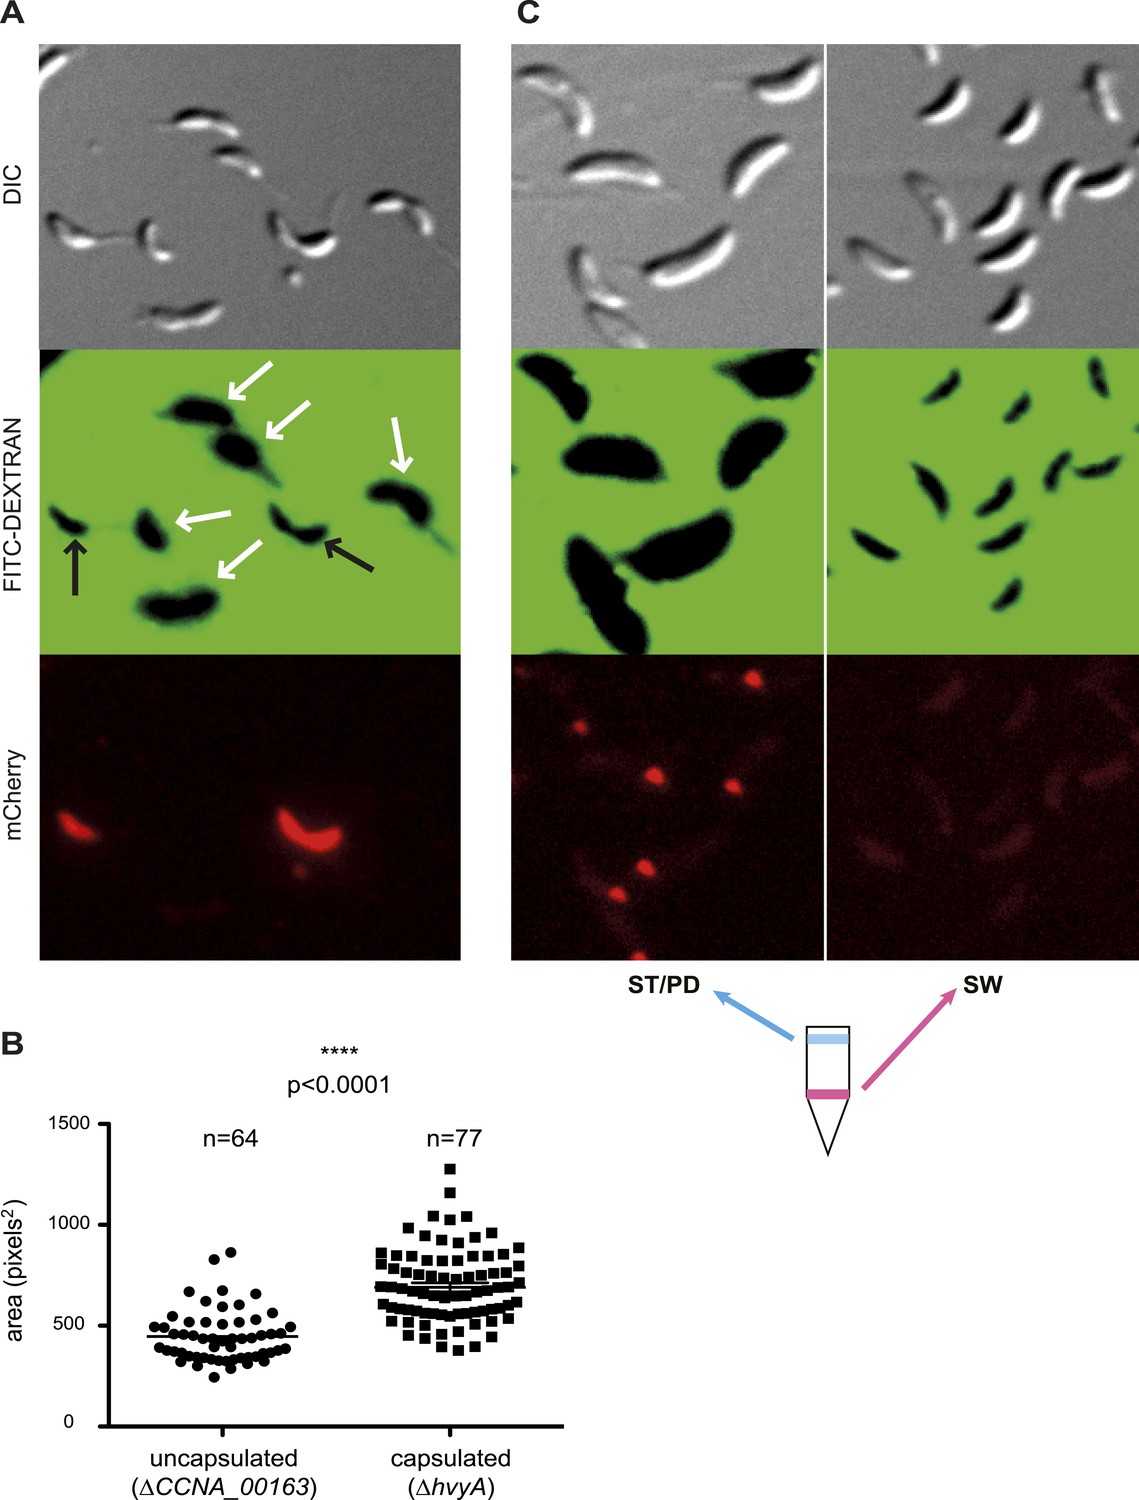
Negative fluorescence imaging of capsule.
(A) Differential Interference Contrast (DIC, top) and fluorescence images showing FITC-dextran exclusion (middle) or mCherry (bottom) of mixed ΔCCNA_00163 (expressing mCherry) and ΔhvyA cells. The area of FITC-dextran exclusion of the non-capsulated ΔCCNA_00163 cells is much smaller than that of the capsulated ΔhvyA cells. (B) Statistical analysis of the area from which FITC-dextran was excluded. The analysis was performed as described in the ‘Materials and methods’. (C) DIC (top) and fluorescence images showing FITC-dextran exclusion (middle) or mCherry (bottom) on NA1000 spmX-mCherry cells. SW and ST/PD cells were separated on density gradient before incubation with FITC-dextran. Area of exclusion of ST and PD cells (‘light’ cells, on the left) is much bigger than that of SW cells (on the right). SpmX-mCherry is absent from SW cells, accumulates at the SW to ST cell transition and labels the ST pole.
Figure 5
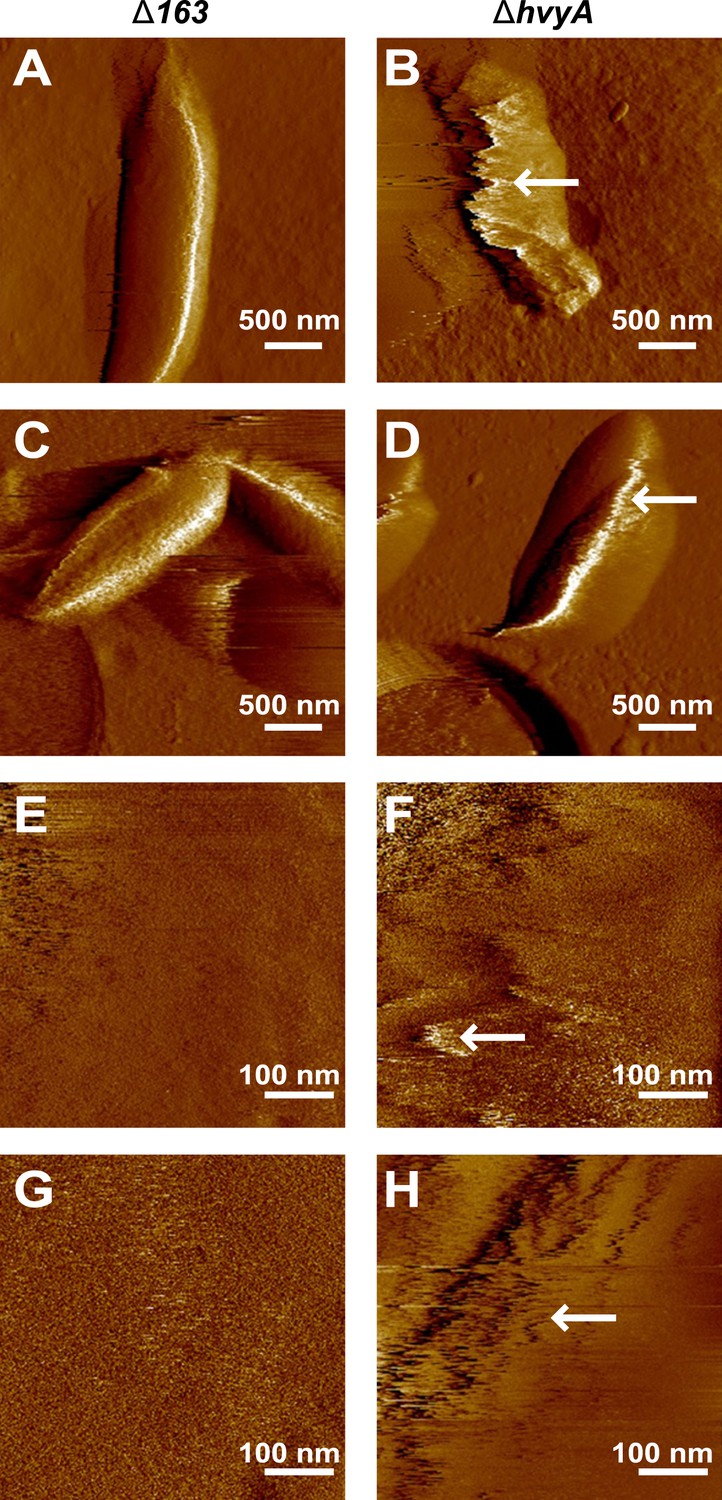
Nanoscale AFM imaging reveals the ultrastructure of Caulobacter cell surface.
Contact-mode deflection images of ΔCCNA_00163 cells (A, C, E, G) and ΔhvyA cells (B, D, F, H) at low (A–D) and high (E–H) magnifications. White arrows indicate streaks generated by the AFM tip scanning the soft, loosely bound layer at the surface of ΔhvyA cells. Images were taken on bacteria from two independent cultures for each strain.
Figure 6 with 1 supplement

HvyA is an unstable protein and its presence is restricted to G1-phase (SW cells).
(A) Immunoblots showing protein levels in synchronized Caulobacter cells: CCNA_00162, CCNA_00163, CCNA_00164, CCNA_00167, and CCNA_00168 levels do not change over the cell cycle. mCherry-HvyA accumulates only in SW cells, akin to CtrA. CcrM accumulates in PD cells, and PilA levels increase upon re-accumulation of CtrA. The β-lactamase (Bla) was used as control as it is constitutively present along the cell cycle. Molecular size standards are indicated in blue on the right, with the corresponding values in kDa. (B) Immunoblots showing degradation of mCherry-HvyA (indicated by the arrowhead) after addition of chloramphenicol (2 μg/ml) to stop protein synthesis. mCherry-HvyA is degraded as rapidly as the unstable protein CtrA (lower panel). Molecular size standards are indicated in blue on the right, with the corresponding values in kDa. (C) Immunoblot anti-mCherry-HvyA showing that levels of the mCherry-HvyA fusion protein (indicated by the arrowhead) are significantly decreased in the ΔmucR1/2 mutant strain. Molecular size standards are indicated in blue on the right, with the corresponding values in kDa. Levels of CCNA_00162, CCNA_00163, CCNA_00164, CCNA_00167, and CCNA_00168 in Caulobacter cells over-expressing HvyA (from Pvan) are shown in Figure 6—figure supplement 1.
Figure 6—figure supplement 1
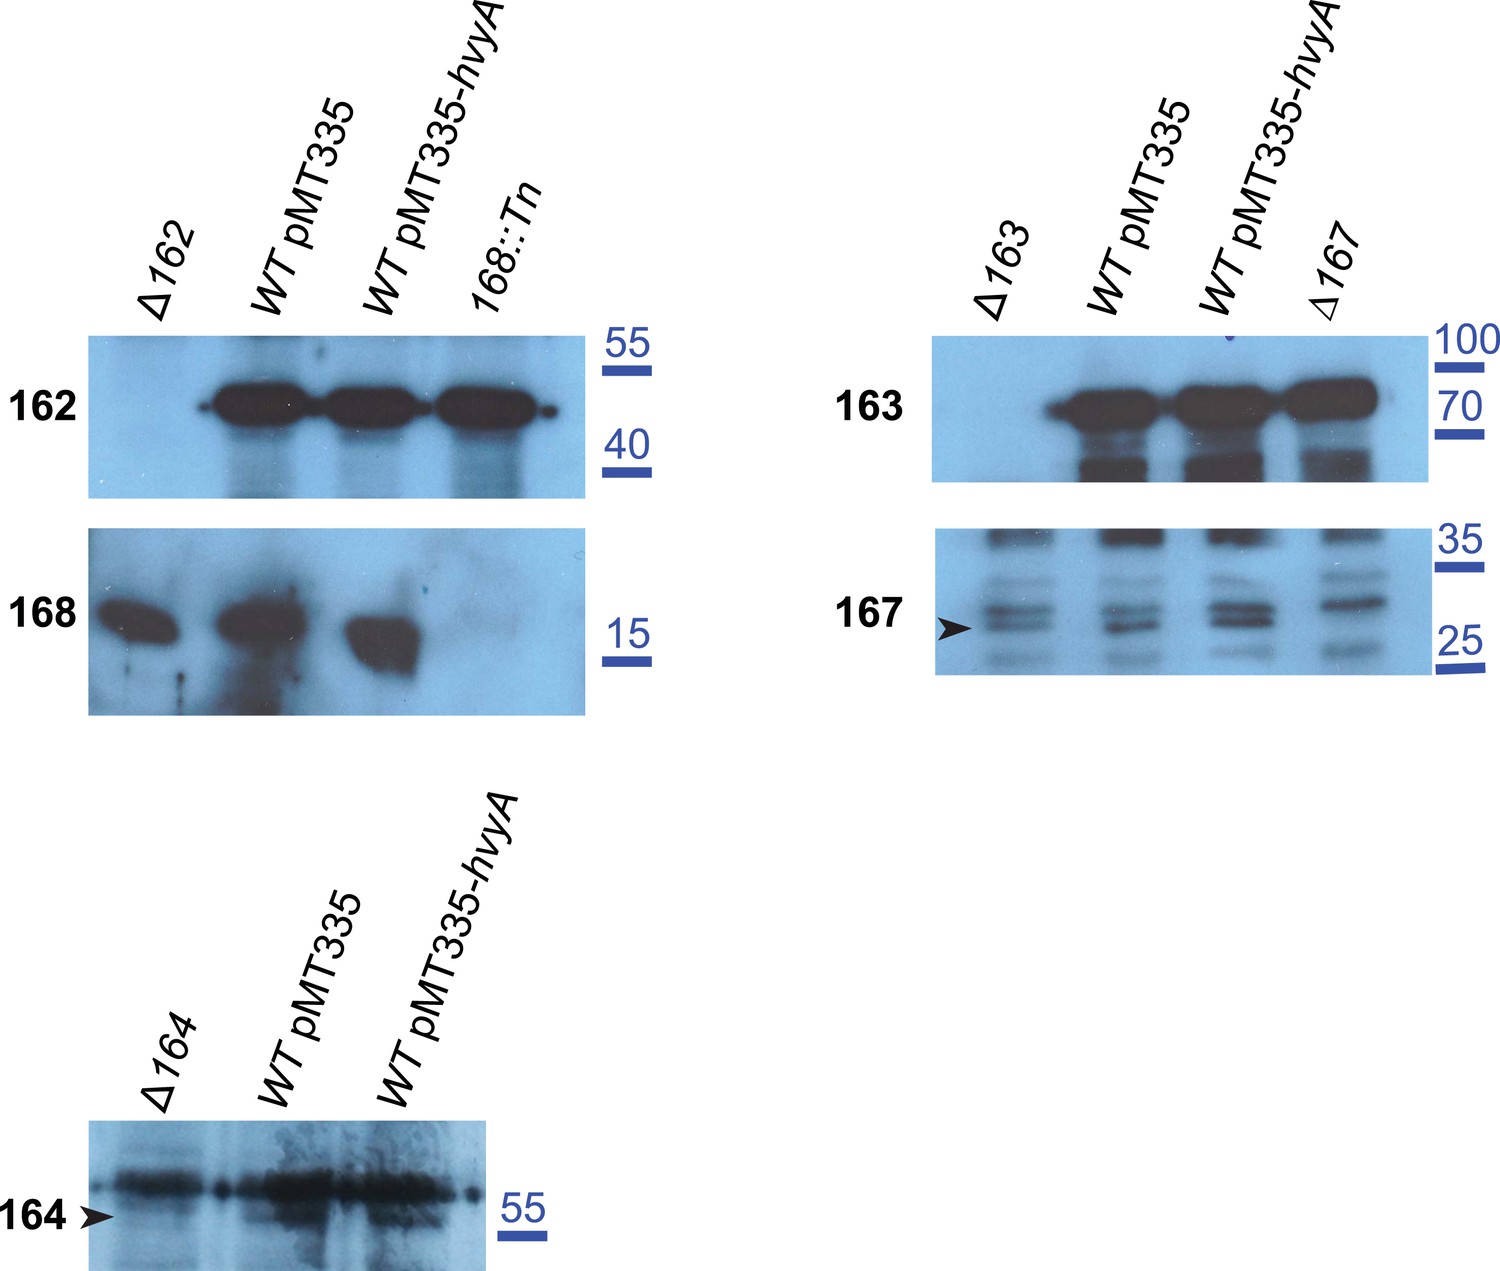
Over-expression of hvyA does not alter the levels of capsule polymerization/export components.
Immunoblots showing that the abundance and migration of capsule polymerization/export components is not affected by over-expression of hvyA. CCNA_00162, CCNA_00168, CCNA_00163, CCNA_00167 and CCNA_00164 are equally present in WT cells harbouring the empty vector (pMT335) or Pvan-hvyA (pMT335-hvyA). Molecular size standards are indicated in blue on the right, with the corresponding values in kDa. CCNA_00167 and CCNA_00164 are indicated by the arrowhead on the left of the corresponding panels.
Figure 7 with 3 supplements
Transcriptional and translational regulation of hvyA depends on PleC-CtrA, SciP, and MucR1/2.
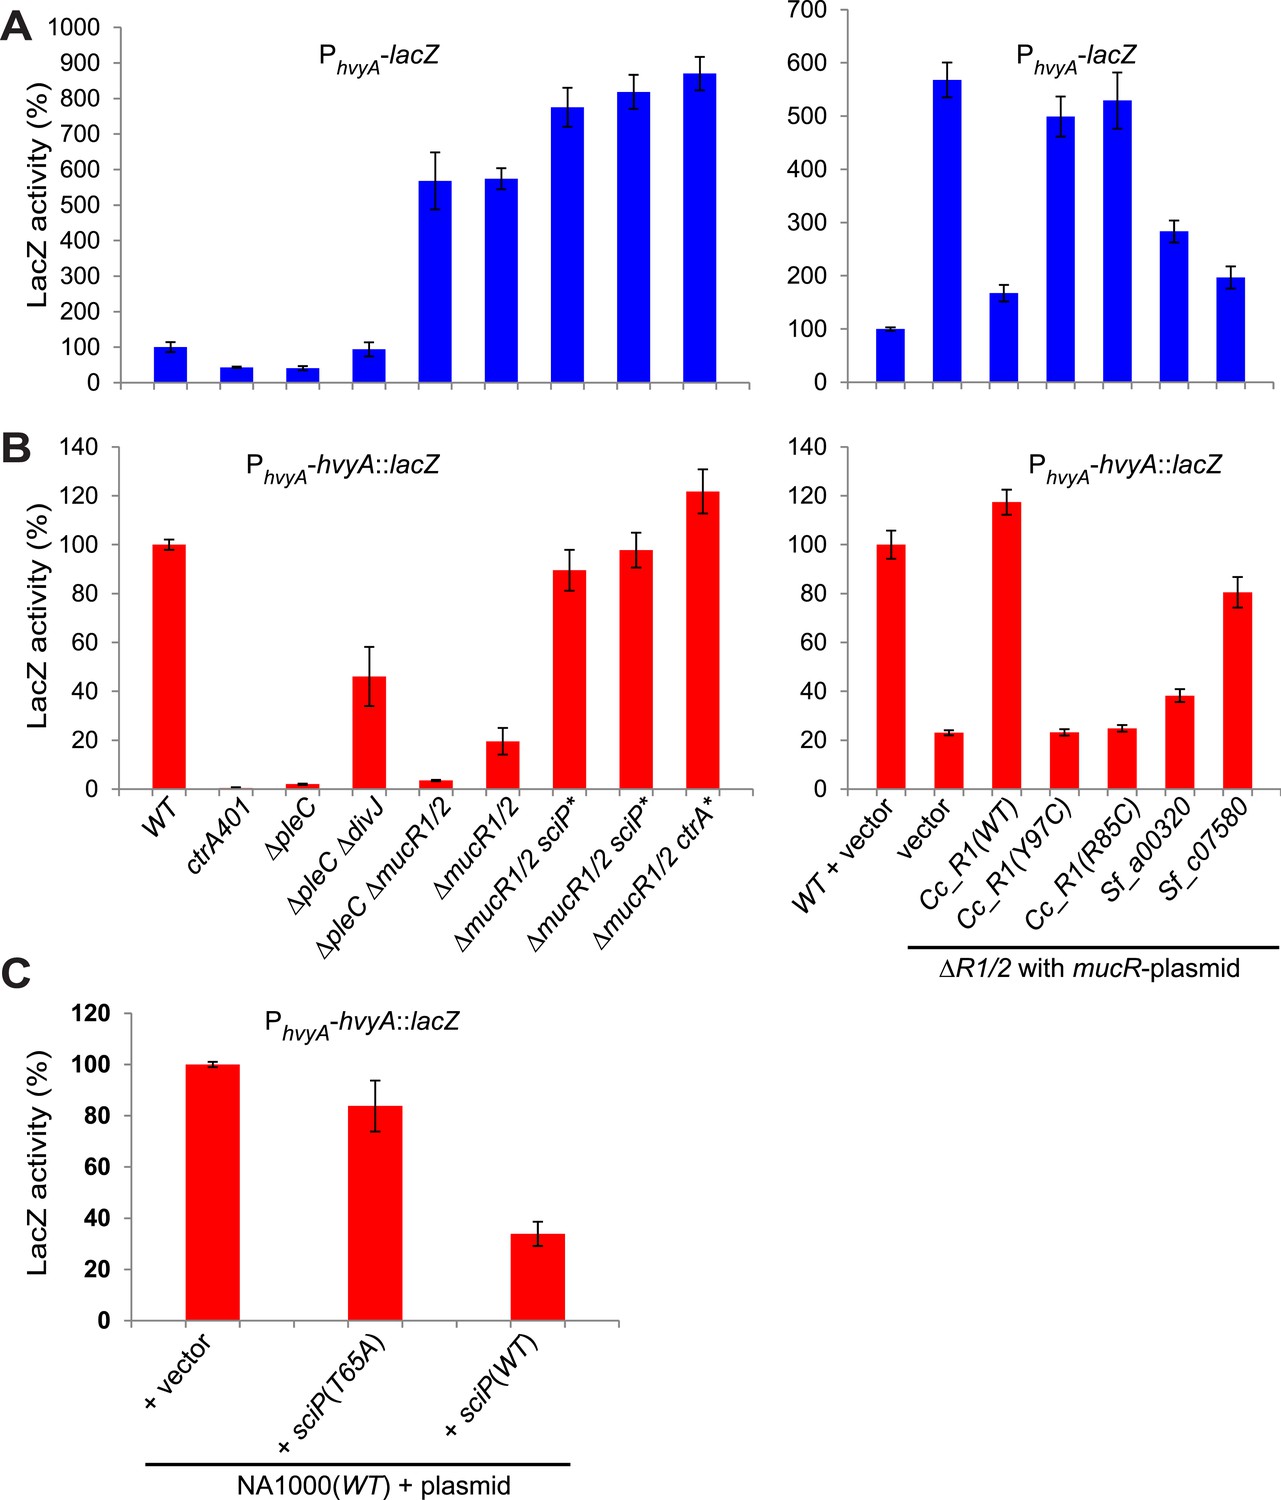
(A) Beta-galactosidase activity of PhvyA-lacZ transcriptional fusion. Left panel: transcription of hvyA is strongly reduced in ctrA401 (T170I, temperature sensitive) and ΔpleC strains compared to WT Caulobacter. Mutation of the kinase DivJ partially restores hvyA transcription in the ΔpleC ΔdivJ strain. Transcription from PhvyA-lacZ is significantly increased in the ΔmucR1/2 mutant. Right panel: beta-galactosidase activity of PhvyA-lacZ in ΔmucR1/2 cells complemented with Caulobacter mucR1 (CC_R1, WT or mutant derivatives Y97C and R85C) or the MucR paralogs from S. fredii NGR234 (Sf_a00320 and Sf_c07580) on plasmid under control of Pvan. Values are expressed as percentages (activity in WT NA1000 or WT carrying the empty vector set at 100%). (B) Beta-galactosidase activity of PhvyA-hvyA::lacZ translational fusion in the same strains shown in panel (A). Translation of hvyA is strongly reduced in cells expressing the ctrA401 allele and in the ΔpleC strain compared to WT Caulobacter. Mutation of DivJ partially restores hvyA translation in the ΔpleC ΔdivJ strain. PhvyA-hvyA::lacZ activity is also significantly decreased in the ΔmucR1/2 and ΔpleC ΔmucR1/2 mutants, consistently with the ‘light’ buoyancy of these strains. PhvyA-hvyA::lacZ activity is restored in the ΔmucR1/2 double mutant carrying ctrA(T170A), sciP(T24I), or sciP(T65A) alleles (ctrA* and sciP*). Values are expressed as percentages (activity in WT NA1000 or WT carrying the empty vector set at 100%). (C) Translational control of hvyA by CtrA and SciP. Beta-galactosidase activity of the PhvyA-hvyA::lacZ fusion in WT Caulobacter cells over-expressing sciP(T65A) or sciP(WT) from Pvan on plasmid. Whereas sciP(T65A) does not affect the activity of the translational PhvyA-hvyA::lacZ fusion, over-expression of sciP(WT) significantly decreases the activity of the fusion, consistently with the model presented in Figure 8. The activity is expressed as percentage of the activity in WT cells carrying the empty vector. Occupancy of CtrA, MucR1, and MucR2 at the hvyA promoter region as determined by ChIP-seq analysis is shown in Figure 7—figure supplement 1. The effect of the CtrA(D51E) allele on PhvyA-lacZ is shown in Figure 7—figure supplement 2. The ability of heterologous MucR to restore PhvyA-lacZ repression or PhvyA-hvyA::lacZ activity in Caulobacter ΔmucR1/2 is reported in Figure 7—figure supplement 3.
Figure 7—figure supplement 1
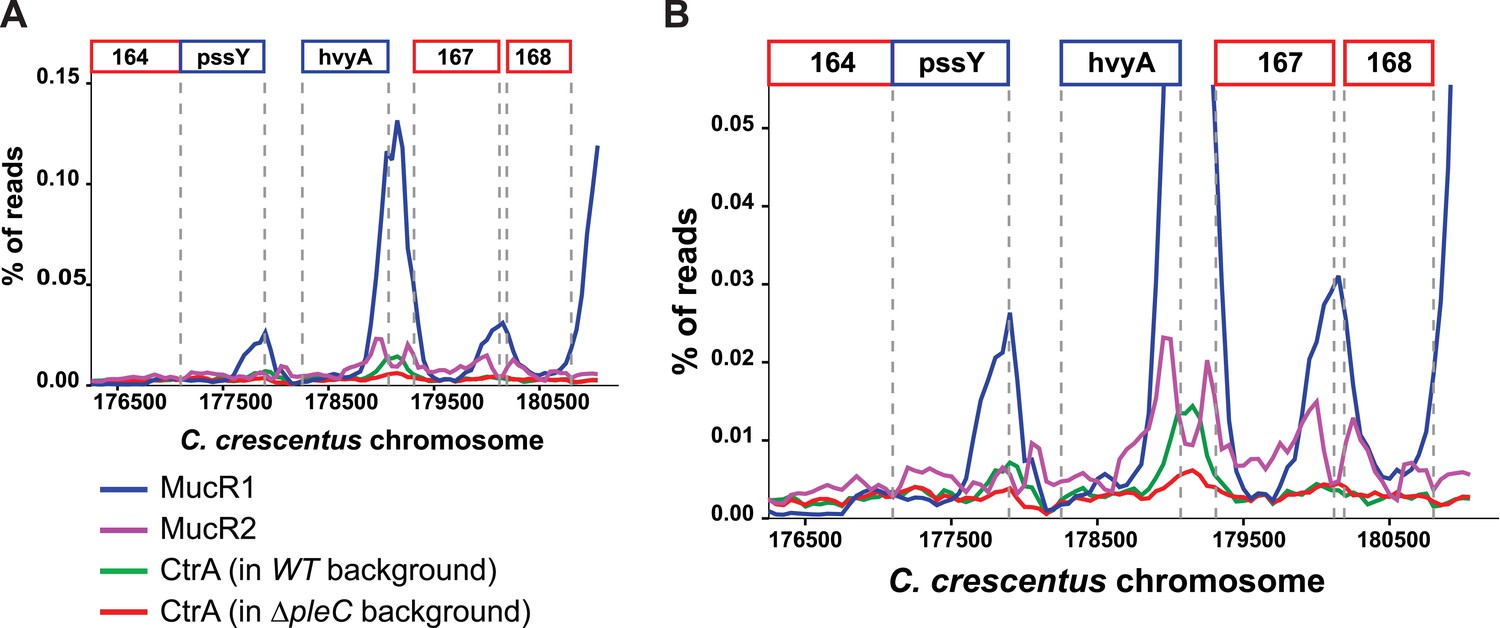
Occupancy at the hvyA promoter region as determined by ChIP-seq analysis.
(A) Traces show occupancy of MucR1 (in blue), MucR2 (in purple), CtrA in WT cells (in green), and CtrA in ΔpleC cells (in red). In the absence of PleC, the occupancy of the hvyA promoter by CtrA is significantly reduced. (B) Same as panel A, but at a higher magnification to show the CtrA and MucR2 peaks that are otherwise masked by the MucR1 peak.
Figure 7—figure supplement 2
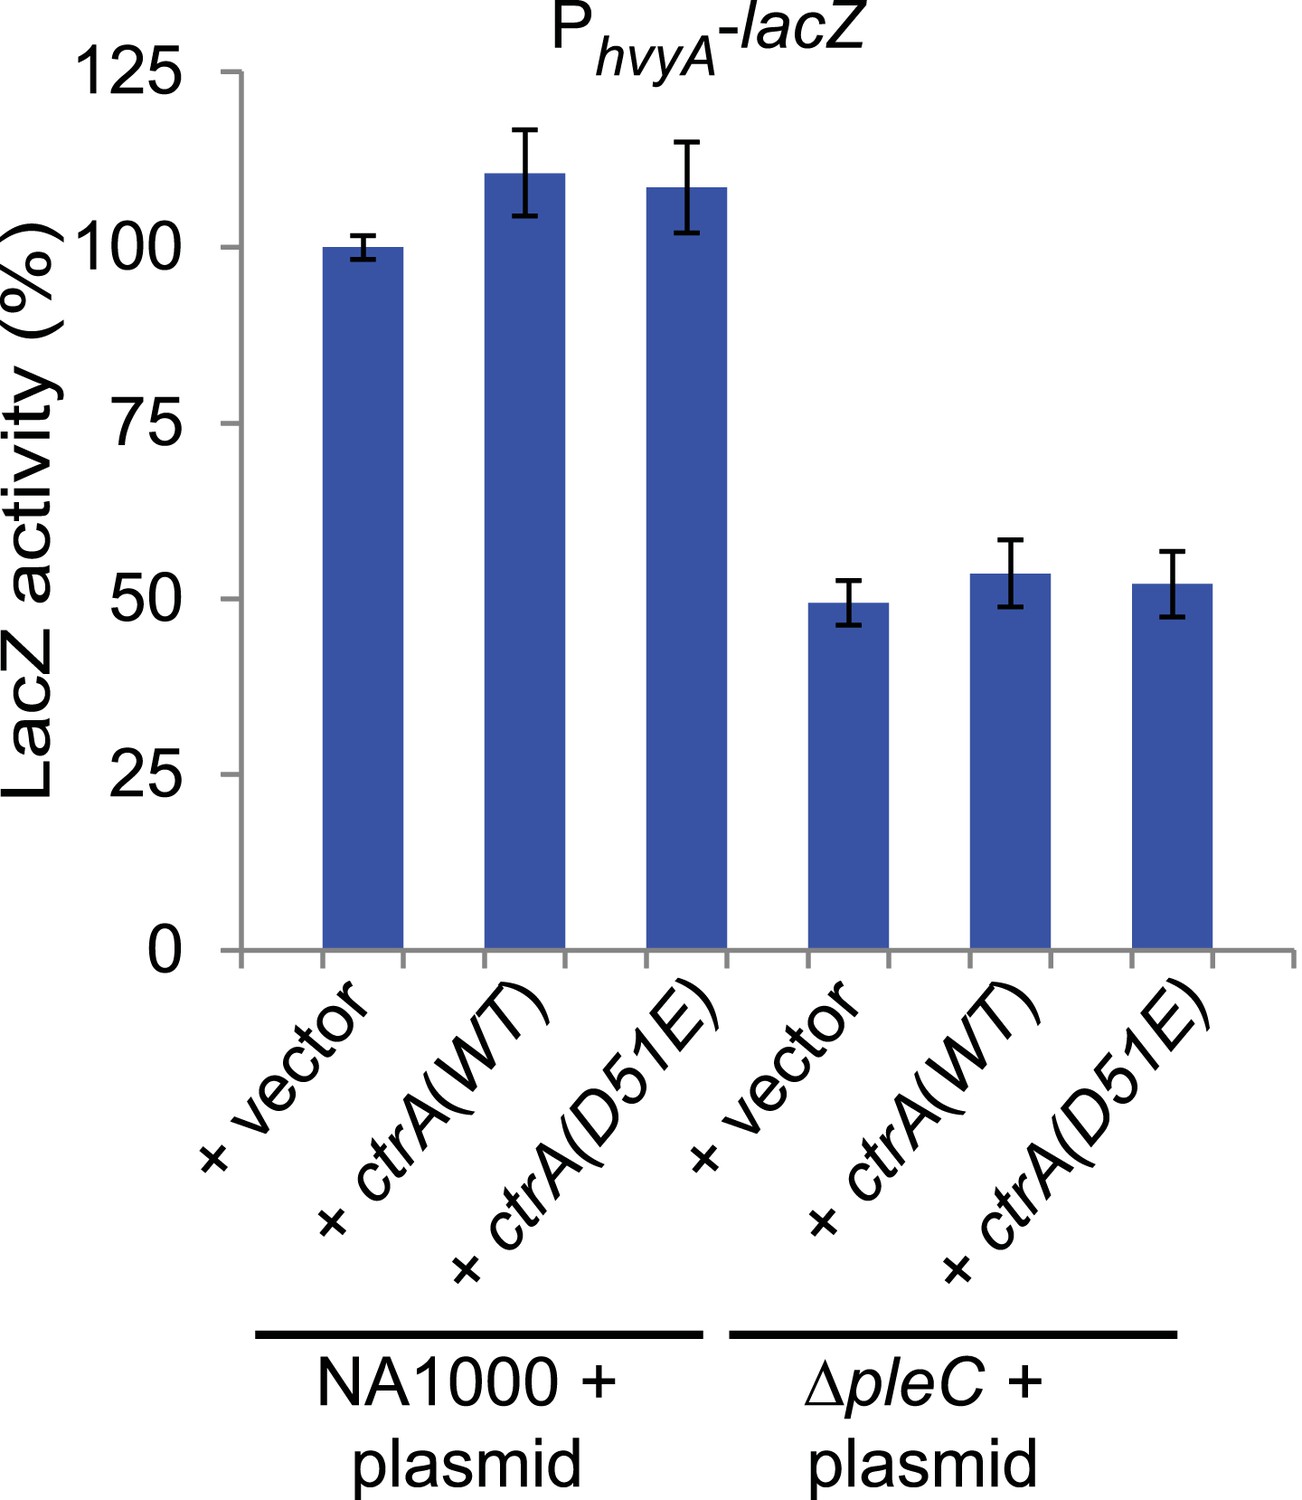
Transcriptional control of hvyA by PleC-CtrA.
Beta-galactosidase activity of the PhvyA-lacZ transcriptional fusion in WT and ΔpleC cells harbouring ctrA(WT) or the phosphomimetic ctrA(D51E) allele under control of Pvan on plasmid. The assay shows that the phosphomimetic ctrA(D51E) allele is unable to restore hvyA transcription in ΔpleC cells. The activity is expressed as percentage of the activity in WT cells carrying the empty vector.
Figure 7—figure supplement 3
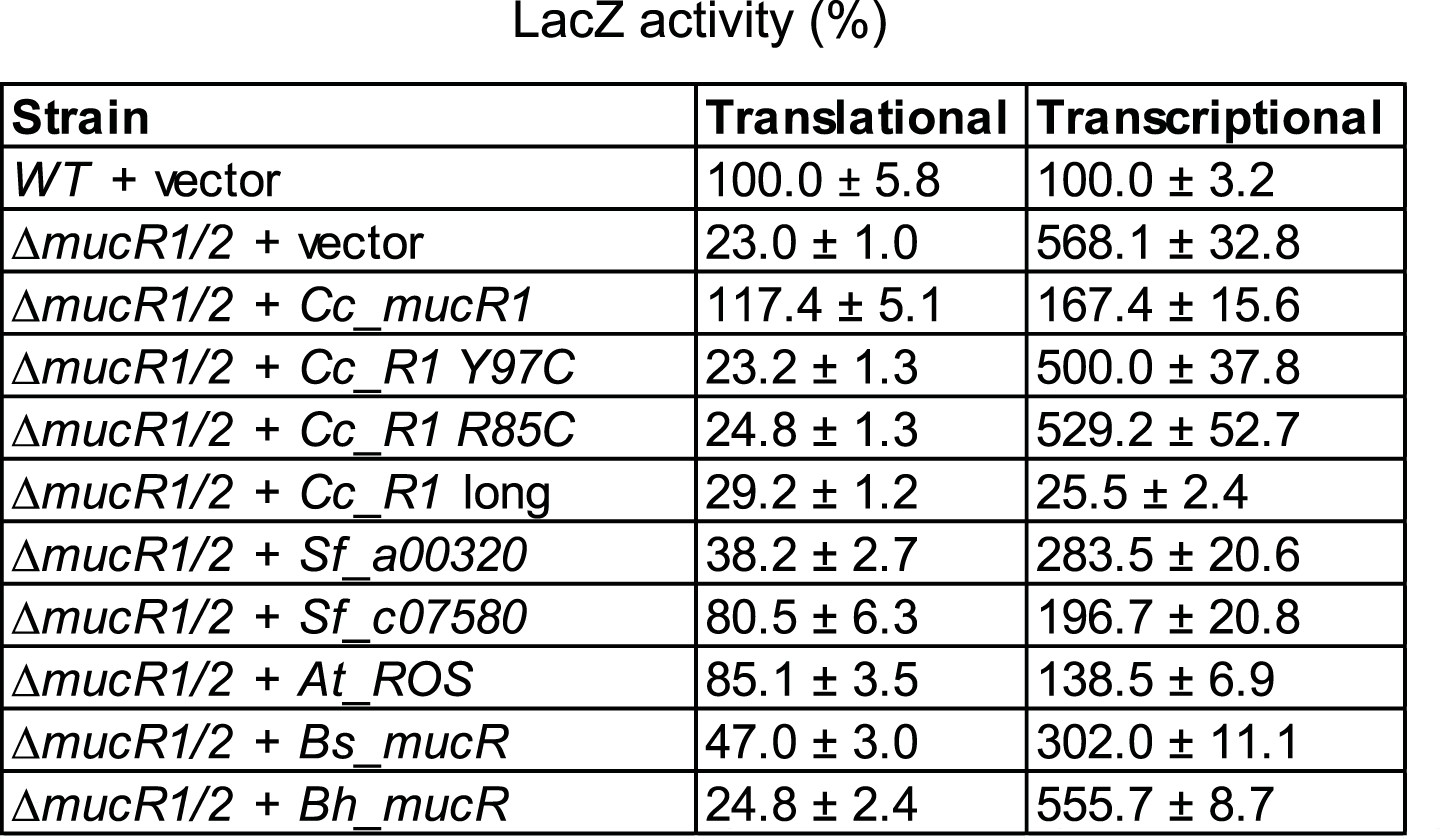
Transcriptional and translational control of hvyA by heterologous MucRs.
Beta-galactosidase activity of the PhvyA-lacZ (transcriptional) and PhvyA-hvyA::lacZ (translational) fusions in ΔmucR1/2 cells harbouring heterologous mucR genes under control of Pvan on plasmid. Cc_R1, Caulobacter mucR1 (WT or mutant alleles); Cc_R1 long, original annotation of Cc_R1 (CCNA_00982); Sf_a00320, S. fredii NGR_a00320; Sf_c07580, S. fredii NGR_c07580; At_ROS, A. tumefaciens mucR paralog; Bs_mucR, B. suis mucR paralog; Bh_mucR, B. henseleae mucR paralog. The assay shows that in the presence of a heterologous MucR increased translational activity of PhvyA-hvyA::lacZ is always accompanied with a commensurate repression of the transcriptional PhvyA-lacZ. The activity is expressed as percentage of the activity in WT cells carrying the empty vector.
Figure 8
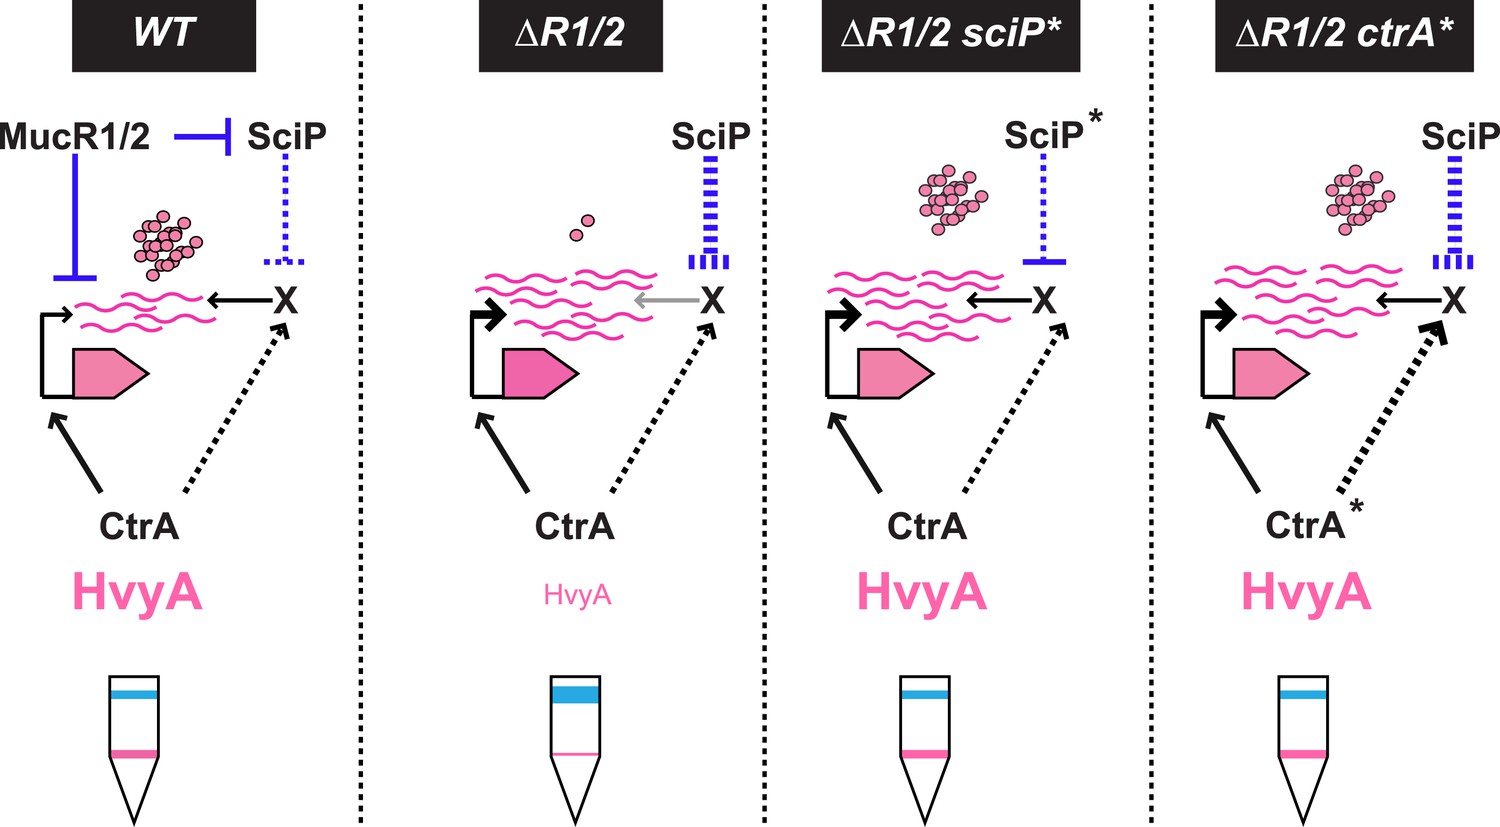
Model for regulation of HvyA synthesis and control of cell buoyancy/capsulation in Caulobacter.
In WT cells, hvyA transcription is activated by CtrA and repressed by MucR1/2, whereas translation is promoted by a (still unknown) factor (X, itself under control of CtrA and SciP like many late S phase genes). This tight regulation restricts HvyA synthesis to G1-phase, where HvyA prevents the encapsulation of the SW cell. In a ΔmucR1/2 mutant, SciP is over-produced, which lowers the levels of the translational regulator of hvyA and prevents HvyA protein accumulation, despite de-repression of hvyA transcription. The presence of the ctrA(T170A), sciP(T24I), or sciP(T65A) alleles (ctrA* or sciP*) restores the synthesis of the factor X in the ΔmucR1/2 mutant background, and therefore restores HvyA synthesis and WT buoyancy.
Figure 9
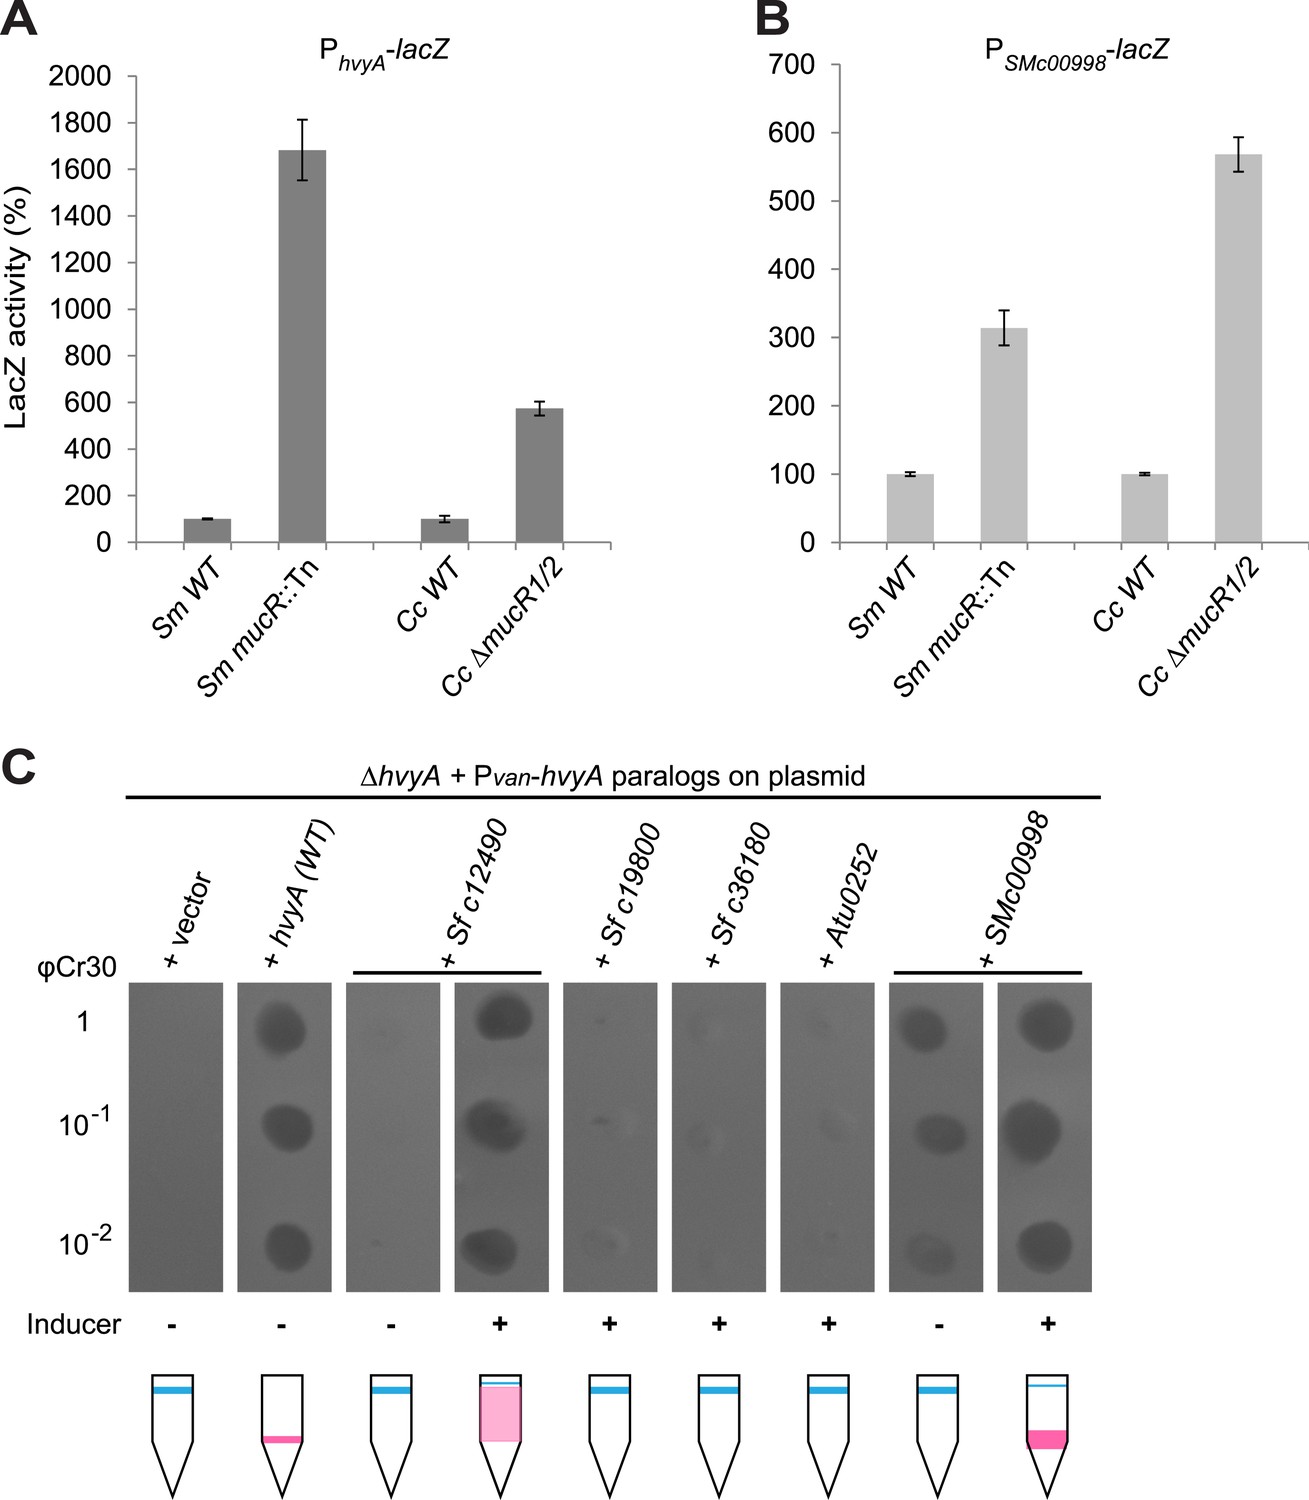
Conservation of hvyA transcriptional control and BTLCP function in alpha-proteobacteria.
(A) Beta-galactosidase activity of the PhvyA-lacZ transcriptional fusion in WT and ΔmucR1/2 cells compared to S. meliloti WT (Rm2011) and mucR mutant (mucR::Tn, Rm101). The assay shows that the transcriptional repression of PhvyA-lacZ by MucR is conserved in S. meliloti. The activity is expressed as the percentage of the activity in (Caulobacter or S. meliloti) WT cells. (B) Beta-galactosidase activity of the PSMc00998-lacZ transcriptional fusion in WT and ΔmucR1/2 cells compared to S. meliloti WT (Rm2011) and mucR mutant (mucR::Tn, Rm101). The assay shows that the HvyA paralog SMc00998 is also under transcriptional repression by MucR in both S. meliloti and Caulobacter. The activity is expressed as the percentage of the activity in (Caulobacter or S. meliloti) WT cells. (C) Sensitivity to φCr30 and buoyancy of C. crescentus ΔhvyA cells harbouring HvyA paralogs under control of Pvan on plasmid. Over-expression of NGR_c12490 or SMc00998 restores sensitivity to φCr30 and (partially) cell buoyancy, whereas NGR_c19800, NGR_c36180, or the A. tumefaciens paralog (Atu0252) are unable to complement the ΔhvyA mutation.
Figure 10 with 1 supplement

Inactivation of HvyA and ectopic presence of capsule protect cells from phage infection.
(A) Tn insertion bias in coding sequences (CDS) of NA1000 + φCr30 relative to WT cells as determined by Tn-seq. Peaks show CDSs with the highest number of Tn insertions. CCNA_01057 is part of the S-layer locus and is required for S-layer assembly. CDSs with an insertion ratio higher than 50 are indicated (CCNA_00497, putative rhamnosyl transferase; CCNA_01199, putative glucose-1-P thymidylyltransferase; CCNA_03316, putative UDP-N-acetylglucosamine-4,6-dehydratase; CCNA_03744, putative dTDP-glucose-4,6-dehydratase). Non-coding sequences are not included. (B) Model showing how capsule can interfere with φCr30 infection. In WT NA1000, φCr30 can infect SW cells, whereas ST cells are protected by the capsule (in blue) that masks the S-layer (φCr30 receptor). In a ΔhvyA mutant, both cell types (SW and ST) are capsulated, which significantly reduces the ability of φCr30 to infect these cells. Conversely, in a capsule-less mutant (for example ΔhvyA CCNA_00163::Tn, like the mutants isolated in our buoyancy screen for ‘heavy’ cells), both cells types (SW and ST) can be infected by φCr30. Tn insertion bias in coding sequences (CDS) of NA1000 cells relative to NA1000 + φCr30 as determined by Tn-seq is shown in Figure 10—figure supplement 1.
-
Figure 10—source data 1
(xlsx) contains the insertion ratios obtained for the Tn-Seq experiment (column F was used to create Figure 10A and column G Figure 10—figure supplement 1).
- https://doi.org/10.7554/eLife.03587.026
Figure 10—figure supplement 1
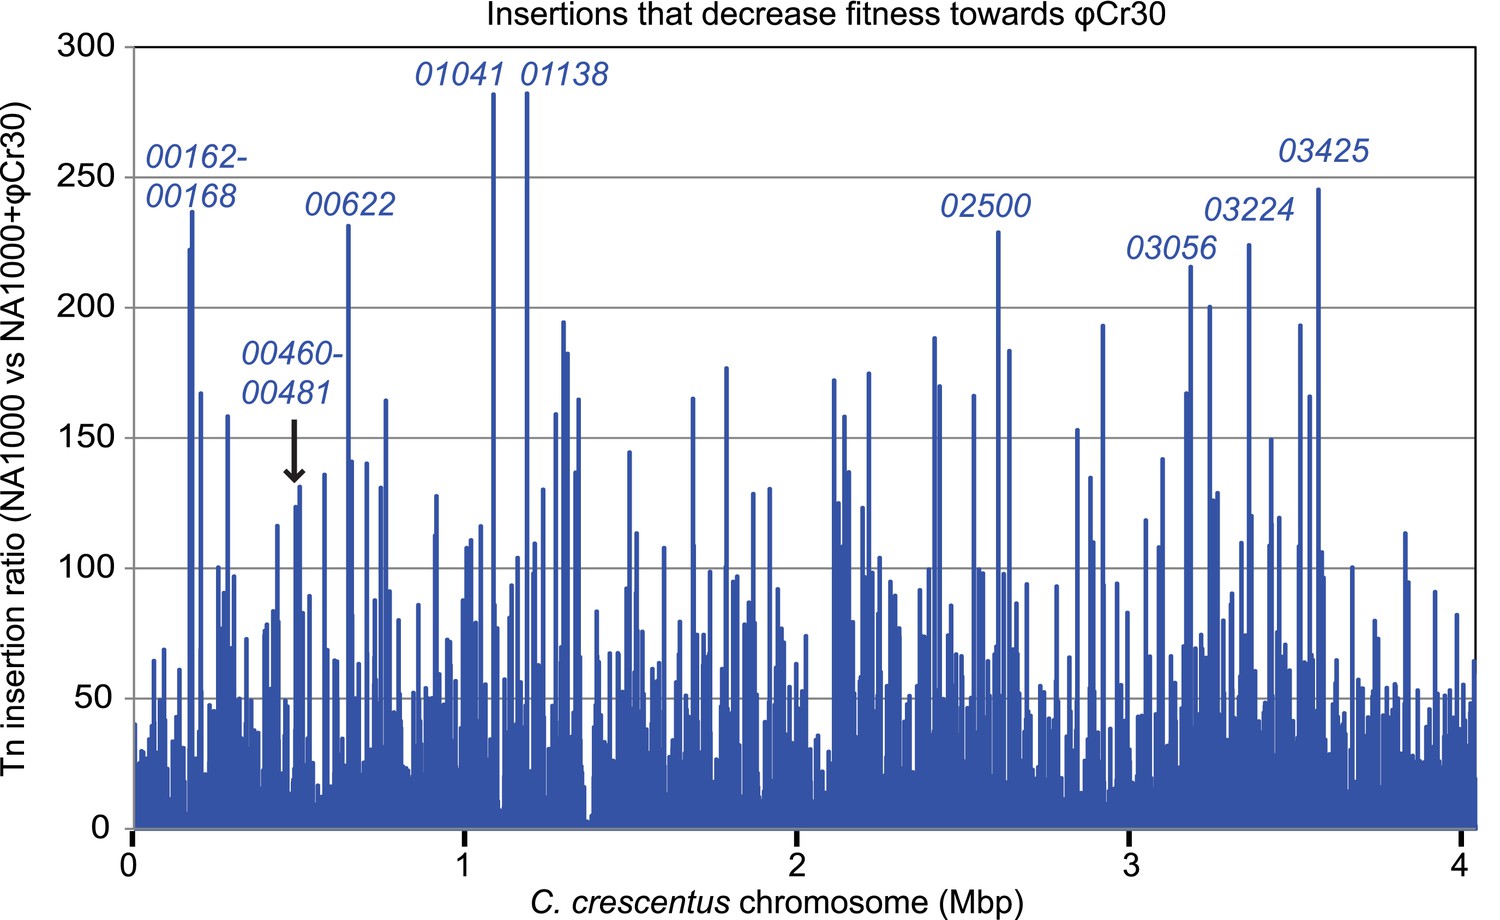
Inactivation of capsule synthesis/export genes decreases Caulobacter fitness towards φCr30.
Tn insertion bias in coding sequences (CDS) of WT cells relative to NA1000 + φCr30 as determined by Tn-seq. Peaks indicate CDSs that received fewest insertions in NA1000 + φCr30 relative to untreated WT cells. The two loci that we identified as required for capsule biosynthesis/export are indicated (CCNA_00162-CCNA_00168, and CCNA_00460-CCNA_00481).
Tables
Table 1
Glycosyl composition of per-O-trimethylsilyl (TMS) derivatives of methyl glycosides performed on purified capsular polysaccharides from WT Caulobacter (NA1000), the single mutants ΔCCNA_00166 (ΔhvyA) and ΔCCNA_00163 and the ΔhvyA ΔCCNA_00163 double mutant
| NA1000 | ΔhvyA | ΔCCNA_00163 | ΔhvyA ΔCCNA_00163 | |||||
|---|---|---|---|---|---|---|---|---|
| Glycosyl residue | Mass (μg) | Weight (%) | Mass (μg) | Weight (%) | Mass (μg) | Weight (%) | Mass (μg) | Weight (%) |
| Ribose | 0.8 | 0.4 | 0.1 | 0.1 | 0.3 | 0.3 | 0.5 | 0.8 |
| Rhamnose | 2.3 | 1.2 | 1.1 | 0.6 | 6.4 | 6.2 | 2.7 | 4.3 |
| Fucose | 19.8 | 10.3 | 26.5 | 14.7 | 0.0 | 0.0 | 0.2 | 0.4 |
| Xylose | 0.0 | 0.0 | 0.1 | 0.1 | 0.0 | 0.0 | 0.0 | 0.0 |
| Glucuronic Acid | 0.0 | 0.0 | 0.0 | 0.0 | 0.8 | 0.8 | 0.3 | 0.5 |
| Galacturonic acid | 28.4 | 14.9 | 32.6 | 18.1 | 5.6 | 5.4 | 2.3 | 3.7 |
| Mannose | 23.2 | 12.1 | 26.6 | 14.8 | 3.9 | 3.8 | 1.7 | 2.7 |
| Galactose | 30.1 | 15.7 | 37.0 | 20.6 | 1.4 | 1.4 | 0.5 | 0.9 |
| Glucose | 64.3 | 33.6 | 52.9 | 29.4 | 49.9 | 48.5 | 23.7 | 38.3 |
| N-Acetyl galactosamine | 2.0 | 1.1 | 0.0 | 0.0 | 2.3 | 2.2 | 1.0 | 1.7 |
| N-Acetyl glucosamine | 16.0 | 8.4 | 3.0 | 1.6 | 29.5 | 28.7 | 27.9 | 45.2 |
| N-Acetyl mannosamine | 4.1 | 2.2 | 0.0 | 0.0 | 2.2 | 2.1 | 0.7 | 1.2 |
| Σ= | 191.3 | 179.9 | 102.8 | 61.8 | ||||
-
Mass is expressed in μg and weight % is relative to the total carbohydrate.
Table 2
Transduction frequencies of φCr30 lysates in different Caulobacter strains
| Strain | hvyA::pSA480 | CCNA_01524::Tn |
|---|---|---|
| NA1000 (WT) | 344 | ∼750 |
| ΔpleC | 64 | 165 |
| ΔhvyA | 48 | 162 |
| ΔCCNA_00163 | 522 | ≥1000 |
| ΔpleC ΔCCNA_00163 | 527 | ≥1000 |
| ΔhvyA ΔCCNA_00163 | 487 | ≥1000 |
-
For transduction, cells were normalised according to the OD600 and infected with the same amount of φCr30; two different markers were transduced, a pGS18T derivative integrated at the hvyA locus (pSA480) and a himar1 insertion in CCNA_01524 (flagellar modification gene, unrelated to cellular buoyancy or capsule production). The number of colonies counted after 3 days of incubation at 30°C is reported. The experiment was repeated twice.
Additional files
-
Supplementary file 1
Phenotypes of WT Caulobacter and mutant strains.
- https://doi.org/10.7554/eLife.03587.029
-
Supplementary file 2
Nucleotide position of himar1 insertions.
- https://doi.org/10.7554/eLife.03587.030
-
Supplementary file 3
Strains used in this study.
- https://doi.org/10.7554/eLife.03587.031
-
Supplementary file 4
Plasmids used in this study.
- https://doi.org/10.7554/eLife.03587.032
-
Supplementary file 5
Oligonucleotides used in this study.
- https://doi.org/10.7554/eLife.03587.033
-
Supplementary file 6
Global Tn-insertion values for the Tn-Seq experiment.
- https://doi.org/10.7554/eLife.03587.034
Download links
A two-part list of links to download the article, or parts of the article, in various formats.
Downloads (link to download the article as PDF)
Open citations (links to open the citations from this article in various online reference manager services)
Cite this article (links to download the citations from this article in formats compatible with various reference manager tools)
Cell cycle constraints on capsulation and bacteriophage susceptibility
eLife 3:e03587.
https://doi.org/10.7554/eLife.03587


