Gamma delta T cells recognize haptens and mount a hapten-specific response
- Stanford University, United States
Figures
Figure 1 with 2 supplements
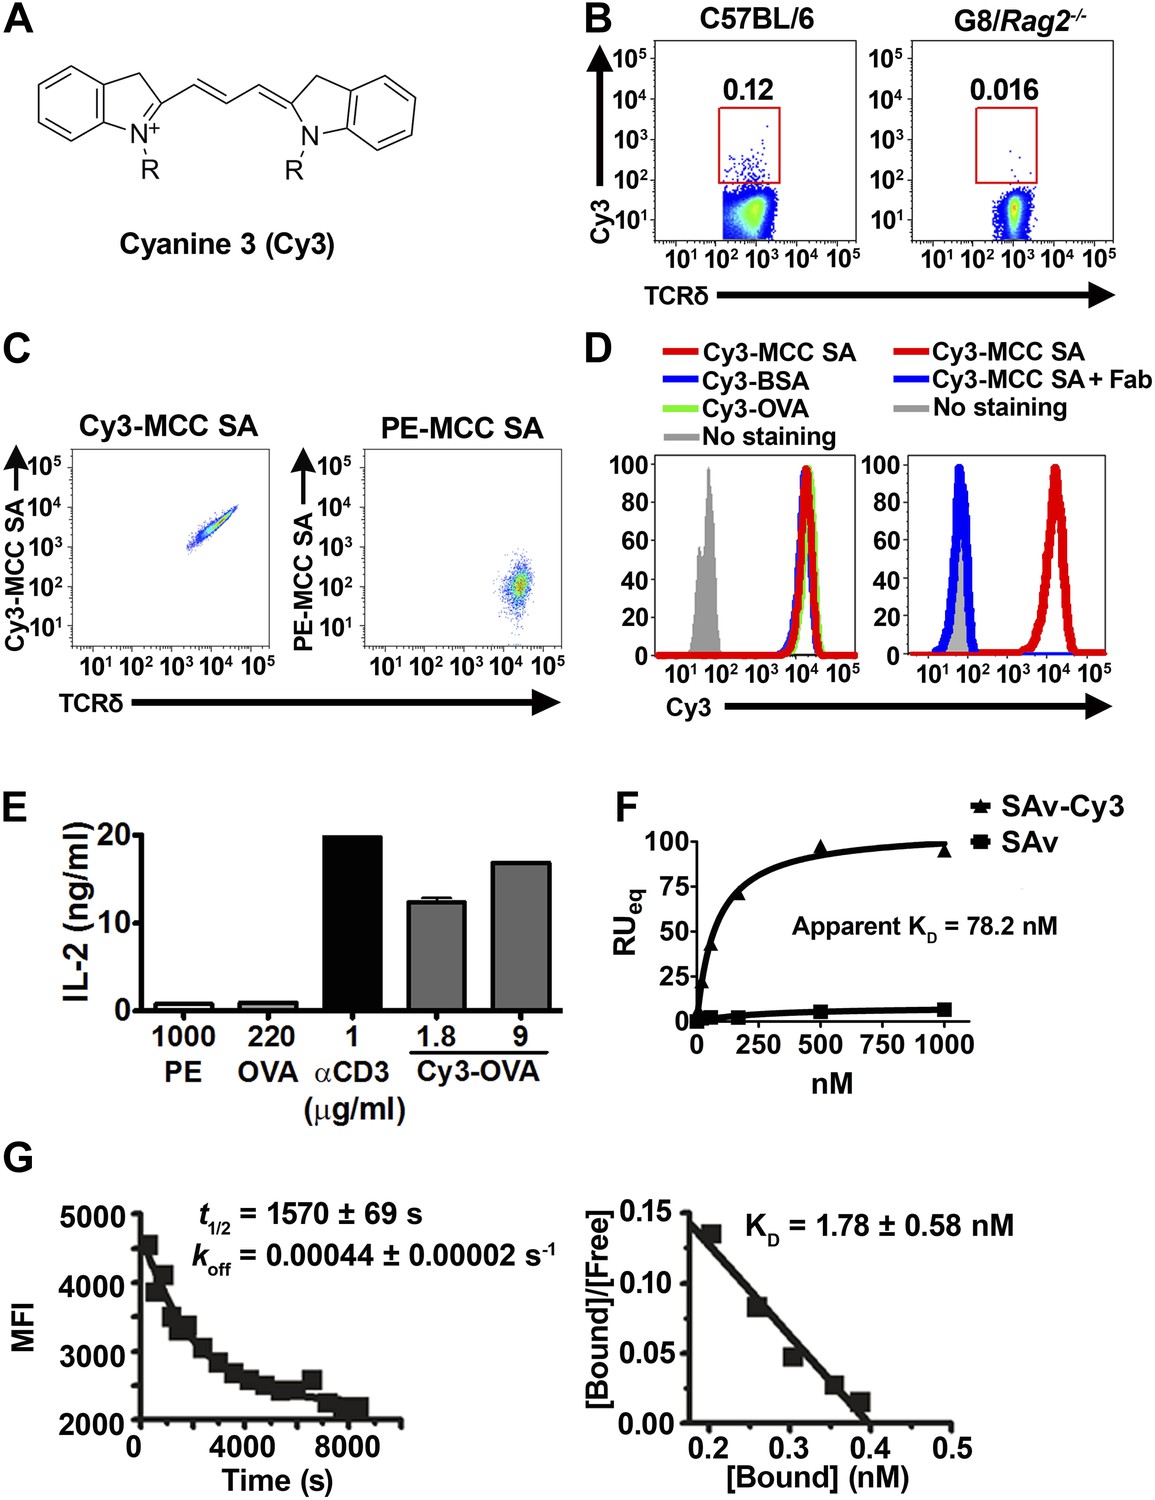
Cy3 is a γδ T cell antigen.
(A) Chemical structure of Cyanine 3 (Cy3). FACS analysis of (B) Cy3 tetramer (Cy34-SAv) staining of splenic γδ T cells in the presence of 10-fold molar excess of moth cytochrome c peptide coupled SAv (MCC4-SAv); (C) NX6/58α-β- cells stained with Cy3-MCC-SAv or PE-MCC-SAv; (D) NX6/58α-β- cells stained with Cy3-MCC-SAv in the absence (left), or presence of anti-Cy3 Fab (right). (E) IL-2 production by NX6/58α-β- cells activated by the indicated amount of plate-bound Cy3-OVA, OVA, PE, anti-CD3 for 16 hr. (F) The saturating binding curves of Cy34-SAv and un-conjugated SAv to a soluble form of NX6 as determined by surface plasmon resonance. No detectable binding was observed for 1 mM applications of PE or BSA (not shown). (G) Kinetics of Cy34SAv binding to NX6/58α-β- cells. t1/2 was determined using real time flow cytometry in the presence of anti-Cy3 antibody Fab fragments (left). KD was determined from Scatchard analysis (right). All results are representative of at least three independent experiments.
Figure 1—figure supplement 1
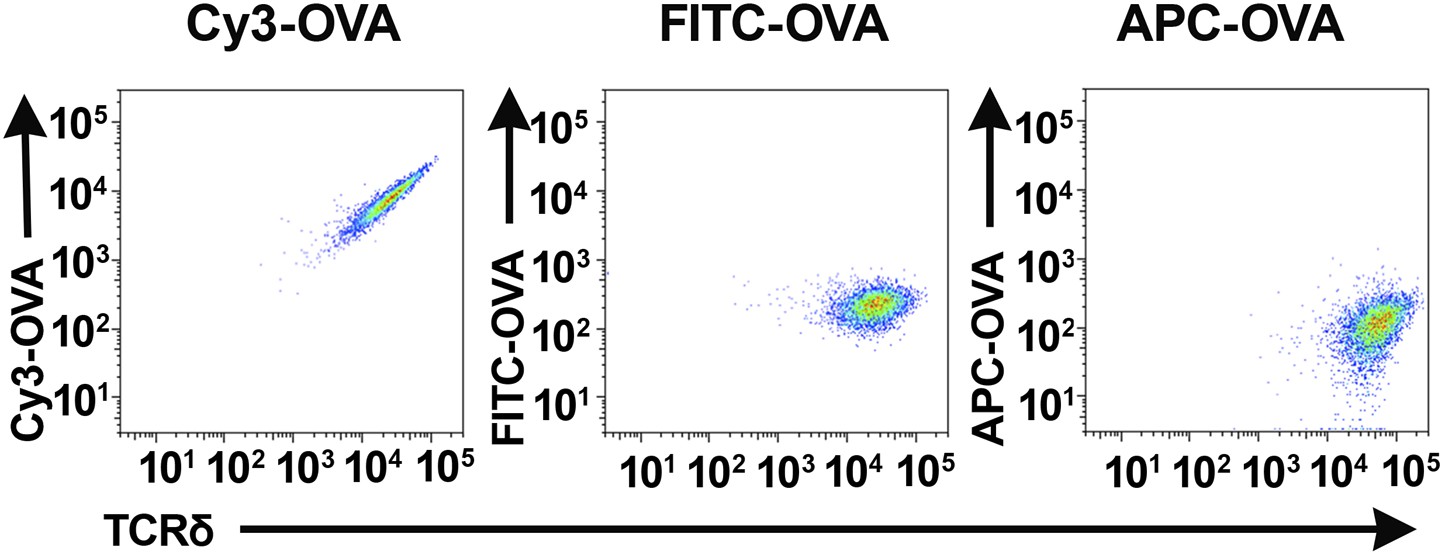
NX6/58α-β- cells stained with different fluorescently labeled ovalbumin preparations.
Flow cytometry analysis of NX6/58α-β− cells stained with Cy3- OVA, FITC-OVA and APC-OVA.
Figure 1—figure supplement 2
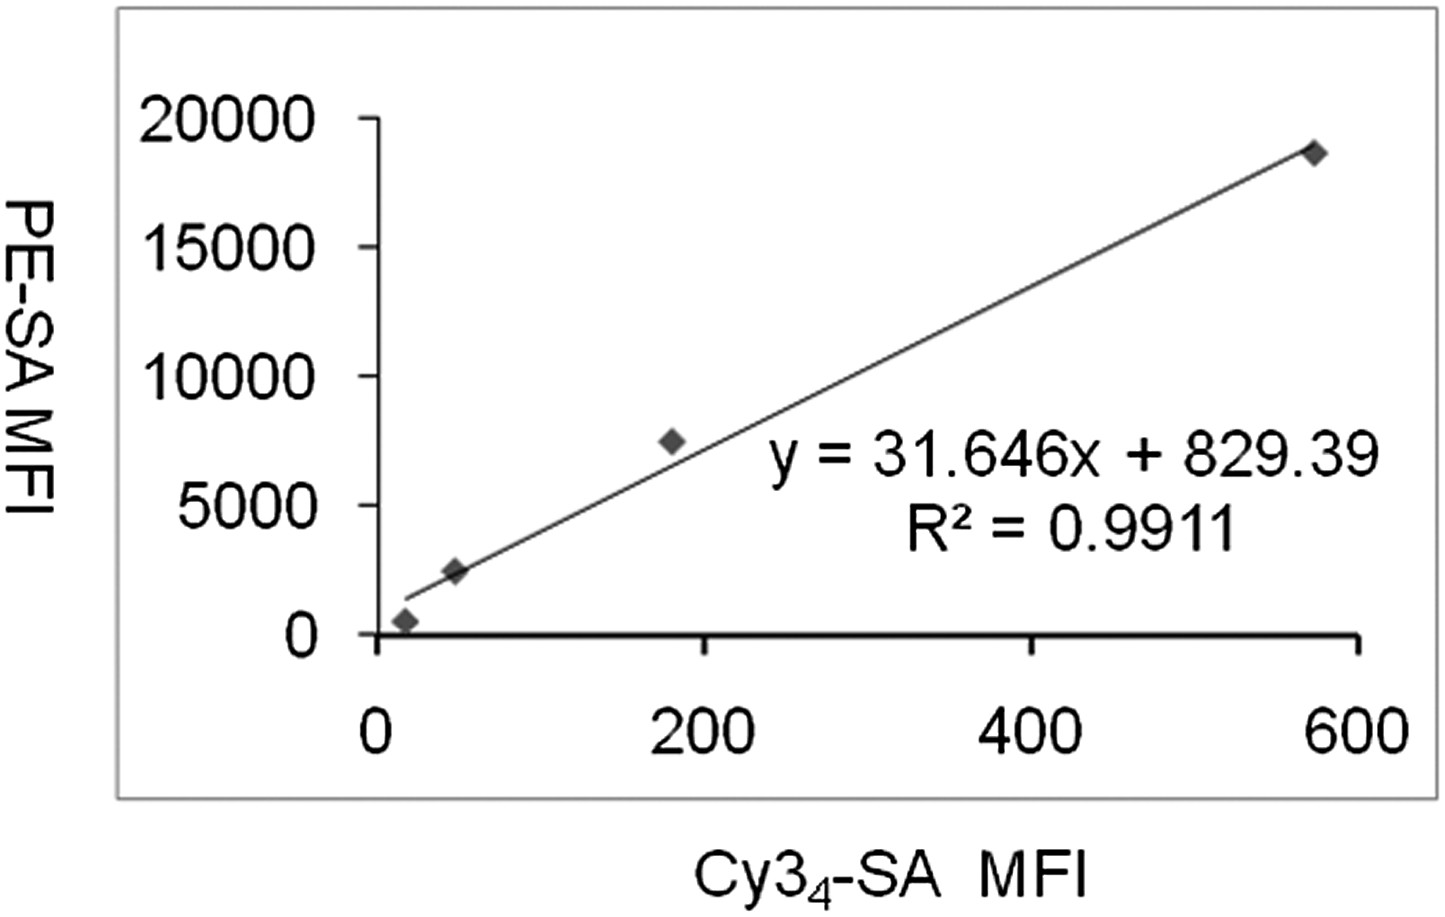
Correlation between the mean fluorescence intensities of PE-SAv and Cy34SAv on red blood cells.
https://doi.org/10.7554/eLife.03609.005
Figure 2
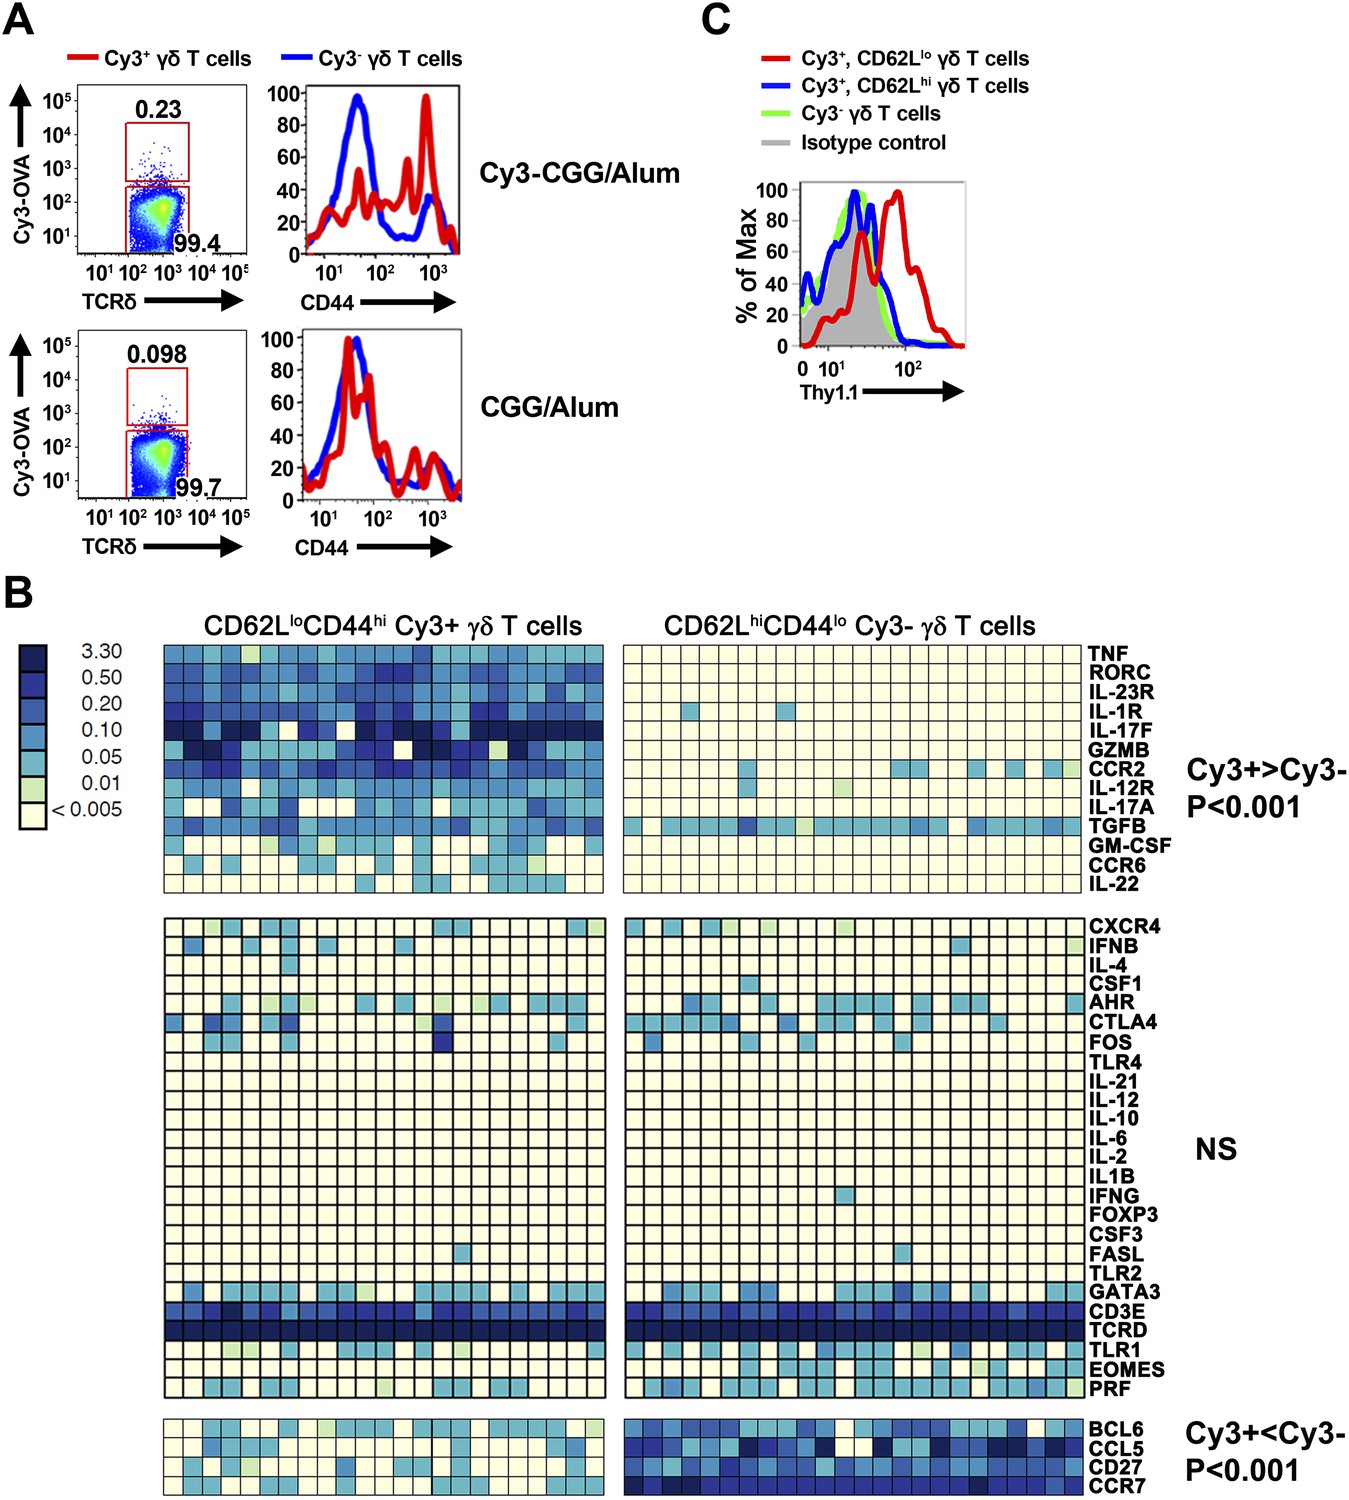
Cy3-specific γδ T cell response after immunization.
(A) CD44 expression on Cy3-OVA+ (red) and Cy3-OVA− γδ T cells in the draining lymph nodes of mice immunized with Cy3-CGG-alum or CGG-alum 24 hr prior. (B) BioMark analysis of CD62LloCD44hi Cy3+ and CD62LhiCD44lo Cy3− γδ T cells isolated from the draining lymph nodes of C57BL/6 mice immunized with Cy3-CGG 60 hr prior (5 cells/sample). The heatmap, where rows are individual genes and columns are individual samples, indicates the expression or non-expression of a gene/sample pair (relative to the β2m expression). Upper panel shows genes expressing higher (p < 0.001) in Cy3+ cells than that in Cy3− cells. Middle panel shows non-varying genes. Bottom panel shows genes expressing lower (p < 0.001) in Cy3+ cells than that in Cy3− cells. (C) Thy1.1 expression on γδ T cells from IL-17fThy1.1/Thy1.1 mice immunized with Cy3-CGG-alum 60 hr prior, representative of three independent experiments.
Figure 3
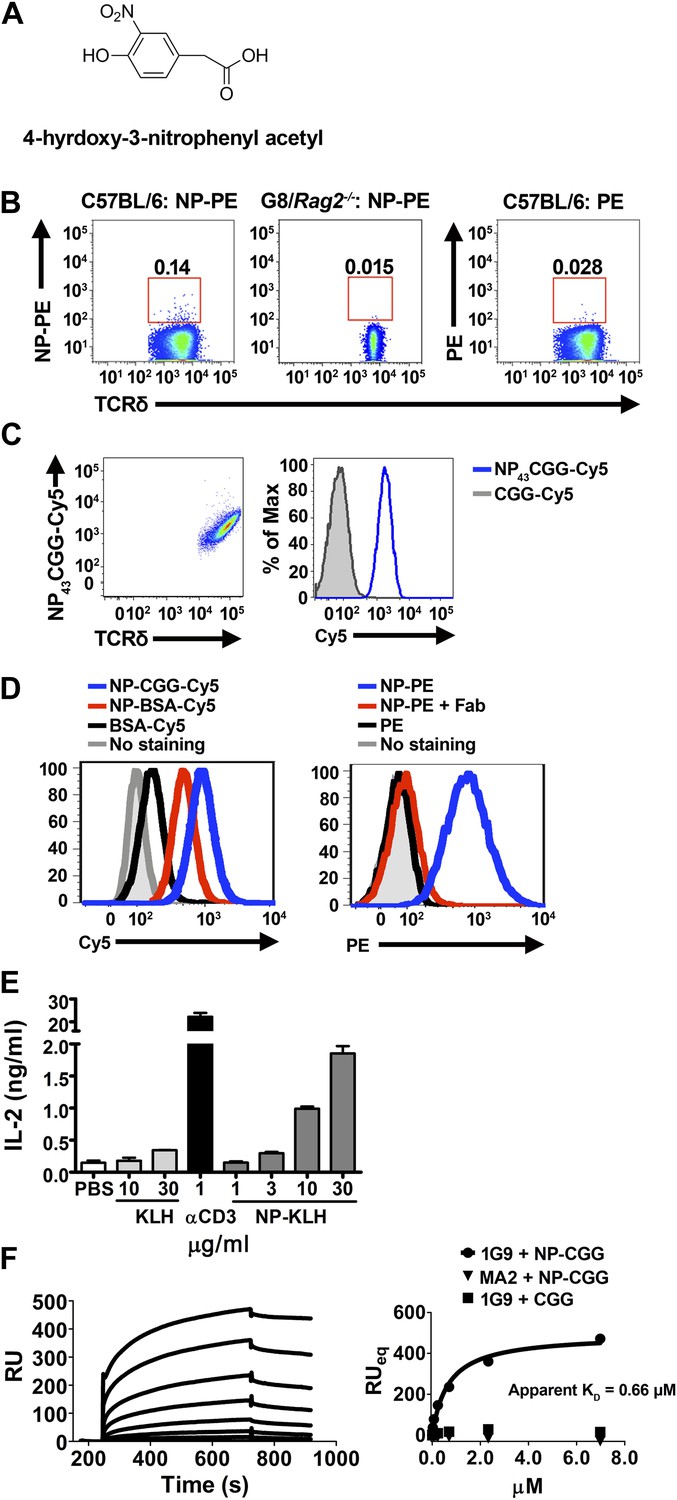
NP is a γδ T cell antigen.
(A) Chemical structure of 4-hydroxy-3-nitrophenyl acetyl (NP). Flow cytometry analysis of (B) NP67-PE staining of γδ T cells from C57BL/6 or G8/Rag2−/− mouse splenocytes and PE staining of γδ T cells from B6 splenocytes; (C) staining of 58α-β- cells expressing an NP-specific γδ TCR, 1G9, with NP43-CGG-Cy5 or CGG-Cy5, showing staining in relation to γδ TCR expression (left) or as a histogram (right); (D) staining of 58α-β- cells expressing an NP-specific γδ TCR, 1E3, with NP43-CGG-Cy5, NP26-BSA-Cy5, or BSA-Cy5 (left) and NP67-PE alone, NP67-PE with a 20-fold molar excess of anti-NP Fab, or PE (right). (E) IL-2 production by 1E3/58α-β- cells activated by the indicated amount of plate-bound NP25-KLH, KLH (light gray bars), or 0.1 μg/ml anti-CD3. (F) Sensorgram and steady state analysis of NP43-CGG (0–7 μM) binding to soluble 1G9 TCR measured by surface plasmon resonance. Apparent KD was determined by steady state analysis of SPR measurements (circles). Equal concentrations of un-modified CGG were tested (squares), as well as NP43-CGG with a PE-specific γδ TCR, MA2 (triangles).
Tables
Table 1
TCR sequences of Cy3 and NP-specific γδ TCRs
| Vδ | N | D1 | N | D2 | N | Jδ | Vγ | N | Jγ | ||||
|---|---|---|---|---|---|---|---|---|---|---|---|---|---|
| Cy3 | NX6 | Vδ8 | C A A S | A | T D K | Vγ1 | C A V W | S R | S G T S W V K | ||||
| C5 | Vδ6A | C A L W E L | G | G G I R | A S | D K | Vγ1 | C A V W | T R | G T S W V K | |||
| NP | 1G9 | Vδ4 | C A L M E R | R | G Y | R R D T | R A | D K | Vγ4 | C S Y G S | Y | S S G F H K | |
| 1E3 | Vδ6B | C A L S E L | G G | G G | S A | T D K | Vγ1 | C A V W | K K T | G T S W V K | |||
| 1B2 | Vδ4 | C A L M E R | V | G | L Y | R R D T | S L A | T D K | Vγ1 | C A V | F | S G T S W V K |
-
Each pair of γ and δ chain sequences were identified from a single Cy3 or NP-specific γδ T cell derived from mouse splenocytes and verified by their ability to confer NP- or Cy3-specific binding to 58α-β- cells expressing the TCR.
Additional files
-
Supplementary file 1
Primers used in this study.
- https://doi.org/10.7554/eLife.03609.009
Download links
A two-part list of links to download the article, or parts of the article, in various formats.
Downloads (link to download the article as PDF)
Open citations (links to open the citations from this article in various online reference manager services)
Cite this article (links to download the citations from this article in formats compatible with various reference manager tools)
Gamma delta T cells recognize haptens and mount a hapten-specific response
eLife 3:e03609.
https://doi.org/10.7554/eLife.03609


