Different types of theta rhythmicity are induced by social and fearful stimuli in a network associated with social memory
- University of Haifa, Israel
Figures
Figure 1
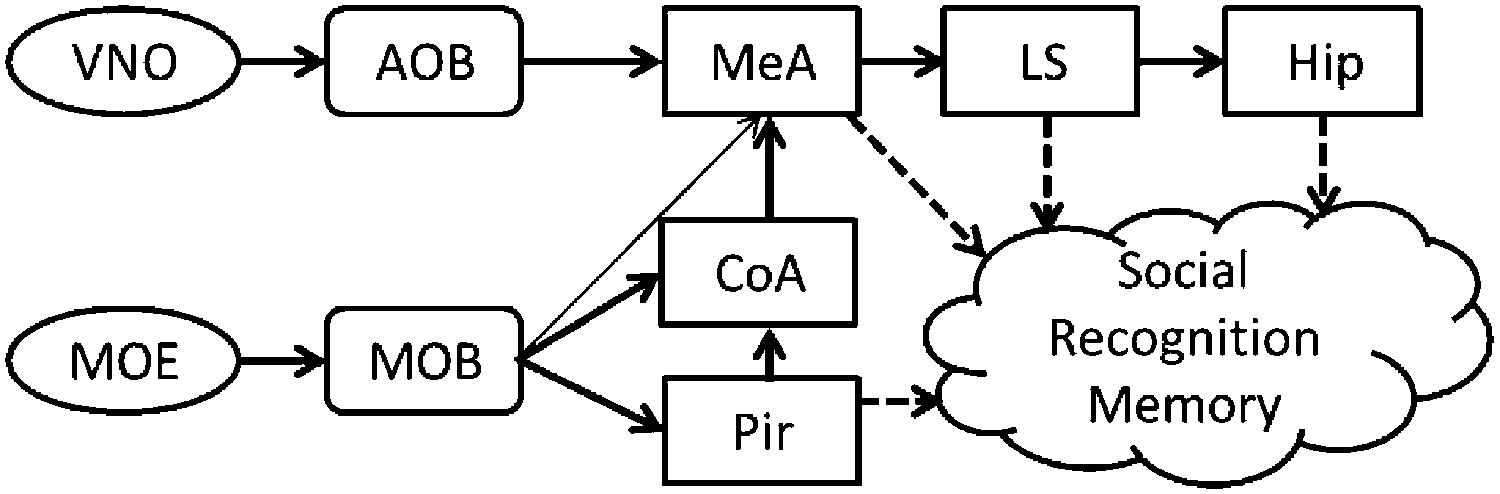
A simplistic scheme of sensory information flow in the network of brain regions thought to underlie social recognition memory.
Social olfactory cues are detected by sensory neurons in the main olfactory epithelium (MOE) and vomeronasal organ (VNO). These neurons project to the main (MOB) and accessory (AOB) olfactory bulbs, which transmit information, either directly or indirectly (via the cortical nucleus of the amygdala—CoA) to the medial amygdala (MeA). The MOB also innervates the piriform cortex (Pir). The MeA projects to the lateral septum (LS), which innervates the hippocampus (Hip).
Figure 2
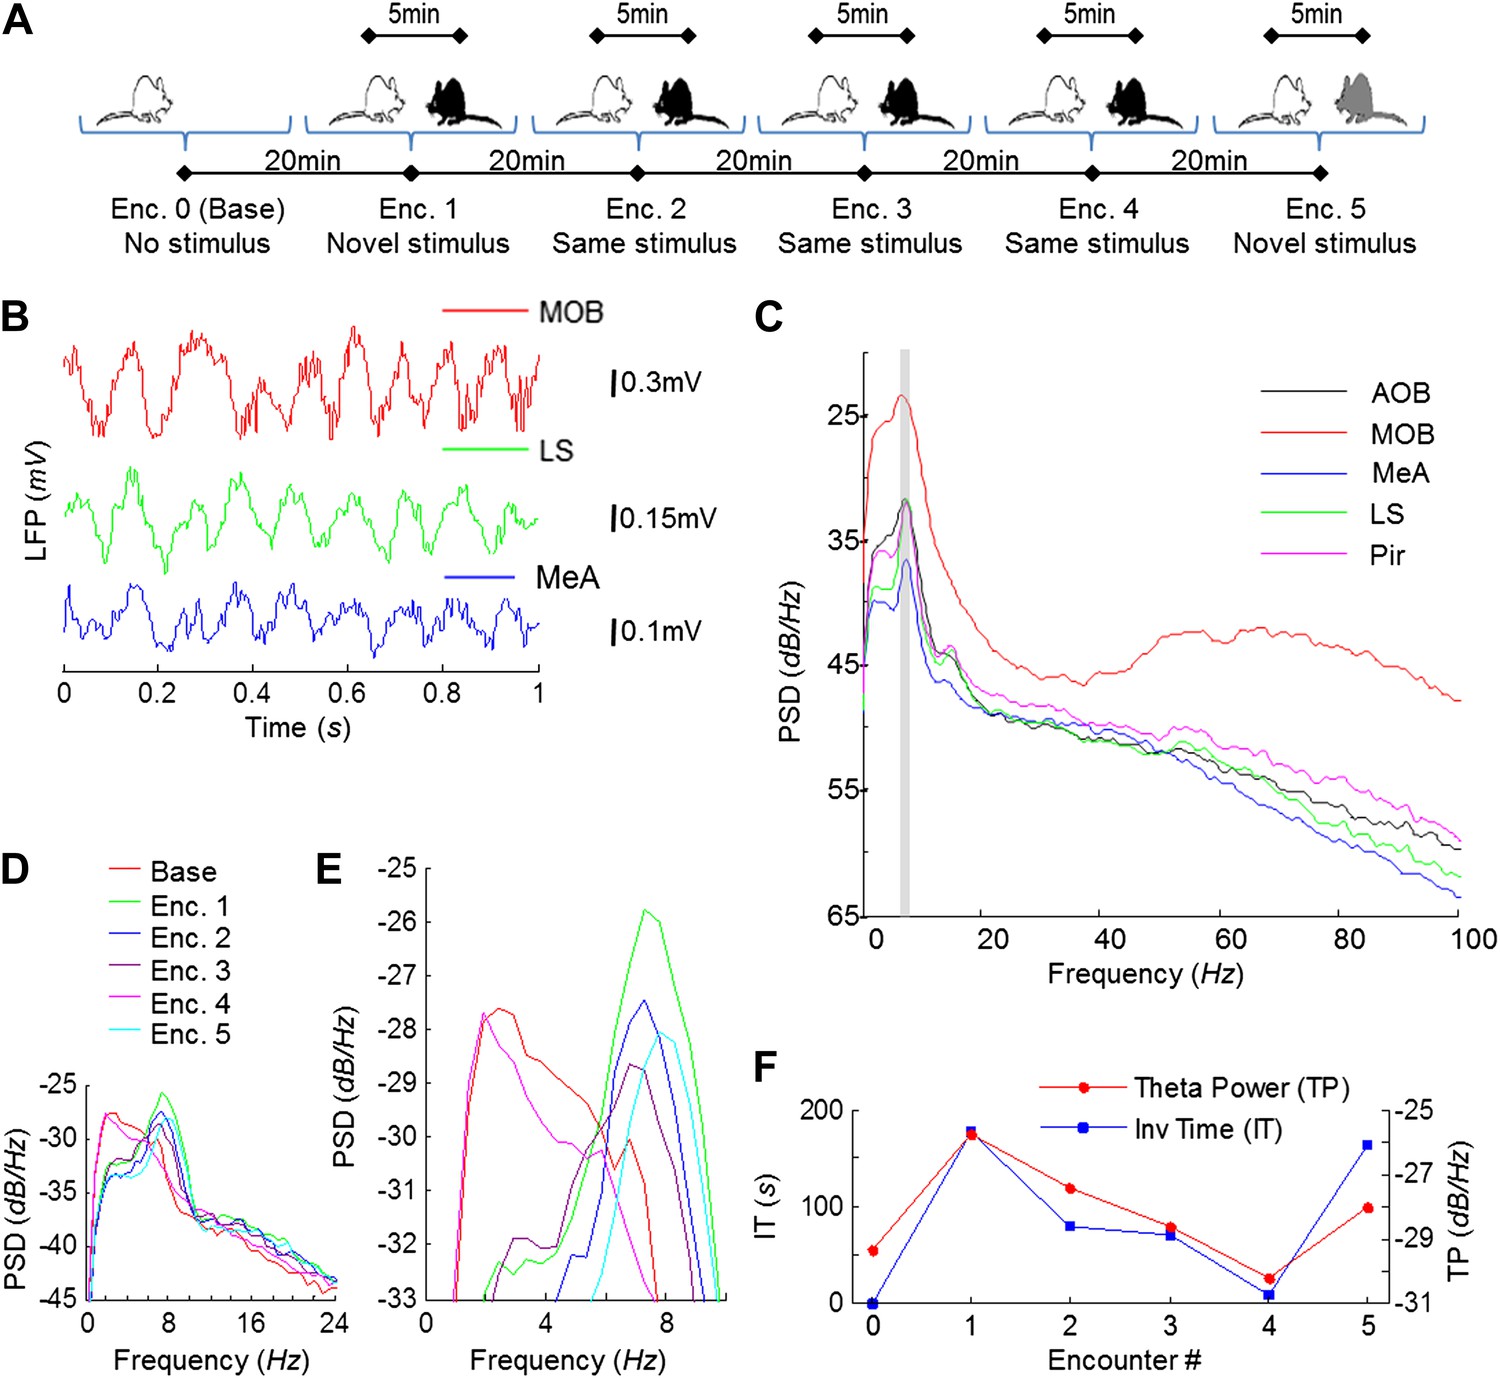
Theta rhythmicity in the rat brain is enhanced during social encounters, in correlation with the novelty of the social stimulus.
(A) A scheme of the habituation–dishabituation SRM paradigm. (B) Examples of LFP traces recorded in the MOB, LS, and MeA during a social encounter. (C) Power spectral density (PSD) analyses of a 5-min LFP recording from all five brain areas during a social encounter. Gray bar represents the 7–9 Hz band. (D) Superimposed PSD analyses of LFP recordings from the MeA of one animal during the various stages of the SRM test. (E) As in D, zooming on the 4–10 Hz range. (F) The ∼8 Hz PSD peak (TP) and social investigation time (IT) for the same experiment as in D, plotted as a function of the encounter number. Encounter 0 represents no stimulus (Base).
Figure 3
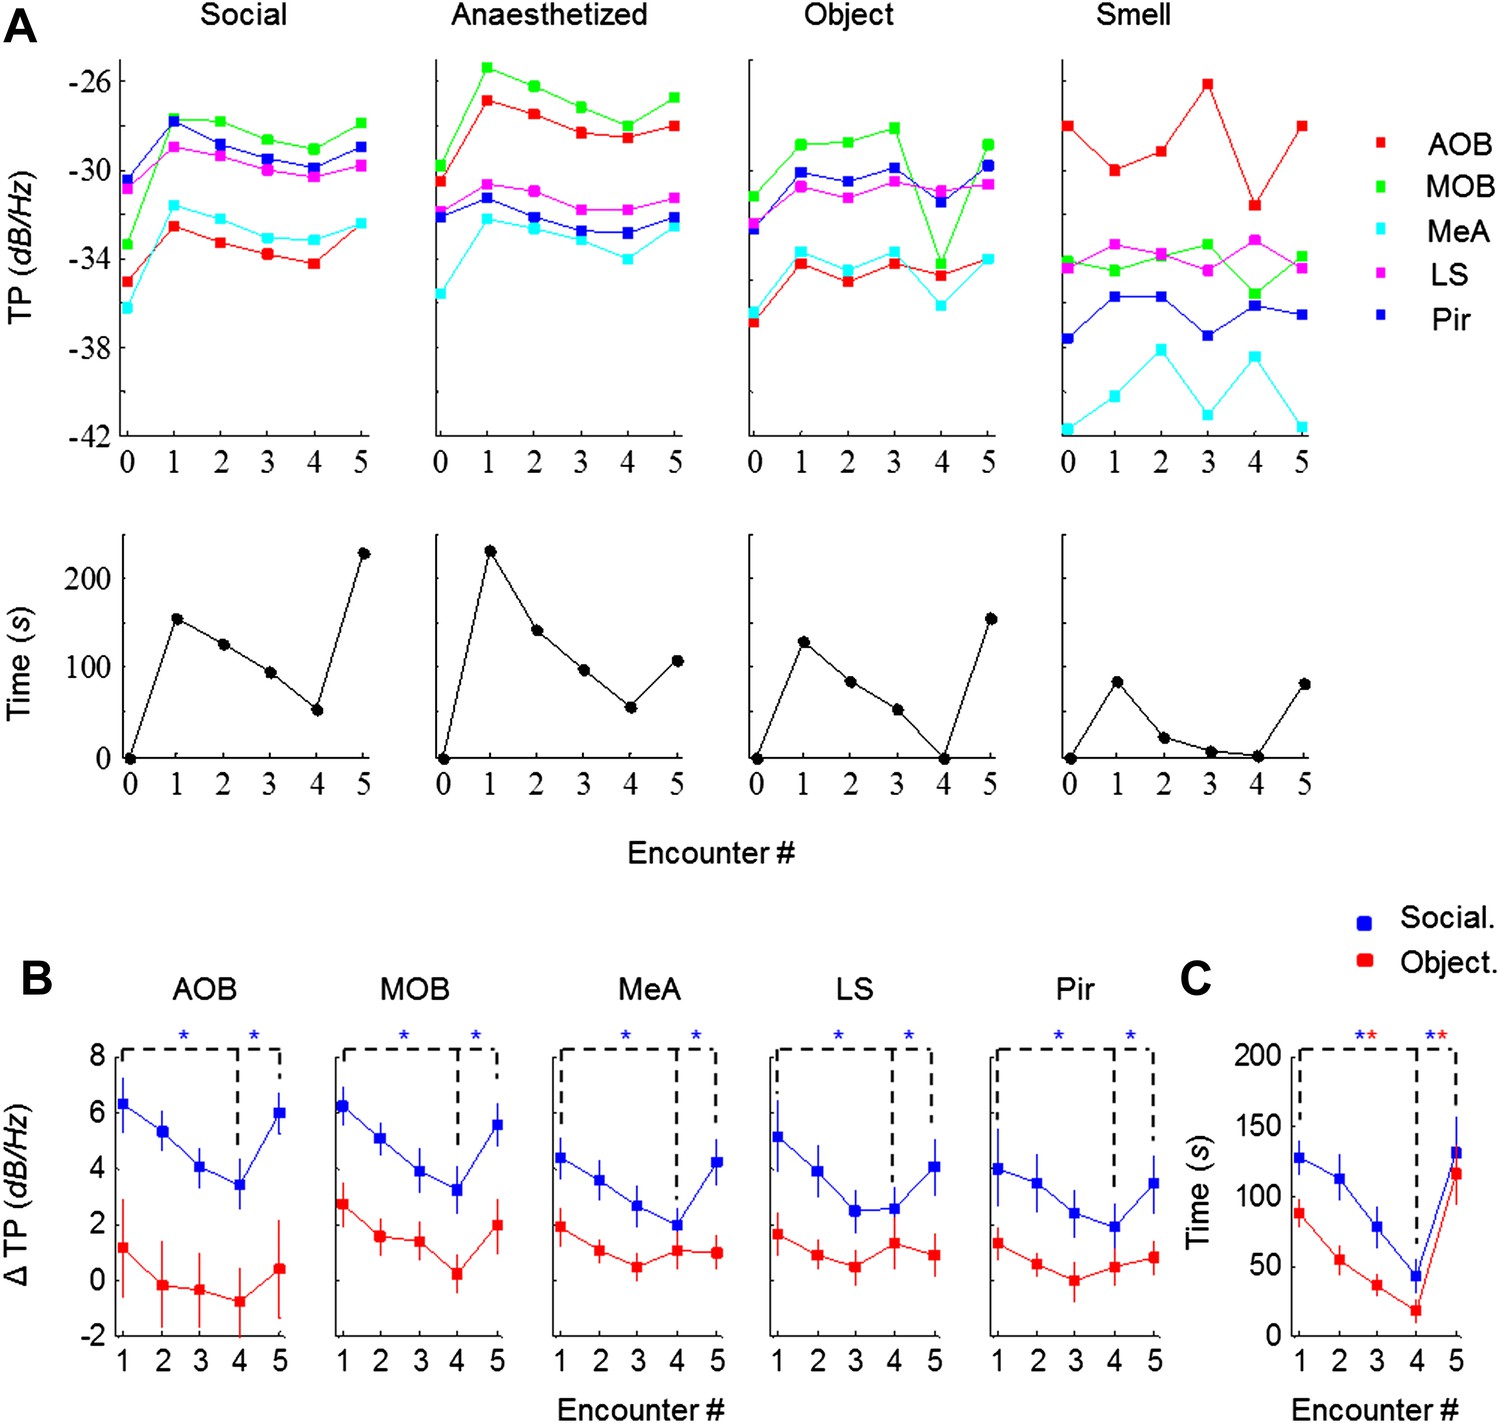
Theta rhythmicity is modulated by the novelty of social, but not other tested stimuli.
(A) TP for all brain areas (upper) as well as IT (lower) during the SRM test of one animal, using awake and anesthetized social stimuli as well as object and smell stimuli, all except smell tested with the same animal. (B) Mean TP for the various brain regions averaged (±SEM) and plotted as a function of the test stage, for social (blue, n = 8) and object (red, n = 6) stimuli. A significant difference was found between the various encounters in all brain regions for social stimuli (p < 0.005, one-way repeated measures ANOVA, Figure 3—source data 1A), while no difference was found for object recognition (p > 0.05, Figure 3—source data 1B). Post hoc paired t-test showed significant differences between Enc. 1 and Enc. 4 as well as between Enc. 4 and Enc. 5 (dashed lines) in all brain regions for social stimuli (*pcorr < 0.05, Figure 3—source data 2). (C) As in B, for the IT of the social and object paradigms. Unlike the TP, both paradigms showed similarly significant modulation of the IT (Figure 3—source data 1–2).
-
Figure 3—source data 1
Theta power (TP) modulation between encounters.
One-way ANOVA (repeated measures) test was used to determine whether there is a significant difference between the mean ΔTP of all five encounters during either social (1a) or object (1b) recognition. The assumption of normality was assessed by Lilliefors and Shapiro–Wilk tests. Sphericity was assessed by Mauchly's test.
- https://doi.org/10.7554/eLife.03614.007
-
Figure 3—source data 2
Statistical assessment of habituation and dishabituation.
Paired t-tests were used for the social (2a) and object (2b) recognition paradigms, to examine if the differences between Enc.1 and Enc. 4 (habituation), as well as between Enc. 4 and Enc. 5 (dishabituation) are statistically significant. Tests were one-sided and corrected for multiple comparisons using Bonferroni's correction.
- https://doi.org/10.7554/eLife.03614.008
Figure 4 with 7 supplements
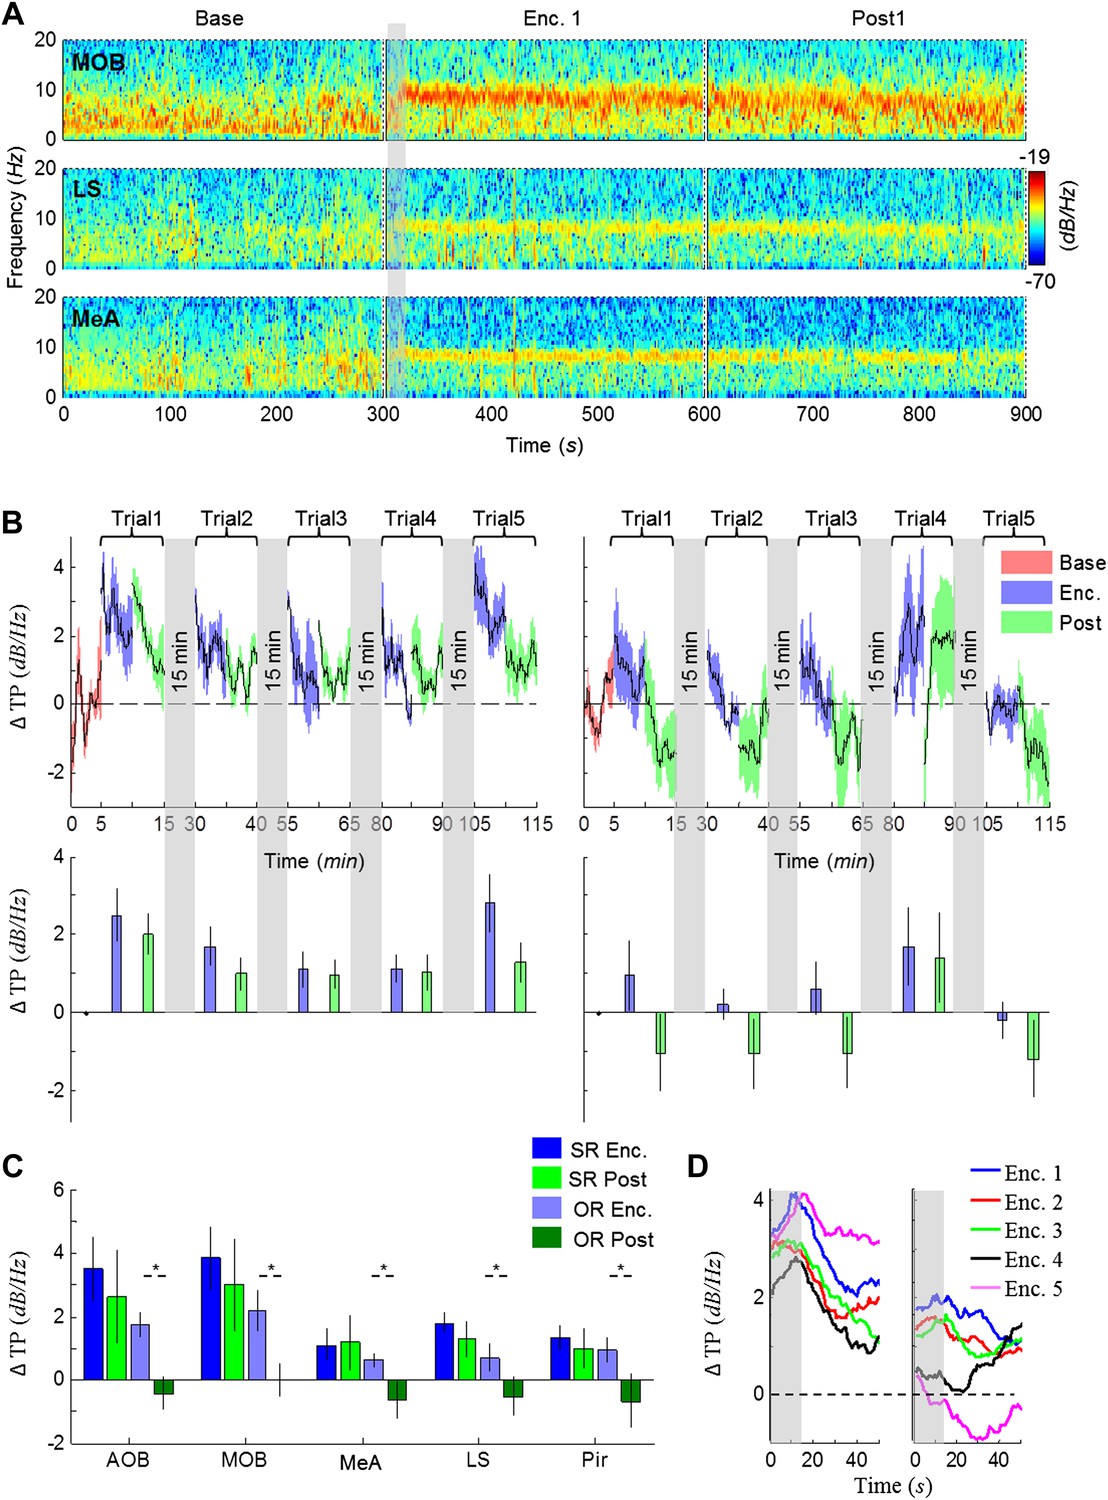
Modulation of the theta rhythmicity by social stimulus novelty reflects an internal state in the brain.
(A) Color-coded spectrograms of the LFP recorded in the MOB (upper), LS (middle), and MeA (lower) for 5 min before (Base), during (Enc. 1), and after (Post 1) the first encounter of the SRM test. All spectrograms are averages of five animals (4 animals for LS). Gray bar marks the 15 s needed for stimulus transfer to the arena. (B) Upper—instantaneous ΔTP (change from mean Base) in the LS averaged over four rats (±SEM) during the Enc. and Post periods of all trials (1-5), for social (left, n = 5) and object (right, n = 4) paradigms. The 15-min breaks between last Post and next Enc. periods are labeled with gray bars. Lower—mean (±SEM) values for the corresponding periods shown above. (C) Comparison of mean ΔTP averaged over all trials (1-5) for each brain area, between the Enc. and Post periods of the social and object paradigms (*p < 0.05, paired t-test, Figure 4—source data 1). (D) Left—the instantaneous ΔTP shown in B, expanded to show the initial 50 s of all encounters. Gray area represents the 15 s needed for stimulus transfer to the experimental arena. Right—The same for object stimuli.
-
Figure 4—source data 1
Comparison of ΔTP between Enc. and Post periods.
Paired t-tests were used to compare between the mean ΔTP across Enc. vs the mean ΔTP across Post periods. The assumption of normality was assessed by Lilliefors and Shapiro–Wilk tests.
- https://doi.org/10.7554/eLife.03614.010
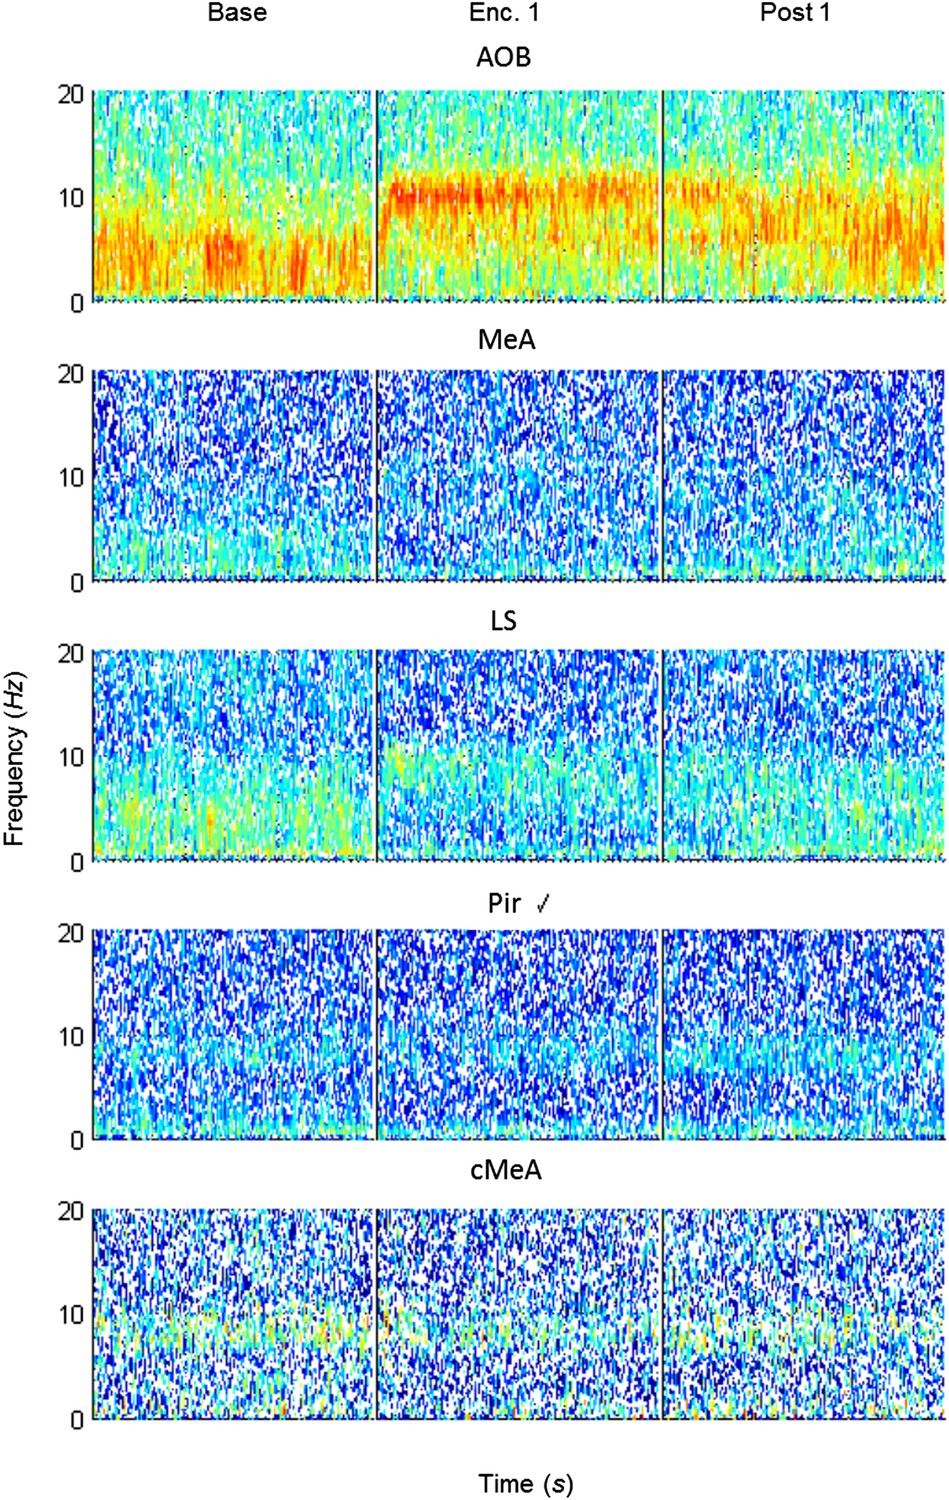
Figure 4—figure supplement 1
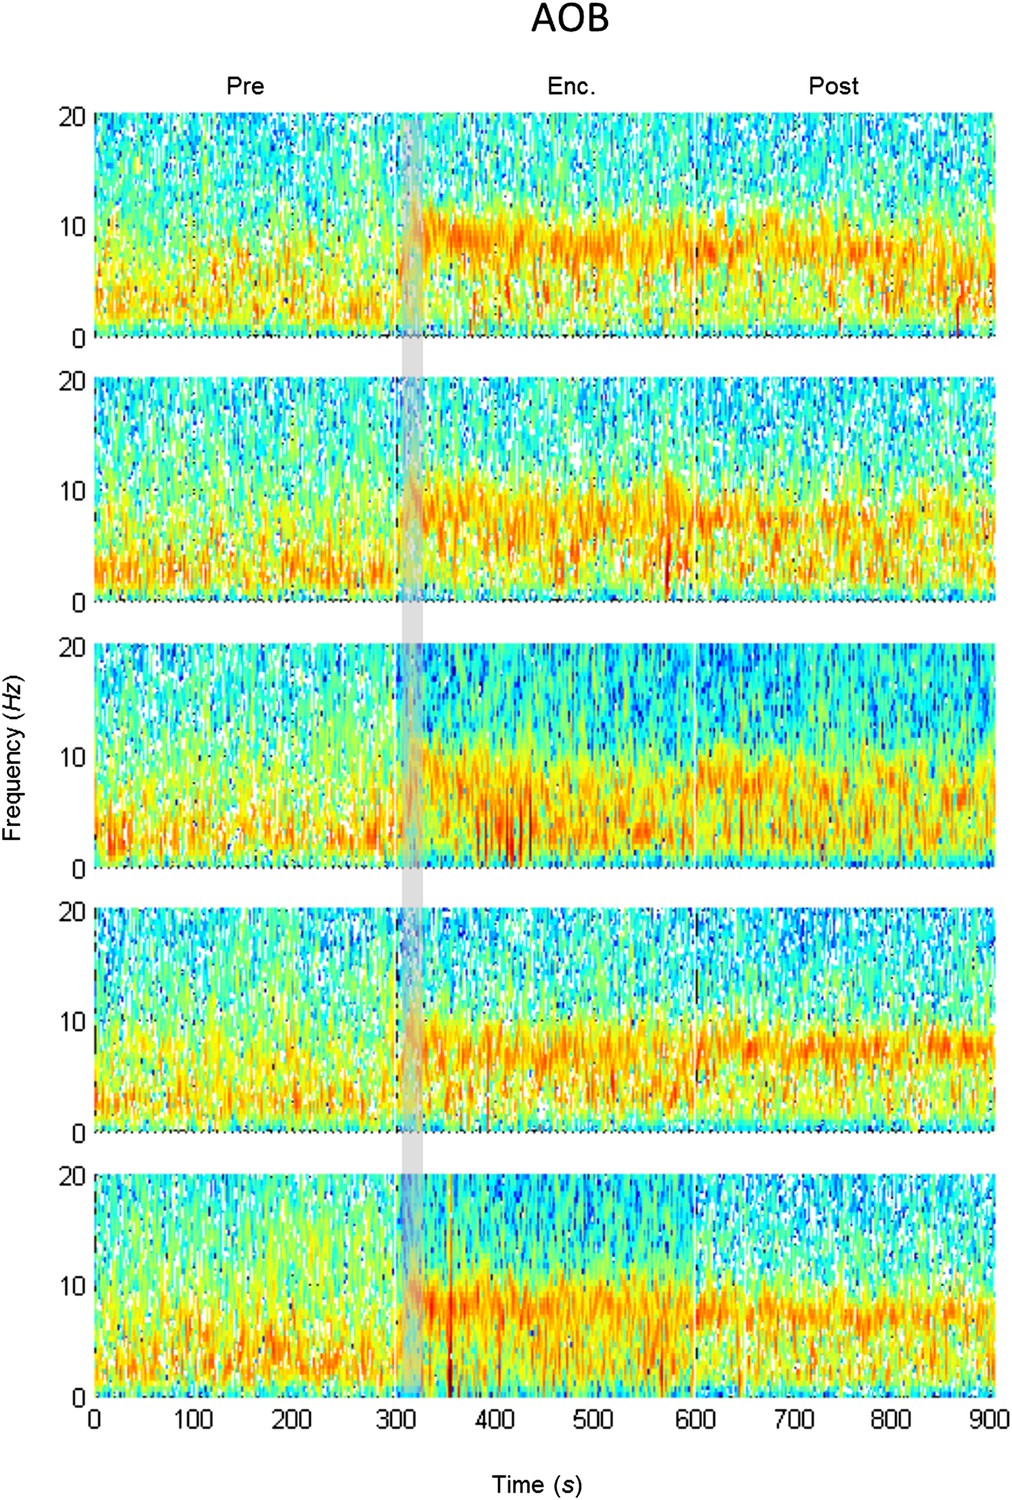
Mean LFP spectrograms across the SRM paradigm for the AOB.
Color-coded spectrograms (0–20 Hz) of the LFP recorded in the AOB during the SRM test. Gray bar marks the 15 s needed for stimulus delivery to the arena. Mean of five animals.
Figure 4—figure supplement 2
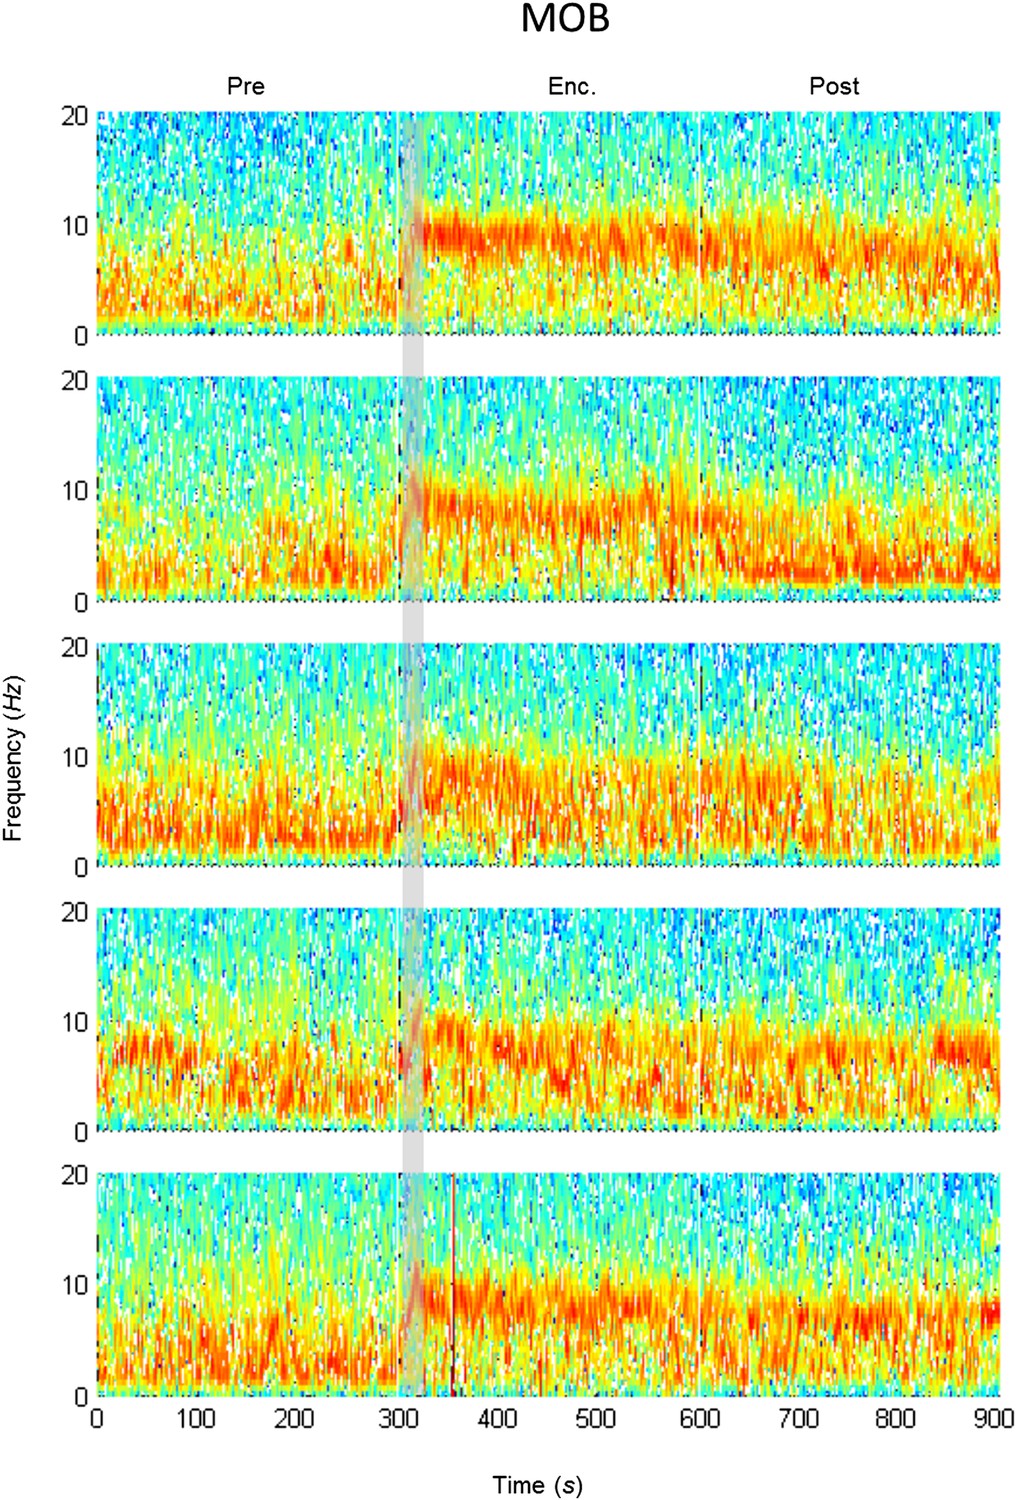
Mean LFP spectrograms across the SRM paradigm for the MOB.
Color-coded spectrograms (0–20 Hz) of the LFP recorded in the MOB during the SRM test. Gray bar marks the 15 s needed for stimulus delivery to the arena. Mean of five animals.
Figure 4—figure supplement 3
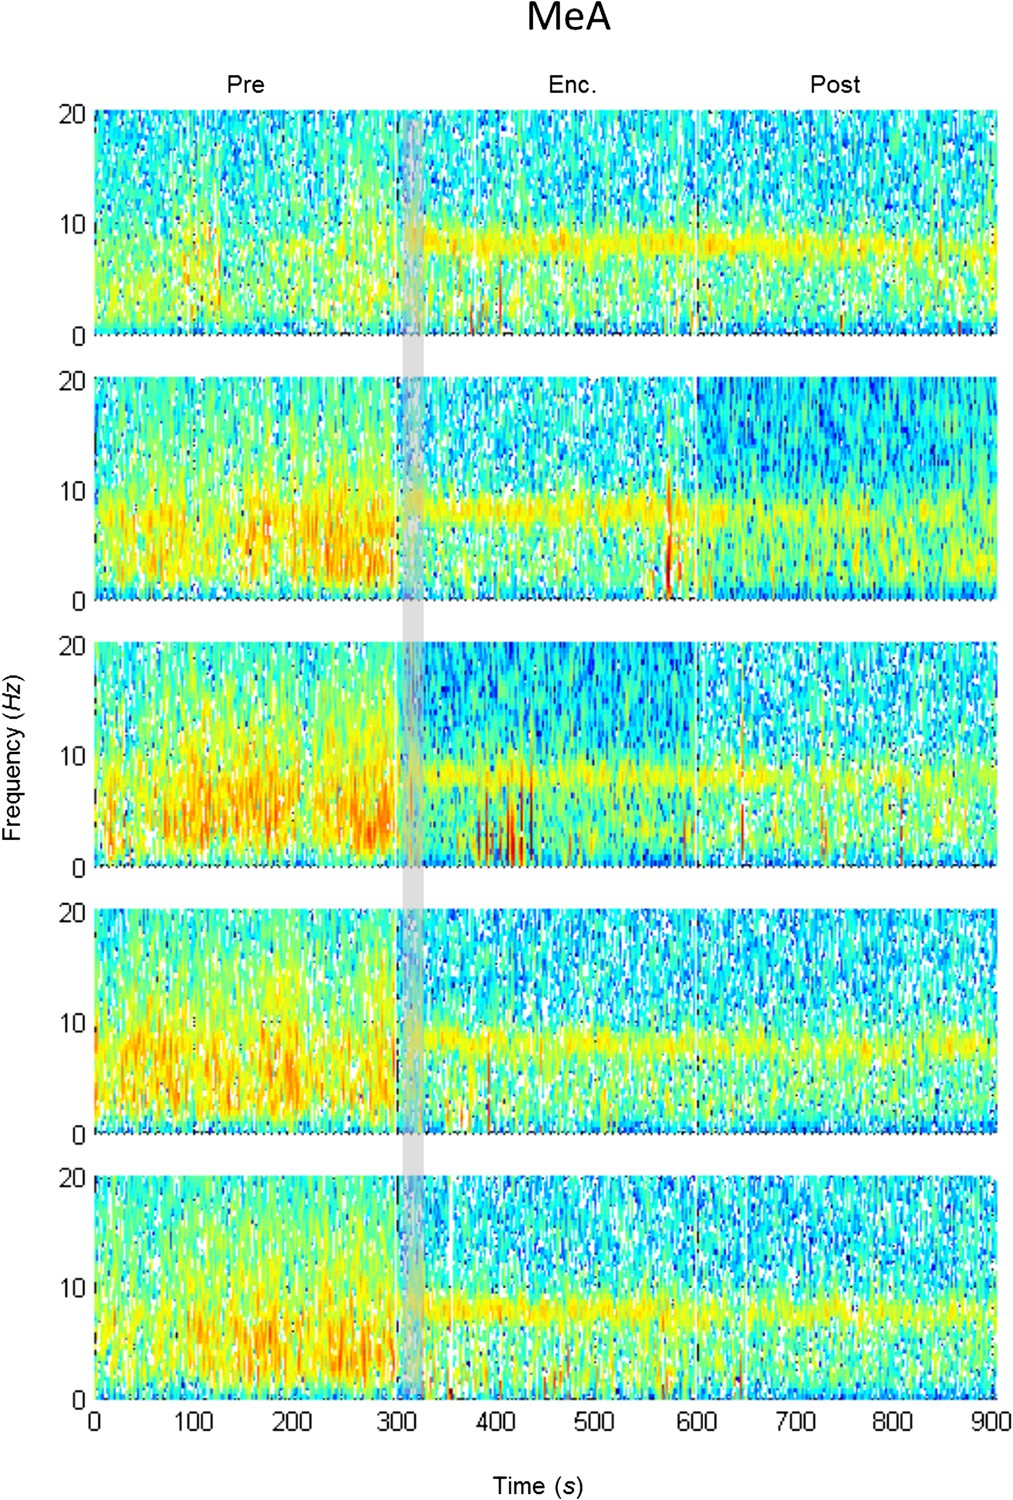
Mean LFP spectrograms across the SRM paradigm for the MEA.
Color-coded spectrograms (0–20 Hz) of the LFP recorded in the MEA during the SRM test. Gray bar marks the 15 s needed for stimulus delivery to the arena. Mean of five animals.
Figure 4—figure supplement 4

Mean LFP spectrograms across the SRM paradigm for the LS.
Color-coded spectrograms (0–20 Hz) of the LFP recorded in the LS during the SRM test. Gray bar marks the 15 s needed for stimulus delivery to the arena. Mean of four animals.
Figure 4—figure supplement 5

Mean LFP spectrograms across the SRM paradigm for the Pir.
Color-coded spectrograms (0–20 Hz) of the LFP recorded in the Pir during the SRM test. Gray bar marks the 15 s needed for stimulus delivery to the arena. Mean of five animals.
Figure 4—figure supplement 6
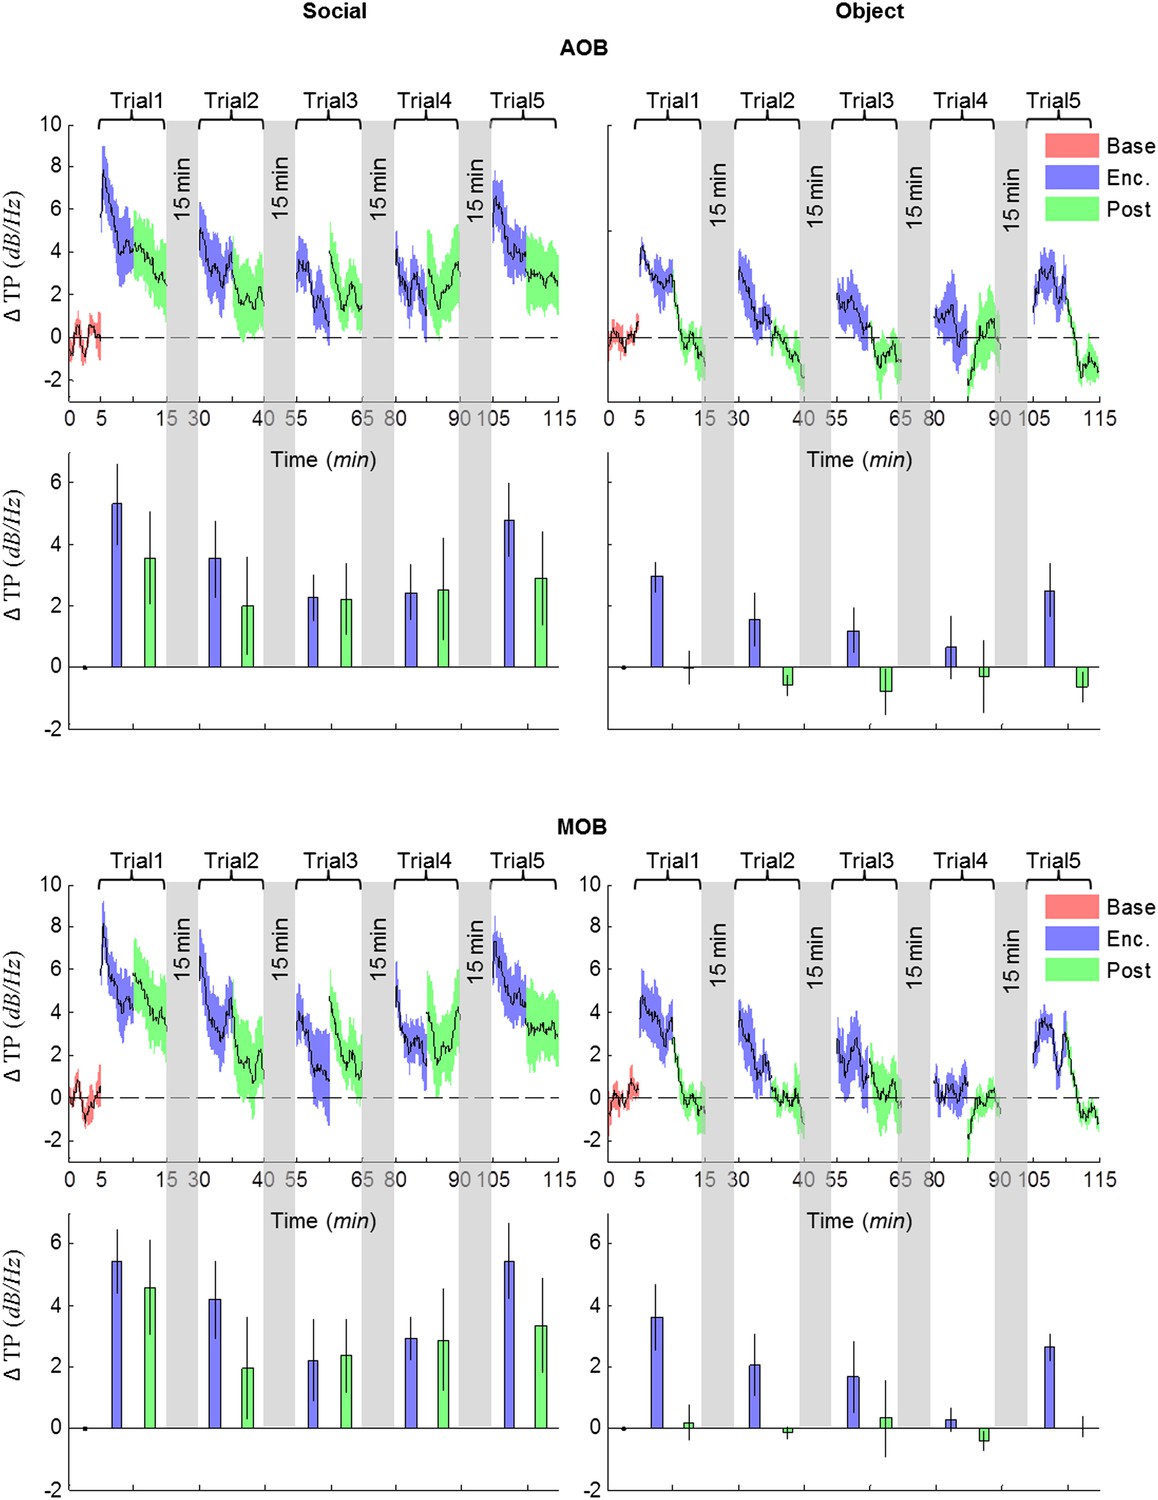
Comparison of mean instantaneous TP between social and object stimuli, for the AOB and MOB.
Upper panels—instantaneous ΔTP (change from mean Base) in each brain area averaged over all animals (mean ± SEM) during the Enc. and Post periods of all trials (1–5), for social (left, n = 5 rats) and object (right, n = 4 rats) paradigms. The 15-min breaks between last Post and next Enc. periods are labeled with gray bars. Lower panels—mean (±SEM) values for the corresponding periods shown above.
Figure 4—figure supplement 7
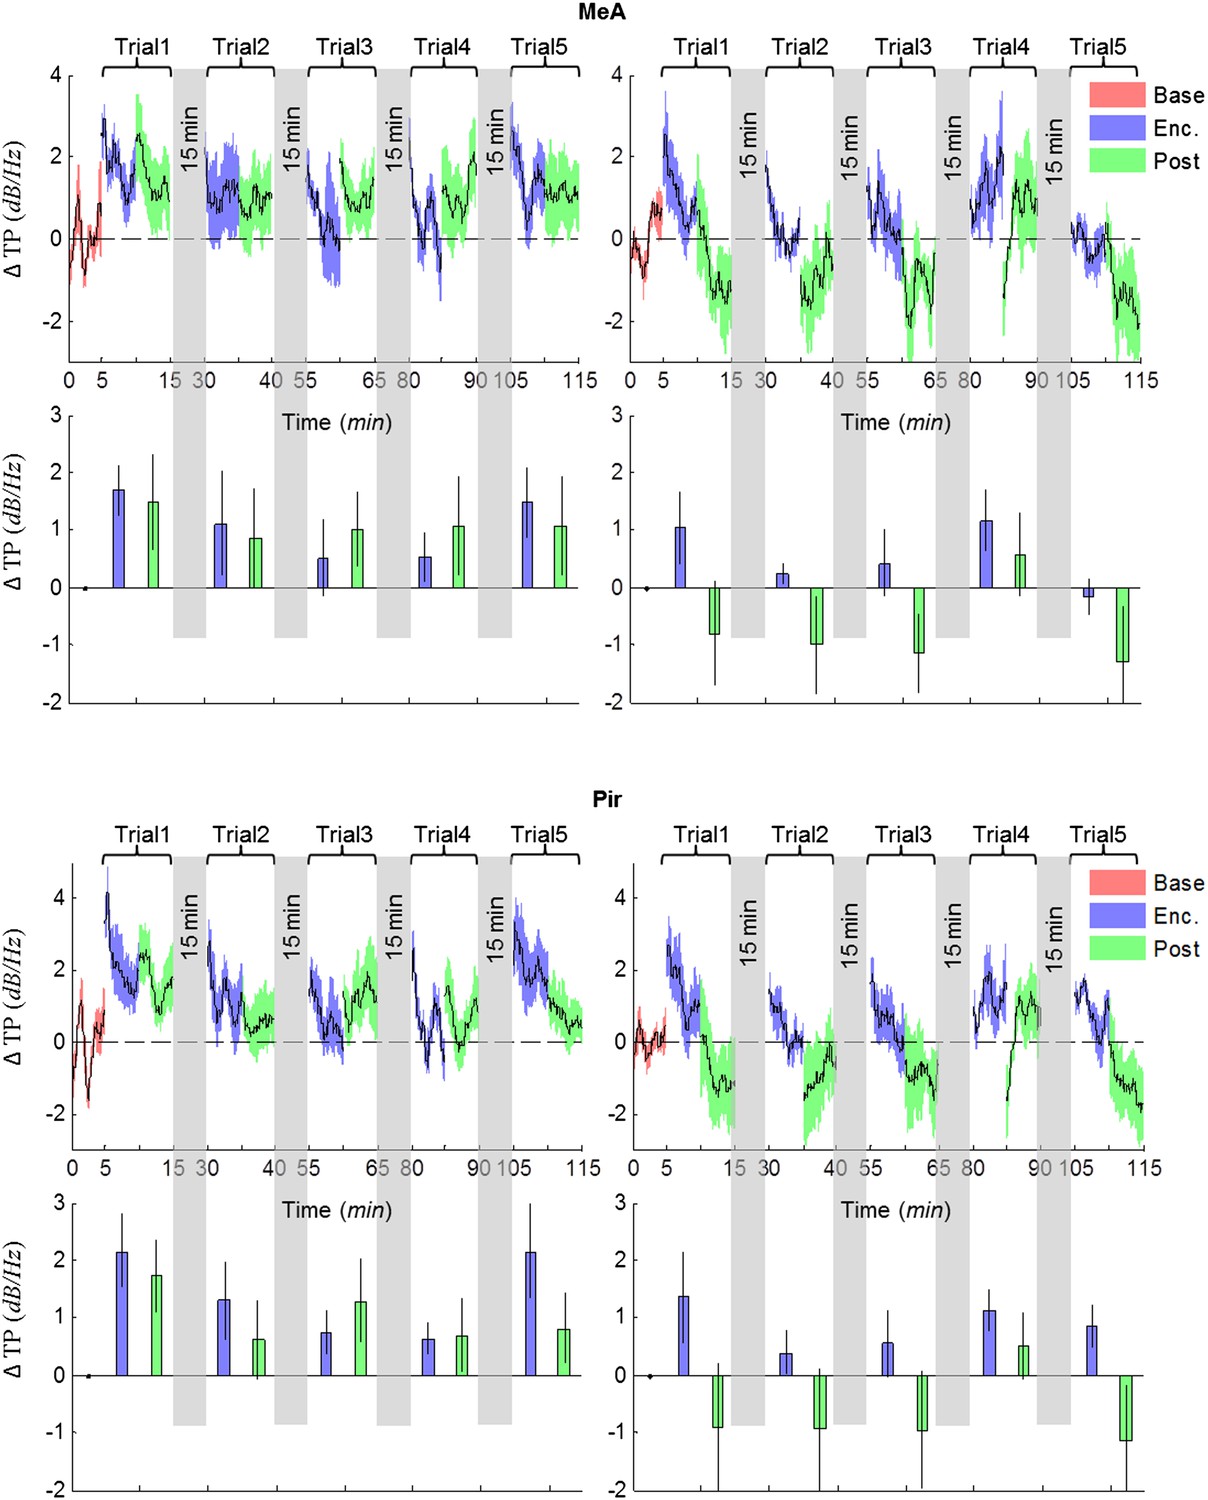
Comparison of mean instantaneous TP between social and object stimuli, for the MeA and Pir.
Upper panels—instantaneous ΔTP (change from mean Base) in each brain area averaged over all animals (mean±SEM) during the Enc. and Post periods of all trials (1–5), for social (left, n = 5 rats) and object (right, n = 4 rats) paradigms. The 15 min breaks between last Post and next Enc. periods are labeled with gray bars. Lower panels—mean (±SEM) values for the corresponding periods shown above.
Figure 5
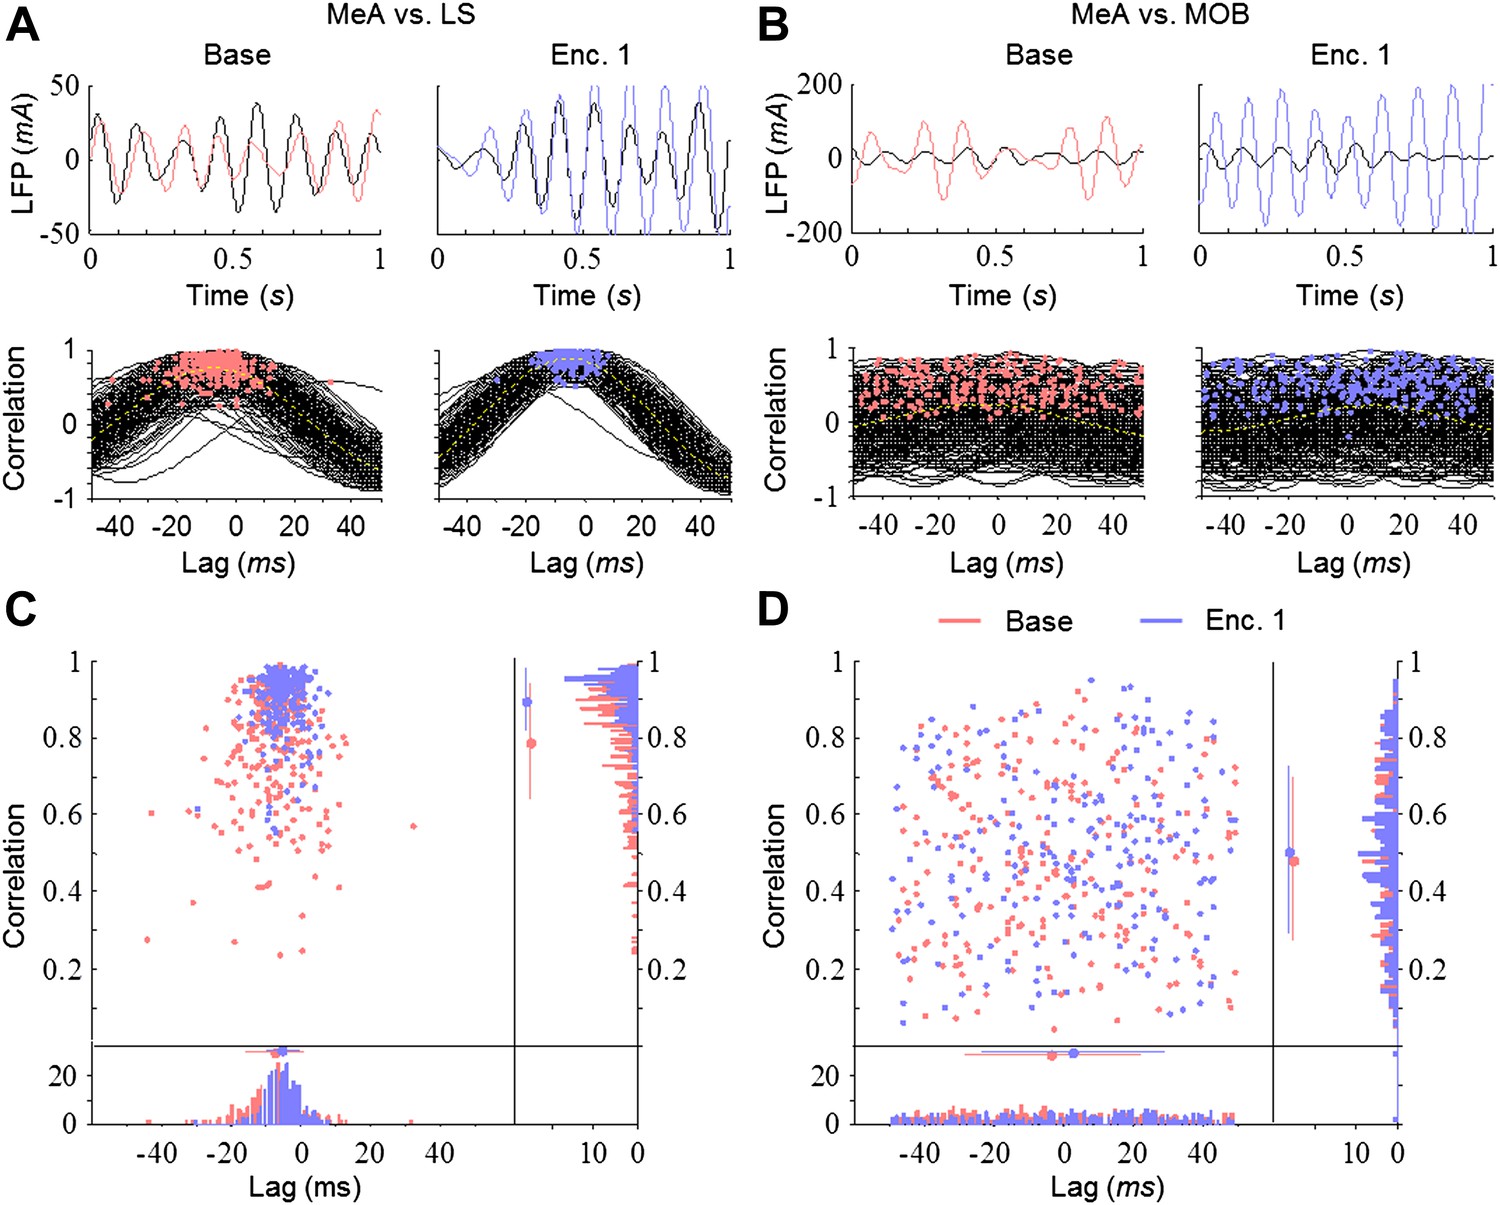
Differential and dynamic correlation of theta rhythmicity between specific brain regions.
(A) Upper—superimposed LFP traces (filtered 5–11 Hz) from the MeA (black) and LS (colored) of one animal during Base (left, red) and Enc. 1 (right, blue). Lower—cross-correlations between both regions for each of the 300 s recorded during the same periods, with peaks labeled by colored dots. (B) Same as A for the MeA and MOB. (C) Middle—distribution of the cross-correlation peaks for the data in A. Borders—histograms of the cross-correlation peaks in the correlation (right) and lag (bottom) axes. Mean ± SD are marked to the left (correlation) or above (lag) the histograms. (D) Same as C for the data in B.
Figure 6 with 3 supplements
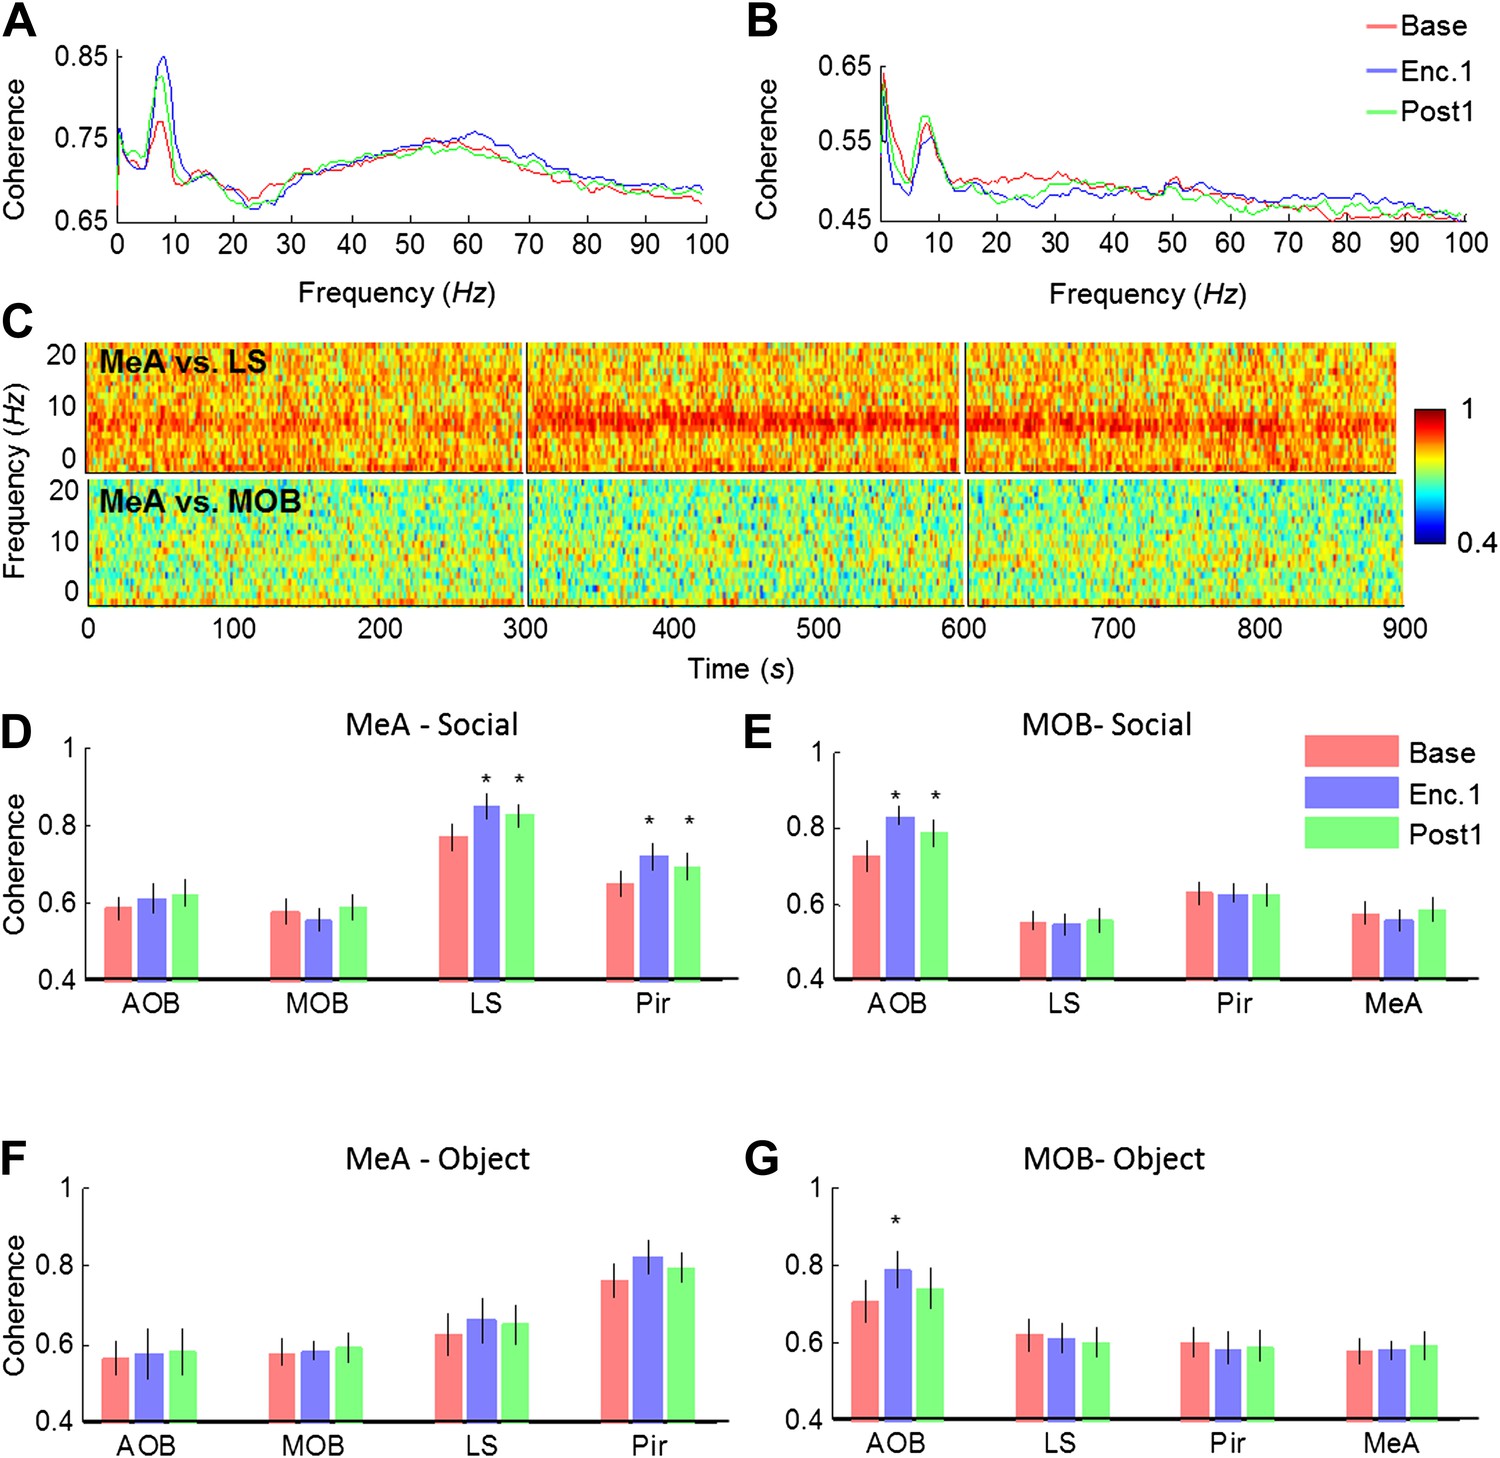
Theta coherence between specific brain regions increases during social encounter.
(A) Mean (n = 10 animals) coherence (0–100 Hz) of the LFP signals recorded in the MeA and LS during Base, Enc. 1, and Post 1 periods. (B) Same animals, coherence analysis between the MeA and MOB. (C) Spectrograms (0–20 Hz) of the coherence analyses shown in A (between MeA and LS, upper panel) and B (between MeA and MOB, lower panel). (D) Mean coherence at 8 Hz between the MeA and all other areas (MOB, AOB n = 11; LS, Pir n = 10) during the Base, Enc. 1, and Post 1 periods of social encounter (*pcorr < 0.05, paired t-test, Figure 6—source data 1A). (E) Same as D, for coherence of the MOB with all other areas (*pcorr < 0.05, paired t-test, Figure 6—source data 1B). (F) Same as D, for object stimuli (Figure 6—source data 1C). (G) Same as E, for object stimuli (*pcorr < 0.05, paired t-test, Figure 6—source data 1D).
-
Figure 6—source data 1
Assessment of change in theta Coherence from Base to either Enc. 1 or Post 1.
The change from Base to Enc. 1 (upper) and from Base to Post 1 (lower), in theta coherence during social recognition between the MeA and all other areas (1a) and between the MOB and all areas (1b), as well as during object recognition between the MeA and all other areas (1c), and between the MOB and all areas (1d), was statistically validated using paired t-tests, corrected for multiple comparisons (Bonferroni correction). The assumption of normality was assessed by Lilliefors and Shapiro–Wilk tests.
- https://doi.org/10.7554/eLife.03614.020
Figure 6—figure supplement 1
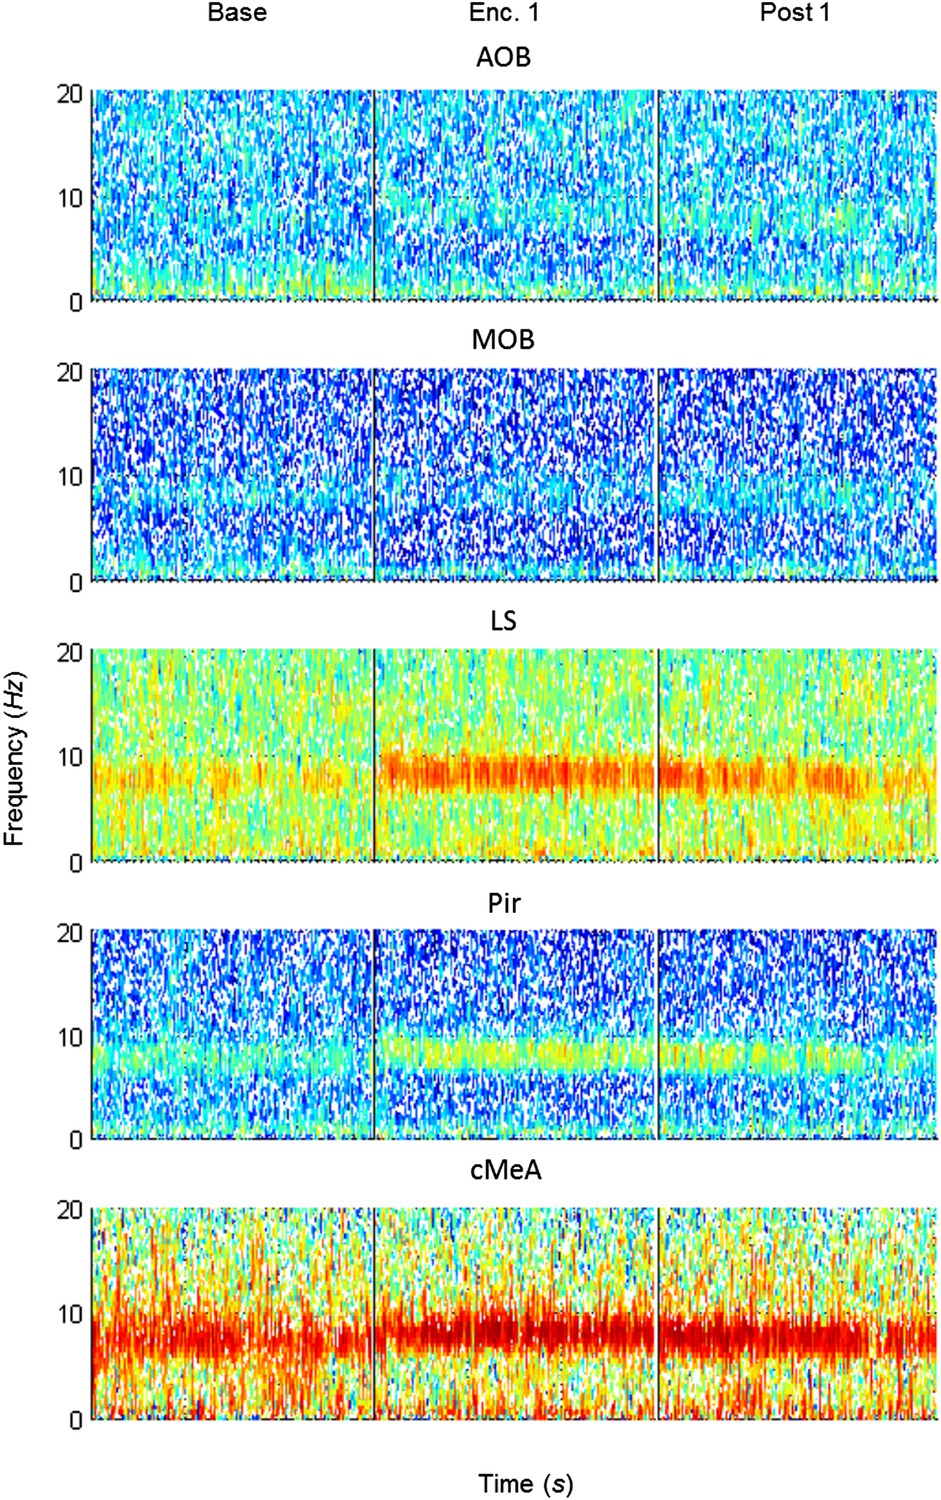
Mean spectrograms of coherence between the MeA and all other areas during trial 1 of the SRM paradigm.
Color-coded spectrograms (0–20 Hz) of the mean LFP coherence (MOB, AOB—n = 11; LS, Pir—n = 10, cMeA—contralateral MeA—n = 3) between the MOB and all other brain areas, during the first trial of SRM test, each depicting continuous 15 min divided to the Base, Enc. 1, and Post 1 periods.
Figure 6—figure supplement 2
Mean spectrograms of coherence between the MOB and all other areas during trial 1 of the SRM paradigm.
Color-coded spectrograms (0–20 Hz) of the mean LFP coherence (MeA, AOB—n = 11; LS, Pir—n = 10, cMeA—contralateral MeA—n = 3) between the MOB and all other brain areas, during the first trial of SRM test, each depicting continuous 15 min divided to the Base, Enc. 1, and Post 1 periods.
Figure 6—figure supplement 3

Mean theta coherence during trial 1 of the SRM paradigm.
(A) Mean coherence at 8 Hz between the MeA and all other areas (MOB, AOB n = 11; LS, Pir n = 10, cMeA—contralateral MeA—n = 3) during the Base, Enc. 1, and Post 1 periods of the SRM paradigm. (B) Same as A, for coherence of the MOB with all other areas.
Figure 7 with 1 supplement

Distinct types of theta rhythmicity are induced by social and fearful stimuli.
(A) PSD analyses (0–20 Hz) of LFP signal recorded in the LS of one animal, 5 min prior to stimulus introduction (Base, red) and 15 s following it (Stimulus, blue) during fear memory recall (left, FC) and social encounter (right, SR). (B) The change between Stimulus and Base PSD analyses (Stimulus minus Base) shown in A, for FC and SR, superimposed. (C) Mean change in PSD profile for all brain areas of the same six animals during the FC (continuous lines) and SR (dashed lines) experiments. (D) Mean (±SEM) values of the peak change in PSD in the low (4–8 Hz, red and blue) and high (8–12 Hz, pink and light blue) theta ranges for the FC (red and pink) and SR (blue and light blue) experiments (**p < 0.01, experiment X theta range interaction, two-way repeated measures ANOVA, Figure 7—source data 1).
-
Figure 7—source data 1
Comparison of change in theta power in low and high theta bands between social and fearful stimuli.
Comparison of the change in theta power between social recognition (SR) and fear conditioning (FC) at high and low theta ranges, statistically validated using two-way repeated measures ANOVA (p—experiment X theta range interaction). The assumption of normality was assessed by Lilliefors and Shapiro–Wilk tests.
- https://doi.org/10.7554/eLife.03614.025
Figure 7—figure supplement 1

Arousal-driven locomotion during recall of fear memory.
(A) A schematic drawing of the fear conditioning session, comprising five events of 40-sec tone (gray bar) followed by brief electrical foot shock (red bar). (B) Locomotion activity of one animal during the recall of fear memory, 1 day after fear conditioning, plotted as a function of the experimental stage. Gray bars represent the 40-sec long tone. Tone start is marked on the X-axis by T1…5 and tone end by S1…5. (C) Mean locomotion (n = 6 animals) during fear recall around the first tone, as a function of time. Tone started 15 sec from the beginning of the experiment and is marked by a gray bar. Note the intense locomotion of the animals during most of the tone, as opposed to their freezing at the end of it, when expecting the electrical foot shock. Black dashed line represents the 15-sec period during which theta activity was calculated. Error bars represent SEM.
Figure 8
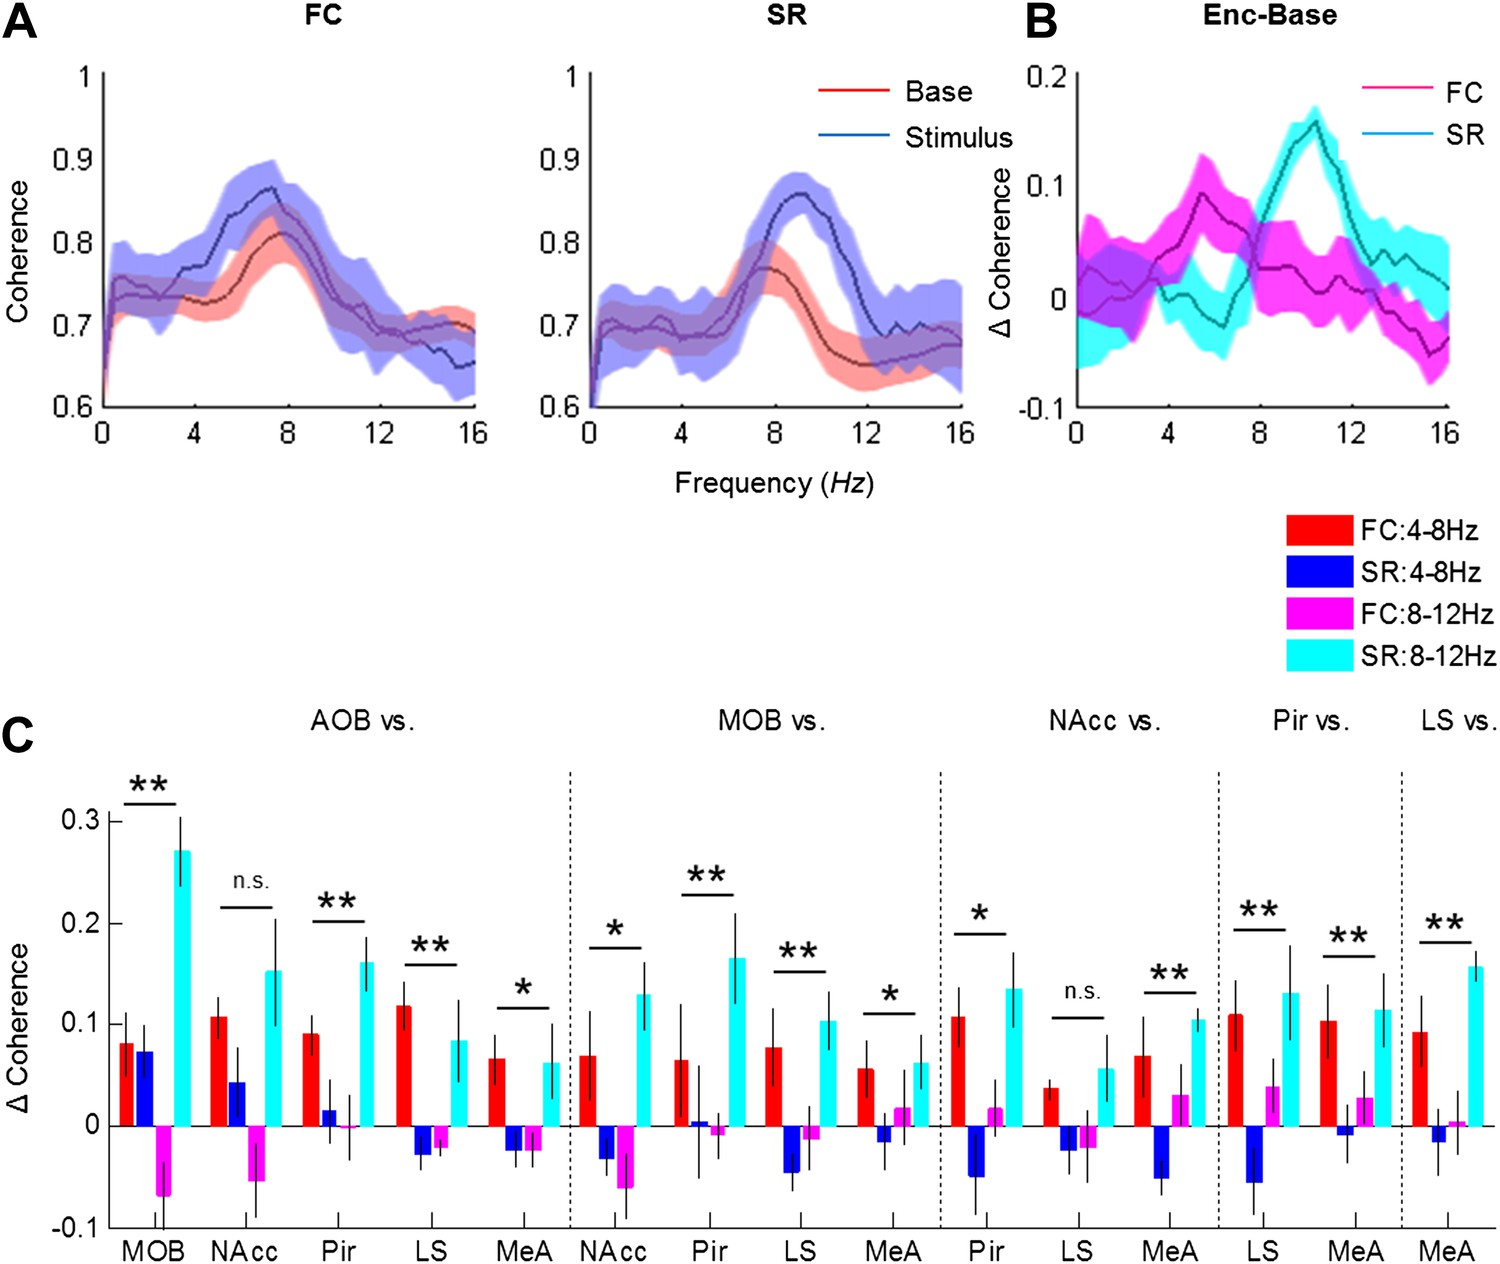
Distinct changes in theta coherence between various brain regions are induced by social and fearful stimuli.
(A) Coherence analyses (0–20 Hz) of LFP signal recorded in the LS and MeA of one animal, 5 min prior to stimulus introduction (Base, red) and 15 s following it (Stimulus, blue) during fear memory recall (left, FC) and social encounter (right, SR). (B) The change between Stimulus and Base coherence analyses (Stimulus minus Base) shown in A, for FC and SR, superimposed. (C) Mean (±SEM) values of the peak change in coherence between all possible couples of brain areas in the low (4–8 Hz, red and blue) and high (8–12 Hz, pink and light blue) theta ranges for the FC (red and pink) and SR (blue and light blue) experiments (*p < 0.05, **p < 0.01, experiment X theta range interaction, two-way repeated measures ANOVA, Figure 8—source data 1).
-
Figure 8—source data 1
Comparison of change in coherence in low and high theta bands between social and fearful stimuli.
Comparison of the change in coherence between social recognition (SR) and fear conditioning (FC) at high and low theta ranges (right), statistically validated using two-way repeated measures ANOVA (p—experiment X theta range interaction). The assumption of normality was assessed by Lilliefors and Shapiro–Wilk tests.
- https://doi.org/10.7554/eLife.03614.028
Figure 9
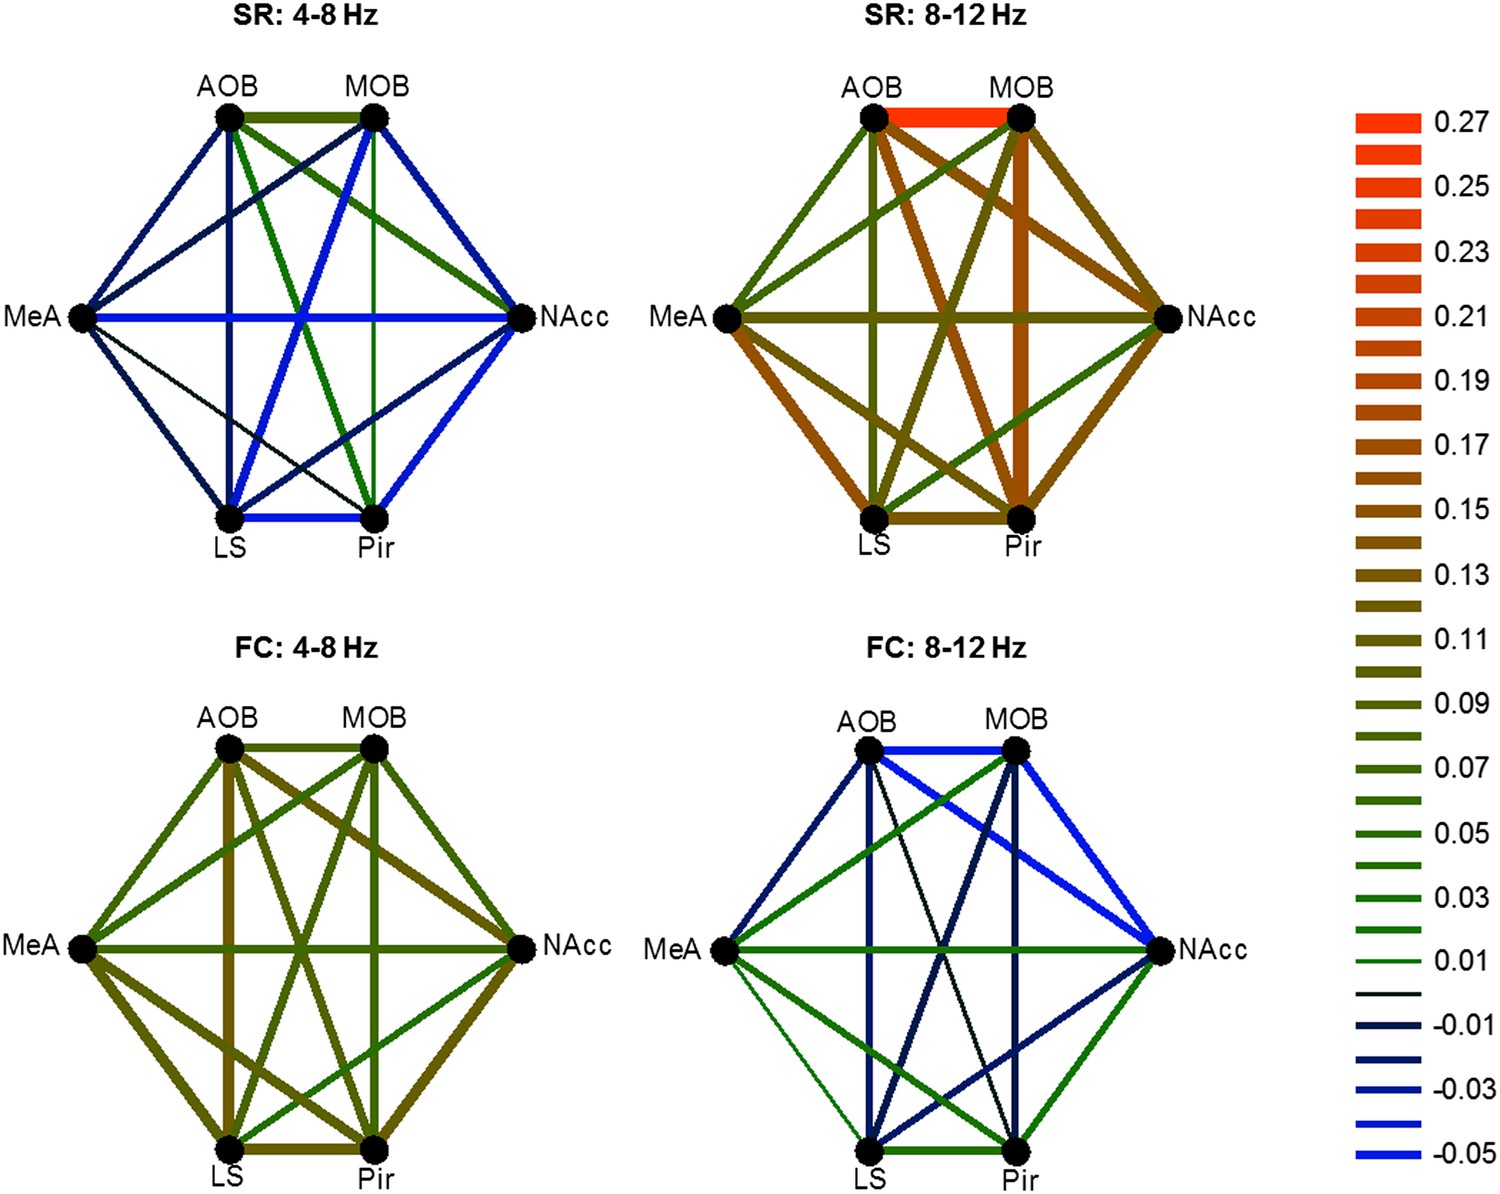
Different patterns of coherence change characterize the distinct arousal states.
Graphical color-coded presentation of the mean changes in coherence for the FC and SR experiments.
Videos
Video 1
Social encounter between two adult male rats in the experimental arena.
The recorded subject carries a black transmitter equipped with a flashing led light on its head. Frame number is shown in the right low corner. The graph below the video shows the LFP recorded in the AOB (blue), MOB (red), and MeA (green). The bottom graph shows raster plots of spikes detected from the recorded multi-unit activity signal.
Download links
A two-part list of links to download the article, or parts of the article, in various formats.
Downloads (link to download the article as PDF)
Open citations (links to open the citations from this article in various online reference manager services)
Cite this article (links to download the citations from this article in formats compatible with various reference manager tools)
Different types of theta rhythmicity are induced by social and fearful stimuli in a network associated with social memory
eLife 4:e03614.
https://doi.org/10.7554/eLife.03614


