Beam-induced motion correction for sub-megadalton cryo-EM particles
- Medical Research Council Laboratory of Molecular Biology, United Kingdom
Figures
Figure 1
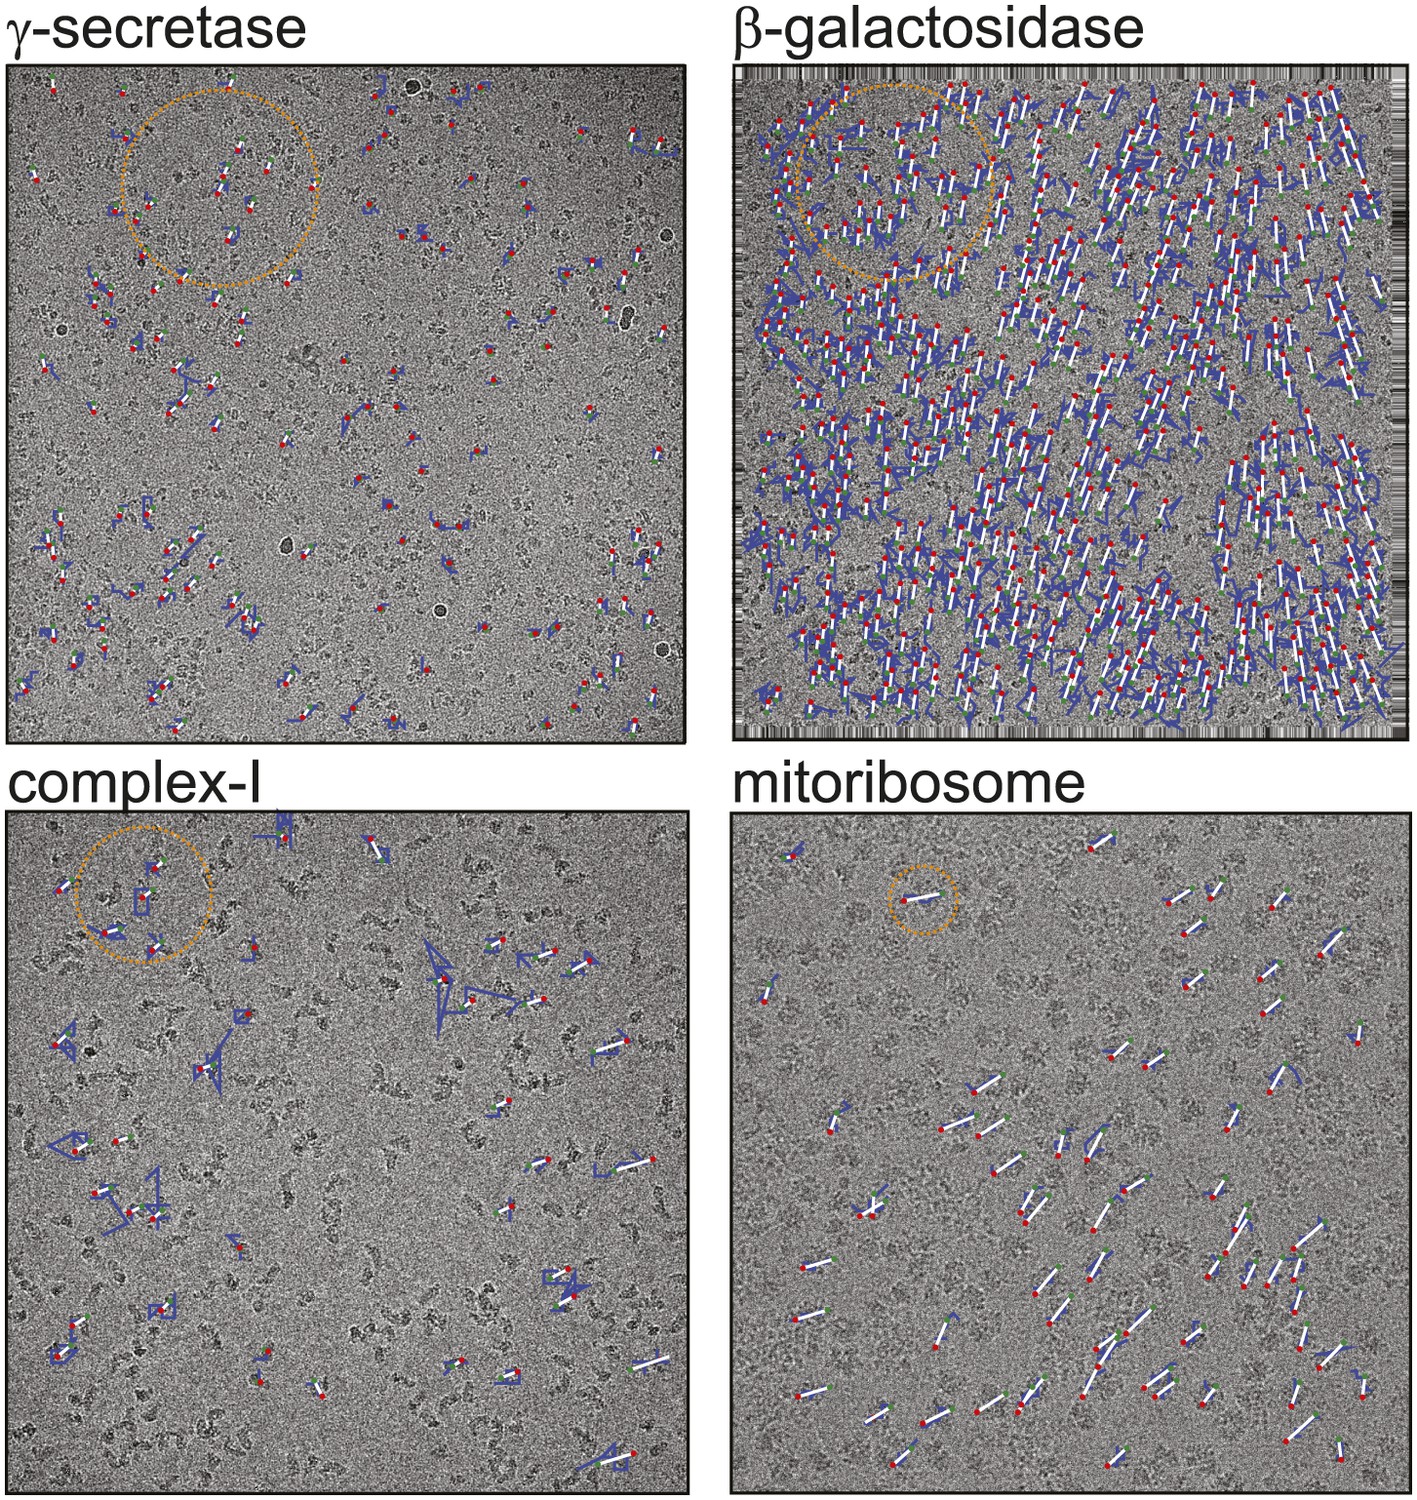
Beam-induced movement tracks.
A representative micrograph for each of the four test cases is shown, on top of which 50-fold exaggerated beam-induced particle movements are plotted. The original tracks as estimated for running averages of several movie frames for each particle independently are shown in blue; the fitted linear tracks are shown in white. The start and end points of the fitted tracks are indicated with green and red dots, respectively. The orange circles indicate the 2σNB distance for one of the particles on the micrographs. Note that tracks are only shown for those particles that were selected for the final reconstruction after 2D and 3D classification. Also note that the relatively small movement tracks for γ-secretase only represent the beam-induced motion that was not already corrected for in the algorithm by Li et al. (2013).
Figure 2 with 1 supplement
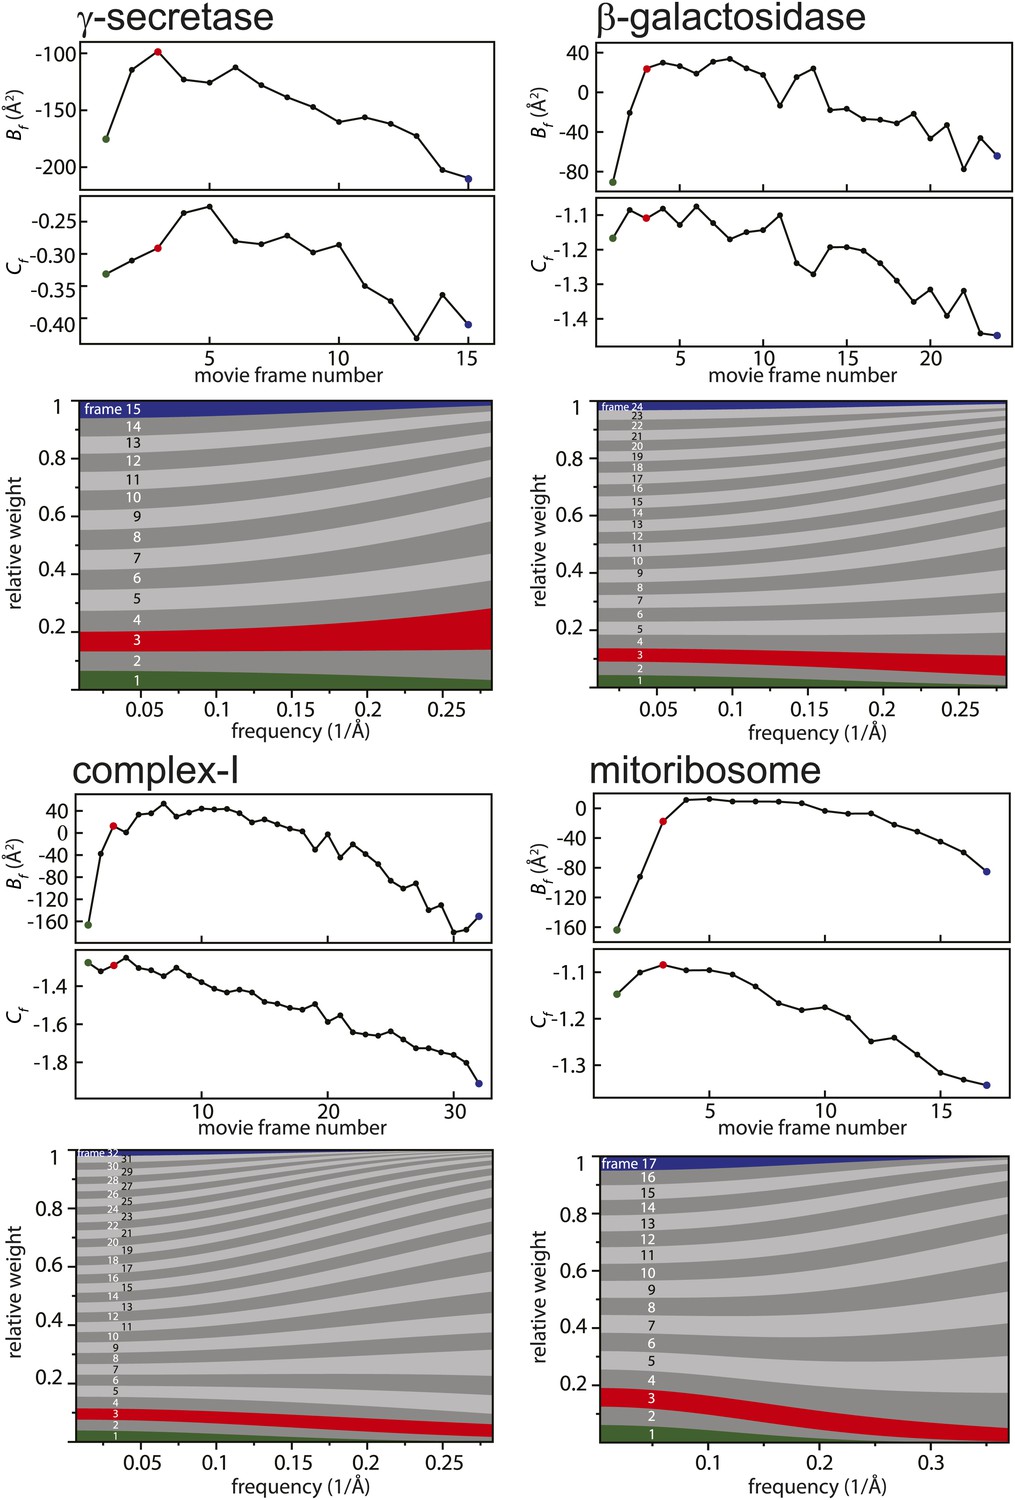
Radiation-damage weighting.
For each of the four test cases, estimated values for Bf and Cf (top) and the resulting frequency-dependent relative weights (bottom) are shown for all movie frames. The first, third, and last movie frames of each data set are highlighted in green, red, and blue, respectively. For these movie frames, the relative Guinier plots as described in the main text and the linear fits through them are shown in Figure 2—figure supplement 1. For example, in the γ-secretase case, the third movie frame has the least negative relative B-factor (Bf), and therefore this frame contributes the most of all movie frames to the weighted average at the high frequencies (and hence the red band gets broader towards the right-hand side of the relative-weight figure). In contrast, the first and last movie frames have much larger negative B-factors because they suffer from large initial beam-induced motion and radiation damage, respectively. Therefore, these movie frames contribute relatively little to the weighted average at the higher frequencies (and hence the green and blue bands decrease in width towards the right-hand side of the relative-weight figure). Because beam-induced motion and radiation damage affect the low frequencies to a much smaller extent, for the low frequencies all movie frames contribute more or less equally to the weighted average. Therefore, each band is more or less the same width on the left-hand side of the relative-weight figure, although the exact relative weights are dominated by Cf on this side of the plot.
Figure 2—figure supplement 1
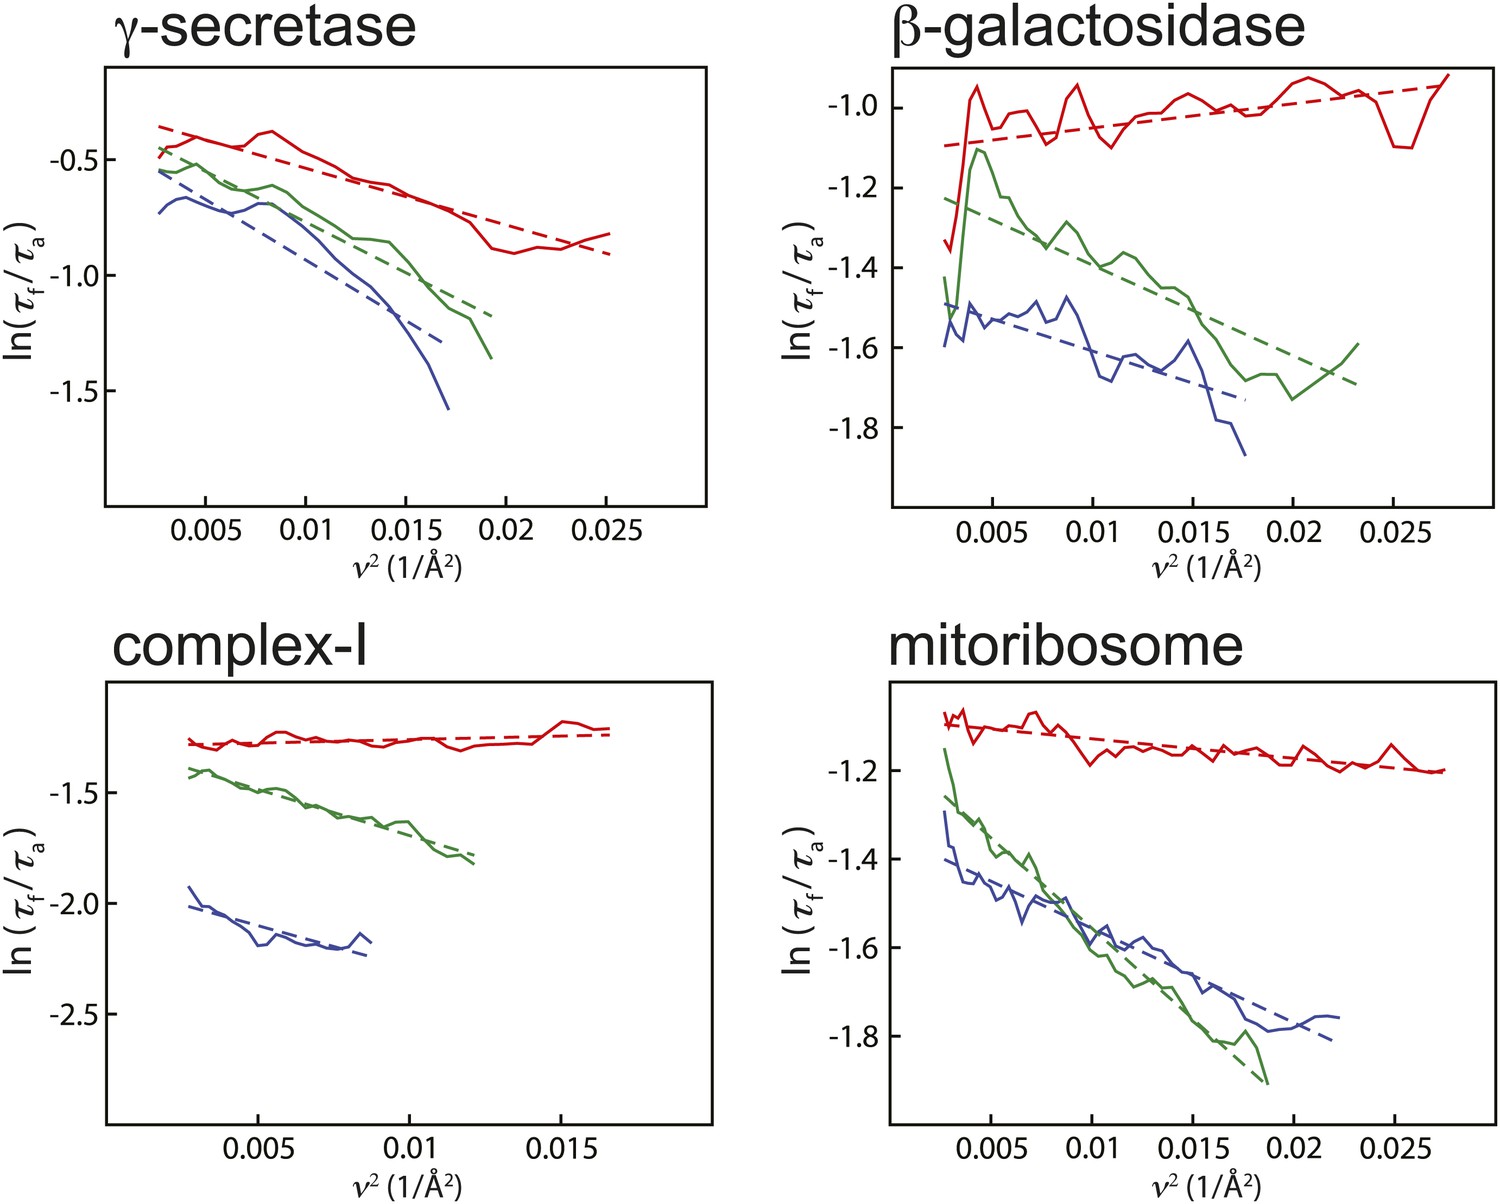
Relative Guinier plots (solid lines) and the linear fits through those (dashed lines) for the first, third, and last movie frames of each data set in green, red, and blue, respectively.
https://doi.org/10.7554/eLife.03665.005
Figure 3 with 1 supplement
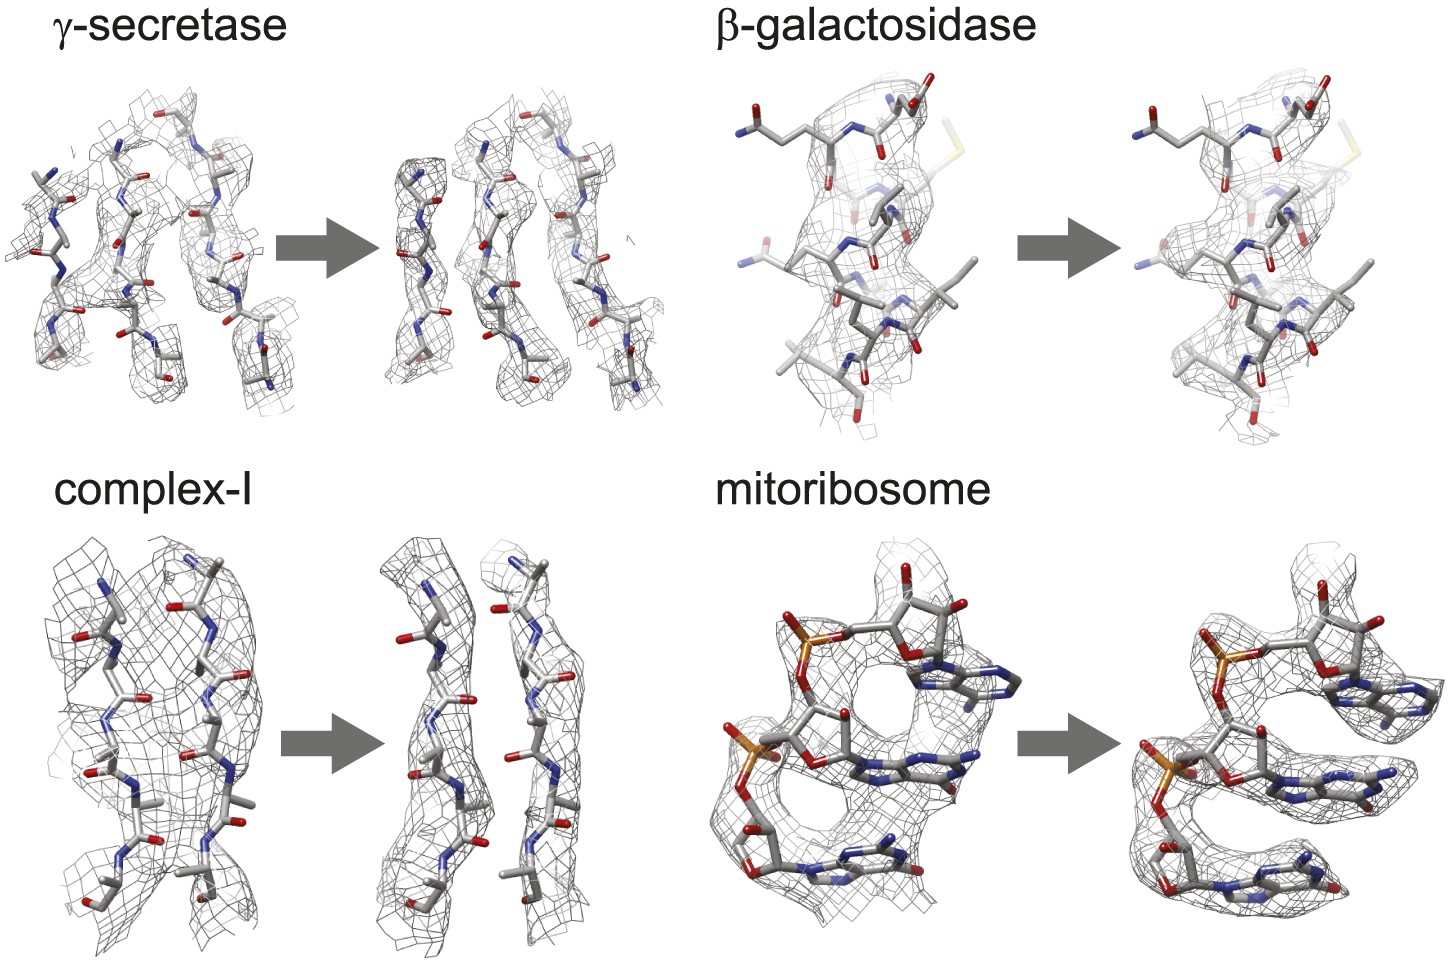
Map improvement.
Representative parts of the density maps for all four test cases before (left of the arrow) and after the new movie processing approach (right of the arrow).
Figure 3—figure supplement 1

The same part of the mitoribosome large sub-unit map as shown in Figure 3, but after application of the original movie processing approach, as described in Bai et al. (2013).
https://doi.org/10.7554/eLife.03665.007Tables
Table 1
Overview of the results
| γ-Secretase | β-Galactosidase | Complex-I | Mitoribosome large sub-unit | |
|---|---|---|---|---|
| Molecular mass (MDa) | 0.17* | 0.45 | 1.0 | 1.9 |
| Data set characteristics | ||||
| Sample support | Quantifoil R1.2/1.3 | Quantifoil R1.2/1.3 | Quantifoil R0.6/1 | Quantifoil R2/2 continuous carbon |
| Microscope | Titan Krios | Polara | Titan Krios | Titan Krios |
| Detector | K2-Summit | Falcon-II | Falcon-II | Falcon-II |
| Pixel size (Å) | 1.76 | 1.77 | 1.71 | 1.34 |
| No. movie frames | 15 | 24 | 32 | 17 |
| Exposure time (s) | 15 | 1.5 | 1.9 | 1 |
| Electron dose (e−/Å2) | 37 | 24 | 32 | 25 |
| No. particles | 144,545 | 34,032 | 45,618 | 47,114 |
| Prior to movie processing | ||||
| Resolution (Å) | 4.9† | 4.3 | 5.9 | 3.9 |
| B-factor (Å2) | −119† | −107 | −170 | −85 |
| Original movie processing | ||||
| Running average frames | 7 | 7 | 7 | 5 |
| CPU time (hr) | 3720 | 690 | 16,060 | 8030 |
| Resolution (Å) | 5.4 | 4.4 | 5.7 | 3.23 |
| B-factor (Å2) | −199 | −166 | −228 | −76 |
| New movie processing | ||||
| Running average frames | 7 | 7 | 7 | 5 |
| σNB | 300 | 300 | 200 | 100 |
| CPU time (hr) | 940 | 470 | 5960 | 1300 |
| Resolution (Å) | 4.5 | 4.0 | 4.8 | 3.3 |
| B-factor (Å2) | −85 | −95 | −143 | −54 |
-
*
The molecular mass of γ-secretase is 170 kDa of protein, plus 60 kDa of disordered glycosylation. The density for the glycosylation was not visible in the electron microscopy map.
-
†
As also explained in the main text, the γ-secretase images were first subjected to the movie processing algorithm of Li et al. (2013). The resolution and B-factor reported here are after application of that algorithm, but before the original or the new particle-based approach.
Download links
A two-part list of links to download the article, or parts of the article, in various formats.
Downloads (link to download the article as PDF)
Open citations (links to open the citations from this article in various online reference manager services)
Cite this article (links to download the citations from this article in formats compatible with various reference manager tools)
Beam-induced motion correction for sub-megadalton cryo-EM particles
eLife 3:e03665.
https://doi.org/10.7554/eLife.03665


