A neural circuit mechanism for regulating vocal variability during song learning in zebra finches
- Harvard University, United States
Figures
Figure 1
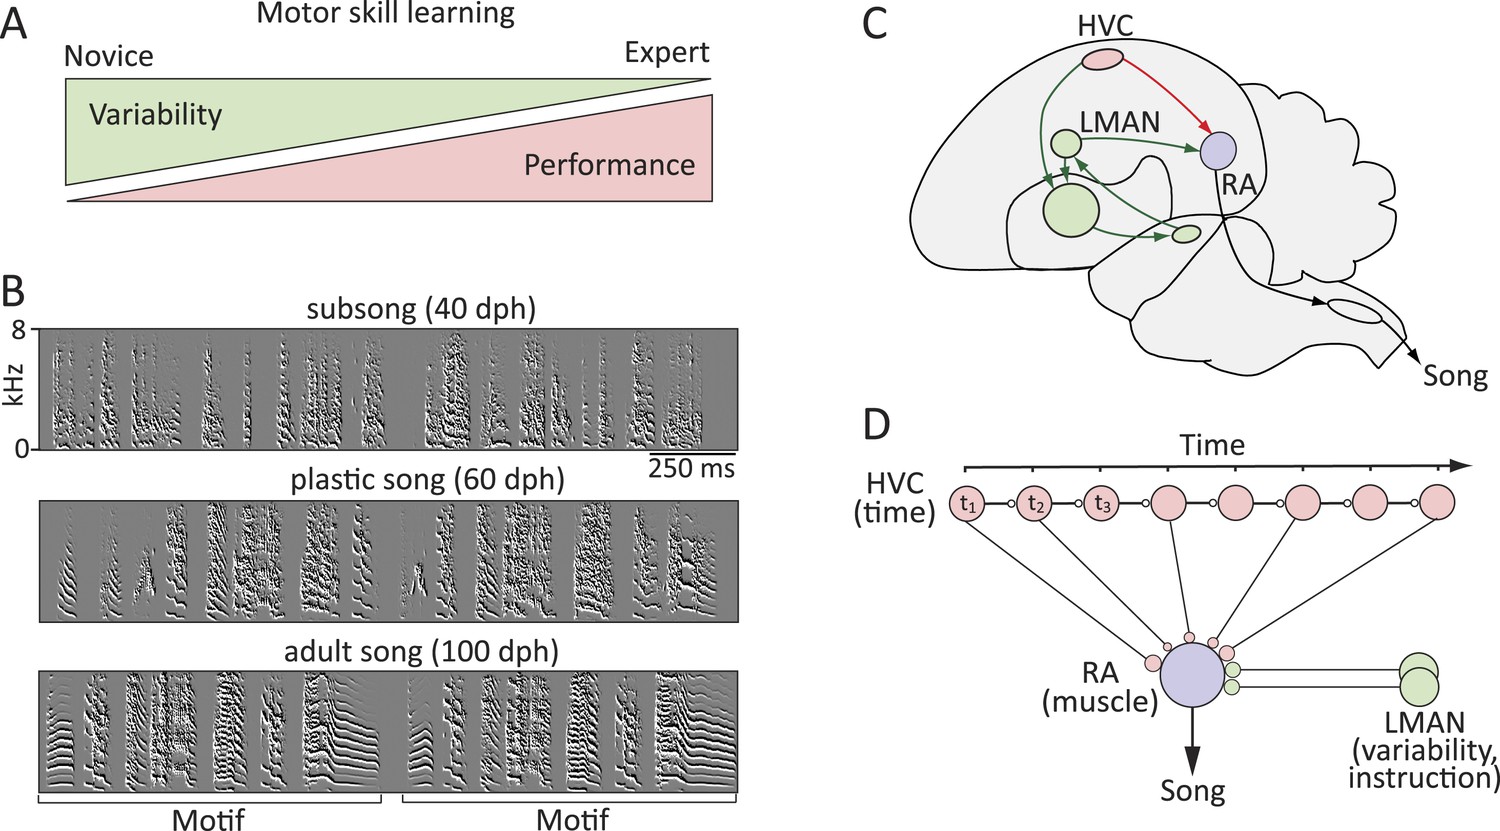
Probing the neural mechanisms underlying the regulation of motor variability in songbirds.
(A) A strong coupling between performance improvements and variability reduction is a hallmark of most forms of motor skill learning. (B) Spectral derivatives of songs from a single zebra finch at different stages of song learning (dph-days post hatch) show a reduction in vocal variability as a function of learning. (C) The neural circuits associated with the acquisition and execution of song. HVC (red) and RA (purple) constitute the cortical part of the vocal motor pathway (VMP) and control the learned song; the anterior forebrain pathway (AFP, green), is essential for inducing vocal variability and guiding the song learning process. (D) Presumed functional organization of the motor pathway in which HVC represents time in the song (t) in the form of a synaptic chain network and RA neurons control specific muscles. Learning in the motor pathway is thought to be driven by plasticity in RA that is guided by input from LMAN, the output of the AFP.
Figure 2
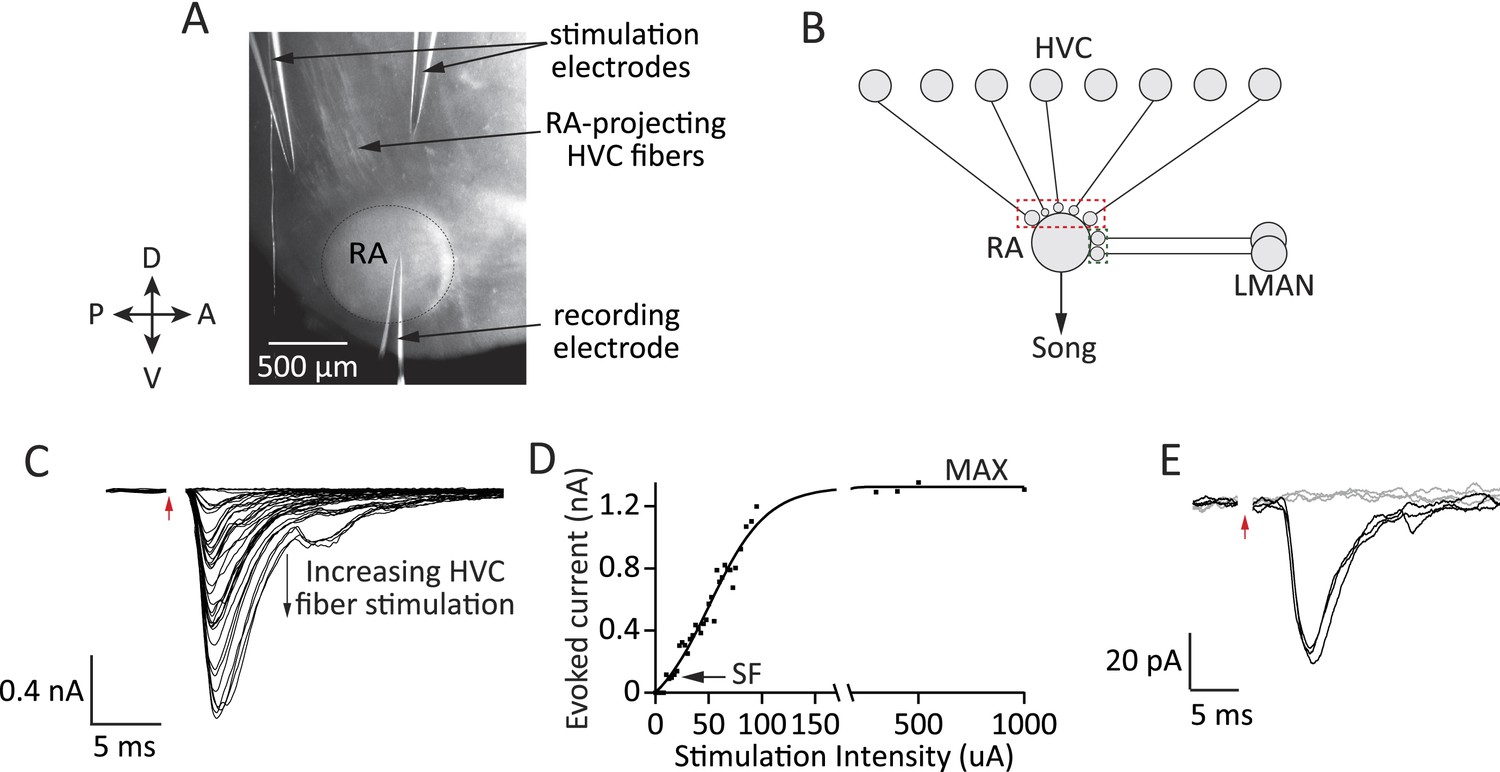
Experimental approach for probing inputs to RA projection neurons from LMAN and HVC during different stages of song development.
(A) Bright-field image of an acute brain slice encompassing RA and incoming fibers from HVC (parasaggital slice). The fibers are stimulated and evoked currents from RA projection neurons recorded in voltage clamp. (B) Using different slices we can interrogate the number and strength of HVC (red) and LMAN (green) inputs to RA projection neurons. (C–D) Increasing the stimulation intensity activates increasingly more input fibers, allowing us to measure single fiber (SF) currents and maximal (MAX) currents. Examples of HVC fiber-evoked currents in a plastic-song bird. (E) Single fiber currents were measured at stimulus intensities that produced both failures (grey traces) and evoked EPSCs of reliable amplitude (black traces, see also ‘Materials and methods’). Data from stimulating a putative single HVC fiber in a plastic-song bird. In C and E, red arrow denotes time of stimulation. Stimulus artifacts removed.
Figure 3
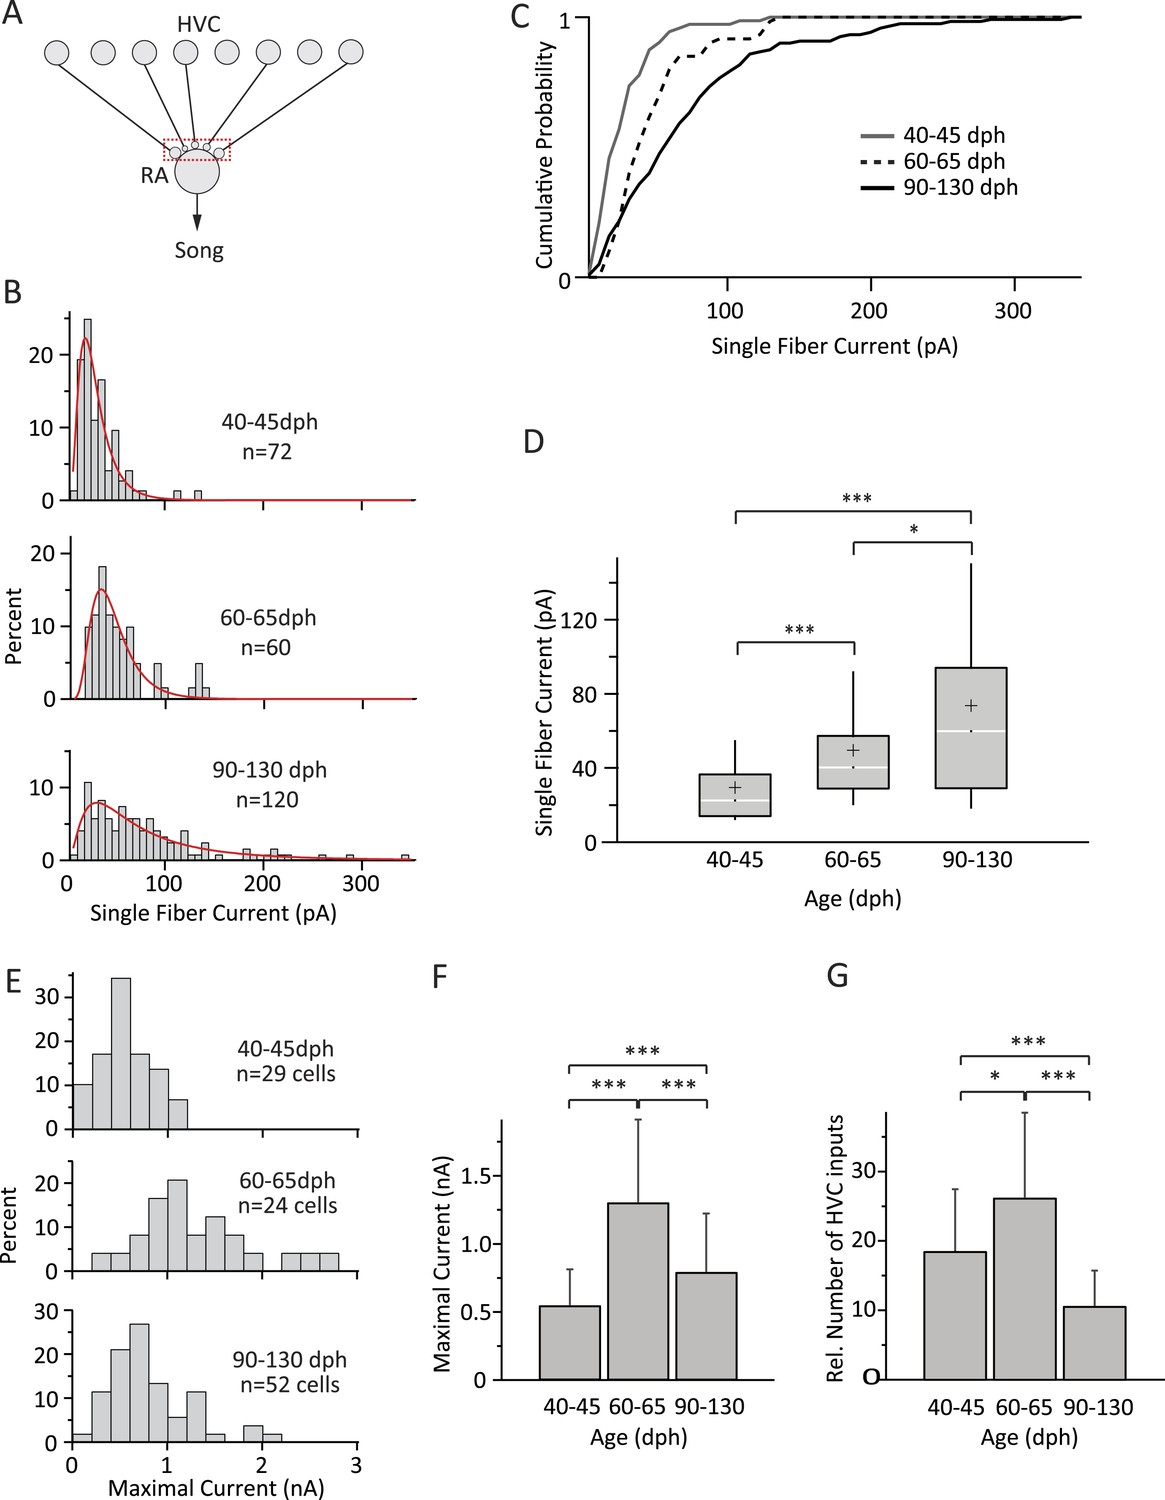
Inputs from HVC to RA neurons change throughout song development.
(A) Schematic highlighting the inputs being probed (red box). (B) Distributions of SF currents for the three age groups tested. Red line represents the log-normal fit to the data (‘Materials and methods’). (C) Cumulative SF current distributions. (D) Box and whisker plots showing the median (white line), IQR (grey box), mean (+), and the 10th and 90th percentile of the SF current distributions (whiskers). (E) Distributions of MAX currents for the three age groups. (F) Average MAX currents. (G) Average number of HVC inputs to an RA projection neuron in our slice preparation. Error bars in F and G denote standard deviations.
Figure 4
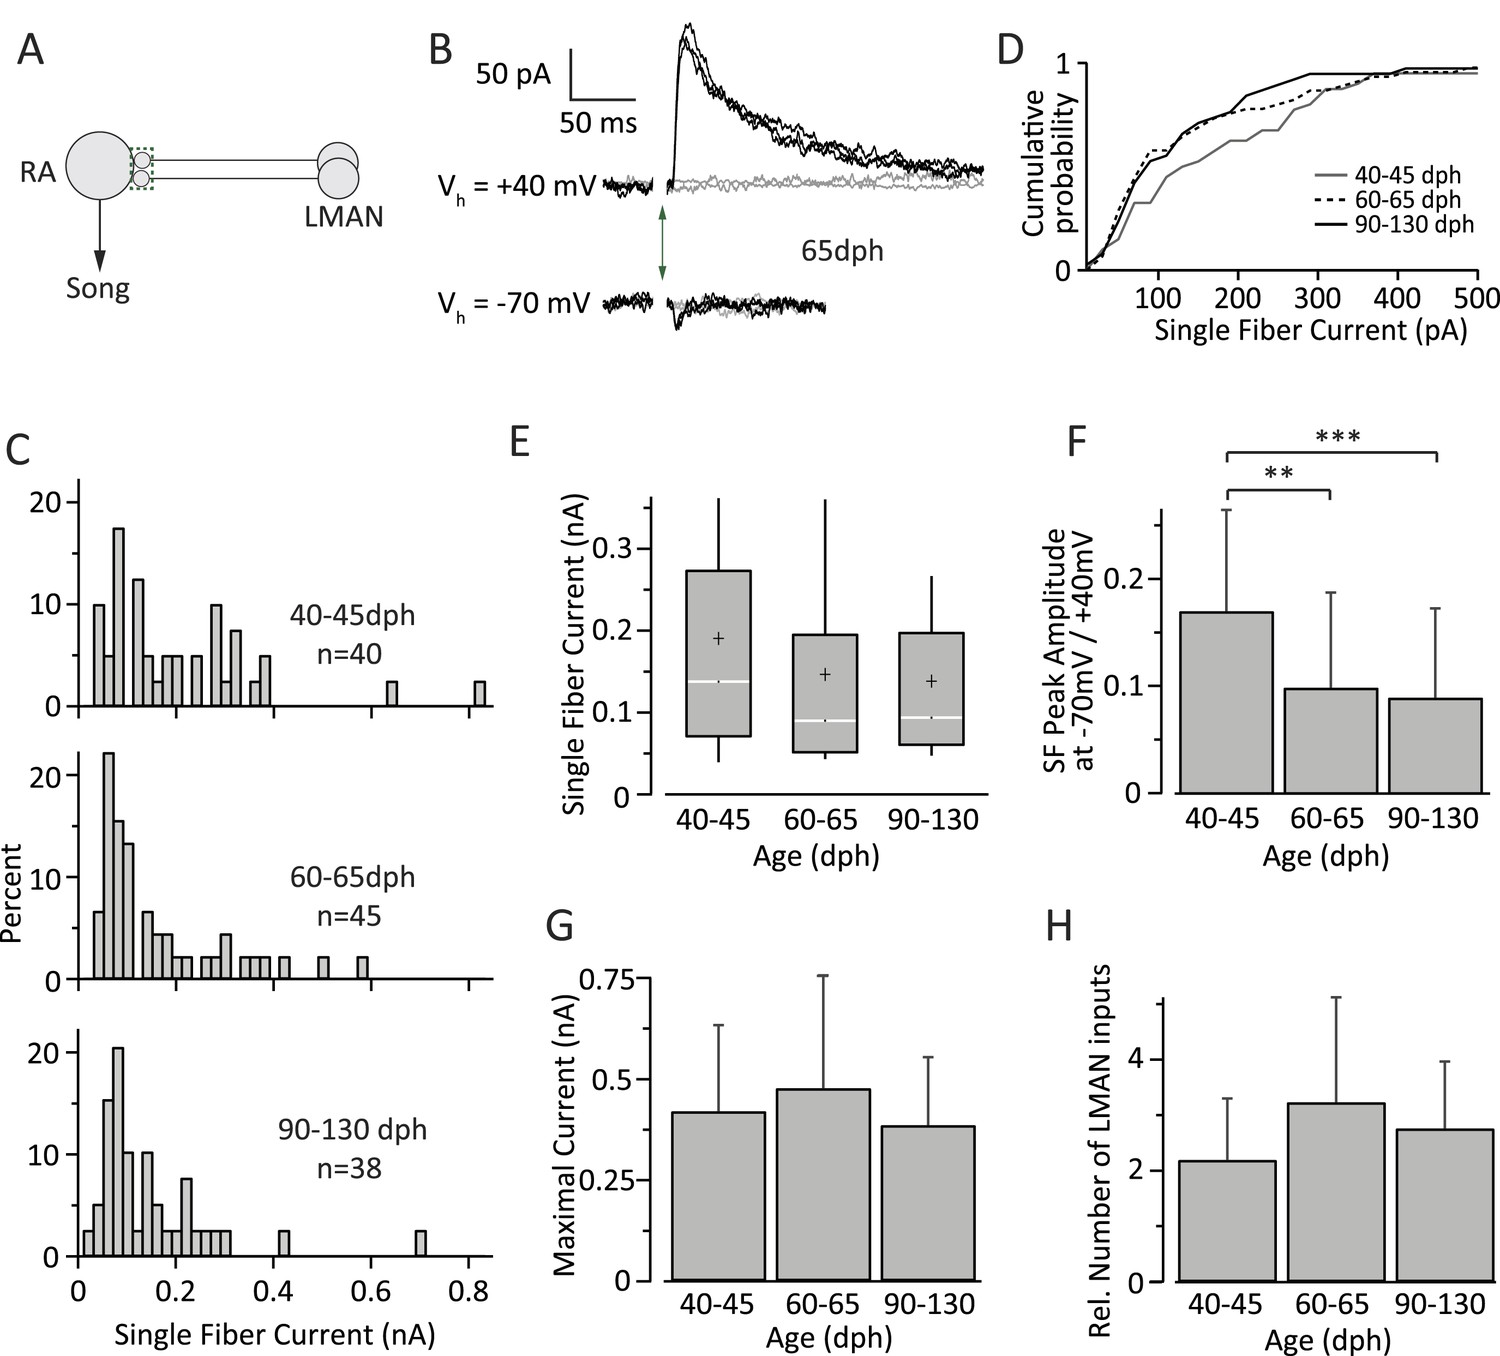
Inputs from LMAN to RA neurons remain largely unchanged throughout song development.
(A) Schematic highlighting the inputs being probed (green box). (B) Currents evoked in response to stimulating the LMAN fiber tract with an intensity resulting in either failures (grey) or EPSCs of consistent amplitudes (black). Top: at a holding potential (Vh) of +40 mV, where both AMPA- and NMDA receptor-mediated currents are measured. Bottom: holding potential of −70 mV, where AMPAR-mediated currents dominate. Stimulus artifacts removed. (C) Distributions of SF currents at Vh = +40 mV for the three age groups tested. (D) Cumulative SF current distributions. (E) Box and whisker plots showing the median (white line), IQR (grey box), mean (+), and the 10th and 90th percentile of the SF current distributions (whiskers). (F) The mean ratio of SF currents evoked at Vh = +40 mV (AMPA and NMDA receptor mediated) and −70 mV (AMPAR mediated). (G) Average MAX currents. (H) Average number of LMAN inputs to an RA projection neurons in our slice preparation. Error bars in F, G, and H denote standard deviations.
Figure 5

Intrinsic properties of RA projection neurons do not change significantly with song development.
(A) To test intrinsic excitability of RA neurons as a function of age we injected current into RA cells and measured the membrane voltage in current clamp. (B) Membrane voltage in an RA projection neuron as a function of injected current. Example shown is from a 60 dph bird. (C) Average instantaneous firing frequency (IFF) throughout the 0.5-s current injection for the cell in B (n = 3 current sweeps). Traces correspond to differing intensities of injected current (−0.2–2 nA in increments of 0.2 nA). (D) Average IFF during the initial (FI) and final (FF) 5 ms of the current injection for the cell in B. (E) Spike frequency adaptation (FI/FF) in RA neurons for the three age categories as a function of stimulation intensity (n = 9 cells from subsong, 9 from plastic-song, and 10 from adult birds). (F) F-I curves for the same population of RA neurons as in E. p > 0.1 for all pairwise comparisons across age categories of the slope of the linear portion of the F-I curve.
Figure 6

A simple model relates strengthening and pruning of connections in a motor control network (here: HVC-RA) to reduced motor variability.
(A) Top: the early phase of song learning is characterized by high vocal variability (left panel). This is associated with relatively larger number of weaker inputs from HVC to RA neurons (middle panel). A simple model of this circuit organization (‘Materials and methods’), in which RA neurons integrate input from precise HVC time-keeper neurons and variable LMAN neurons, produces variable firing patterns in RA (right panel). Bottom: song learning is associated with a strengthening and pruning of HVC-RA connections and a concomitant decrease in song variability. Pruning the relative number of active HVC-RA inputs in our model while strengthening the remaining ones (middle panel) dramatically decreases the variability in song-related RA firing (right panel). The simulations of RA spike trains were done using model parameters consistent with our experimental data from age groups 2 (top, plastic song) and 3 (bottom, crystallized song), respectively. Note that the simulations for the two neurons are independent (i.e., the ‘older’ is not derived from strengthening and pruning connections of the ‘younger’). See ‘Materials and methods’ for further details. (B) The average cross-correlation (CC) between spike trains during different ‘song’ renditions of the simulated RA neuron increases with the degree of strengthening and pruning of HVC-RA synapses. The open circles correspond to the age groups 2 and 3 in our data set. Solid black line represents simulations using ‘standard’ model parameters chosen to conform to our experimental data (see ‘Results’, Figures 3–5, and ‘Materials and methods’). Dashed lines show simulations where inputs from HVC were either only strengthened (red) or pruned (blue), relative to the ‘standard’ model at age group 2. The x-axis (bottom labels) shows the fraction of active HVC inputs to RA (‘Materials and methods’), as well as the average strength of HVC inputs (top labels). (C–E) Effects on variability in RA firing from: (C) strengthening/weakening LMAN input by up to 50%, (D) changing NMDA:AMPA ratio at the LMAN-RA synapse, and (E) changing the gain (F-I relationship) of the RA neuron. All changes are relative to the ‘standard’ model (black lines) in ‘B’. (F–H) Effects on variability in RA firing stemming from changes to LMAN firing patterns. Changes are relative to the ‘standard’ model (black lines). (F) Different LMAN spike trains tested in our model (for 50 ‘song renditions’). Top: Poisson spike train. Middle: Poisson spike train with 30% of the spikes in the form of Poisson bursts (see ‘Materials and methods’). Bottom: time-varying Poisson firing. Blue curve shows the average instantaneous firing rate as a function of time in song with 50% modulation compared to the baseline rate. (G) Effect of altering the burstiness of LMAN neurons. Here, Poisson burst were added to the normal Poisson spike train. (H) Effect of increasing the song-locking of LMAN firing.
Author response image 1
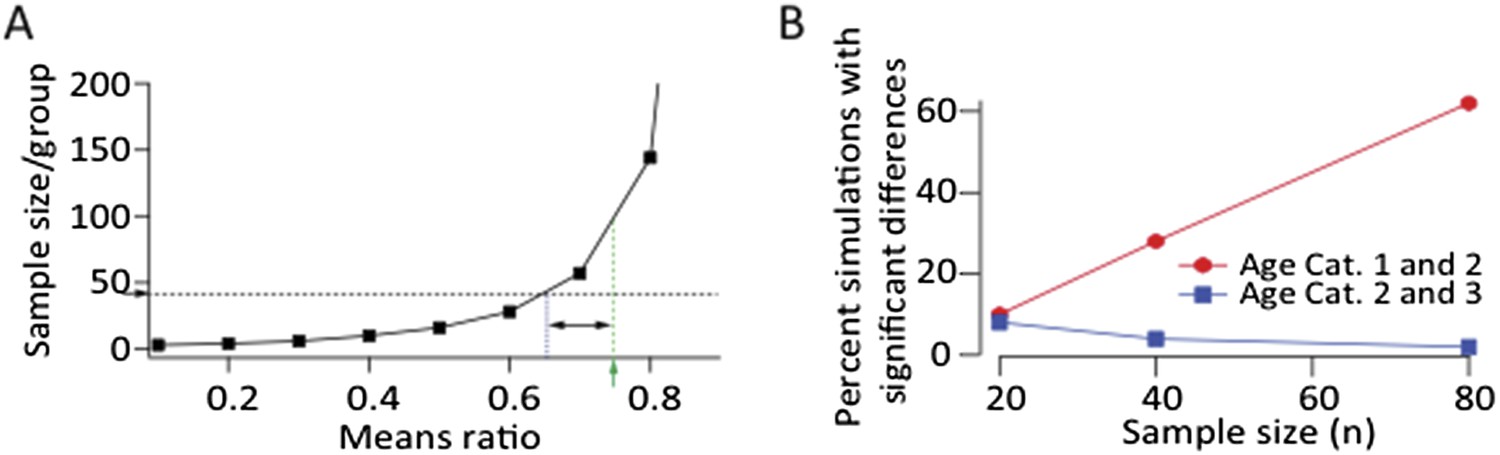
A. Power calculation showing required sample size as a function of effect size to demonstrate significance at p<0.05 level with a power>0.8 assuming log‐normal distributions and a CV of 0.88 (from LMAN data). Green arrow and dashed line denote the means ratio (0.75) between age groups 1 and 2 in our LMAN dataset. Means ratio between age group 2 and 3 was 0.97. To power the experiments to detect a mean ratio of 0.75 would require ∼100 samples/group. Blue dashed line shows the means ratio we are currently powered to detect (0.65). B. Simulated experiments assuming log‐normal distributions (estimated from fits to our data). We drew randomly from the probability distributions for all three age groups and plotted the fraction of simulations that showed a statistically significant difference between age groups (p<0.05). These simulations show that increasing the sample size by a factor of two, assuming a means ratio of 0.75, may end up (with ∼60% probability) showing a statistically significant effect between age groups 1 and 2
Author response image 2
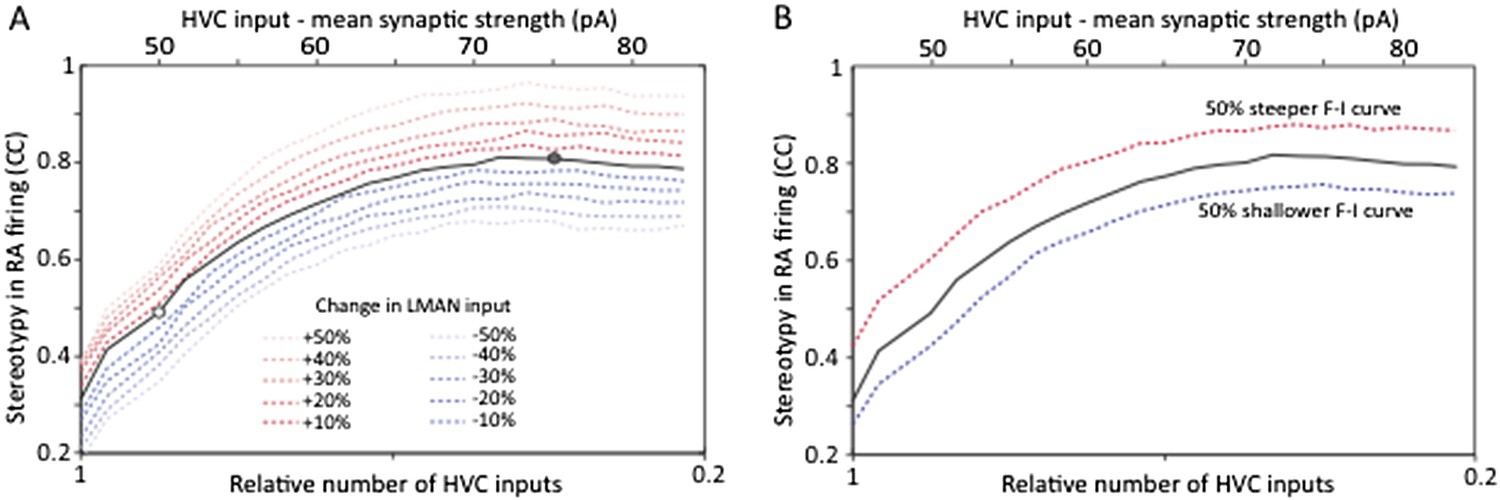
Strengthening and pruning of HVC‐RA synapses leads to reduced variability, and this trend is robust to changes in either LMAN input strength (A) or intrinsic properties or RA neurons (B). Both panels show average pair‐wise cross‐correlation (CC) between spike trains for different ‘song’ renditions in our model network. The x‐axis shows the mean synaptic strength of HVC input to RA (top) and the relative sparseness of HVC input to RA (bottom: 0 – all HVC neurons connect to the RA neurons, but weakly. 1 – a single, strong input from HVC). The model was parameterized to conform to the experimental data (white/grey circle denotes model parameters matching the observations in age groups 2 and 3, respectively). The strength of LMAN input was kept constant throughout. Tonic inhibition onto RA neurons was assumed proportional to the HVC drive. These parameters kept the firing rates of model RA neurons around 50 Hz, i.e. in their normal range during singing (Ölveczky et al., 2011). Note that the total drive from HVC to RA (which drives stereotyped firing) actually decreases as HVC inputs sparsen (LMAN, the variability inducing input stays the same). Thus, the reduced variability is due to a reorganization of HVC‐RA synapses, not a change in total input drive.
Author response image 3
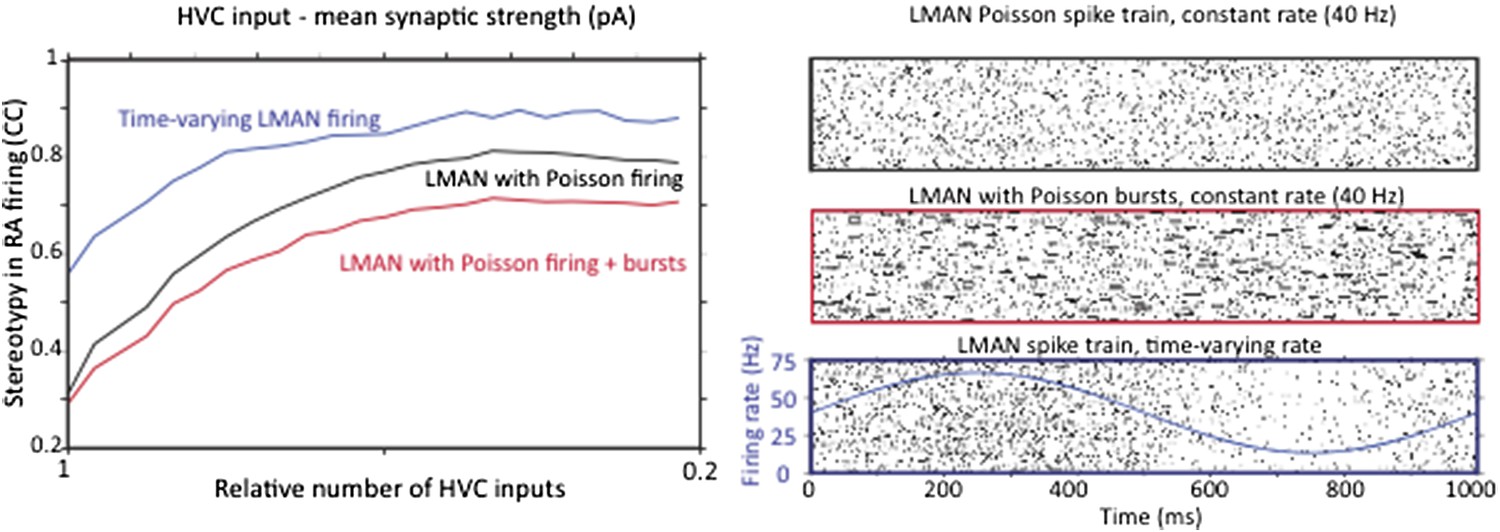
Strengthening and pruning of HVC input to RA causes a reduction in variability regardless of whether LMAN firing is Poisson, Poisson with added Poisson bursts, or time varying. A. Average pair‐wise cross‐correlation (CC) between spike trains during different ‘song’ renditions in our model network assuming LMAN input with different structure and statistics. B. LMAN spike trains for 100 ‘song renditions’ simulated using (top) a Poisson process of constant rate, (middle) a Poisson process with added Poisson bursting, and (bottom) a time‐varying Poisson process. Blue curve shows the time‐varying modulation in the firing rate of the Poisson process.
Author response image 4
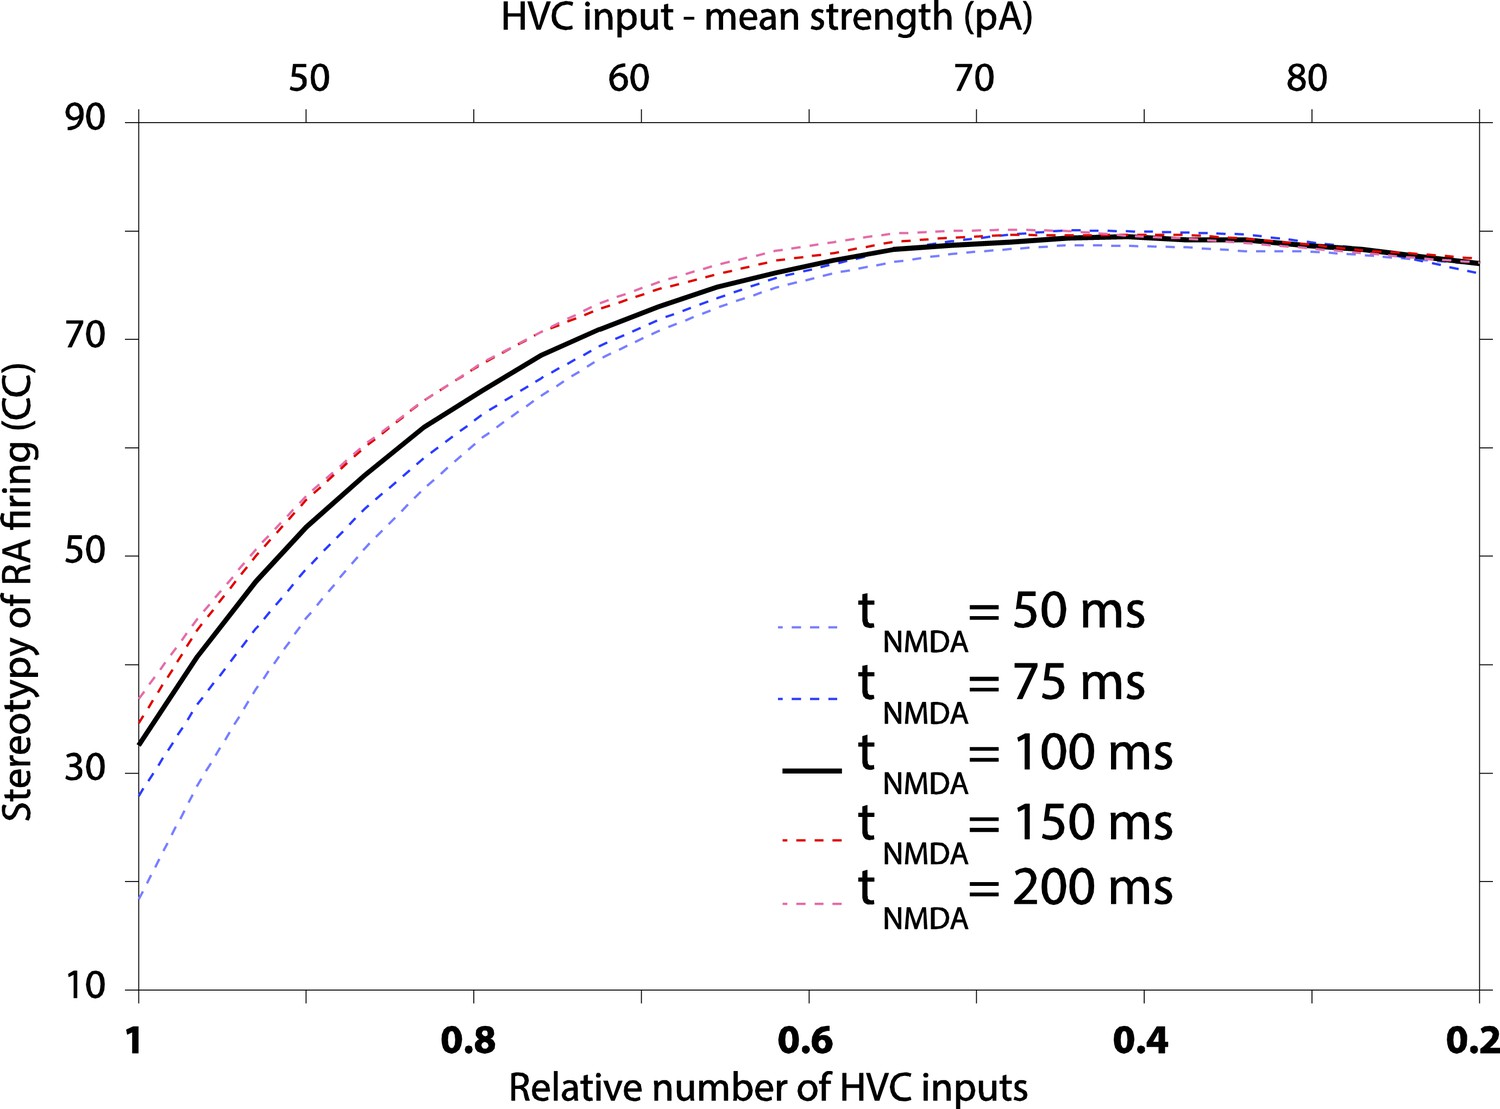
The effect of varying decay kinetics of NMDA currents in our model results in modest changes to RA variability, with longer time constants producing more stereotyped firing.
Tables
Table 1
HVC–RA synaptic properties
| Birds | Age (dph) | Input resistance (MΩ) | Capacitance (pF) | Spontaneous firing rate (Hz) | SF peak amplitude (pA) | SF CV | SF latency to peak (ms) | MAX peak amplitude (nA) | MAX CV | MAX latency to peak (ms) |
|---|---|---|---|---|---|---|---|---|---|---|
| Subsong Juvenile (24) | 40–45 | 135.84 ± 95.09 | 96.80 ± 22.77 | 6.74 ± 4.79 | 29.52 ± 2.58 | 0.30 ± 0.21 | 9.24 ± 2.94 | 0.53 ± 0.26 | 0.05 ± 0.04 | 8.57 ± 2.13 |
| (55) | (55) | (55) | (72) | (72) | (72) | (29) | (29) | (29) | ||
| Plastic-song Juvenile (23) | 60–65 | 123.95 ± 93.26 | 95.48 ± 27.47 | 7.25 ± 5.10 | 49.60 ± 3.92 | 0.19 ± 0.14 | 8.39 ± 2.54 | 1.31 ± 0.61 | 0.05 ± 0.04 | 7.47 ± 1.50 |
| (42) | (42) | (42) | (60) | (60) | (60) | (24) | (24) | (24) | ||
| *p < 0.001† | *p < 0.001* | *p < 0.001* | *p < 0.05 | |||||||
| Crystalized-song adult (39) | 90–130 | 105.80 ± 76.05 | 86.71 ± 24.92 | 7.95 ± 5.50 | 73.56 ± 5.49 | 0.18 ± 0.15 | 7.68 ± 2.84 | 0.80 ± 0.43 | 0.05 ± 0.04 | 7.08 ± 1.70 |
| (80) | (80) | (80) | (120) | (120) | (120) | (52) | (52) | (52) | ||
| *p < 0.05* | *p < 0.001† | *p < 0.001* | *p < 0.001* | *p < 0.001* | *p < 0.01* | |||||
| **p < 0.05† | **p < 0.001* |
-
Values are mean ± SD *Versus Subsong Juvenile; **versus plastic-song juvenile; statistically significant differences in bold.
-
*
Two-tail Student's t Test.
-
†
Wilcoxon Rank–Sum Test: used when one or more of the distributions under comparison were significantly non-parametric, as determined by the Kolmogorov–Smirnov.
Table 2
LMAN-RA synaptic properties
| Birds | Age (dph) | SF peak amplitude Vh = +40 mV (pA) | SF CV Vh = +40 mV | SF latency to peak Vh = +40 mV (ms) | Ratio SF peak amplitude at Vh = −70 mV to that at Vh = +40 mV | MAX peak amplitude Vh = +40 mV (nA) | MAX CV Vh = +40 mV | MAX latency to peak Vh = +40 mV (ms) | Ratio MAX peak amplitude at Vh = −70 mV to that at Vh = +40 mV |
|---|---|---|---|---|---|---|---|---|---|
| Subsong Juvenile (7) | 40–45 | 191.30 ± 162.24 | 0.10 ± 0.06 | 11.06 ± 3.90 | 0.17 ± 0.09 | 0.42 ± 0.21 | 0.08 ± 0.04 | 12.97 ± 1.71 | 0.32 ± 0.28 |
| (40) | (40) | (40) | (40) | (18) | (18) | (18) | (18) | ||
| Plastic-song Juvenile (13) | 60–65 | 147.41 ± 132.10 | 0.12 ± 0.05 | 10.66 ± 4.29 | 0.10 ± 0.09 | 0.48 ± 0.28 | 0.07 ± 0.05 | 11.56 ± 0.73 | 0.28 ± 0.21 |
| (45) | (45) | (45) | (45) | (18) | (18) | (18) | (18) | ||
| *p < 0.01* | |||||||||
| Crystalized-song adult (12) | 90–130 | 141.24 ± 126.40 | 0.10 ± 0.06 | 10.18 ± 4.20 | 0.11 ± 0.08 | 0.39 ± 0.17 | 0.05 ± 0.03 | 11.23 ± 3.38 | 0.30 ± 0.17 |
| (38) | (38) | (38) | (38) | (15) | (15) | (15) | (15) | ||
| *p < 0.001* | *p < 0.01* |
-
Values are mean ± SD *Versus Subsong Juvenile; **Versus plastic-song juvenile; statistically significant differences in bold.
-
*
Two-tail Student's t Test.
-
Wilcoxon Rank–Sum Test: used when one or more of the distributions under comparison were significantly non-parametric, as determined by the Kolmogorov–Smirnov test.
Download links
A two-part list of links to download the article, or parts of the article, in various formats.
Downloads (link to download the article as PDF)
Open citations (links to open the citations from this article in various online reference manager services)
Cite this article (links to download the citations from this article in formats compatible with various reference manager tools)
A neural circuit mechanism for regulating vocal variability during song learning in zebra finches
eLife 3:e03697.
https://doi.org/10.7554/eLife.03697


