Experimentally guided models reveal replication principles that shape the mutation distribution of RNA viruses
- University of California, San Francisco, United States
- University of Pennsylvania, United States
Figures
Figure 1
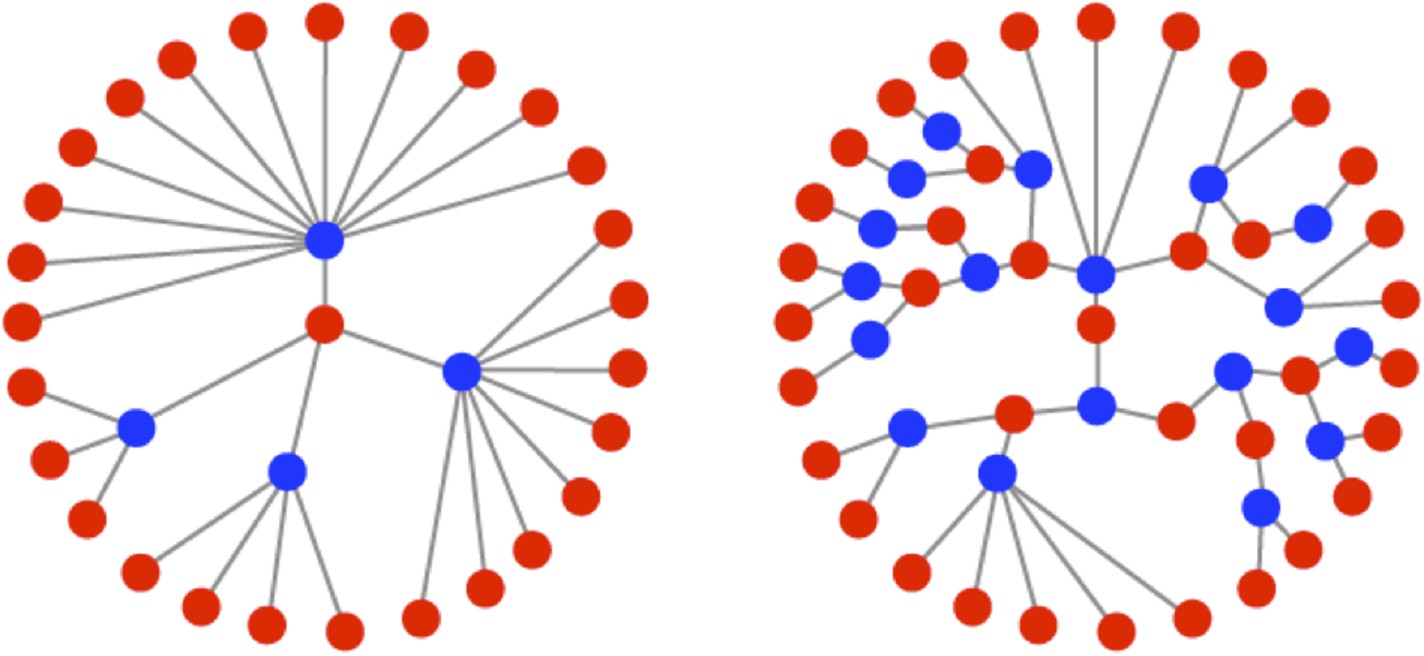
Illustrations of the genealogies of different replication modes.
Red dots indicate positive-sense strands. Blue dots indicate negative-sense templates. Stamping machine (SM) progeny are one generation from the initial infecting genome (left). In an example of geometric replication (GR), progeny are an average of 2.33 generations from the initial infecting genome (right).
Figure 2
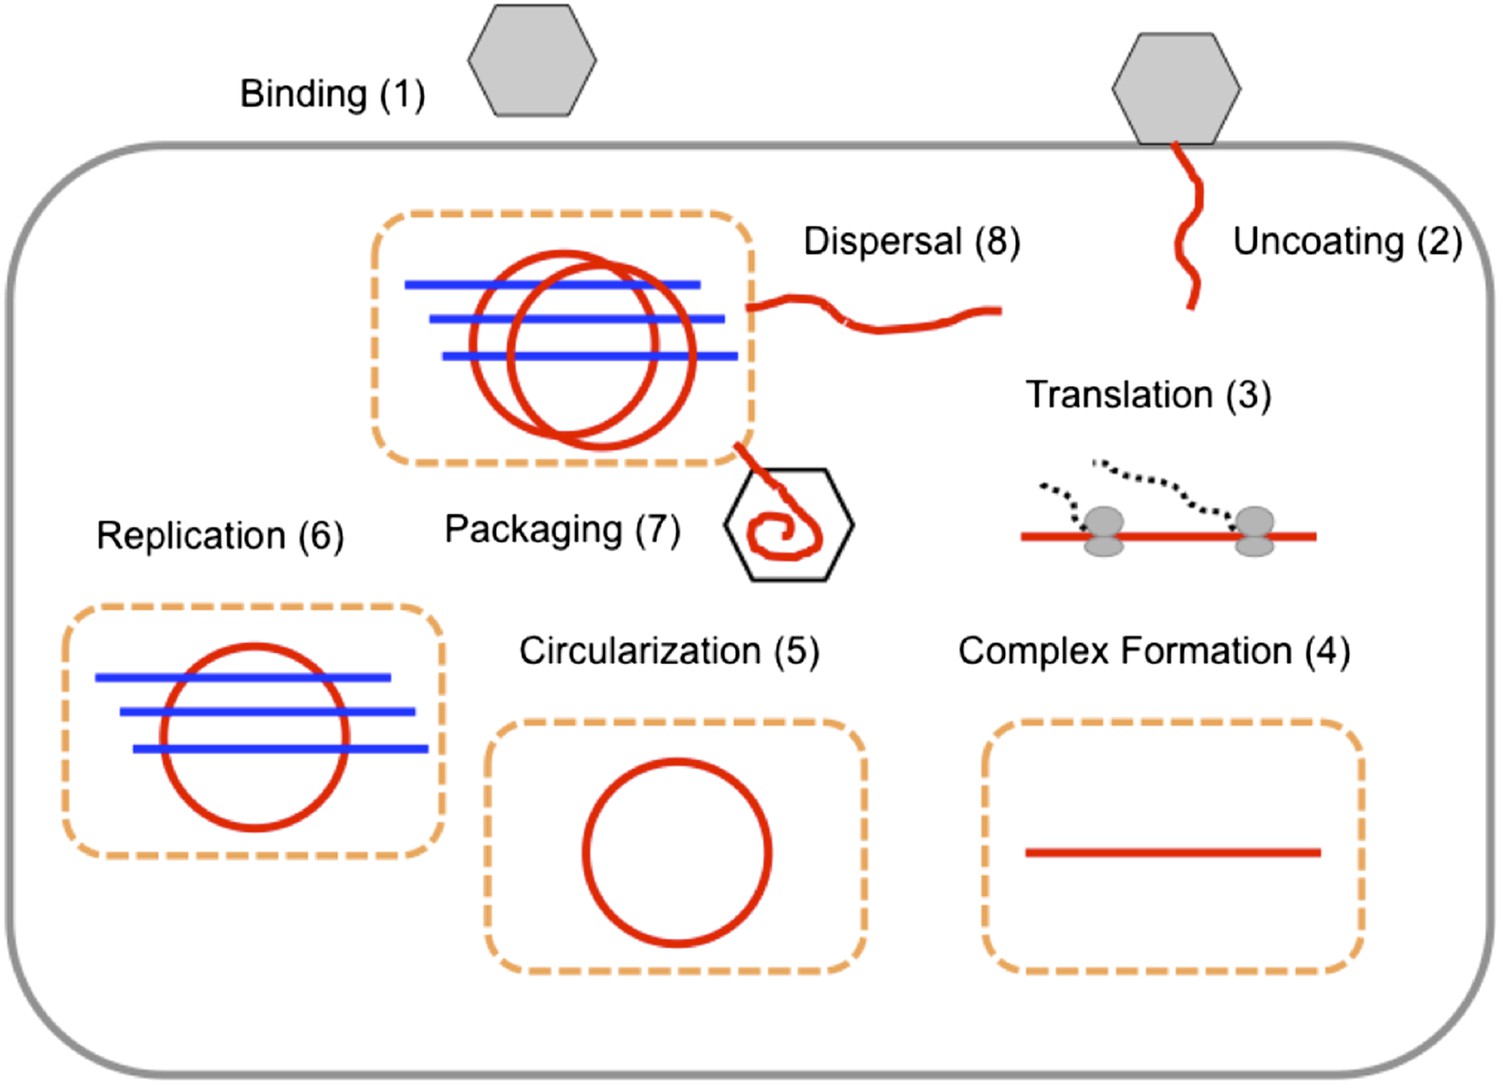
The replication cycle of poliovirus as represented in our model.
Numbered steps correspond to sections and equations in the ‘Materials and methods’.
Figure 3 with 1 supplement
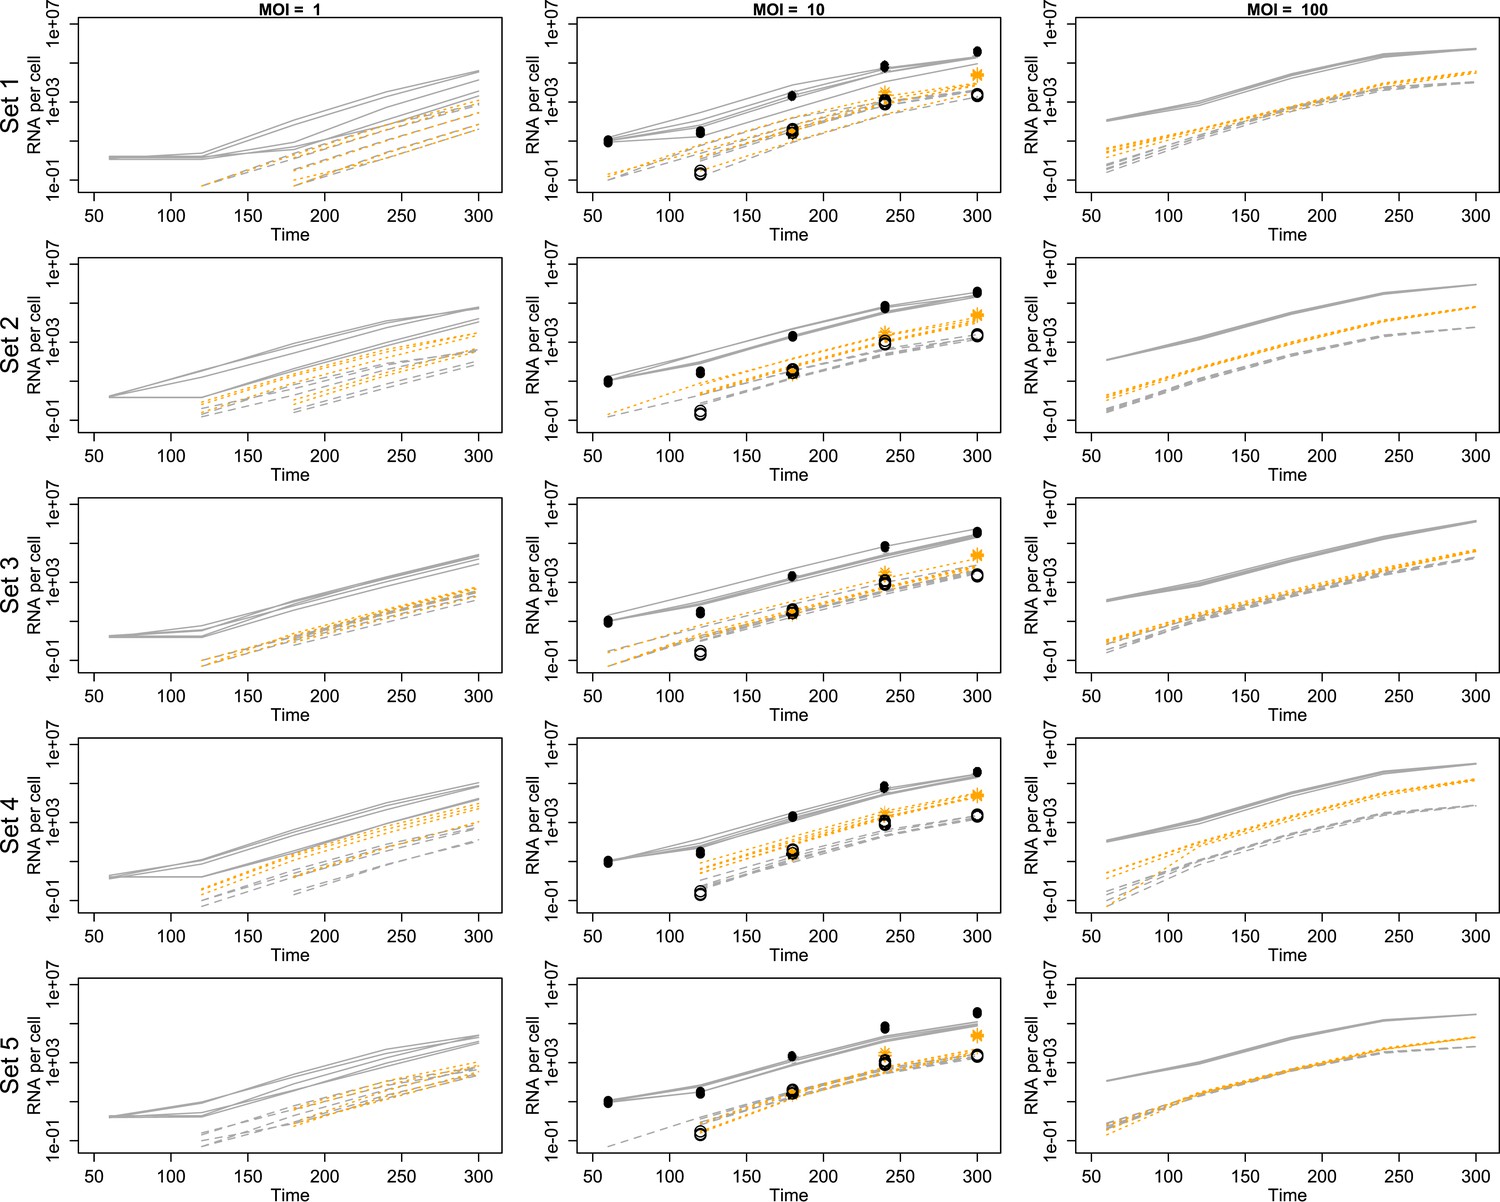
Projected mean abundances of positive-sense RNA (solid line simulations vs filled circle experimental measurements), negative-sense RNA (dashed line simulations vs hollow circle experimental measurements) and virions (orange dotted line simulations vs star experimental measurements; measured only for MOI = 10).
Each row represents a different example parameter set (see ‘Results’); each line is the mean of 20 individual cell simulations, and the means of five sets of 20 replicate simulations are plotted in each panel. Parameter values are given in Figure 3—source data 1.
-
Figure 3—source data 1
‘Best’ parameter set used in Figure 3—figure supplement 1, and Figure 4—figure supplement 4.
Representative parameter sets (sets 1–5) used in Figure 3. Note that natural log values are provided for all parameters except cstay.
- https://doi.org/10.7554/eLife.03753.006
Figure 3—figure supplement 1
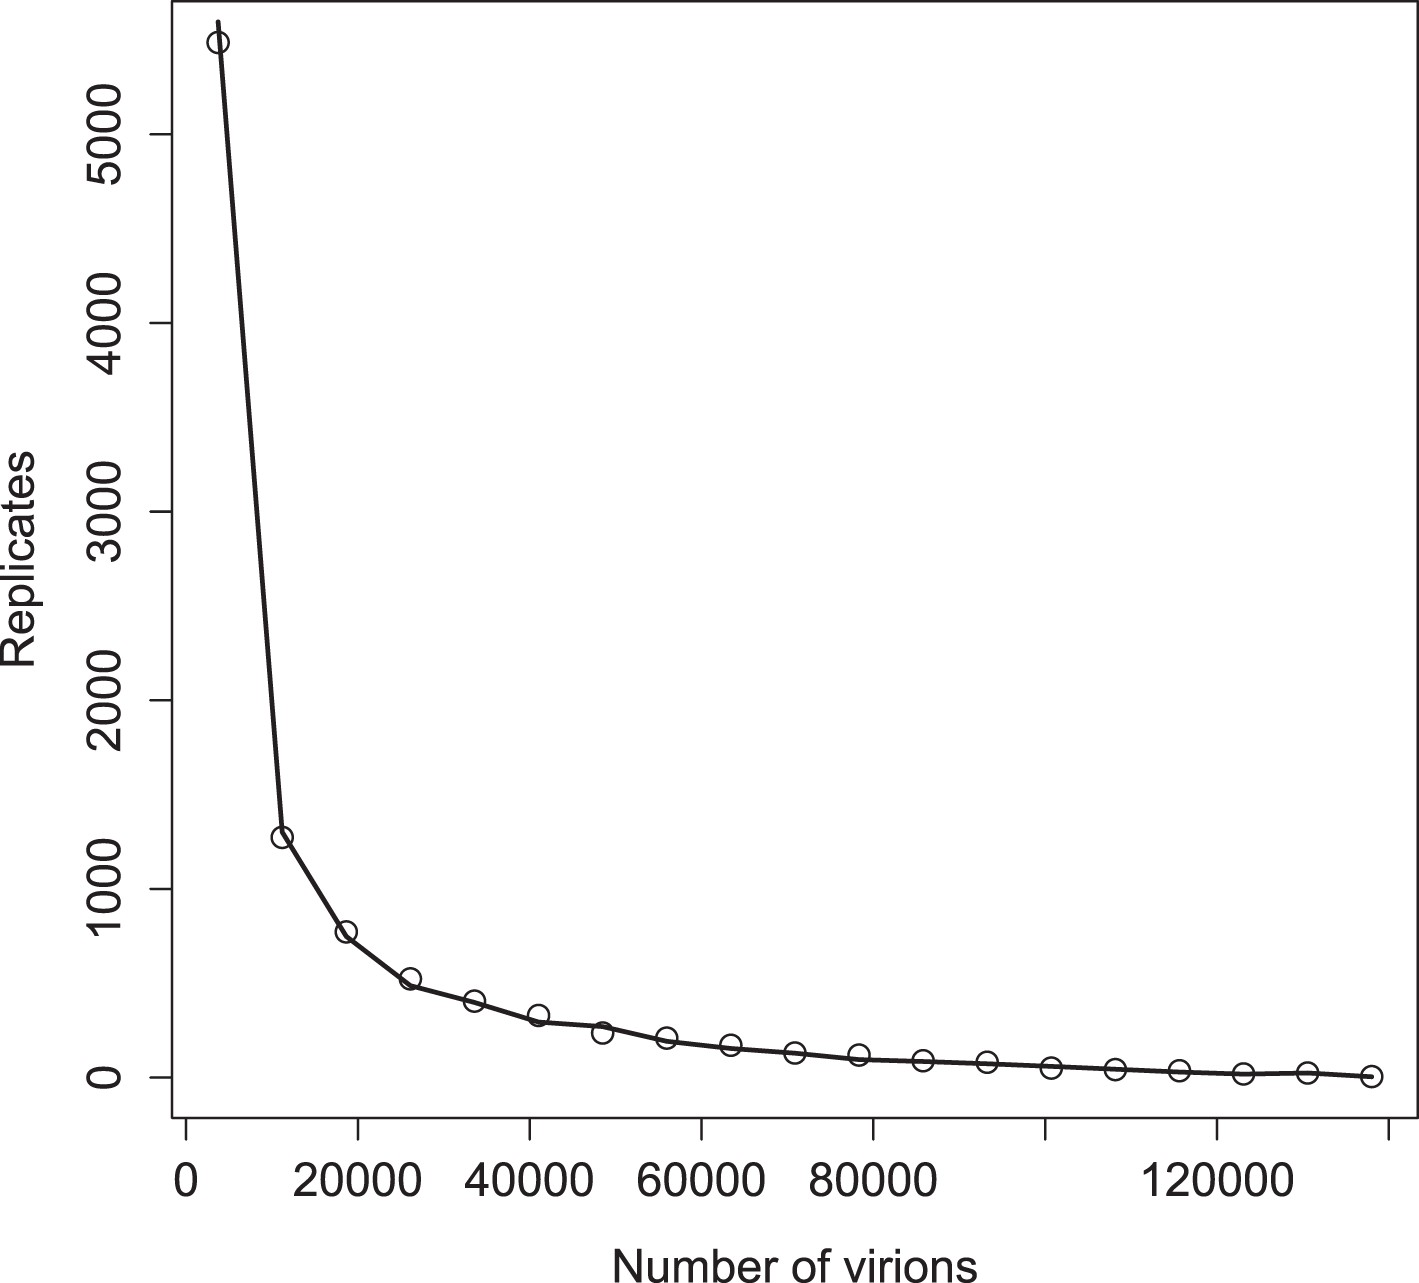
Distribution of virions in 10,000 replicates for simulations with (points) and without (line) a deterministic threshold for waiting times (see ‘Materials and methods’).
Parameter values are the ‘best’ set given in Figure 3—source data 1.
Figure 4 with 7 supplements

Left: posterior distribution of the mean number of generations of replication (). Right: distribution reweighted by the fit of predicted fractions of translating positive-sense RNA to empirical measurements.
Figure 4—figure supplement 1
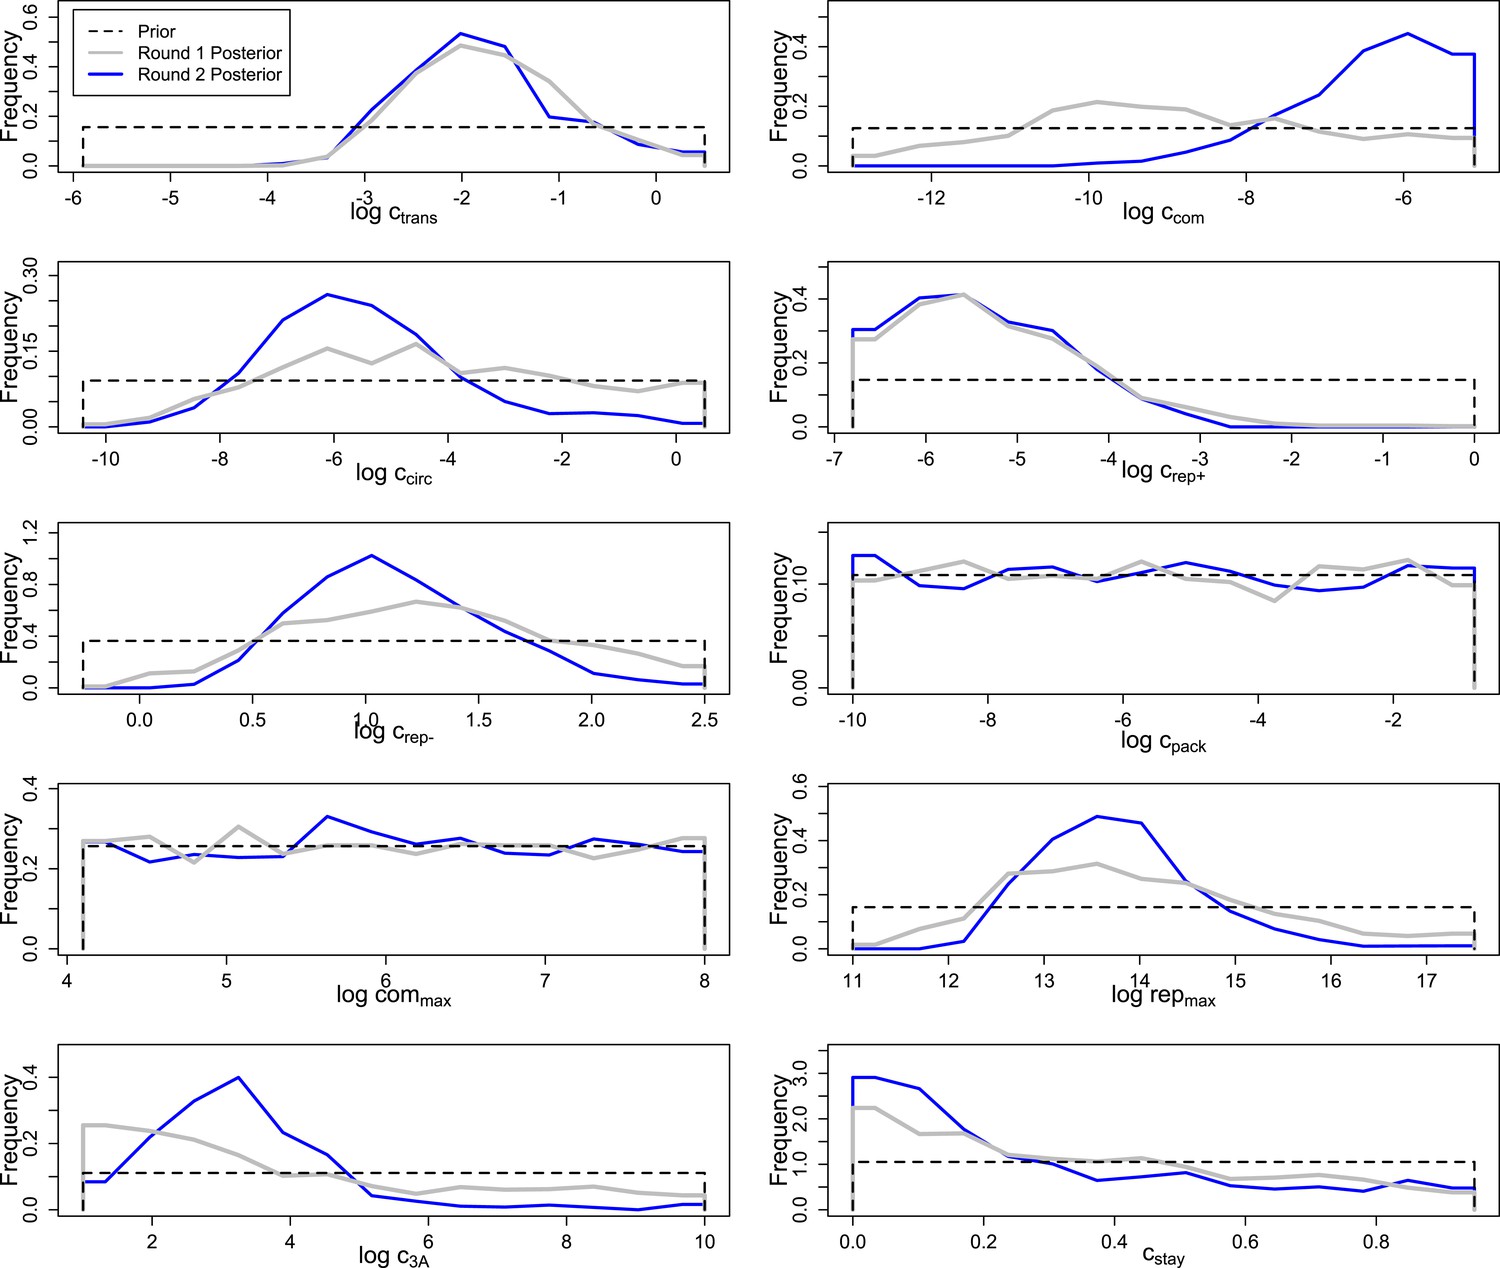
Prior and posterior distributions after each of two rounds of inference by Approximate Bayesian Computation.
Empirical posteriors for rounds one and two are based on 1000 and 1135 points, respectively, grouped into 15 bins.
Figure 4—figure supplement 2
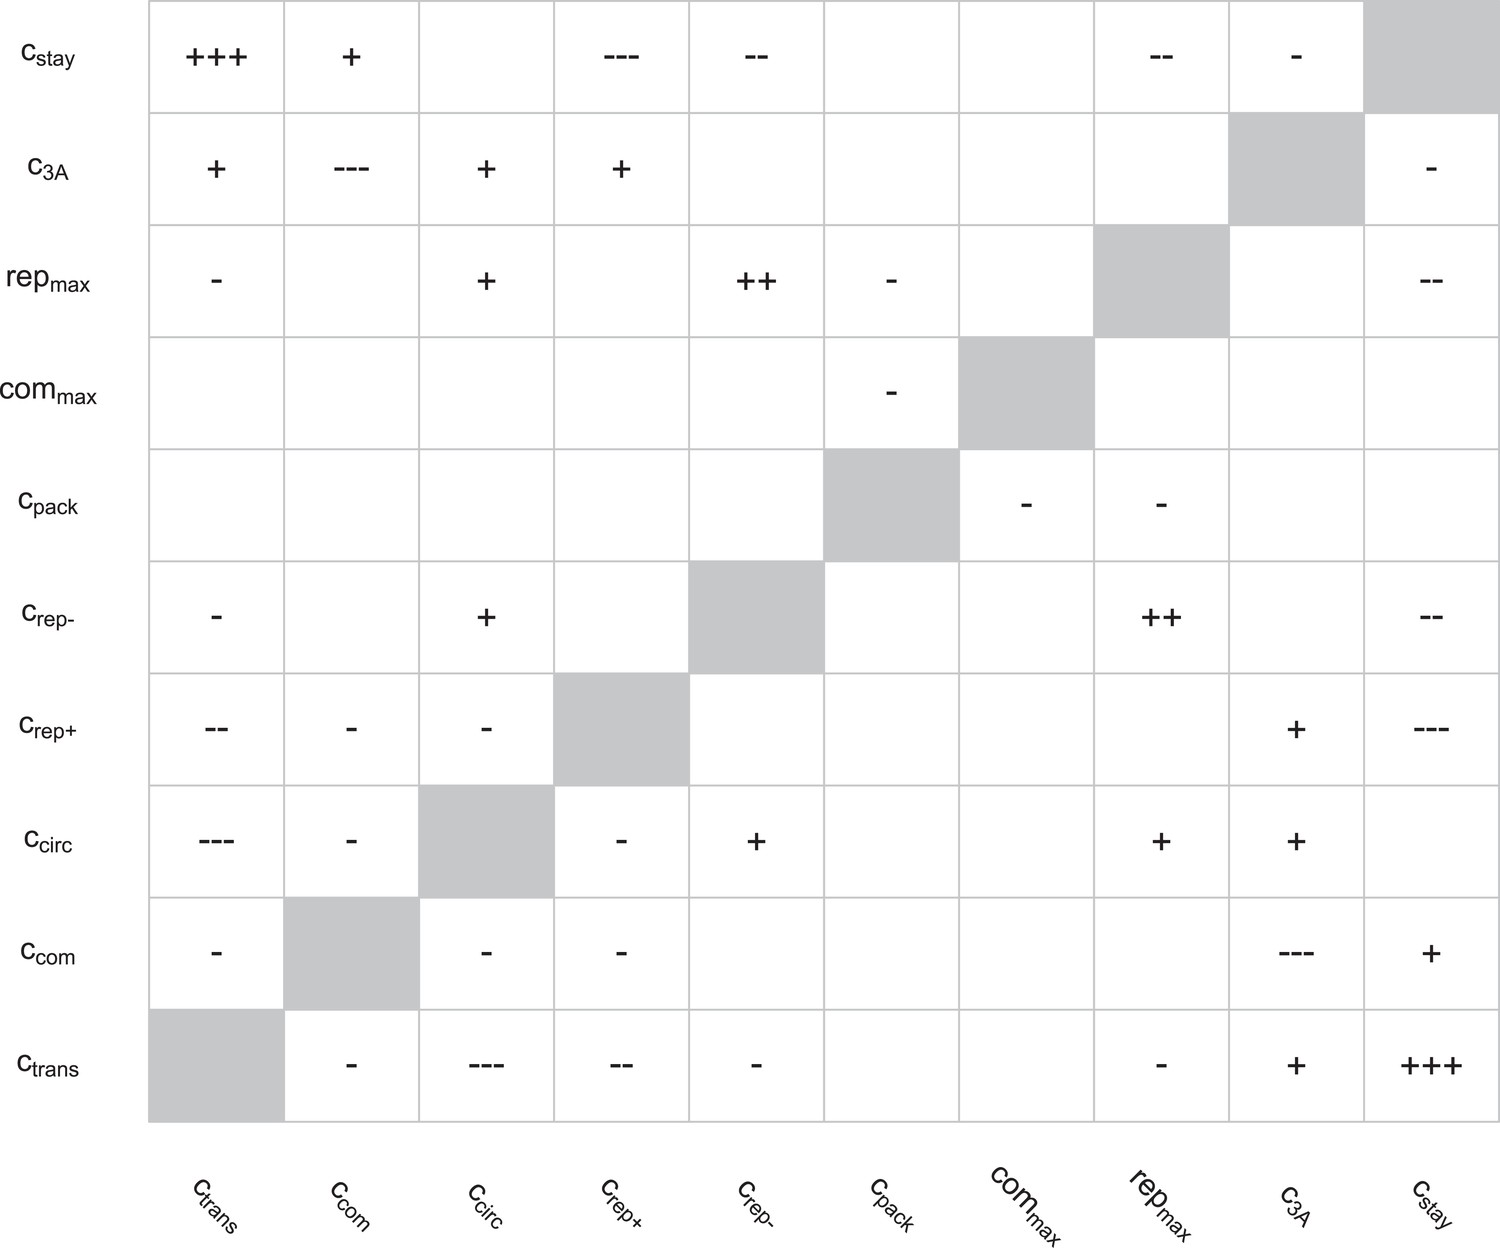
Correlations between parameters in the round two posterior.
Spearman rank correlations with magnitudes below 0.1 were ignored; those with magnitudes between 0.1 and 0.25 are noted as ‘+’ or ‘−’, those with magnitudes between 0.25 and 0.5 are noted as ‘++’ or ‘−−’, and those with magnitudes above 0.5 are noted as ‘+++’ or ‘−−−’.
Figure 4—figure supplement 3
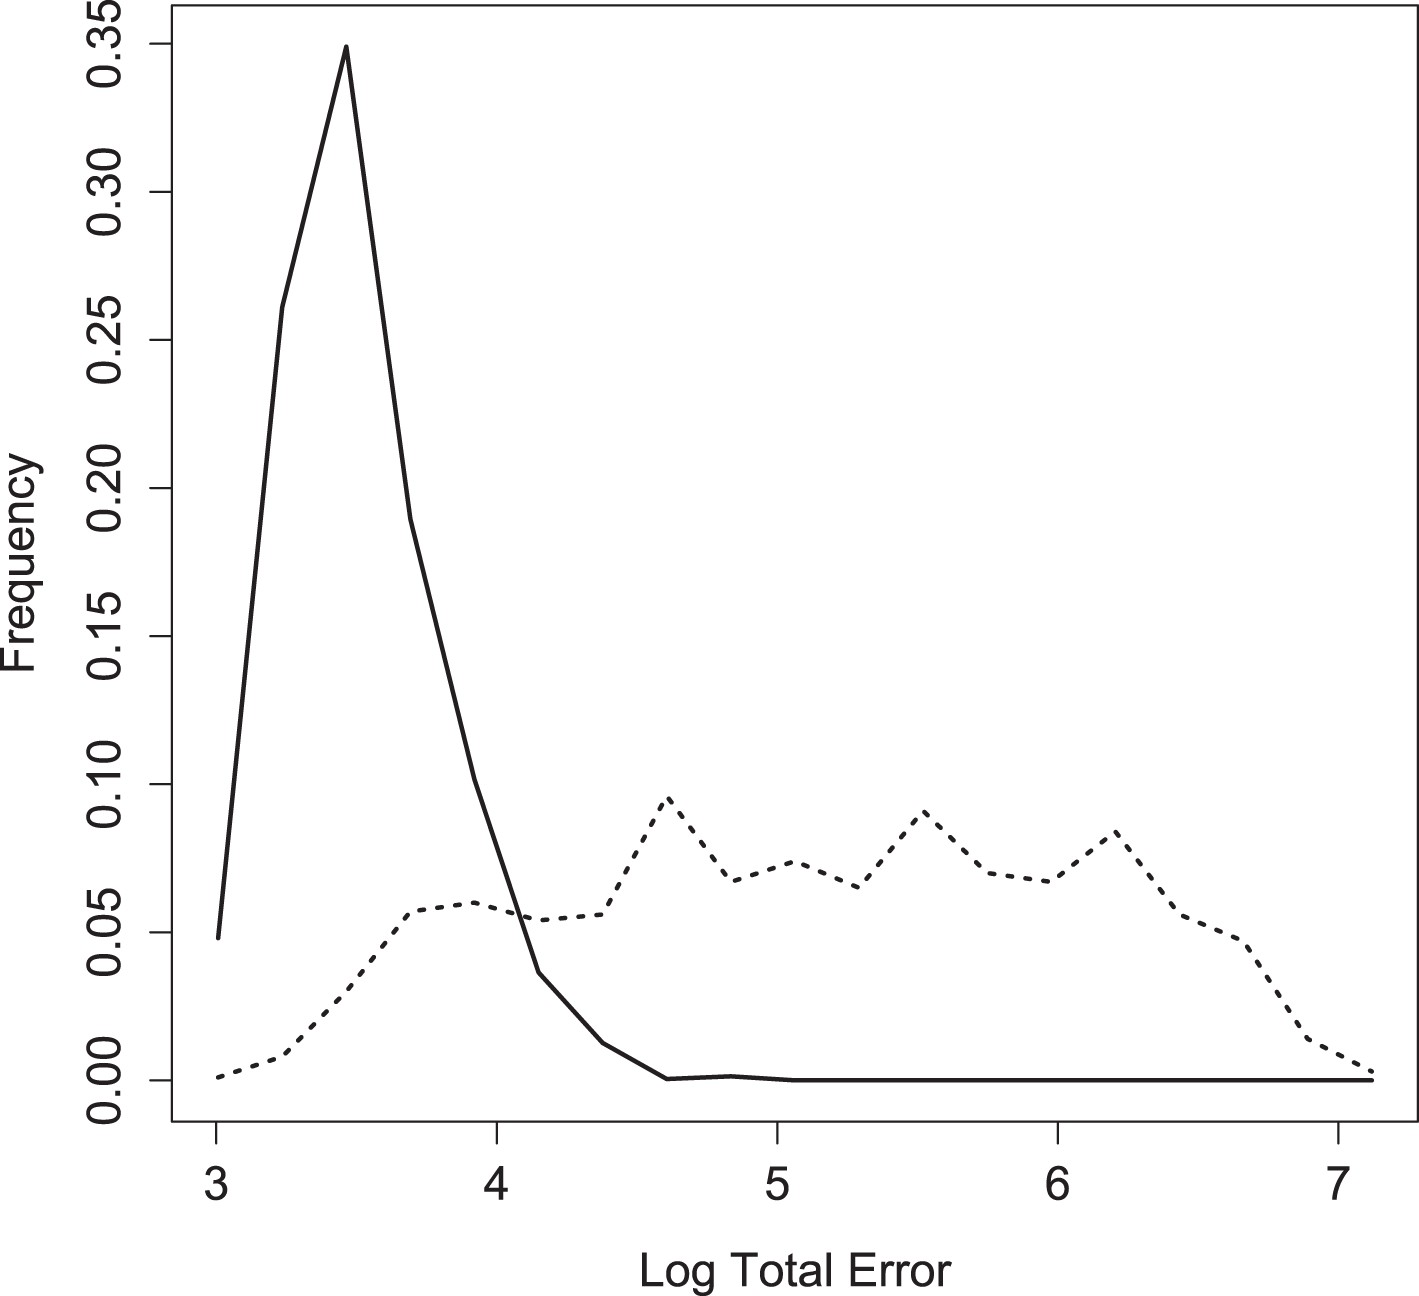
Log of total error for inferred, weighted parameter sets in round two (solid) vs 1000 sets assembled from parameter values drawn independently from the weighted posterior (dotted).
https://doi.org/10.7554/eLife.03753.011
Figure 4—figure supplement 4

Goodness-of-fit (1/[1 + mean error]) of highly replicated simulations for MOI = 10 and the ‘best’ inferred parameter set.
Each parameter value was varied independently for 1000 sets of 20 single-cell replicates for each MOI. Orange lines represent the base value of each parameter.
Figure 4—figure supplement 5
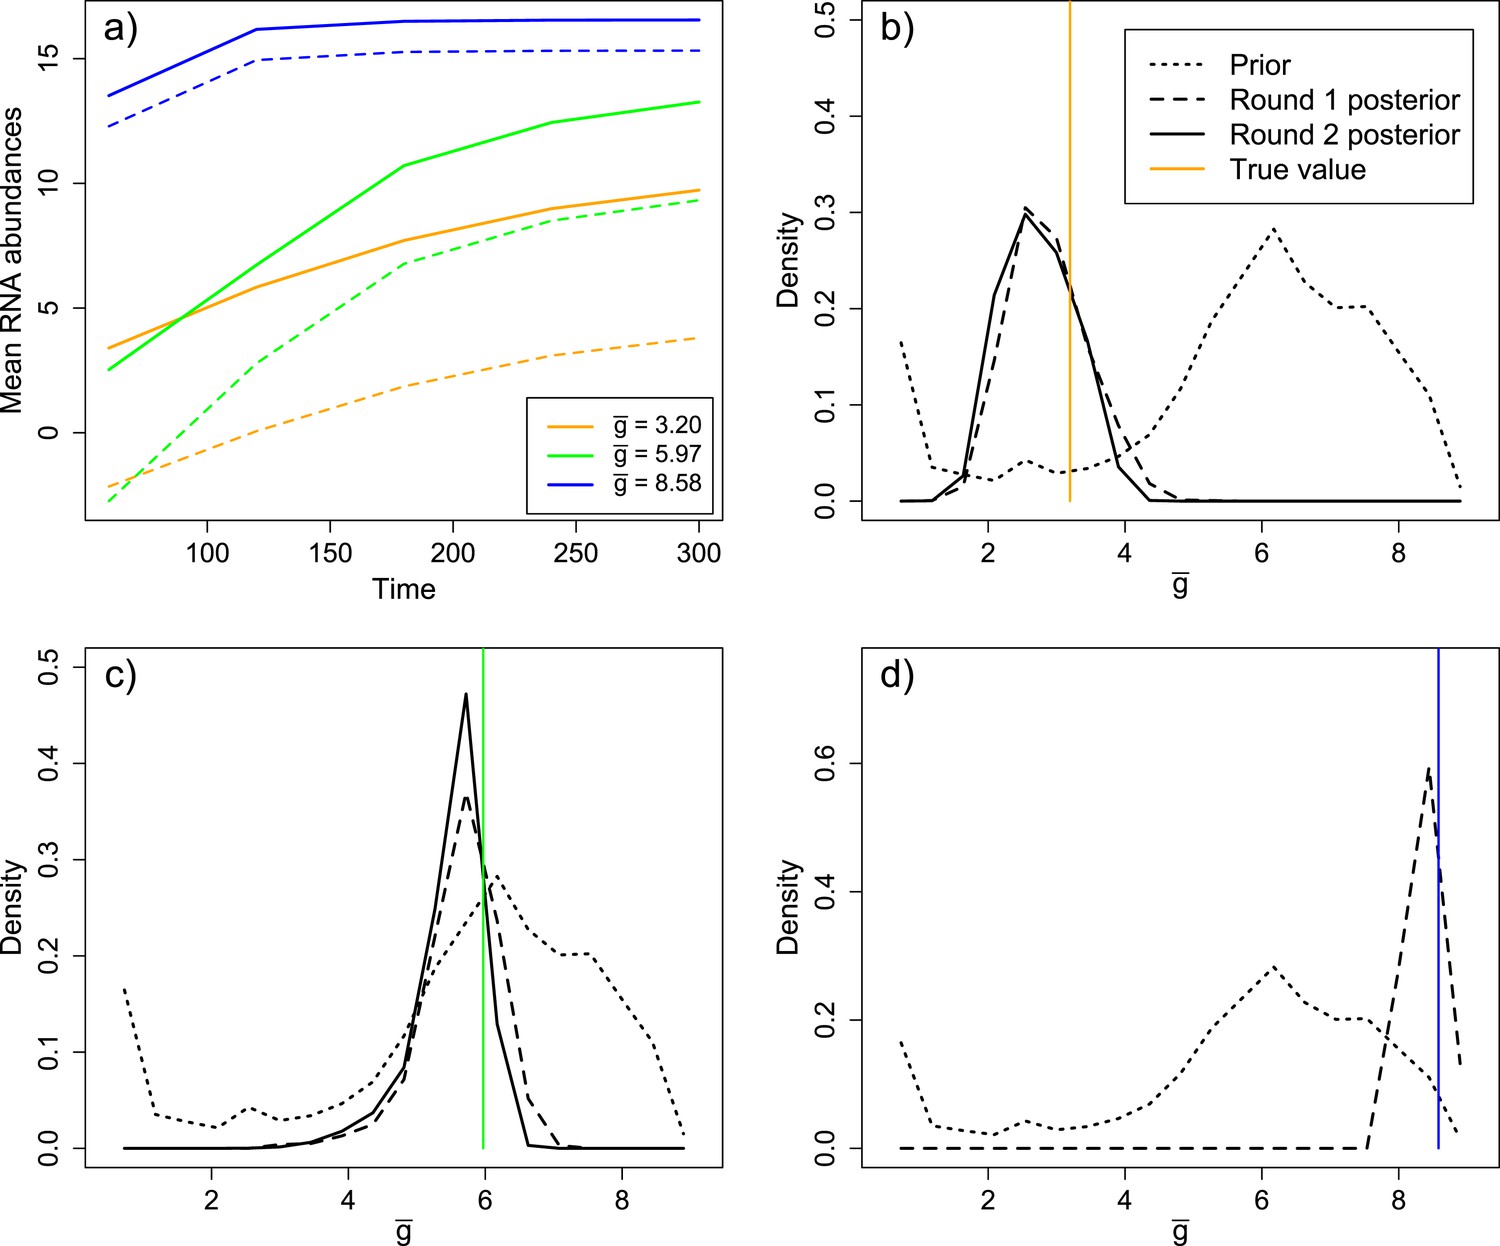
Inference results from three validation experiments.
(A) Three parameter sets, spanning a range of values of , were selected from the prior distribution. The parameter sets produced substantial differences in mean levels of positive sense (solid) and negative sense (dashed) RNA over time. (B) Distribution of in the prior, round one posterior, and round two posterior for the ‘low’ parameter set ( = 3.20). (C) Distribution of in the prior, round one posterior, and round two posterior for the ‘middle’ parameter set ( = 5.97). (D) Distribution of in the prior and round one posterior (round two was not performed due to the high degree of convergence in round one) for the ‘high’ parameter set ( = 8.58).
Figure 4—figure supplement 6
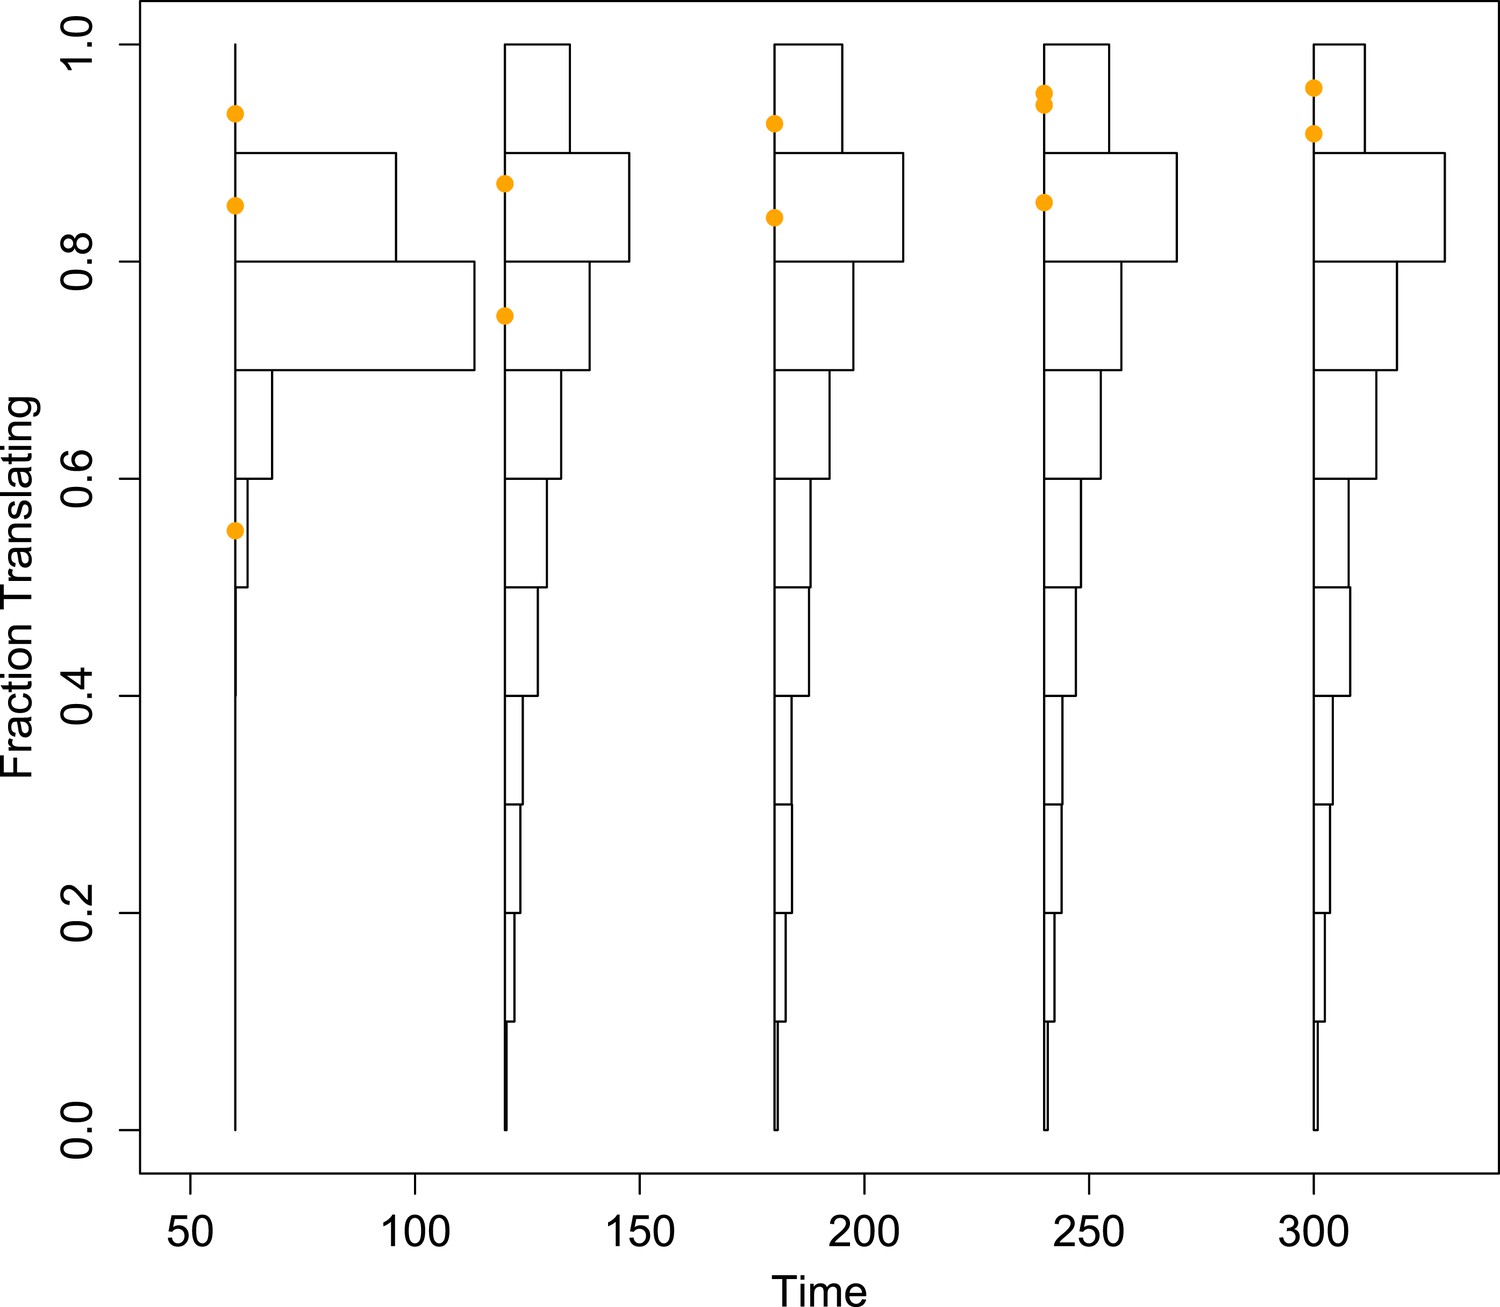
Histograms of the projected fraction of positive-sense RNA undergoing translation for the mean simulated dynamics of each parameter set, compared to empirical measurements (orange dots).
To better visualize the diversity of the predictions made from the inferred parameter sets, these histograms are not corrected by the importance weights.
Figure 4—figure supplement 7
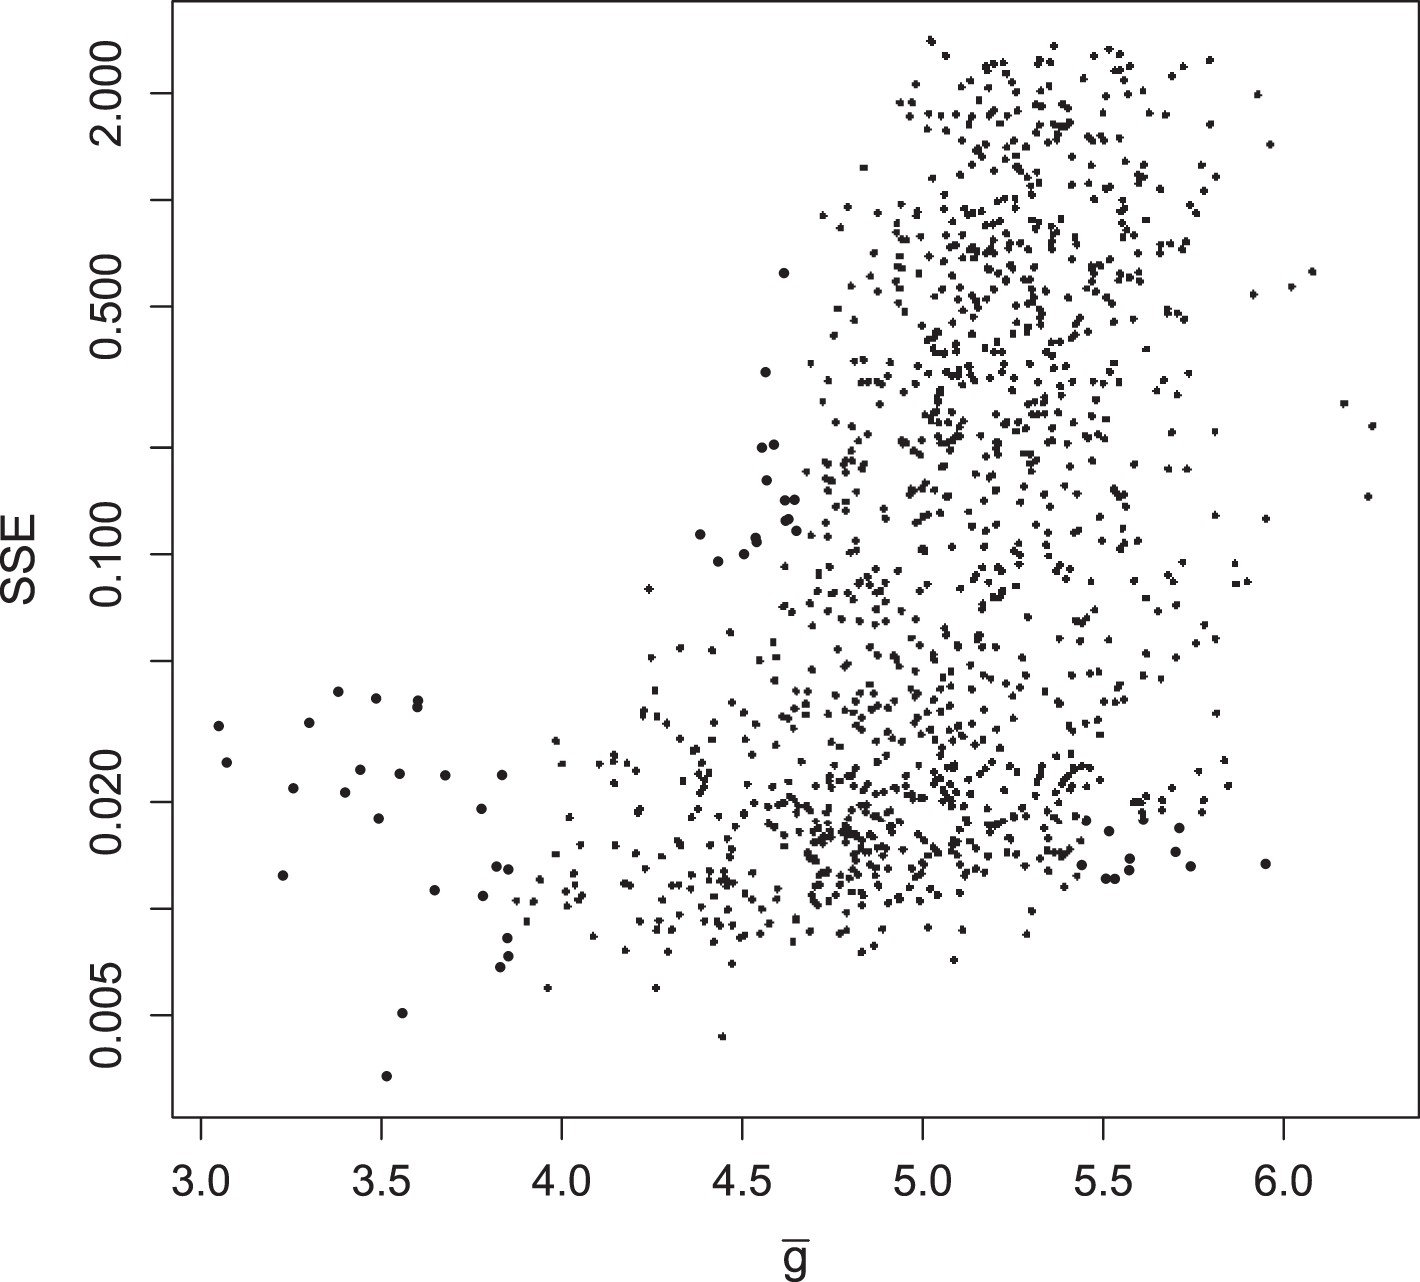
Summed squared error (SSE) of fraction of translating positive-sense RNA for all 1135 parameter sets, plotted against at MOI = 10.
https://doi.org/10.7554/eLife.03753.015
Figure 5
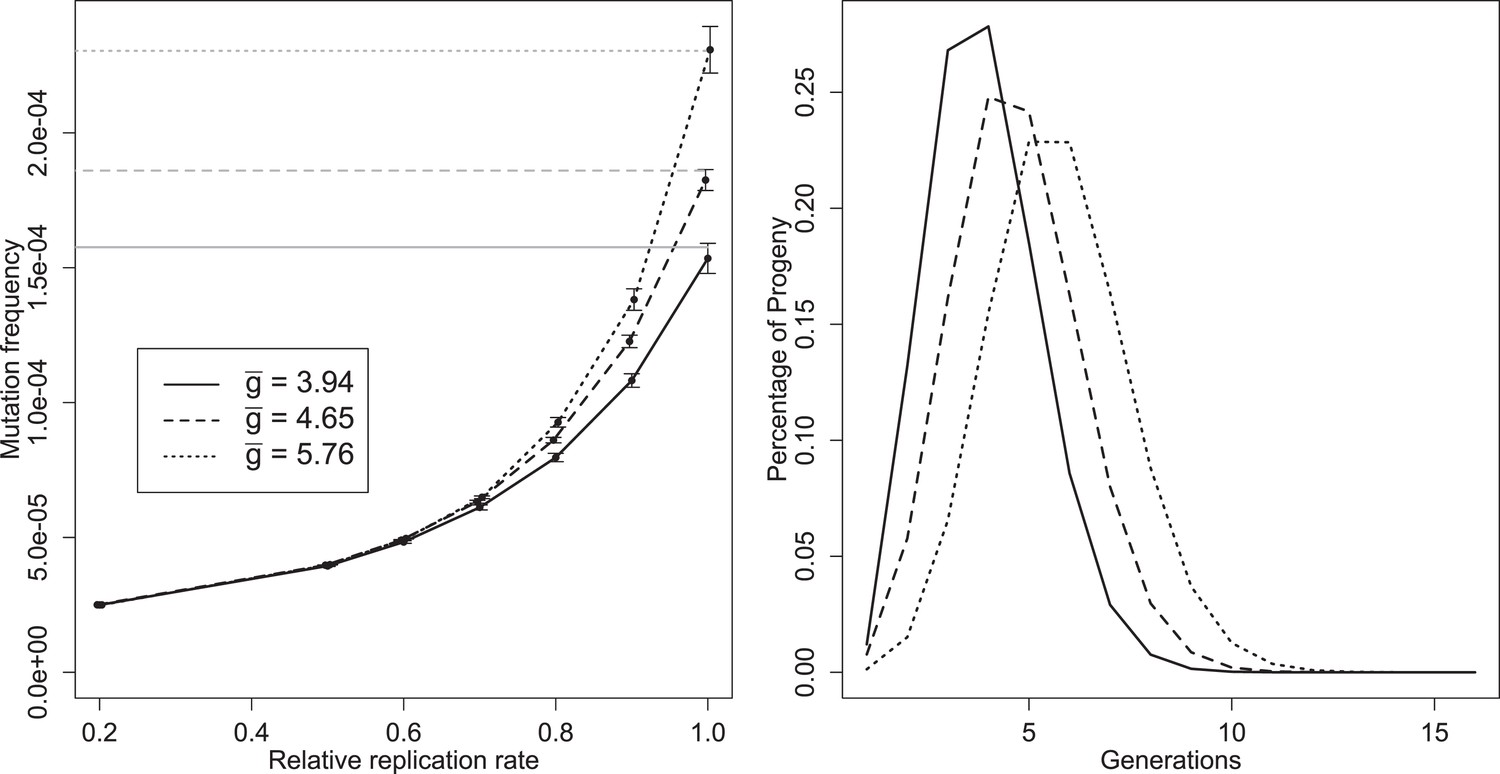
Left: mean mutation frequencies for three parameter sets (‘low’, = 3.94; ‘best’, = 4.65; ‘high’, = 5.76). Mutation rate is 2 × 10⁻⁵ per replication event; ‘relative replication rate’ reflects the reduced probability of a mutant template to replicate, relative to an unmutated strand. Grey lines indicate the expected mean for each parameter set with no selection (deficit of zero); the black line shows the mutation rate in one replication step, and therefore the expected frequency when mutants cannot replicate. Bars indicate 95% confidence intervals. Right: distributions of g of progeny from single cell infections for three parameter sets (‘low’, = 3.94; ‘best’, = 4.65; ‘high’, = 5.76).
Additional files
-
Source code 1
Poliovirus replication mathematical model-code. Contains custom software used for simulations throughout this article.
- https://doi.org/10.7554/eLife.03753.017
Download links
A two-part list of links to download the article, or parts of the article, in various formats.
Downloads (link to download the article as PDF)
Open citations (links to open the citations from this article in various online reference manager services)
Cite this article (links to download the citations from this article in formats compatible with various reference manager tools)
Experimentally guided models reveal replication principles that shape the mutation distribution of RNA viruses
eLife 4:e03753.
https://doi.org/10.7554/eLife.03753


