Complexin inhibits spontaneous release and synchronizes Ca2+-triggered synaptic vesicle fusion by distinct mechanisms
- Stanford University, United States
Figures
Figure 1
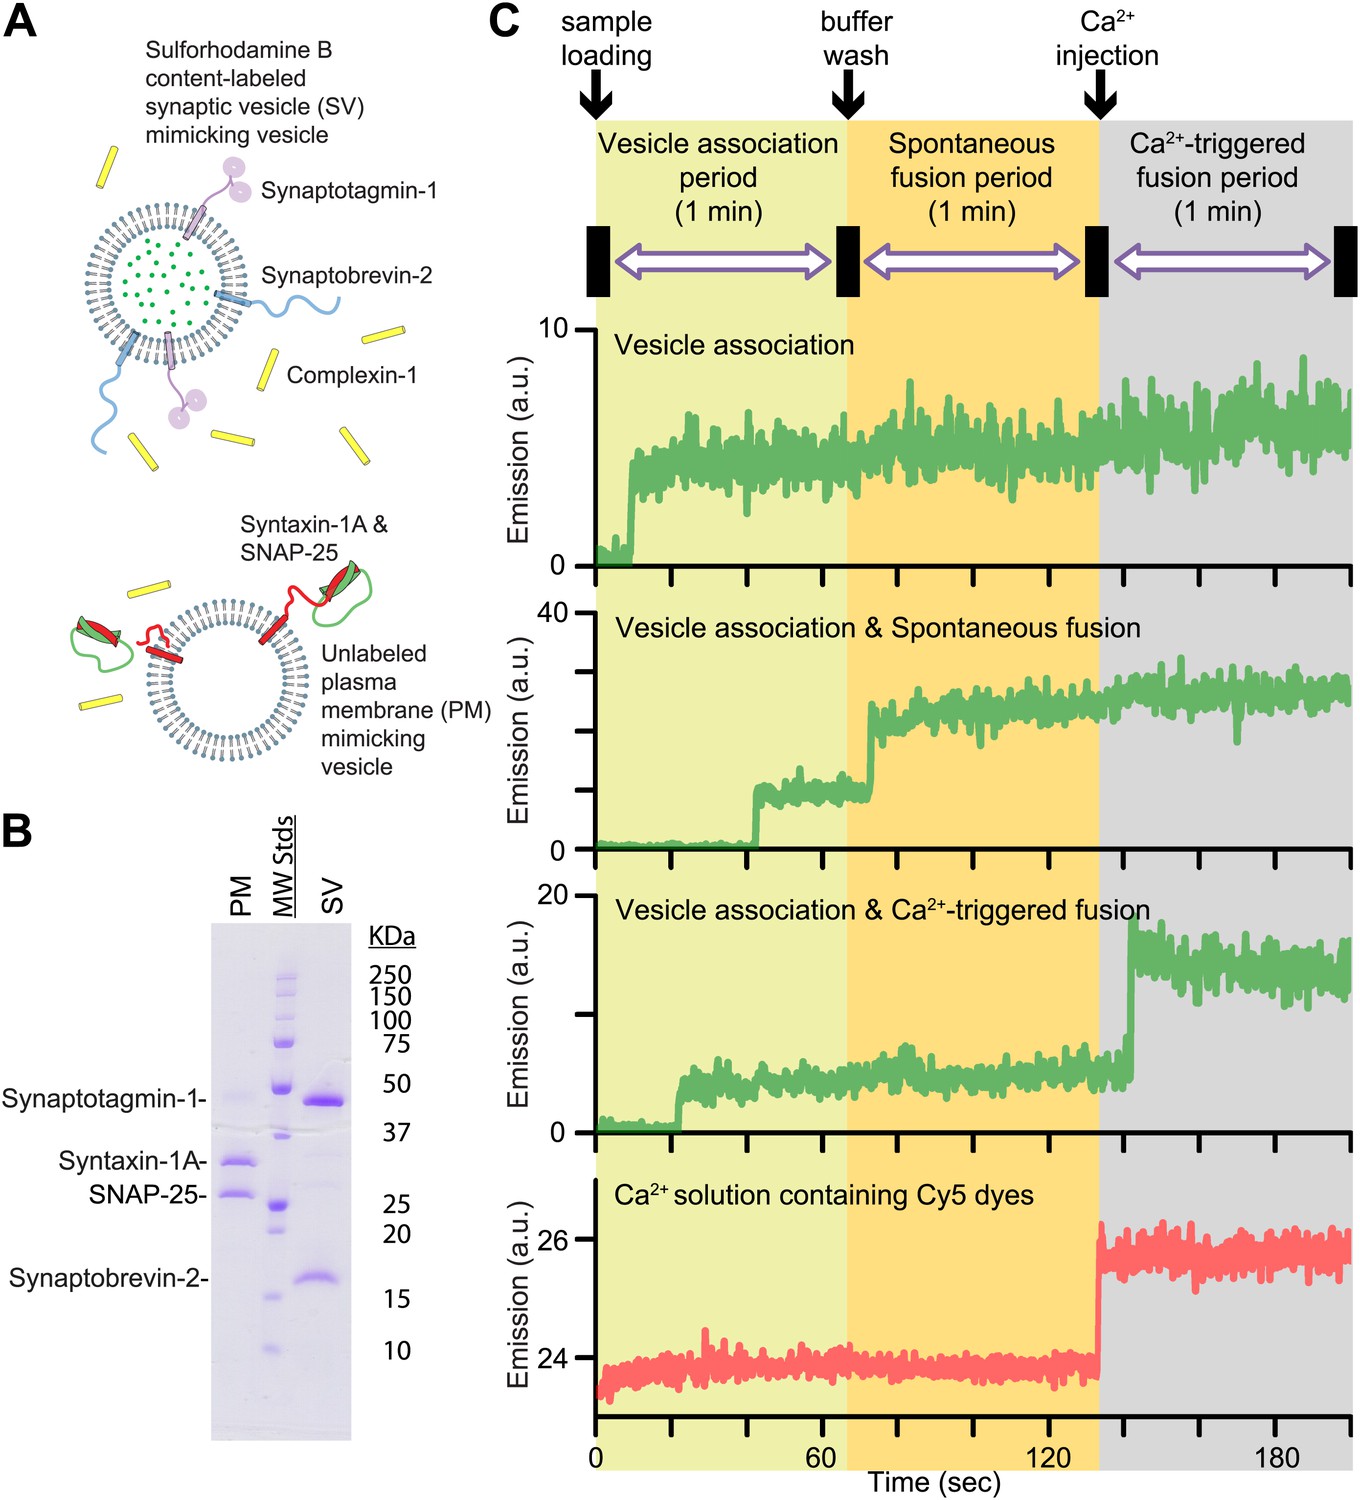
Reconstituted single vesicle-vescile fusion assay. (A) Protein composition and labeling of proteoliposomes. (B) SDS-PAGE analysis of reconstituted vesicles mimicking the plasma membrane (PM) and synaptic vesicles (SV). (C) Schema of the extended single vesicle–vesicle content mixing assay. The shaded backgrounds indicate the three subsequent 1 min time periods of the procedure and the short intervals (5 s) for buffer exchanges. Representative content fluorescence intensity time traces are shown for an associated pair of SV and PM vesicles without any fusion (top trace), for an associated pair that undergoes spontaneous fusion, and for an associated pair that undergoes fusion after Ca2+-injection. The association of an SV vesicle to a surface-immobilized PM vesicle is characterized by fluorescence intensity increases during the 1 min period after initial SV vesicle loading. Spontaneous and Ca2+-triggered fusion events are characterized by a subsequent stepwise increase of the content dye fluorescence intensity during the respective 1 min observation periods. The time point of the arrival of Ca2+ is determined by the appearance of fluorescence intensity from soluble Cy5 dyes that are part of the injected solution (bottom trace).
Figure 2
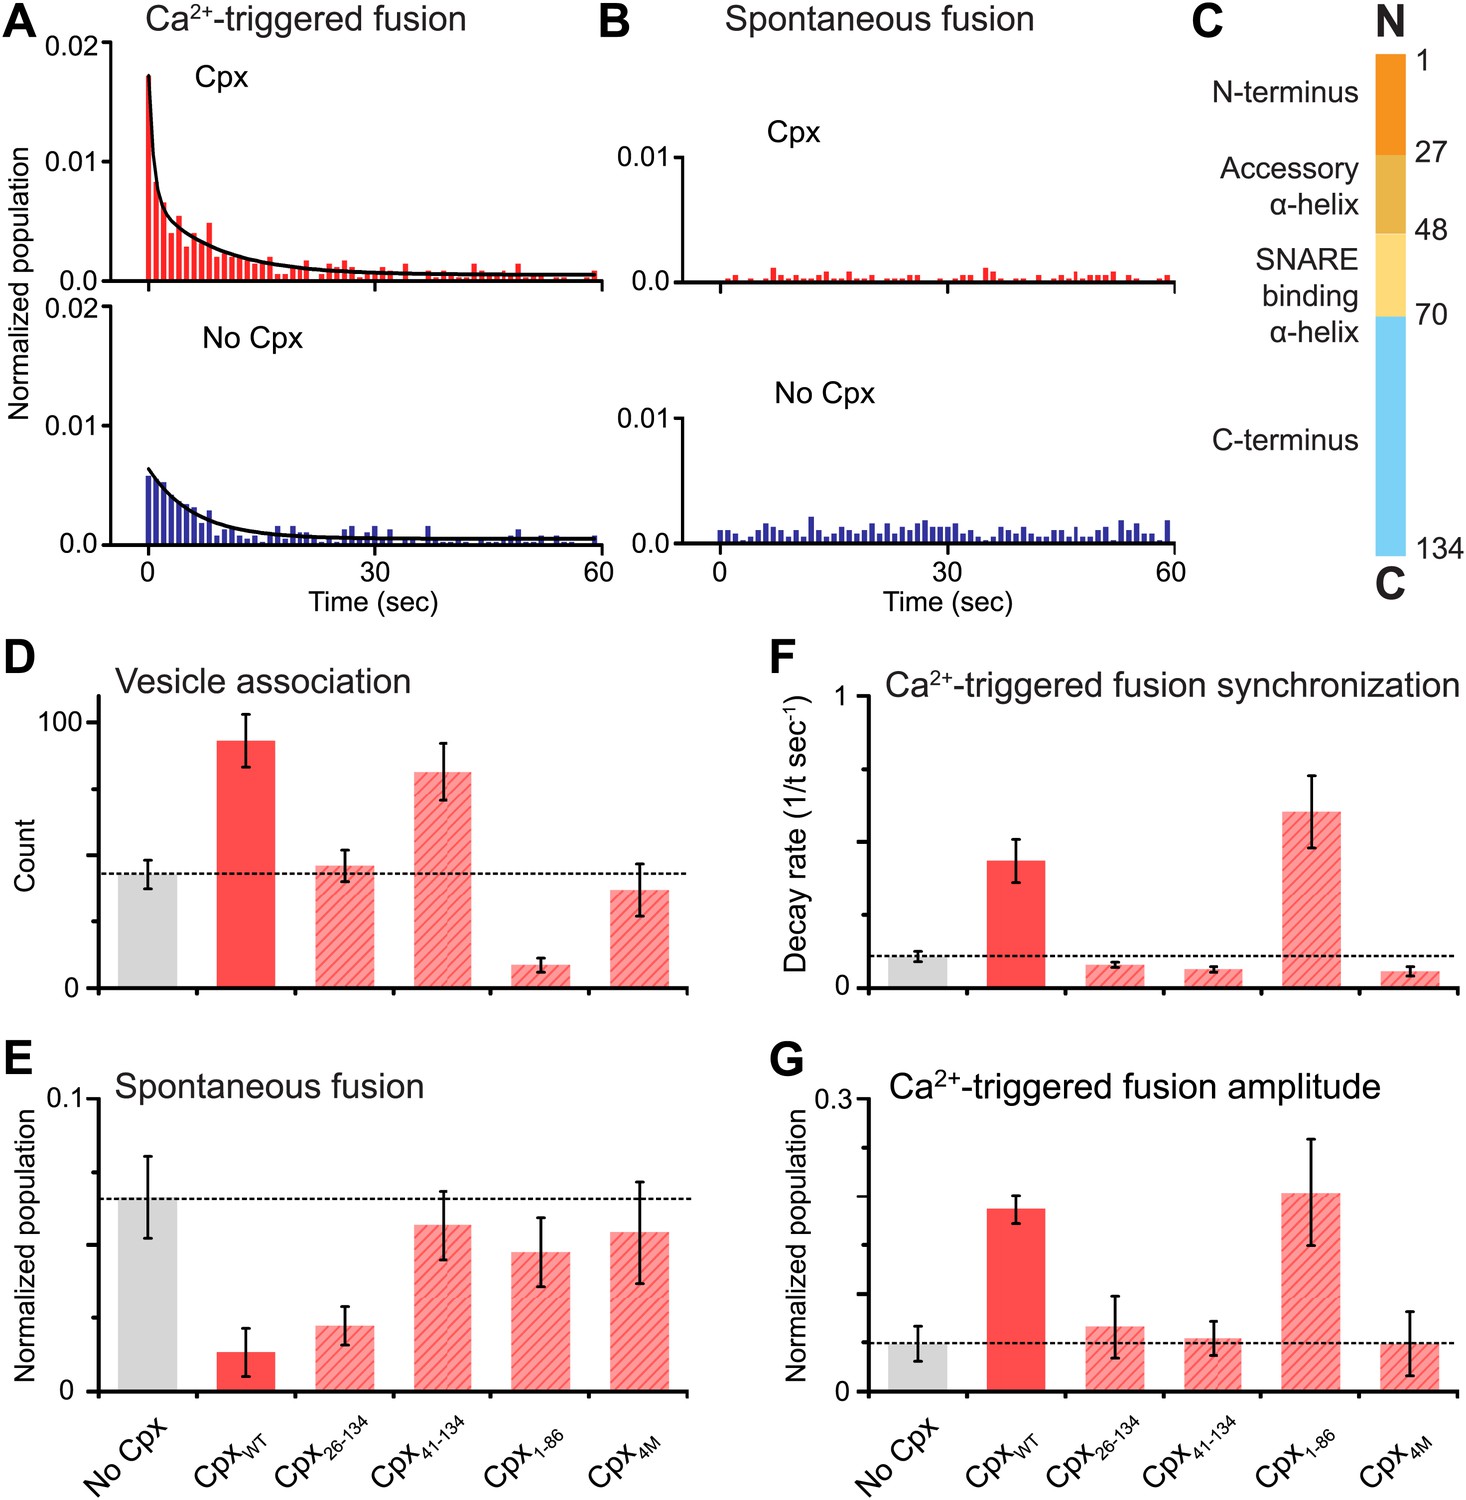
Complexin-1 synchronizes Ca2+-triggered fusion and inhibits spontaneous fusion in concert with synaptotagmin-1 and neuronal SNAREs.
(A and B) Probability of fusion vs time upon 500 μM Ca2+-injection and spontaneous fusion, both in the presence of full-length synaptotagmin-1 and neuronal SNAREs, but with and without 2 μM complexin-1 (Cpx) as indicated. (A) The histograms of Ca2+-triggered fusion events (1 s time bin) were normalized by the number of associated SV vesicles and fit to an exponential decay function. The decay rate with and without complexin-1 is 0.43 s−1 and 0.11 s−1 respectively. (B) The histograms of spontaneous fusion events were normalized by the number of associated SV vesicles. (C) Domain structure of complexin-1. To probe the roles of the four domains of complexin-1 we used the truncation mutant Cpx26–134 for the N-terminal domain, the truncation mutant Cpx41–134 for the accessory α-helical domain, the Cpx4M mutant for the SNARE binding domain, and the truncation mutant Cpx1–88 for the C-terminal domain. We chose these particular truncations/mutations based on studies of cortical neuronal cultures (Maximov et al., 2009; Kaeser-Woo et al., 2012). (D–G) The bar graphs show the effects of complexin-1 and its mutants on SV-PM vesicle association (D), the number of spontaneous fusion events over the 1-min observation period divided by the number of associated SV vesicles (E), the decay rate of the histogram upon Ca2+-injection (F), and the amplitude of the first 1-sec time bin upon Ca2+-injection (G). Each value in panel G was normalized by the respective number of fusion events after Ca2+-injection. Moreover, only those single vesicle–vesicle fluorescence intensity traces that exhibited a distinct event during the association period were analyzed for fusion events during the subsequent observation periods. Error bars in D, E, G are standard deviations for 6–13 independent repeat experiments. Error bars in F are error estimates computed from the covariance matrix upon fitting the corresponding histograms with a single exponential decay function using a Levenberg-Marquardt technique.
-
Figure 2—source data 1
Shown are the data that were used to generate panels D-G of Figure 2: individual histograms of probability of fusion vs time for the complexin-1 mutants, for spontaneous fusion (upper panels), and upon 500 μM Ca2+-injection (lower panels).
The histograms (1 s time bin) are combinations of all respective repeat experiments, and normalized with respect to the number of associated SV vesicles. Exponential decay functions were fit to the histograms. The mock injection is an injection of Cy5 dye buffer without Ca2+; as expected, no Ca2+-triggered fusion was observed, that is, the mechanical disturbance of the injection does not cause fusion events. The table shows the number of spontaneous and Ca2+-triggered fusion events, the total number of analyzed traces (i.e., the number of associated vesicles), and the number of repeat experiments (N).
- https://doi.org/10.7554/eLife.03756.003
Figure 3

Suppression of spontaneous fusion and synchronization of Ca2+-triggered fusion vs complexin-1 concentration (in concert with synaptotagmin-1 and neuronal SNAREs).
The bar graphs show the effect of wildtype complexin-1 at specified concentrations on SV-PM vesicle association (A), the number of spontaneous fusion events divided by the number of associated SV vesicles (B), the decay rate of the histogram of fusion events upon Ca2+-injection (C), and the amplitude of the first 1-sec time bin upon Ca2+-injection (D). Each value in panel D was normalized by the respective number of fusion events after Ca2+-injection. Moreover, only those single vesicle–vesicle fluorescence intensity traces that exhibited a distinct event during the association period were analyzed for fusion events during the subsequent observation periods. Error bars in A, B, D show the standard deviation for 6–10 independent repeat experiments. Error bars in C are error estimates computed from the covariance matrix upon fitting the corresponding histograms with a single exponential decay function using a Levenberg-Marquardt technique. ** indicates p<0.01 using the Student's t test.
-
Figure 3—source data 1
Shown are the data that were used to generate the bar charts in Figure 3: individual histograms of probability of fusion vs time at specified complexin-1 concentrations, for spontaneous fusion (upper panels) and upon 500 μM Ca2+-injection (lower panels).
The histograms (1 s time bin) are combinations of all respective repeat experiments, and normalized with respect to the number of associated SV vesicles. Exponential decay functions were fit to the histograms. The table shows the number of spontaneous and triggered fusion events, the total number of analyzed traces, and the number of repeat experiments (N).
- https://doi.org/10.7554/eLife.03756.006
Figure 4

Suppression of spontaneous fusion by complexin-1 with or without synaptotagmin-1.
The bar graphs summarize the effect of 2 μM complexin-1 on SV-PM vesicle association (A) and the number of spontaneous fusion events divided by the number of associated SV vesicles (B); the conditions that did not include synaptotagmin-1 used SV vesicles that were reconstituted with synaptobrevin-2 only. Moreover, only those single vesicle–vesicle fluorescence intensity traces that exhibited a distinct event during the association period were analyzed for spontaneous fusion events.
-
Figure 4—source data 1
Shown are the data that were used to generate the bar chart in Figure 4B: individual histograms of probability of spontaneous fusion vs. time at specified conditions.
The histograms (1 s time bin) are combinations of all respective repeat experiments, and normalized with respect to the number of associated SV vesicles. The table shows the number of spontaneous fusion events, the total number of analyzed traces, and the number of repeat experiments (N).
- https://doi.org/10.7554/eLife.03756.008
Download links
A two-part list of links to download the article, or parts of the article, in various formats.
Downloads (link to download the article as PDF)
Open citations (links to open the citations from this article in various online reference manager services)
Cite this article (links to download the citations from this article in formats compatible with various reference manager tools)
Complexin inhibits spontaneous release and synchronizes Ca2+-triggered synaptic vesicle fusion by distinct mechanisms
eLife 3:e03756.
https://doi.org/10.7554/eLife.03756


