The kinase LYK5 is a major chitin receptor in Arabidopsis and forms a chitin-induced complex with related kinase CERK1
- University of Missouri, United States
- Argonne National Laboratory, United States
Figures
Figure 1 with 5 supplements

Atlyk5 mutant plants are defective in chitin-triggered immune responses.
(A) ROS production was measured from Col-0 wild-type and Atlyk5-2 mutant plants for 30 min after treatment with different chitin oligomers. 5mer: chitopentaose, 6mer: chitohexaose, 7mer: chitoheptaose, and 8mer: chitooctaose. Data are mean ± SE (n = 8). Asterisks indicate significant difference relative to H2O treated Col-0 wild-type plants. (p < 0.01, Student's t test). (B) Calcium influx in the wild-type, Atcerk1 and Atlyk5-2 mutant plants expressing aequorin was recorded for 30 min after chitooctaose treatment. (C) MAP kinase phosphorylation after chitooctaose treatment was detected by immunoblot using anti-P44/P42 antibody. (D) AtWRKY29 (At4g23550) and (E) AtWRKY30 (At5g24110) gene expression was analyzed using qRT-PCR in the wild-type, Atcerk1 and Atlyk5-2 mutant plants with or without treatment with chitooctaose, 8mer. UBQ10 (At4g05320) was used a control. Data are mean ± SE (n = 3). Asterisks indicate significant difference relative to H2O treated Col-0 wild-type plants. (p < 0.01, Student's t test). (F) 4-week-old leaves from Col-0 wild-type, Atcerk1, Atlyk5-2, and Atlyk4/lyk5-2 mutant plants were inoculated with Alternaria brassicicola 24 hr after hand-infiltration with H2O or 1 µM chitooctaose. The diameter of the lesion area was measured 4 days after inoculation. Data are mean ± SE (n = 12). Asterisks indicate significant difference relative to H2O treated Col-0 wild-type plants. (p < 0.05, Student's t test). (G) Leaf populations of Psuedomonas syringae pv. tomato DC3000 3 days after inoculation. 4-week-old plants were either pretreated with H2O or 1 µM chitooctaose 24 hr before inoculation with P. syringae. Data are mean ± SE (n = 9). Asterisk indicates T-test significant difference compared with H2O-treated Col-0 plants at p < 0.05, Student's t test. (H) AtCERK1, AtLYK4 and AtLYK5 gene expression in different plant ages and plant tissue. RNA from whole seedling of 5 day, 10 day, 20 day old plants and leaf and root tissues from 20 day old plants were used for reverse transcript and qRT-PCR was performed using specific primers. Data are mean ± SE (n = 3). Asterisks indicate significant difference relative to chitiooctaose treated Col-0 wild-type plants (p < 0.01, Student's t test).
Figure 1—figure supplement 1
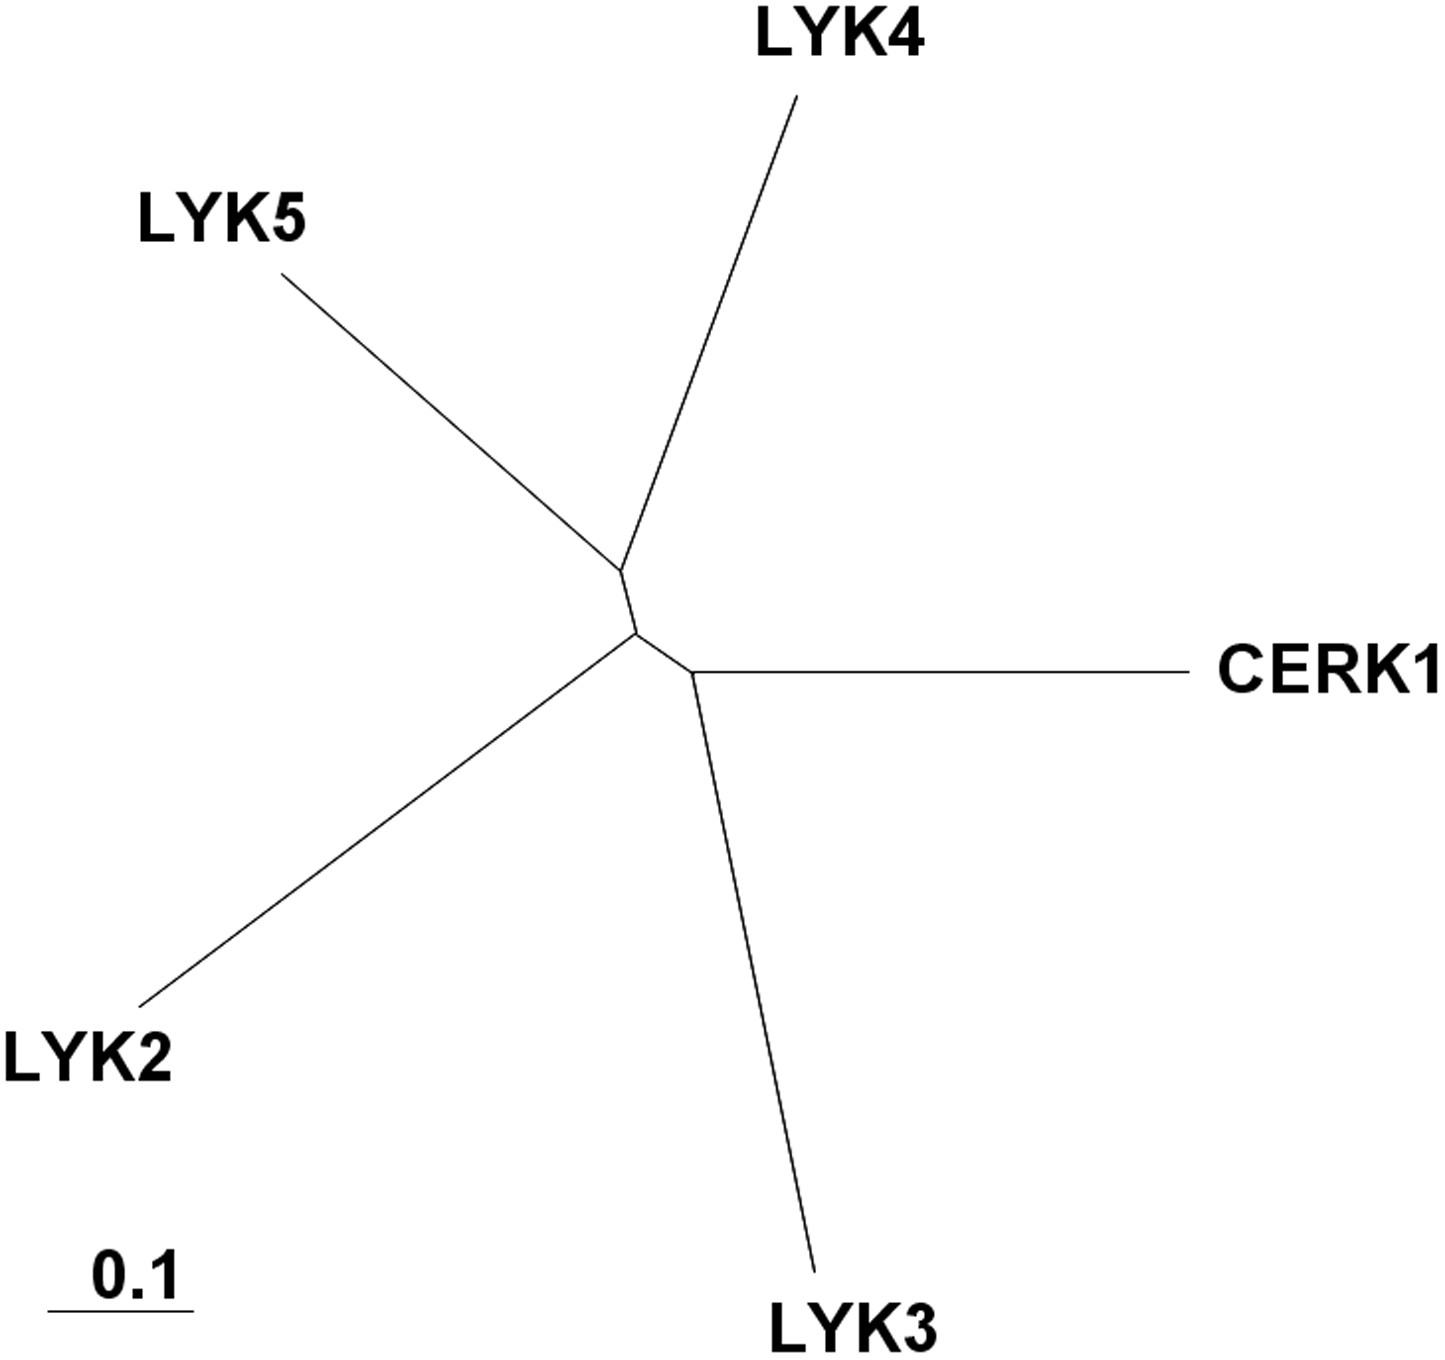
Arabidopsis LYK gene family.
A complete alignment based on the full-length sequences of each protein was used to draw the phylogenetic tree using Clustal X software. AtCERK1: At3g21630, AtLYK2: At3g01840, AtLYK3: At1g51940, AtLYK4: At2g23770, AtLYK5: At2g33580.
Figure 1—figure supplement 2
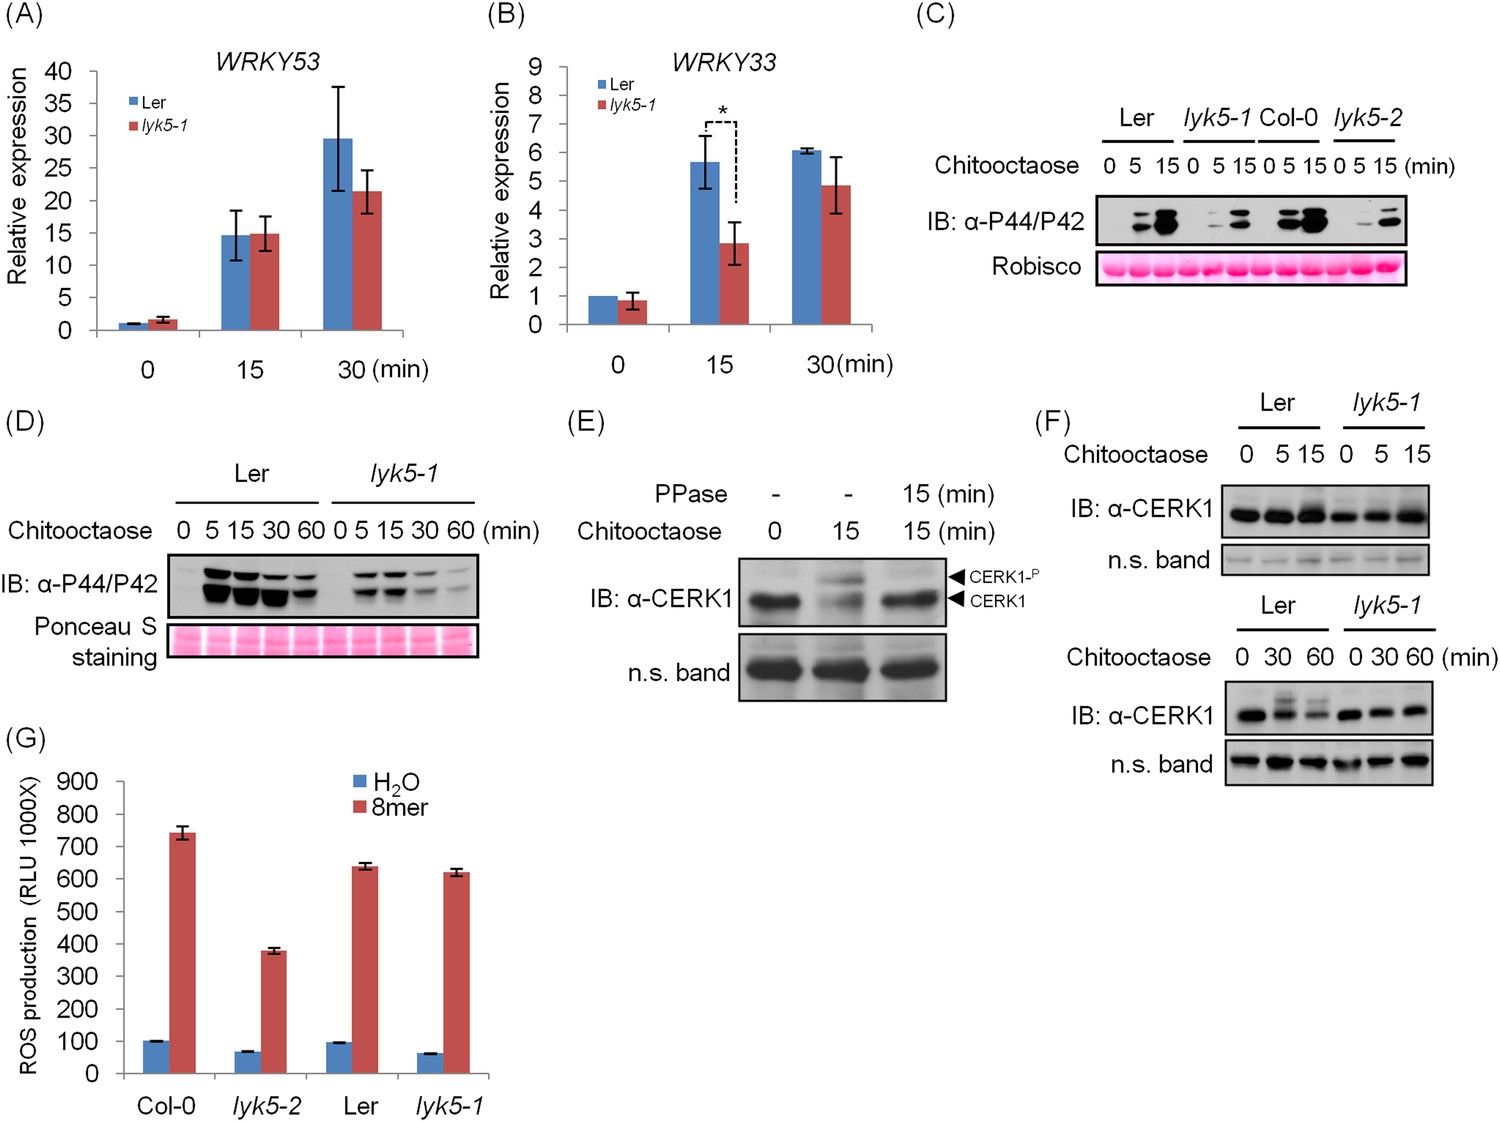
Chitin response in Ler lyk5-1 mutant plants.
(A–B) WRKY53 gene (A) and WRKY33 gene (B) expression was analyzed using qRT-PCR in Ler wild-type and Atlyk5-1 mutant plants with or without treatment with 1 µM chitooctaose. 8mer: chitooctaose. Data are ± SE (n = 3), *p < 0.05. (C–D) MPK phosphorylation in Ler wild-type and Atlyk5-1 mutant plants revealed by immunoblot. Leaf discs from 5-week-old plants (C) or 2-week-old seedlings (D) were subjected to the treatment with 1 µM chitooctaose for the time point shown in figures. Lower panel shows similar loading of total protein. (E) Chitin induces AtCERK1 phosphorylation. Mature leaves from Col-0 wild type plants were hand-infiltrated with 1 µM chitooctaose or H2O as control for 15 min. All samples were incubated with antarctic phosphatase or H2O as control at 37°C for 15 min. Anti-AtCERK1 antibody was used to detect AtCERK1 protein. (F) AtCERK1 phosphorylation in Ler wild-type and Atlyk5-1 mutant plants revealed by immunoblot using anti-AtCERK1 antibody after hand-infiltration with 1 µM chitooctaose for the time points shown in figures. (G) ROS production was measured from the Ler wild-type plants, Atlyk5-1 mutant plants, Col-0 wild-type plants, Atlyk5-2 mutant plants for 30 min after treatment with 0.5 µM chitooctaose. Data are mean ± SE (n = 6). Asterisk indicates significant difference. (p < 0.01, Student's t test).
Figure 1—figure supplement 3
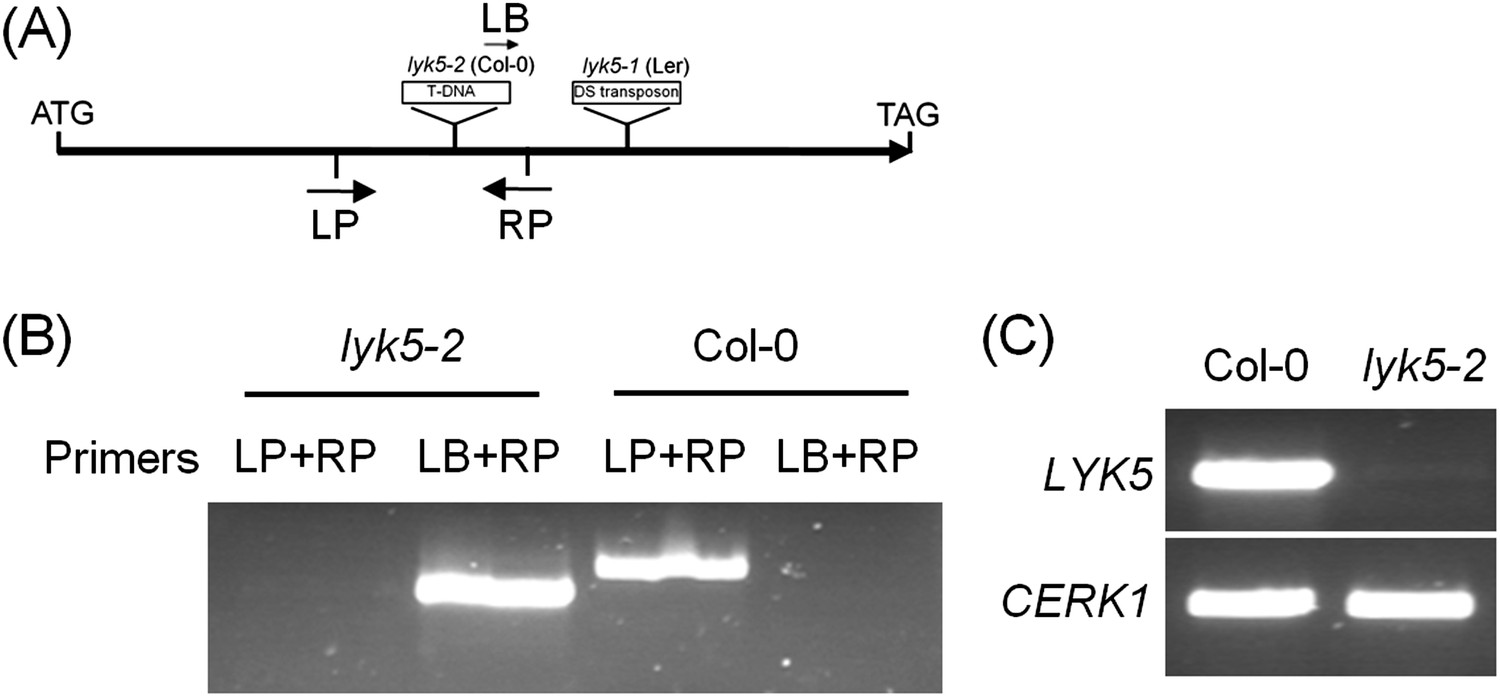
Characterization of Atlyk5 mutant plants.
(A) Genomic structure of AtLYK5 and two insertion sites of two mutants. (B) Identification of T-DNA insertion by PCR using genomic DNA from Col-0 wild-type and Atlyk5-2 mutant plants. Location of primers used is shown in (A). Primer sequences are listed in Supplemental file 1. (C) RT-PCR was used to identify transcriptional expression of AtLYK5 in Col-0 WT and Atlyk5-2 mutant plants. Upper panel shows expression level of AtLYK5 in Col-0 and Atlyk5-2 mutant plants, lower panel shows expression of AtCERK1 as a control.
Figure 1—figure supplement 4
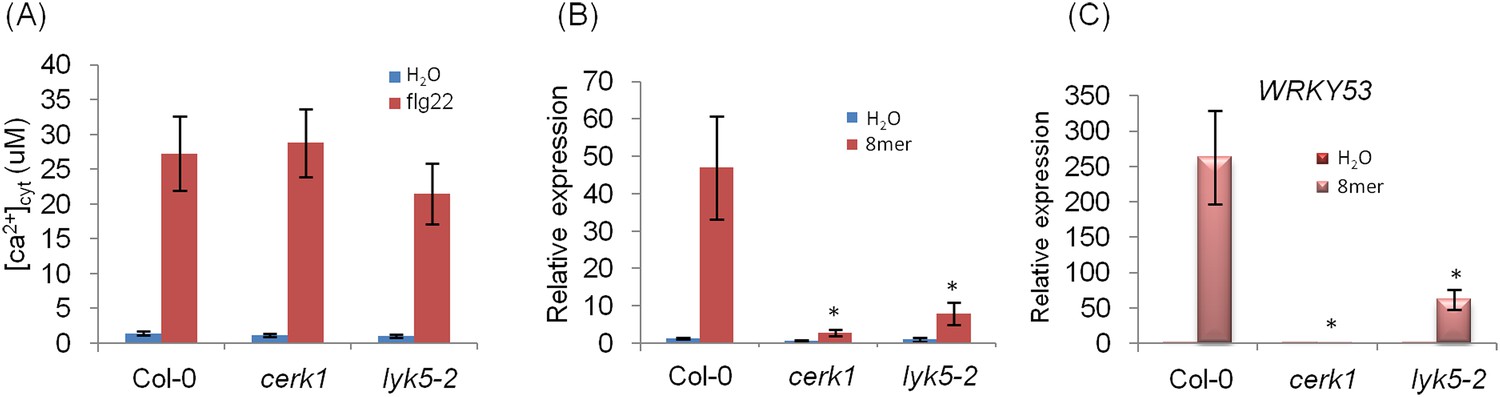
WRKY33 and WRKY53 gene expression in Atlyk5-2 mutant plants.
(A) Calcium influx in the wild-type, Atcerk1 and Atlyk5-2 mutant plants expressing aequorin was recorded for 30 min after 100 nM flg22 treatment. (B) WRKY33 (At2g38470) and (C) WRKY53 (At4g23810) gene expression was analyzed using qRT-PCR in the wild-type, Atcerk1 and Atlyk5-2 mutant plants with or without treatment with chitooctaose, 8mer. UBQ10 (At4g05320) was used a control. Data are mean ± SE (n = 3). Asterisks indicate significant difference relative to chitiooctaose treated Col-0 wild-type plants (p < 0.01, Student's t test).
Figure 1—figure supplement 5
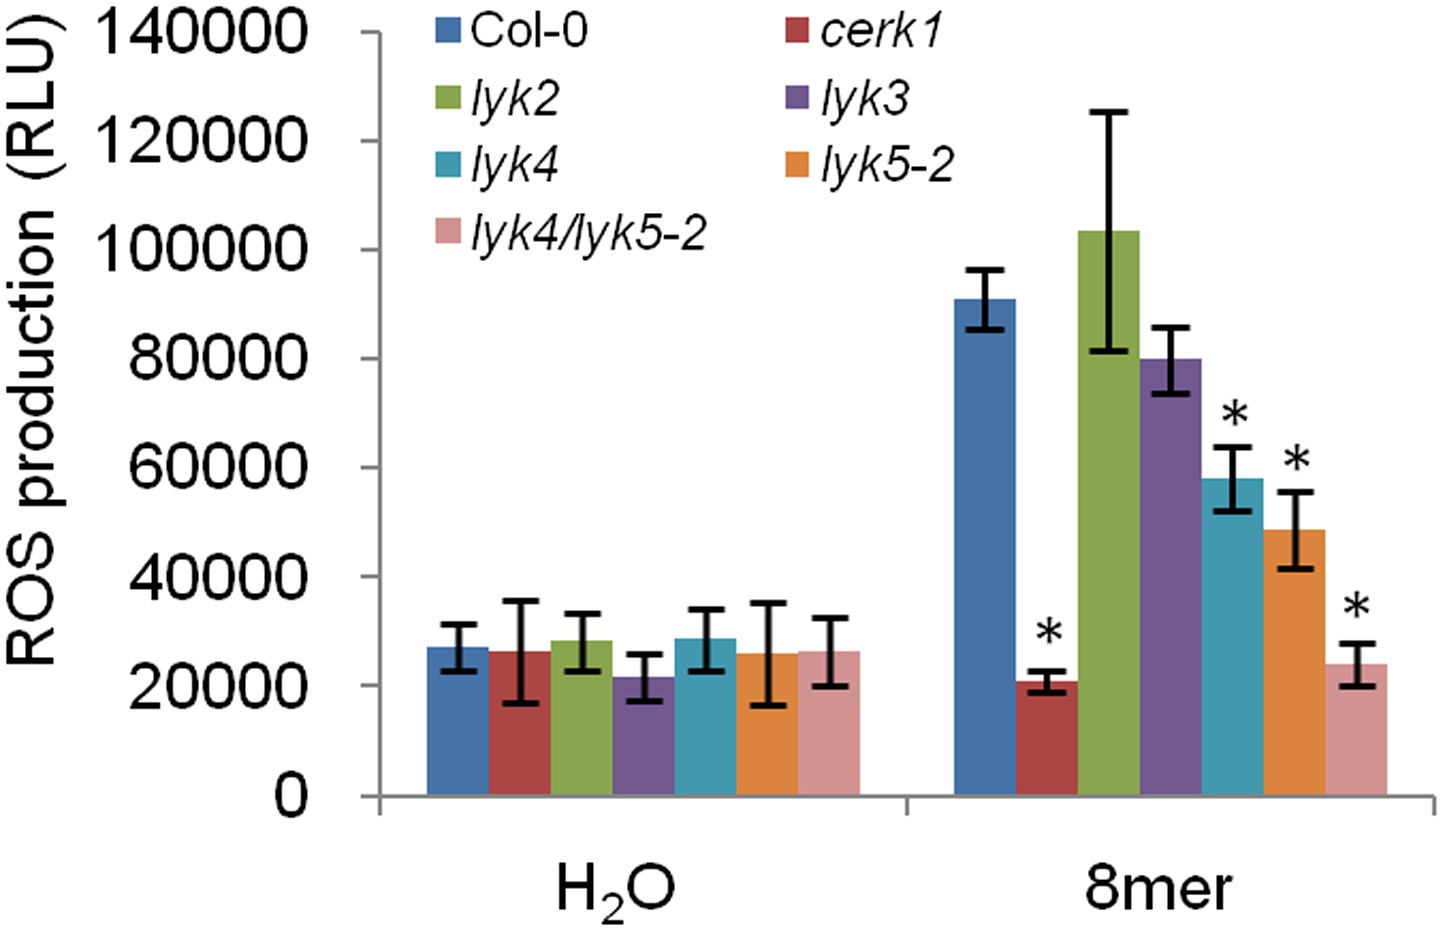
Chitin-induced ROS production in five lyk mutant plants.
ROS production was measured from Col-0 wild-type, five Atlyk mutant, and Atlyk4/Atlyk5-2 double mutant plants for 30 min after treatment with 1 µM chitooctaose. Data are mean ± SE (n = 8). Asterisks indicate significant difference relative to chitooctaose treated Col-0 wild-type plants. (p < 0.01, Student's t test).
Figure 2 with 2 supplements
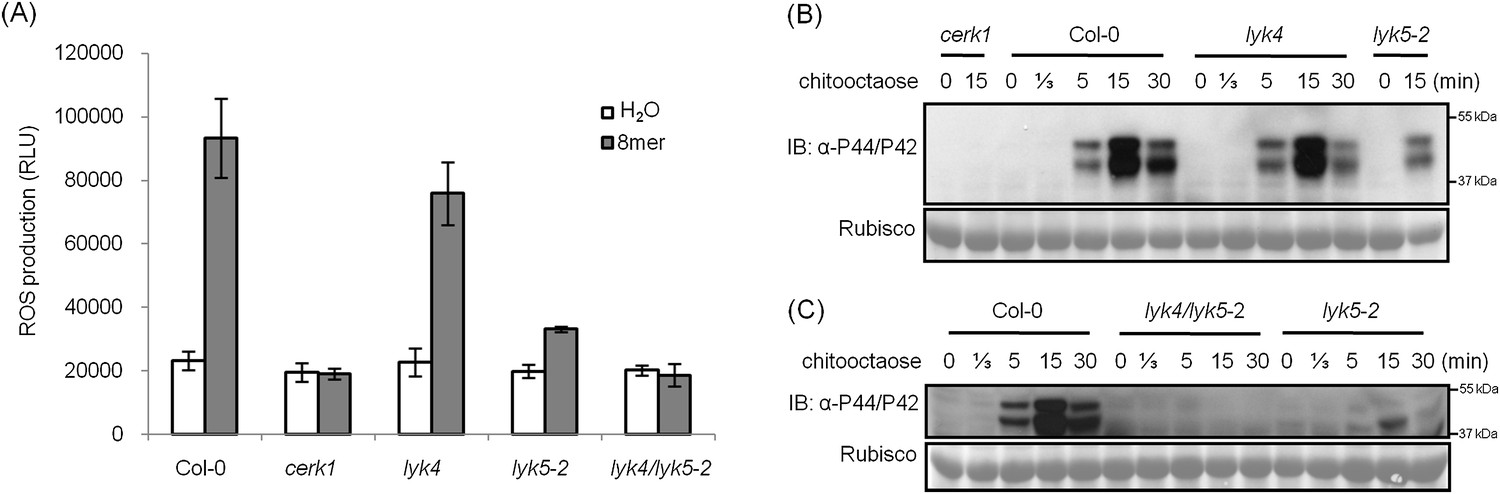
AtLYK5 has overlapping function with AtLYK4.
(A) ROS production was measured from Col-0 wild-type, Atyk4, Atlyk5-2, and Atlyk4/lyk5-2 mutant plants for 30 min after treatment with H2O (as control) or 1 µM chiooctaose. 8mer: chitooctaose. Data are mean ± SE (n = 8). (B) and (C) Western blot of total protein extracts from plants treated with 1 µM chitooctaose. Protein was separated by SDS-PAGE gel and visualized using anti-P44/P42 antibody. Upper panel in each figure shows phosphorylated MPK3 and MPK6, lower panel shows similar loading of each lane stained with ponceau S solution.
Figure 2—figure supplement 1
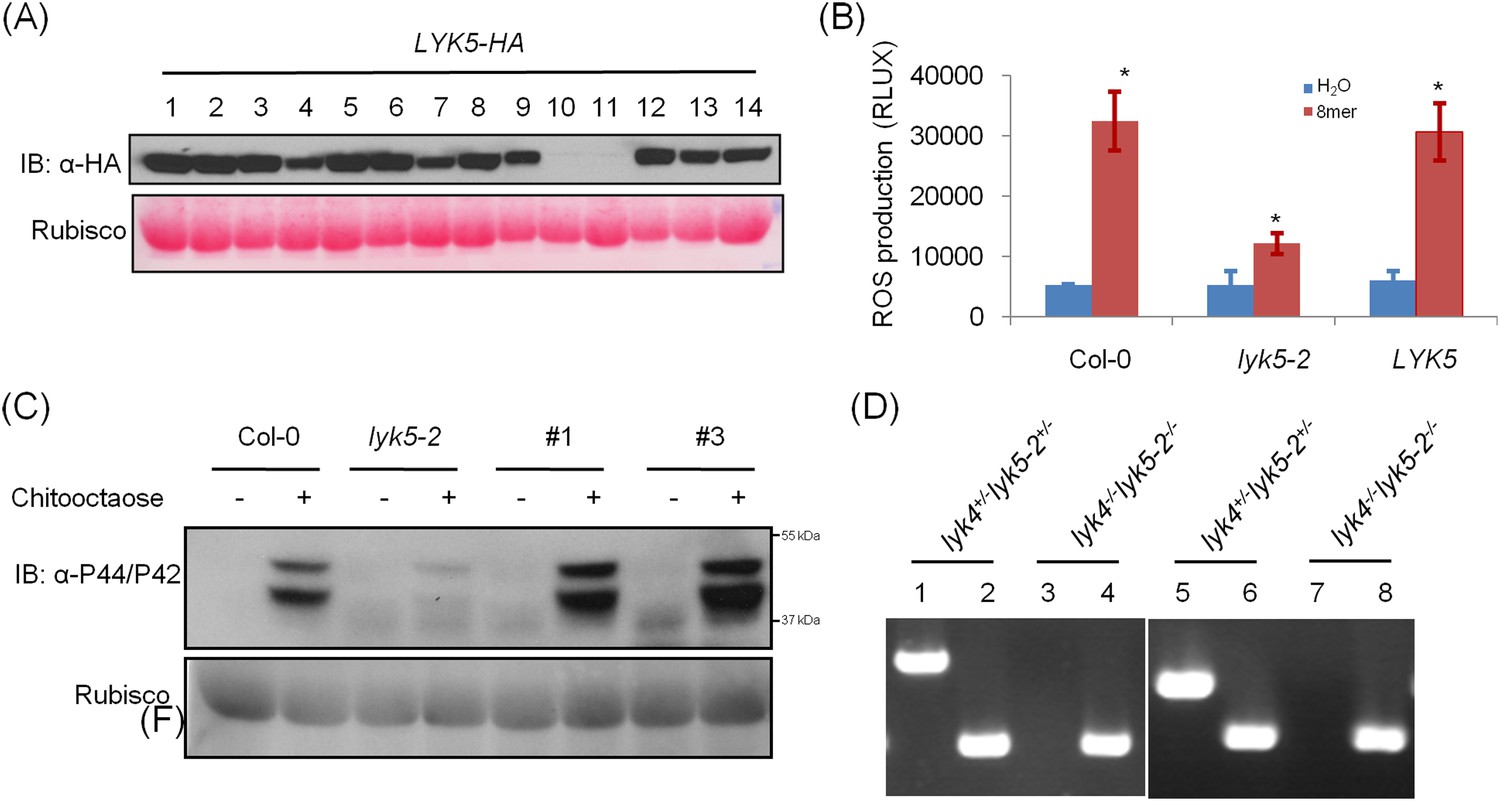
Complementation of Atlyk5-2 mutant plants.
(A) HA-tagged AtLYK5 protein levels in different transgenic Atlyk5-2 mutant plants expressing full length AtLYK5 under the control of its native promoter. (B) ROS production was measured from the wild type plants, and Atlyk5-2 mutant plants, and the Atlyk5-2 mutant plants expressing AtLYK5 under the control of its native promoter for 30 min after chitooctaose. AtLYK5 indicates complementation lines (#1 and #3 were used). Data are mean ± SE (n = 8). Asterisks indicate significant difference relative to H2O treated Col-0 wild type plants. (p < 0.01, Student's t test). (C) MPK phosphorylation in different transgenic plants shown above prior (−) or 15 min (+) after 1 µM chitooctaose treatment detected using anti-P44/P42 antibody. Lower panel shows similar loading of each lane stained with ponceau S solution. #1 and #3 indicate two different transgenic plants expressing AtLYK5 in Atlyk5-2 mutant plants. (D) Identification of Atlyk4/Atlyk5-2 double knockout mutant plants. Whole genomic DNA was extracted from Atlyk4+/−/Atlyk5-2+/− and Atlyk4−/−/Atlyk5-2−/− mutant plants. PCR was used to characterize homozygous Atlyk4/Atlyk5-2 double mutant plants. Primer pairs used as following: 1 and 3: AtLYK4 LP + AtLYK4 RP, 2 and 4: AtLYK4 LB + AtLYK5 RP, 5 and 7: AtLYK5 LP + AtLYK5 RP, 6 and 8: AtLYK5 LB + AtLYK5 RP.
Figure 2—figure supplement 2
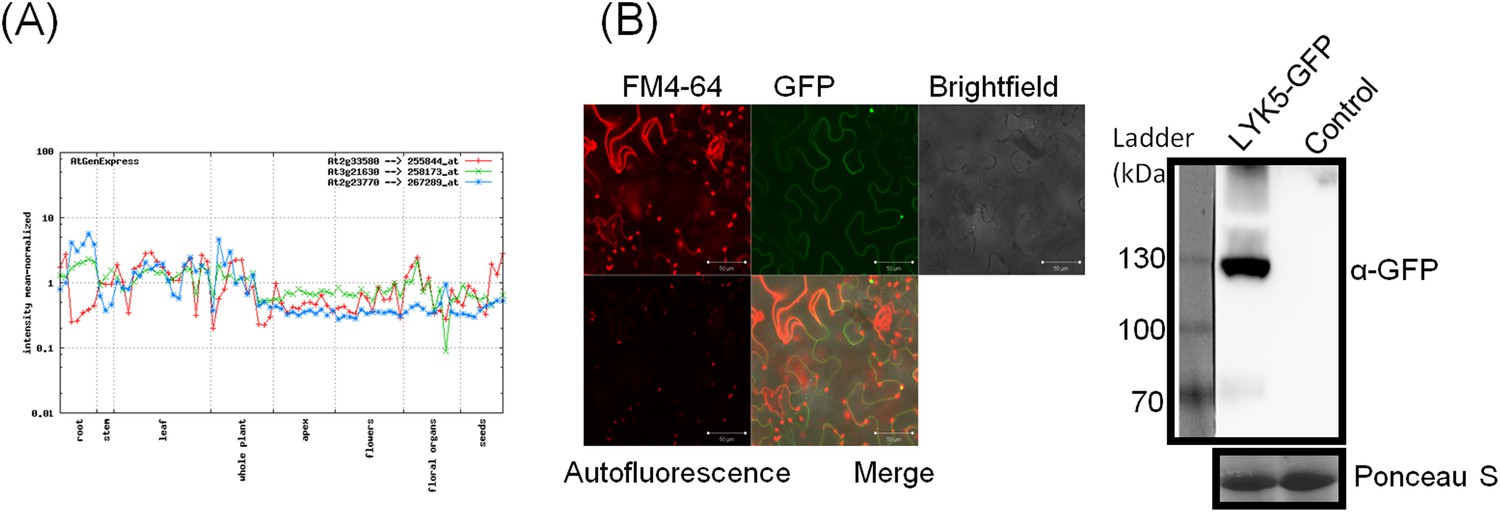
Tissue-specific expression of AtCERK1, AtLYK4, and AtLYK5.
(A) AtCERK1 (At3g21630), AtLYK4 (At2g23770) and AtLYK5 (At2g33580) gene expression in different developmental stages predicted by AtGenExpress Visualization Tool (AVT) . Results can also be seen at http://jsp.weigelworld.org/expviz/expviz.jsp. (B) Subcellular localization of AtLYK5 in Nicotiana bethamiana. Leaf expressing AtLYK5-GFP was stained with FM4-64 before monitoring epifluorescence signal using confocal microscopy (Left panel). Right panel showed expression of AtLYK5-GFP detected by immunoblot using anti-GFP.
Figure 3 with 1 supplement
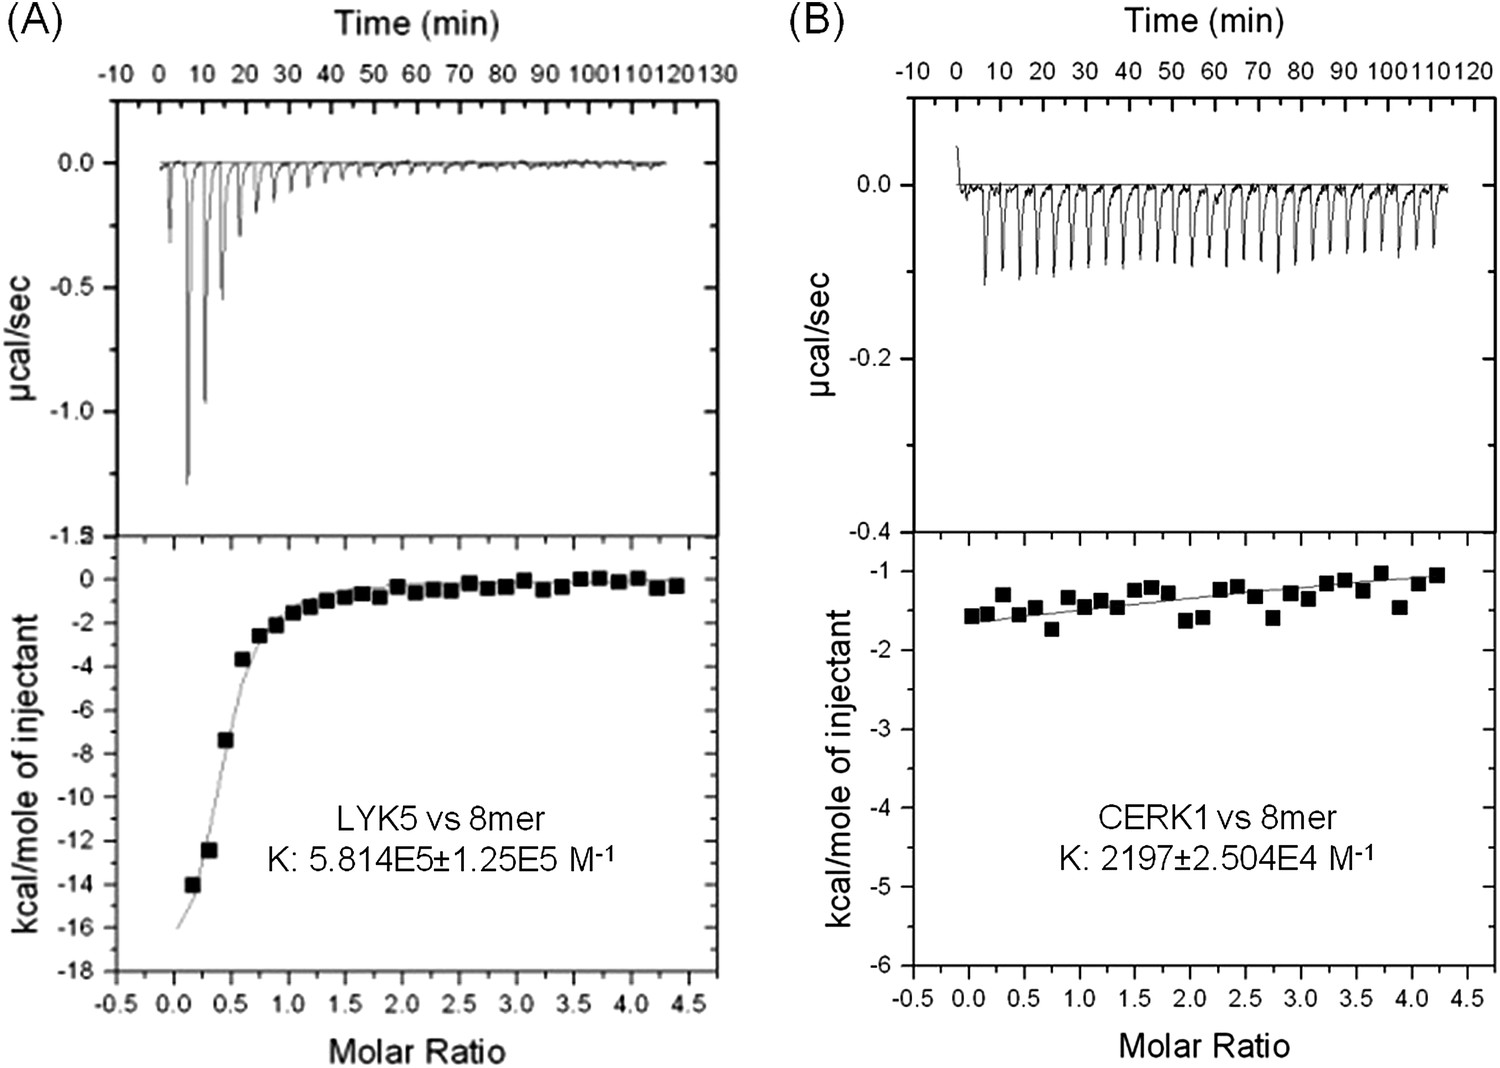
AtLYK5 shows stronger chitin binding affinity than AtCERK1.
The binding affinity of AtLYK5 (A) and AtCERK1 (B) to chitooctaose (GlcNAc)8 was measured using isothermal titration calorimetry (ITC). Proteins were purified from E. coli. Upper panels and lower panels indicate raw data and integrated heat values, respectively.
Figure 3—figure supplement 1
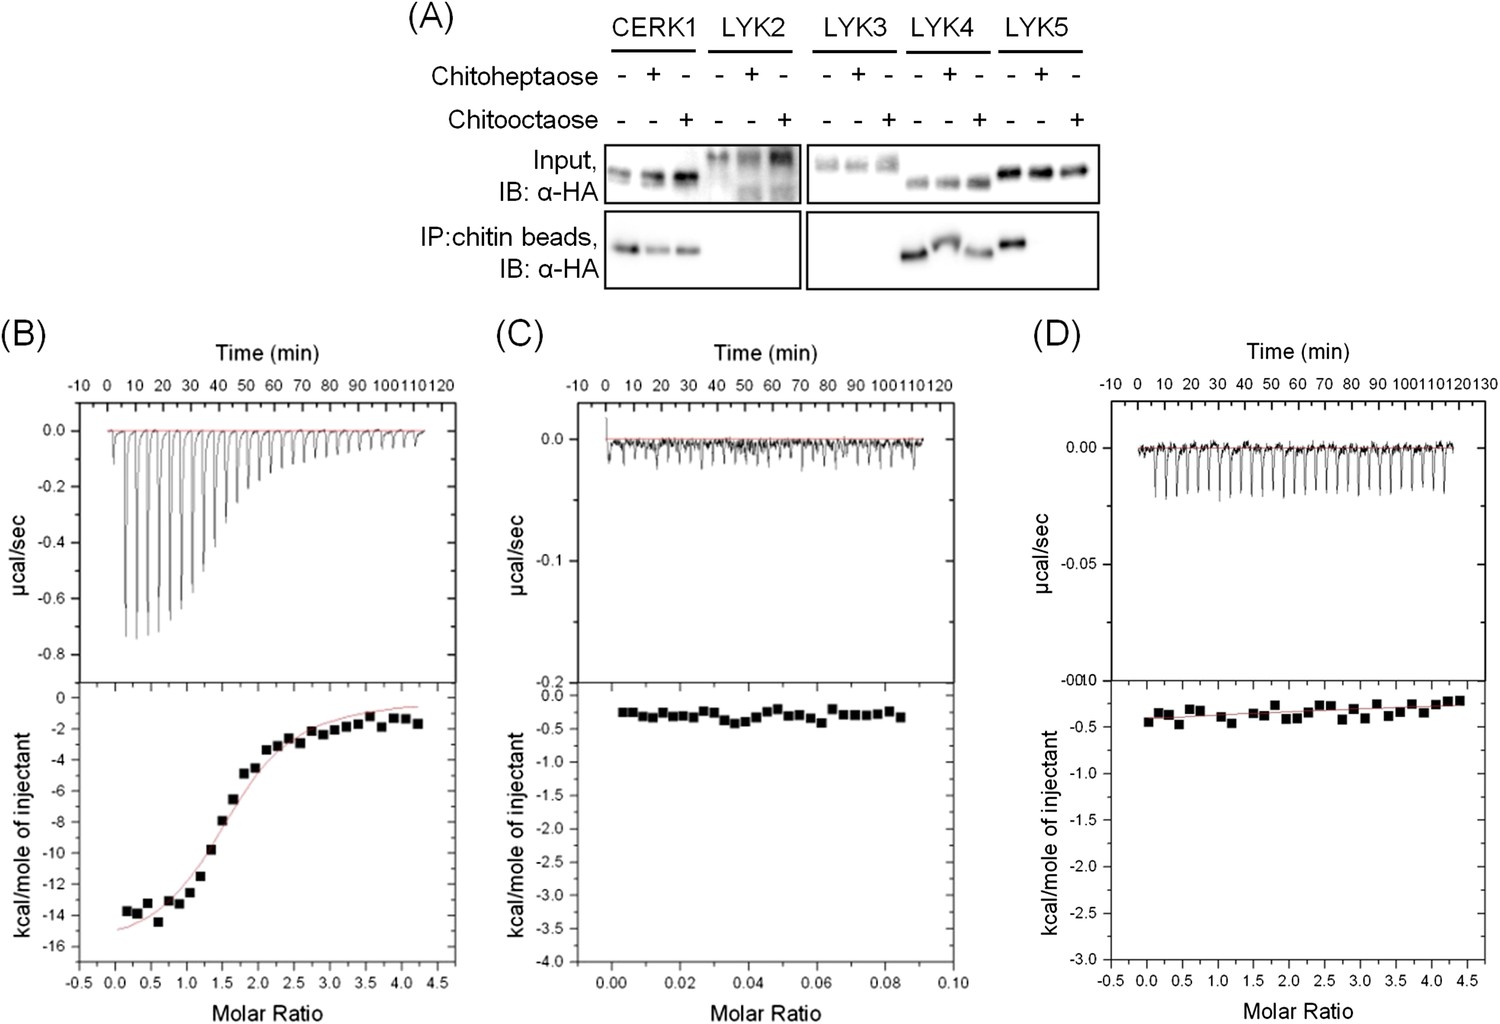
AtLYK5 has chitooctaose binding affinity.
(A) Chitin binding of AtLYK proteins detected using chitin-magnetic beads. HA-tagged AtCERK1 and AtLYK2-5 were expressed from the 35S promoter in protoplasts made from Col-0 wild type plants. Protoplasts were treated either with 10 µM of the specific chitin oligomer noted above for 15 min (+) or with H2O (−) before harvest. Proteins were pulled-down using chitin magnetic beads (New England Biolabs, Ipswich, MA). Upper panel shows input of each protein, lower panel shows proteins after chitin binding. IB, immnunoblot with anti-HA antibody. (B–C) Wheat germ agglutinin binds to chitin with high affinity. Binding of wheat germ agglutin in the (B) presence of chitin (GlcNAc)8 or (C) buffer. Binding was measured using isothermal titration calorimetry (ITC). Upper panels and (lower panels) indicate raw data and integrated heat values, respectively. (D) Binding affinity of AtLYK5 in presence of chitin (GlcNAc)4. Binding was measured using isothermal titration calorimetry (ITC). Upper panels and (lower panels) indicate raw data and integrated heat values, respectively.
Figure 4 with 1 supplement

Tyr-128 and Ser-206 are important for AtLYK5-mediated chitin response.
(A) A computational ribbon structure of the AtLYK5 ectodomain was built based on crystal structure of fungal ECP6. The model shows the three AtLYK5 LysM domains, i.e. LysM1-3. Each LysM domain contains two beta strands and two helixes interconnected via loops. (B) The binding affinity was calculated at −8.9 kcal mol−1. The binding site was formed by 3 LysM motifs. Green lines depict hydrogen bonds formed between ligand atoms and their corresponding residues atoms. (C) Reactive oxygen species (ROS) was measured within 30 min after chitin treatment. The AtLYK5 wild-type gene or versions with specific point mutations were transformed into Atlyk5-2 mutant plants. Eight individual transgenic plants were used for this measurement. Data are mean ± SE. Asterisks indicate significant difference relative to H2O treated Col-0 wild-type plants. (p < 0.01, Student's t test). (D) Chitin binding affinity of AtLYK5 and AtLYK5 mutant proteins as labeled in (C) detected by anti-HA antibody. Upper panel shows input of each transgenic plant, lower panel shows western blot after pull down with chitin-magnetic beads.
Figure 4—figure supplement 1
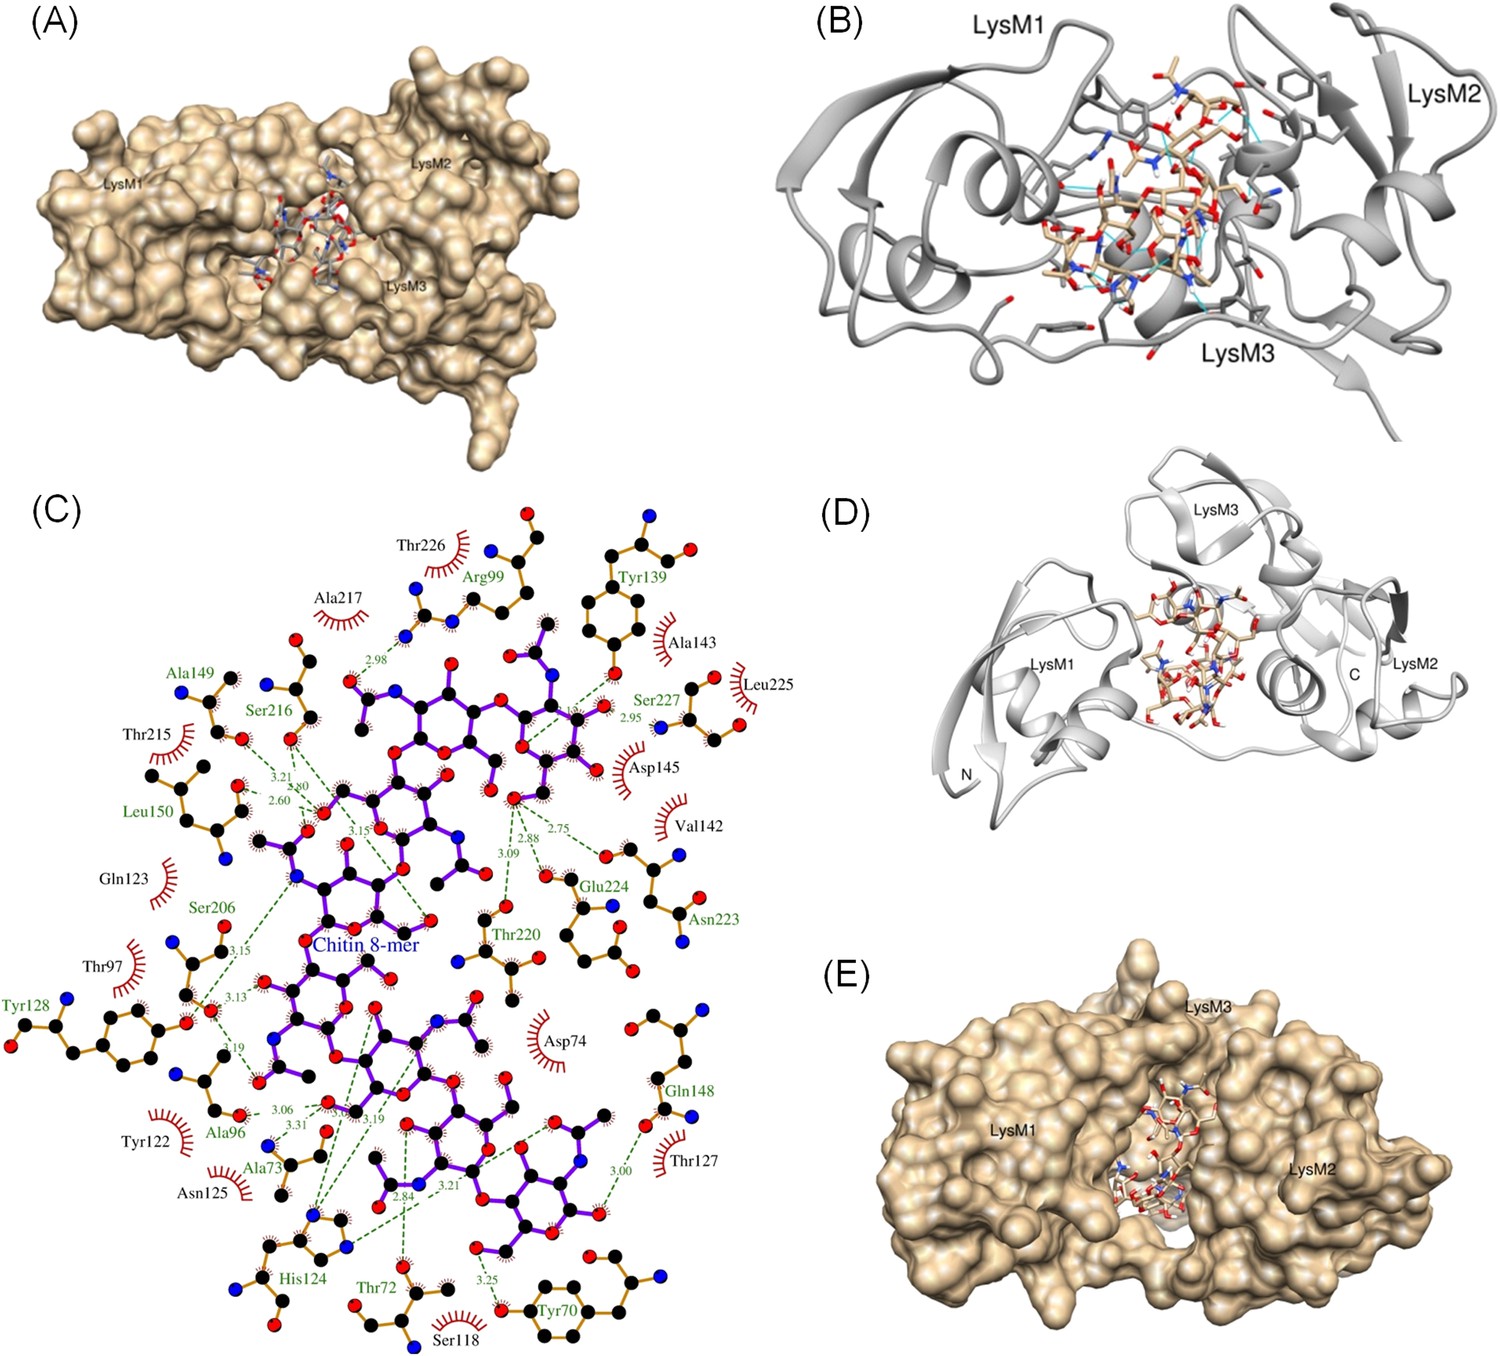
Computational model of the extracellular domain of AtLYK5.
(A–C) The docking model of the ectodomain with chitooctaose shown in surface (A) and ribbon form (B) and a close-up surface (C). The binding affinity was calculated at −8.9 kcal mol−1. The model shows the three AtLYK5 LysM domains, that is, LysM1-3. Each LysM domain contains two beta strands and two helixes interconnected via loops. (D–E) Docking of chitooctaose to the ECP6. (D) A ribbon structure represents the docking model of ECP6 (gray color) and chitooctaose (blue, red and yellow sticks). The binding affinity was calculated at −9.0 kcal mol−1. (E) A molecular surface of ECP6 with chitooctaose binding site formed by 3 LysM motifs.
Figure 5 with 1 supplement
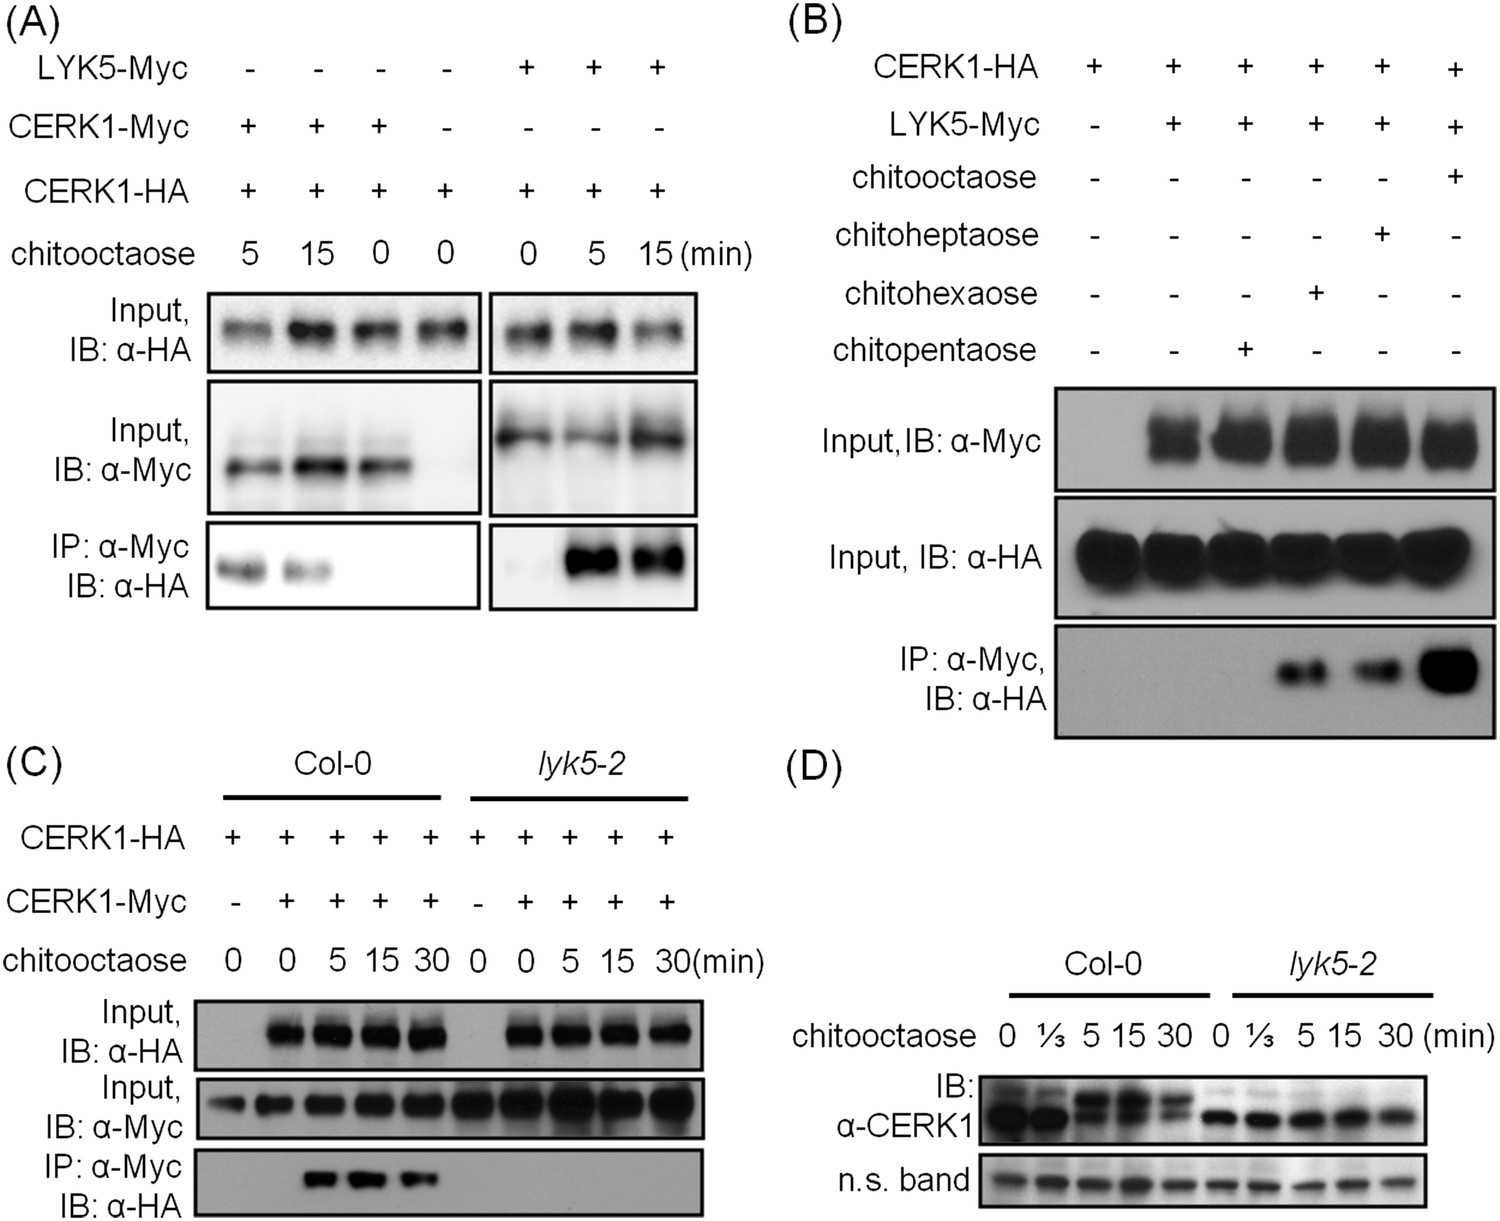
AtLYK5 regulates chitin-induced phosphorylation and homodimerization of AtCERK1.
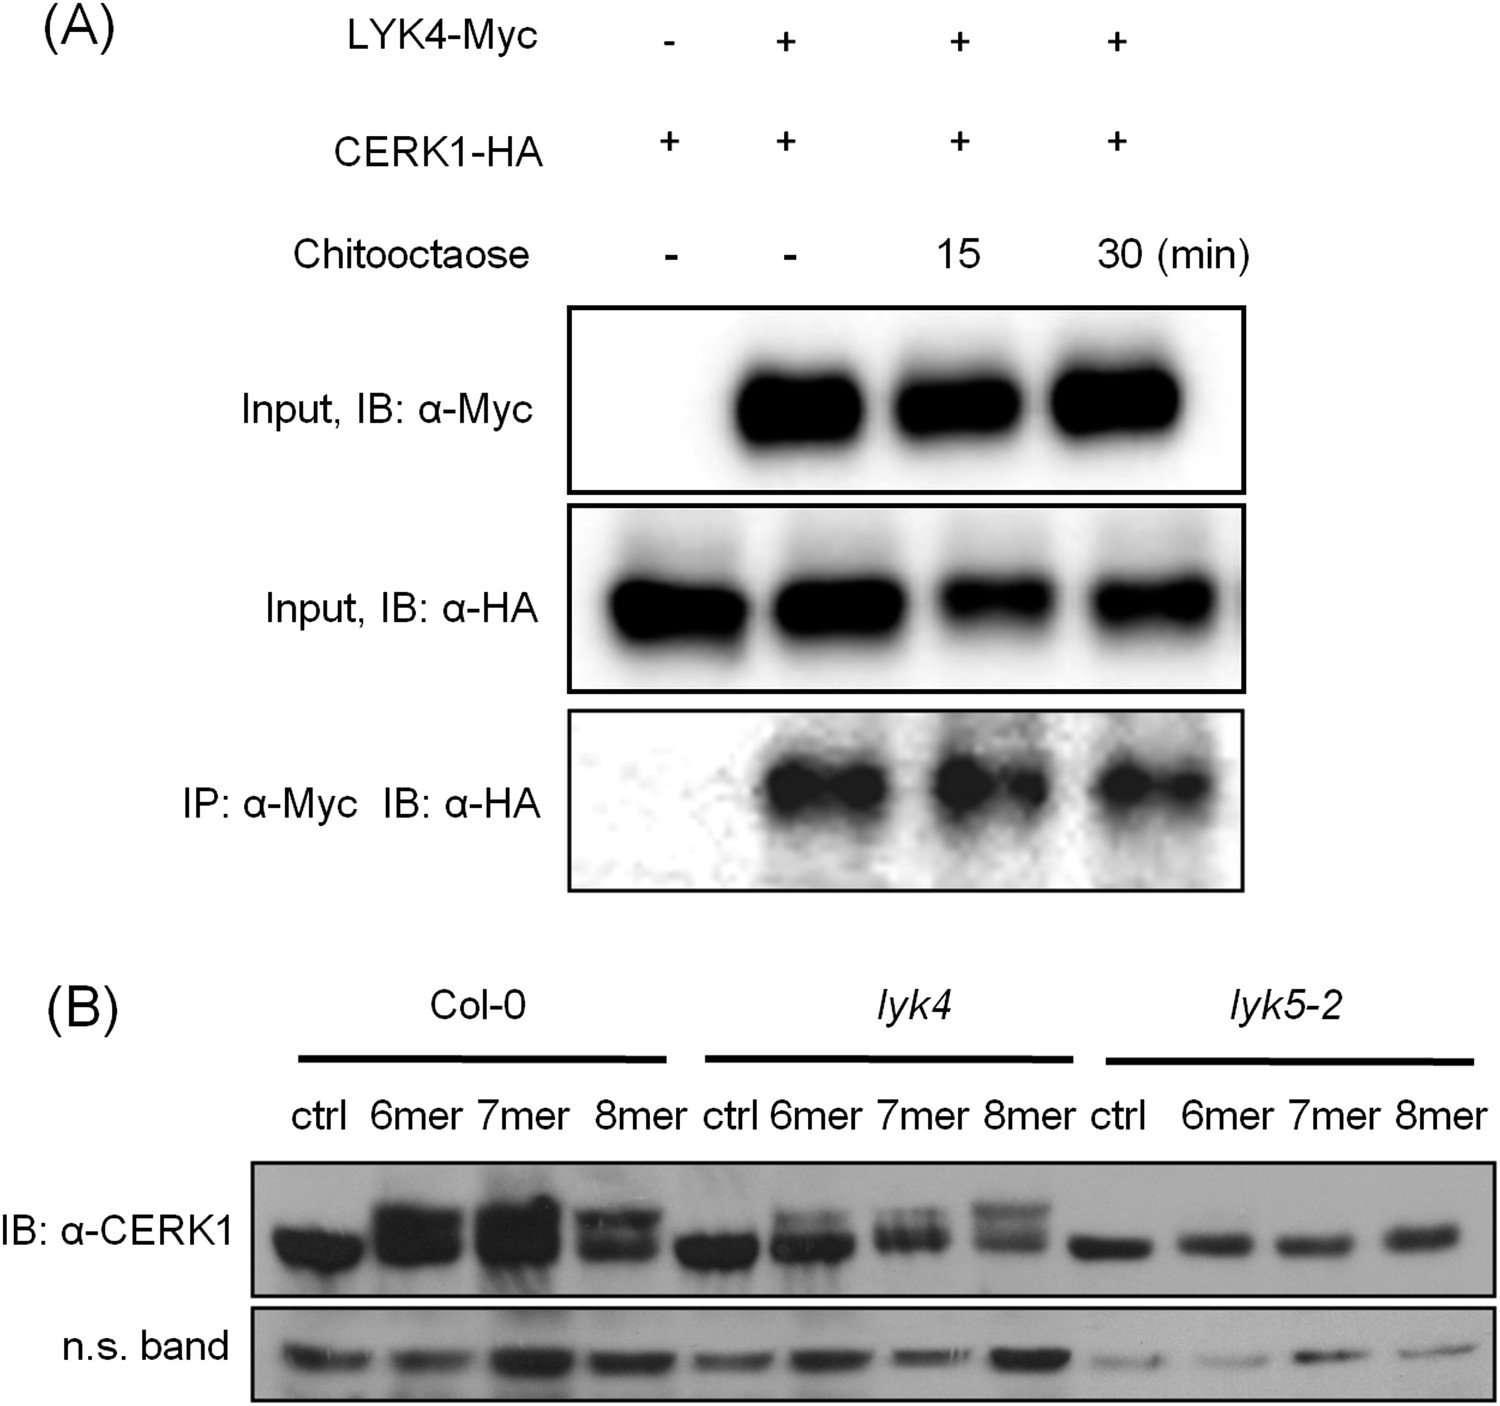
(A) AtLYK5 associates with AtCERK1 after chitin treatments. HA-tagged AtCERK1 and Myc-tagged AtLYK5 or AtCERK1 were co-expressed in protoplasts made from Col-0 wild-type plants. Protoplasts were harvested with or without the treatment with 1 µM chitooctaose as labeled above. Co-immunoprecipitation was made using anti-Myc antibody. Left panel and right panel are cropped from the same gel. (B) The association between AtCERK1 and AtLYK5 is induced by different chitin oligomers. Protoplasts were treated with different chitin oligomers (1 µM) as shown above for 15 min. (C) AtLYK5 regulates chitin-induced AtCERK1-AtCERK1 association. HA-tagged AtCERK1 and Myc-tagged AtCERK1 were copexpressed in protoplasts made from Col-0 wild-type or Atlyk5-2 mutant plants. Protoplasts were harvested with or without the treatment with 1 µM chitooctaose. Co-immunoprecipitation was made using anti-Myc antibody. (D) AtLYK5 controls chitin-induced phosphorylation of AtCERK1. Plant leaves from wild-type and the Atlyk5-2 mutant plants were treated with 1 µM chitooctaose for the time shown above. Anti-AtCERK1 antibody was used to detect the phosphorylation status of AtCERK1 shown as a shift in protein migration. Lower panel shows a non-specific band used to assess similar loading of each lane.
Figure 5—figure supplement 1
AtLYK4 associates with AtCERK1 before and after chitin treatment.
(A) Interaction between AtCERK1 and AtLYK4. HA-tagged AtCERK1 and Myc-tagged AtLYK4 were co-expressed in protoplasts from Col-0 wild type plants. Protoplasts either prior (−) or after treatment with 1 µM chitooctaose were harvested. Co-immunoprecipitation used anti-Myc antibody. IB, immunoblot detected with either anti-HA or anti-Myc antibodies. (B) Chitin-induced phopshorylation of AtCERK1. Mature leaves from Col-0 wild-type, Atlyk4, and Atlyk5-2 mutant plants were treated with 1 µM chitin oligomers for 15 min. Total protein was separated on 7% SDS-PAGE and immunoblots were detected with anti-AtCERK1 antibody. Protein band shift indicates phosphorylation. 6mer: chitohexaose, 7mer: chitoheptaose, and 8mer: chitooctaose. Upper panel shows immunoblot probed with anti-AtCERK1 antibody, lower panel shows a non-specific band detected by anti-AtCERK1 antibody as a loading control.
Figure 6 with 1 supplement
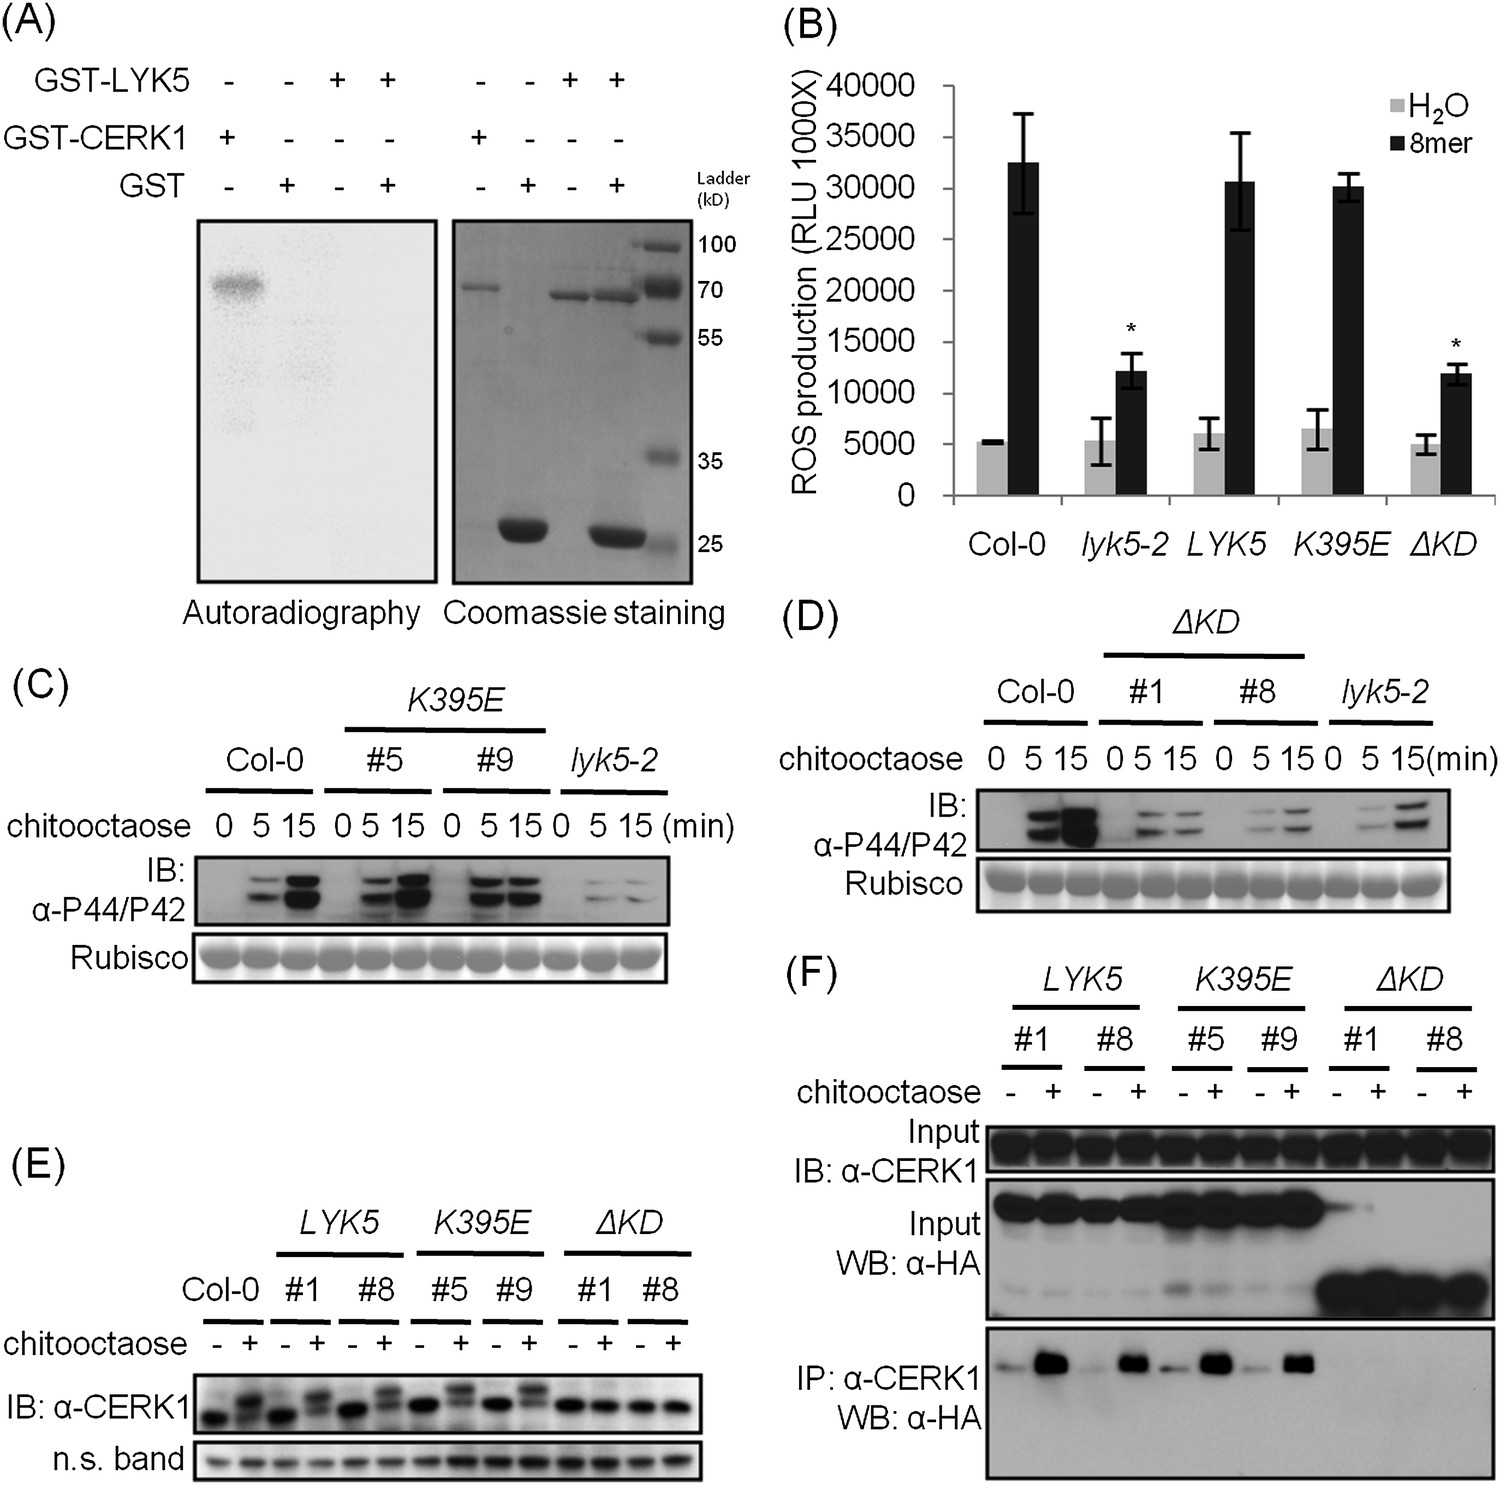
The kinase domain of AtLYK5 is critical for chitin signaling.
(A) In vitro kinase activities of AtCERK1 (255–617 aa) and AtLYK5 (309–664 aa) were measured by incorporation of γ-[32P]-ATP. Left panel shows autoradiography, and right panel shows gel stained with coomassie brilliant blue. (B–F) Plant tissues were harvested before (−) or 15 min after (+) treatment or at the time point shown in each figure of treatment with 1 µM chitooctaose. (B–E) AtLYK5K395E but not AtLYK5ΔKD (1–320 aa) complemented the Atlyk5-2 mutant as determined by chitin-triggered ROS production. Asterisks indicate significant difference relative to H2O treated Col-0 wild-type plants. (Data are mean ± SE (n = 8), p < 0.01, Student's t test), MPK phosphorylation, and chitin-induced AtCERK1 phosphorylation. Upper panel of each figure show immunoblot data, lower panel shows either rubisco band stained with ponceau S solution (C and D) or a non-specific band (E) to show similar loading of each lane. Plant tissues were harvested before (−) or after (+) 15 min treatment with 1 µM chitooctaose. (F) AtLYK5K395E but not AtLYK5ΔKD coimmunoprecipitates with AtCERK1 after chitin elicitation. Co-IP was made using anti-AtCERK1 antibody with proteins from transgenic Arabidopsis Atlyk5-2 mutant plants expressing either AtLYK5, or AtLYK5K395E or AtLYK5ΔKD. 8mer: chitooctaose, AtLYK5, K395E, and ΔKD indicate transgenic Arabidopsis expressing AtLYK5, AtLYK5K395E, and AtLYK5ΔKD, respectively. Different number indicates different transgenic lines used in this study.
Figure 6—figure supplement 1
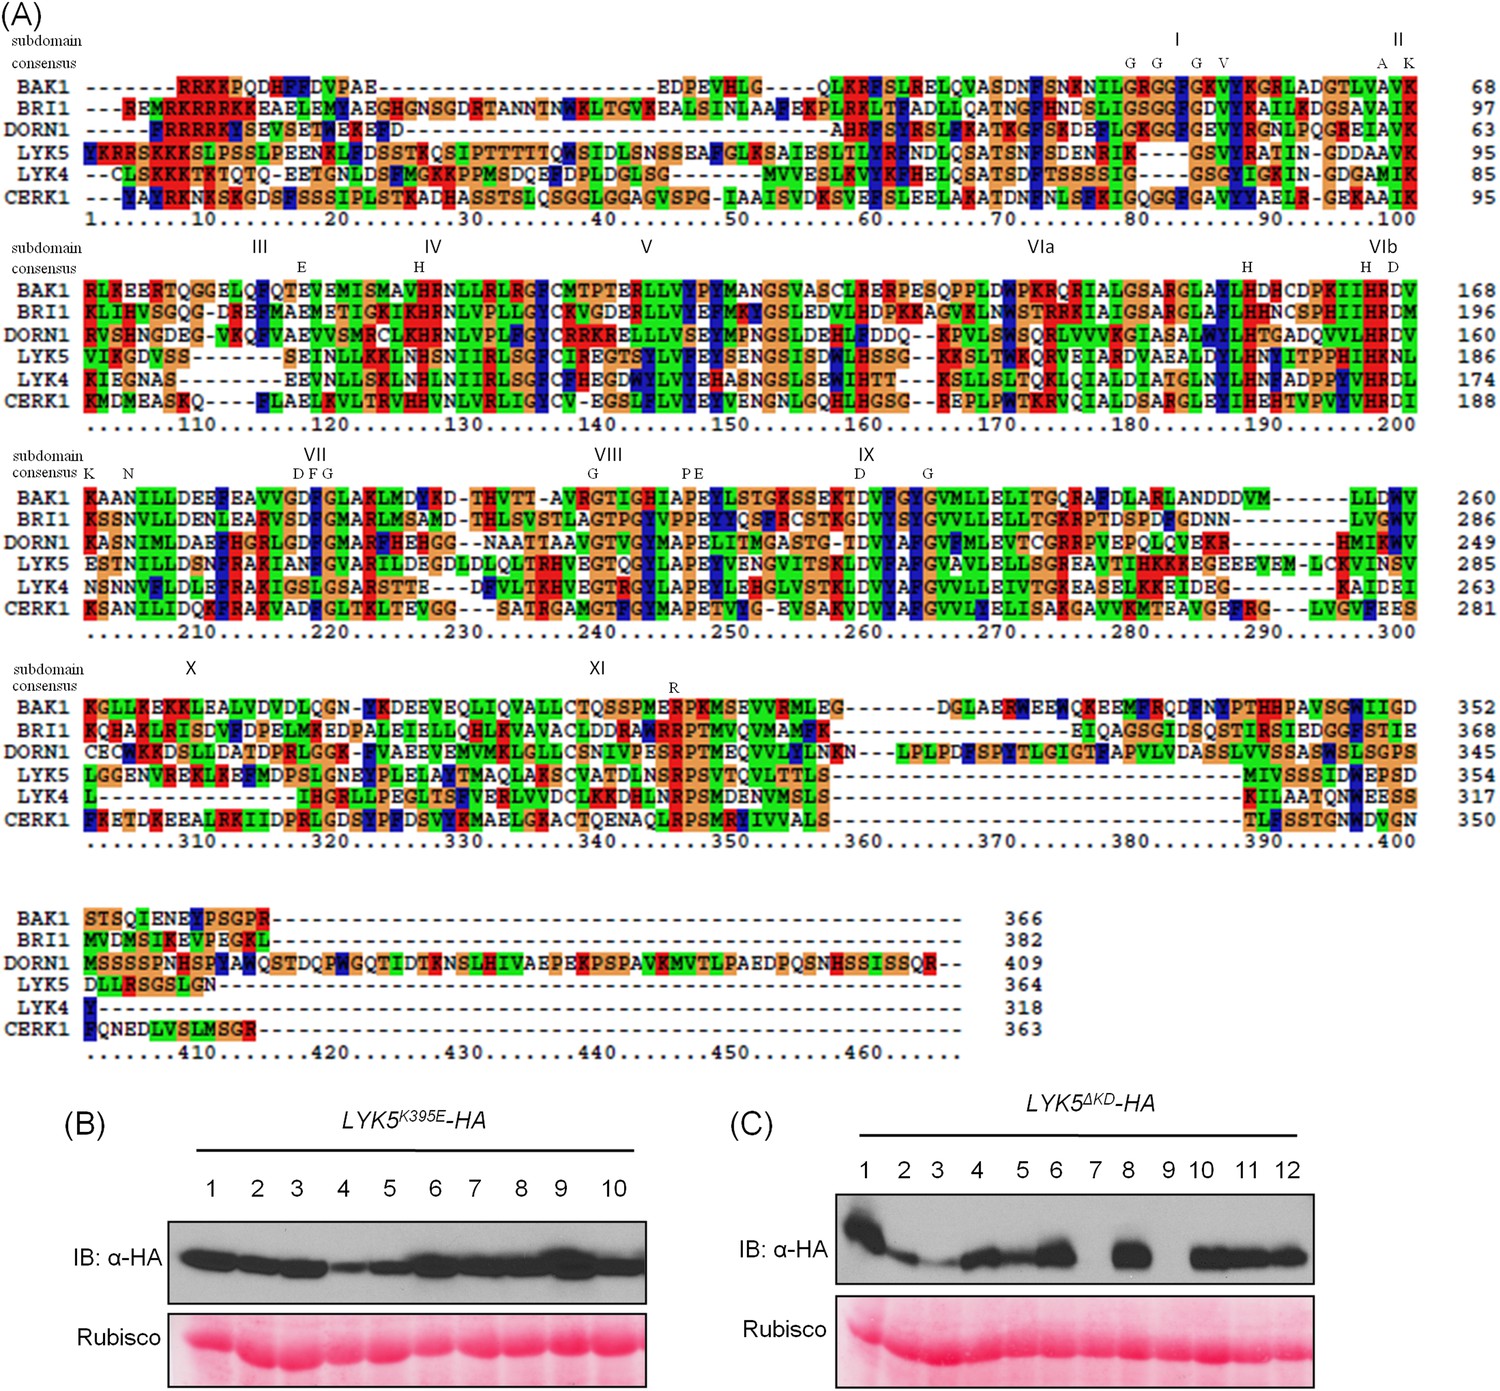
AtLYK5 is a kinase inactive protein.
(A) AtLYK5 lacks conserved residues required for kinase activity. Sequence alignment was done using the entire intracellular domain of AtLYK5 and other, selected receptor kinases. Each kinase subdomain is labeled by as Roman numeral and the conserved residues of each subdomain are shown below these numbers. Amino acids sequences of each kinase used for alignment are shown as following: AtBAK1 (At4g33430): 297–662 aa, AtBRI1 (At4g39400): 815–1196 aa, AtDORN1 (At5g60300): 310–718 aa, AtLYK5 (At2g33580): 301–664 aa, AtLYK4 (At2g23770): 295–612 aa, AtCERK1 (At3g21630): 255–671 aa. (B–C) Expression of AtLYK5K395E (B) and AtLYK5ΔKD (C) with a C-terminal HA tag from the native promoter in Atlyk5-2 mutant plants. Upper panel shows protein level detected using anti-HA antibody, lower panel shows similar loading of each lane stained with ponceau S solution. AtLYK5ΔKD: 1–320 aa.
Figure 7 with 1 supplement
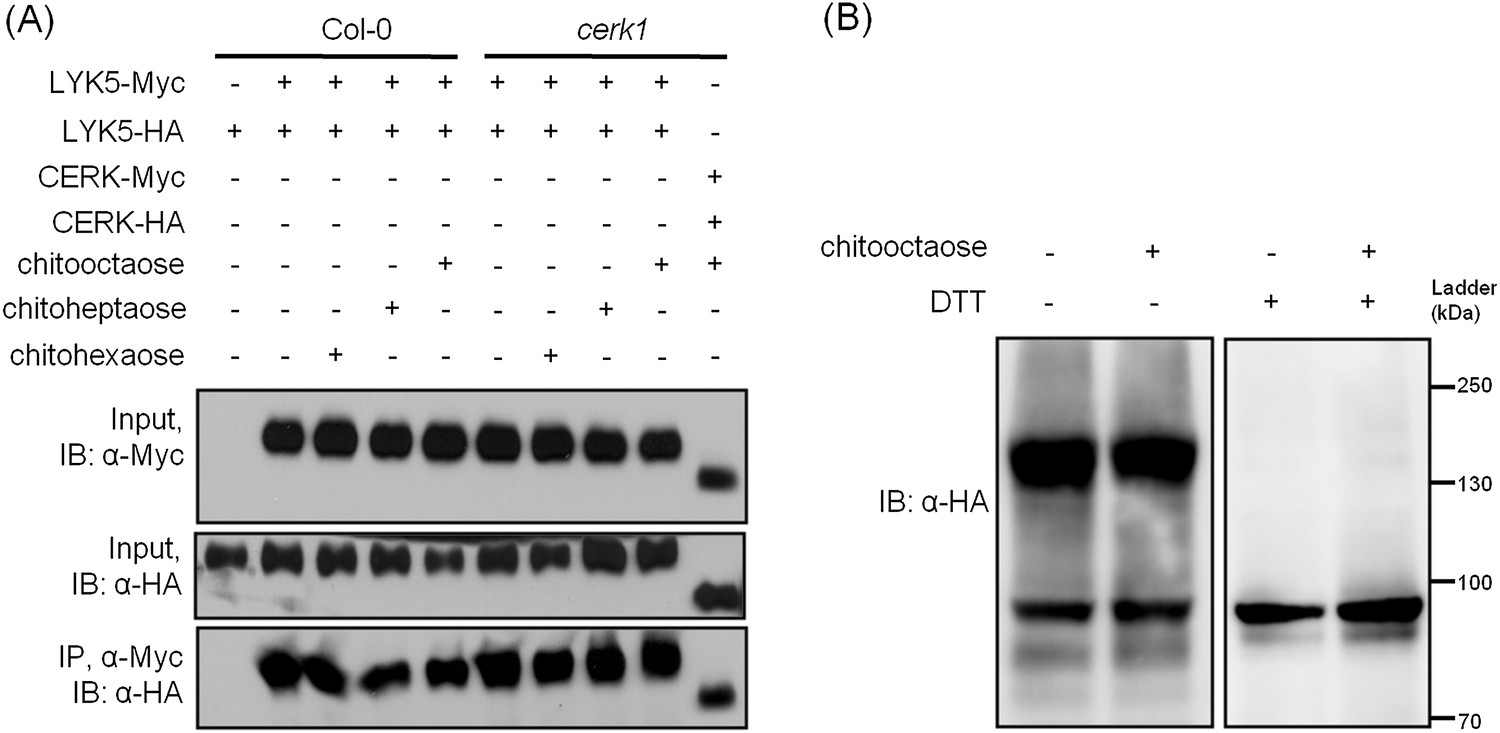
AtLYK5 forms a homodimer.
(A) Homodimeriztion of AtLYK5 is independent on the presence of CERK1 or chitin elicitation. AtLYK5-HA and AtLYK5-Myc, or AtCERK1-HA and AtCERK1-Myc were co-expressed in protoplasts made from Col-0 and Atcerk1 mutant plants. Protoplasts were harvested before (−) or 15 min after (+) treatment with 1 µM different chitin oligomers. Co-immunoprecipitation was made using anti-Myc antibody. (B) Dithiothreitol (DTT) treatment converts AtLYK5 dimer to monomer. Crude protein was extracted from transgenic Arabidopsis expressing AtLYK5-HA in Atlyk5-2 mutant plants. Plant tissues were harvested before (−) and 15 min after (+) treatment with 1 µM chitooctaose. Crude proteins from these tissues were boiled for 5 min before (−) or after (+) adding 50 mM DTT. Left panel and right panel of the immunoblot detected with anti-HA antibody are from the same gel.
Figure 7—figure supplement 1
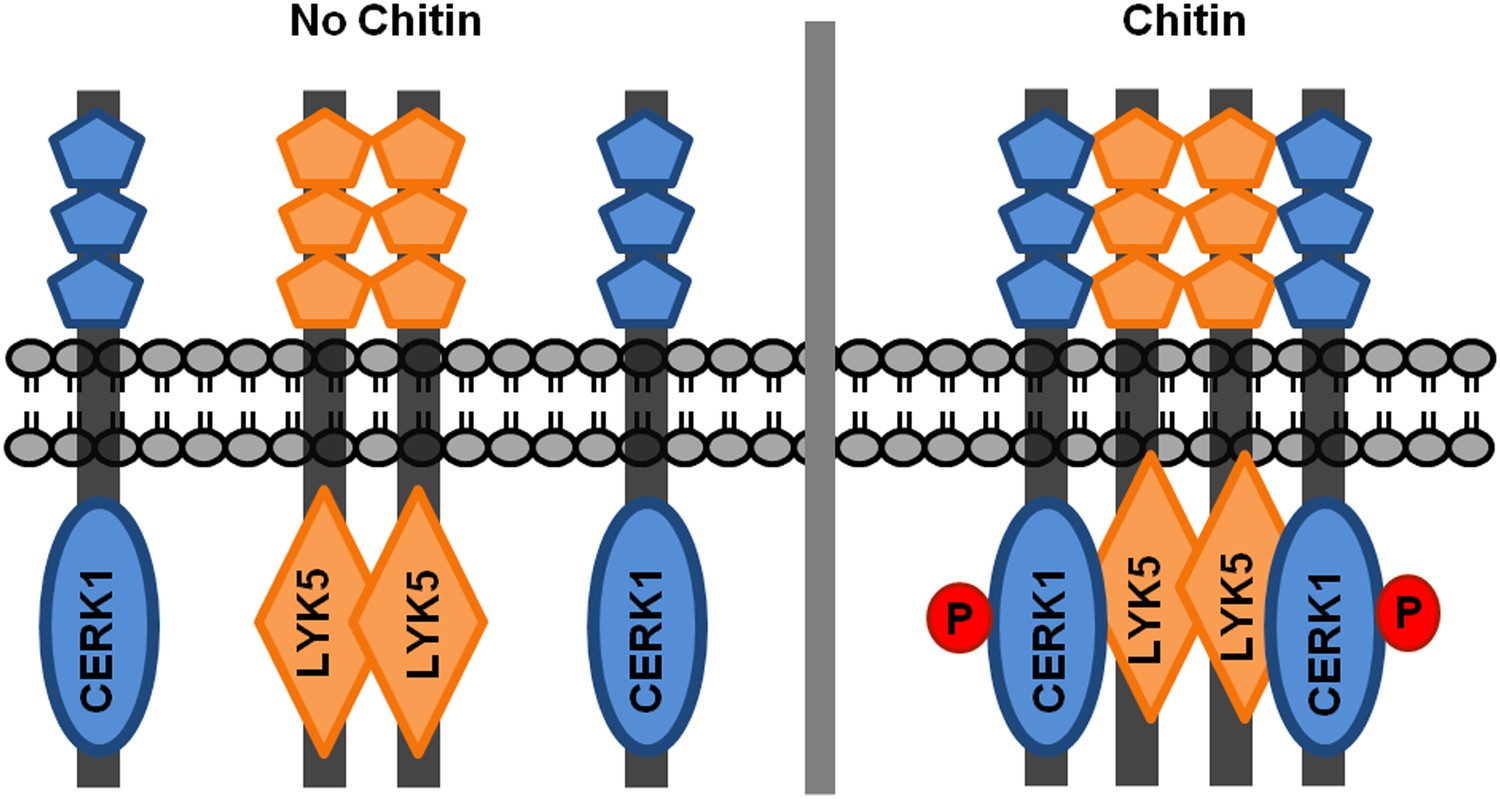
A possible working model of chitin receptor in Arabidopsis.
Before chitin treatment, AtLYK5 is present as a homodimer. After chitin elicitation, AtCERK1 associates with AtLYK5 to form a possible tetremer to mediate chitin signaling, and AtCERK1 will be phosphorylated at the same time. In this model, AtLYK5 (or AtLYK4) serves as a chitin perception, while AtCERK1 is responsible for chitin signaling transduction due to lack of kinase activity of AtLYK5 (or AtLYK4).
Additional files
-
Supplementary file 1
Primer sequences used in this study.
- https://doi.org/10.7554/eLife.03766.022
Download links
A two-part list of links to download the article, or parts of the article, in various formats.
Downloads (link to download the article as PDF)
Open citations (links to open the citations from this article in various online reference manager services)
Cite this article (links to download the citations from this article in formats compatible with various reference manager tools)
The kinase LYK5 is a major chitin receptor in Arabidopsis and forms a chitin-induced complex with related kinase CERK1
eLife 3:e03766.
https://doi.org/10.7554/eLife.03766


