Vitamin A supplements, routine immunization, and the subsequent risk of Plasmodium infection among children under 5 years in sub-Saharan Africa
- Johns Hopkins University, United States
- University of Oxford, United Kingdom
Figures
Figure 1
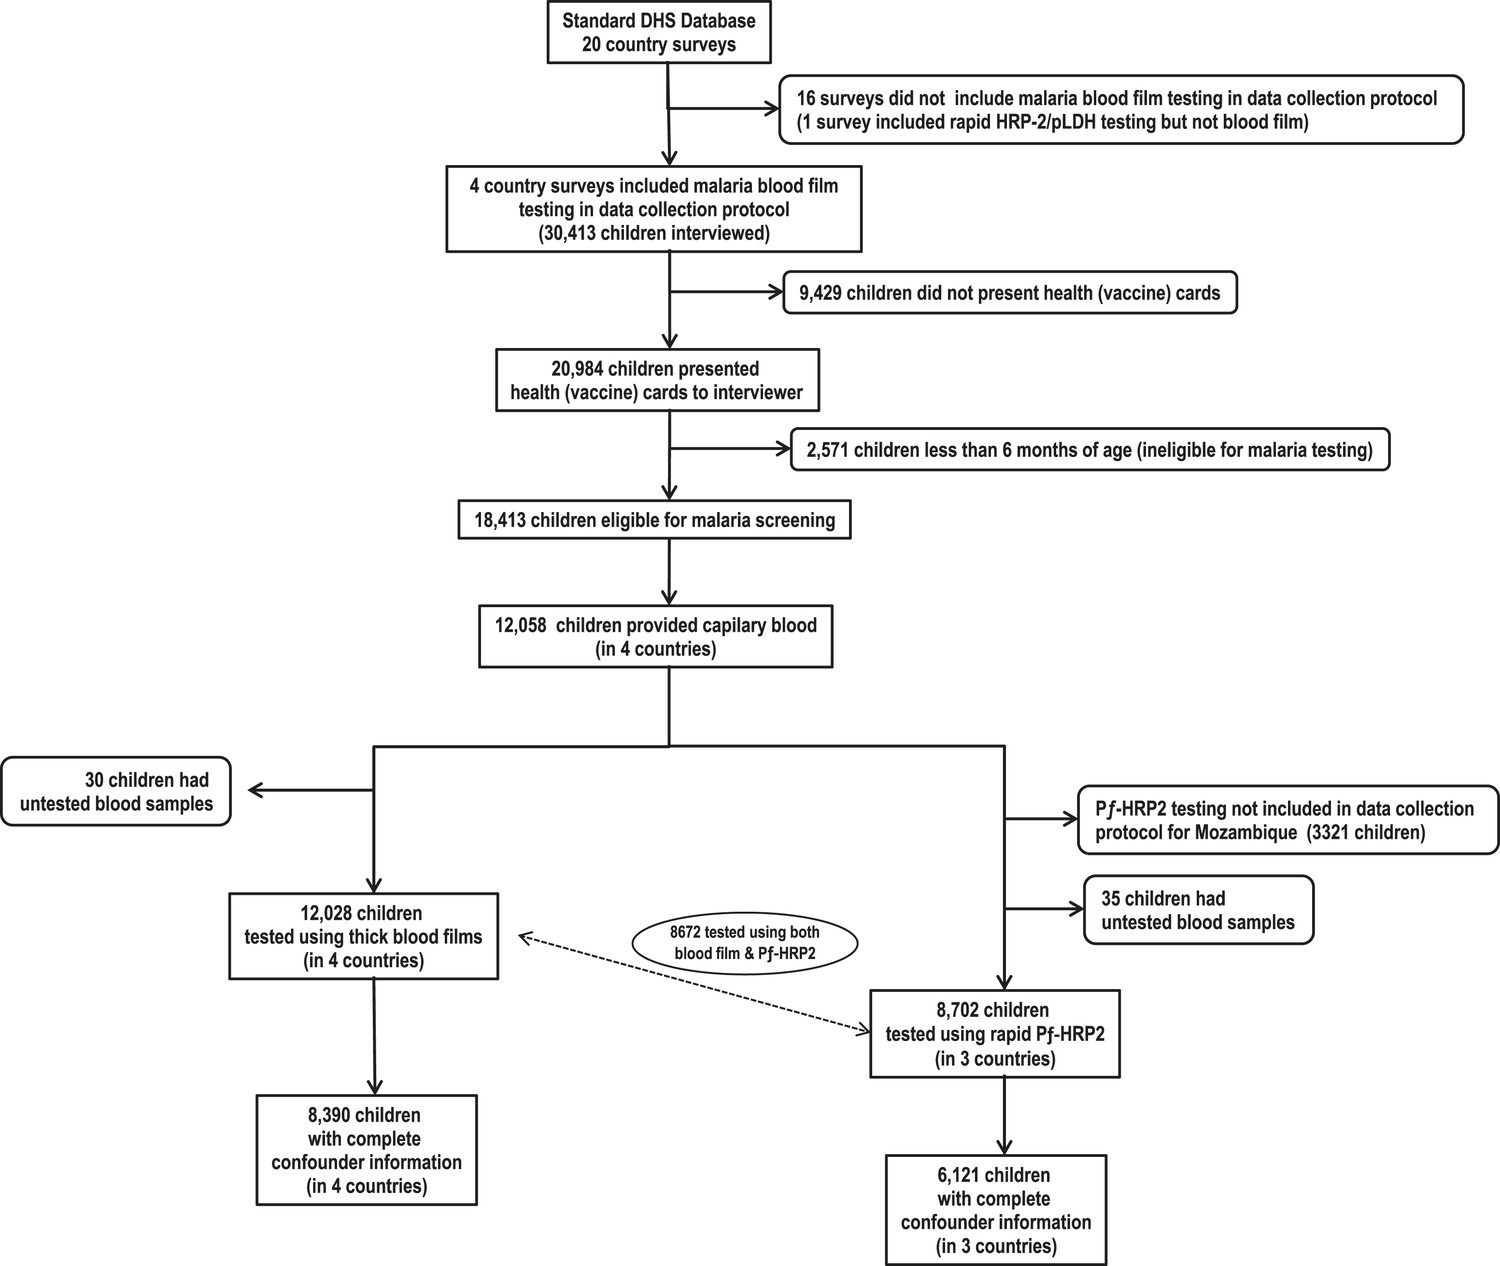
Flow chart of subjects.
https://doi.org/10.7554/eLife.03925.003
Figure 2
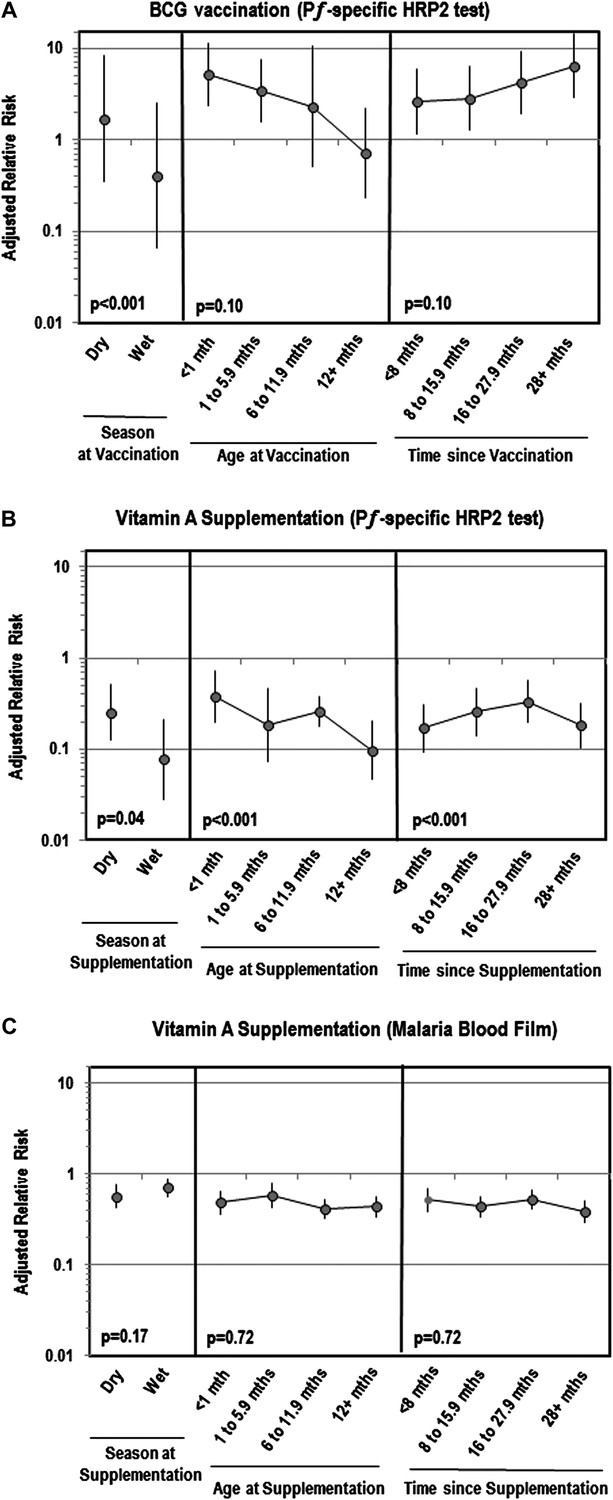
Adjusted relative risk of malaria infection according to different features of vitamin A supplementation and BCG vaccination
(Liu et al., 2012; World Health Organization, 2012). (A) Adjusted for the following factors: age, gender, wealth index score, mother's highest level of education, malaria treatment during previous week, ownership of bed net, proportion of household members under 5 years using bed net during previous night, indoor household insecticide spraying, mother's access to antenatal care during last pregnancy, mother's knowledge regarding vertical HIV transmission, malaria transmission season, and type of community setting (urban vs rural). (B) Covariates ‘Age at vaccination’ and ‘Time since vaccination’ treated as continuous terms when testing for effect modification in the model. (C) Seasonality only available for children vaccinated in 2010 or 2011 calendar year.
Author response image 1
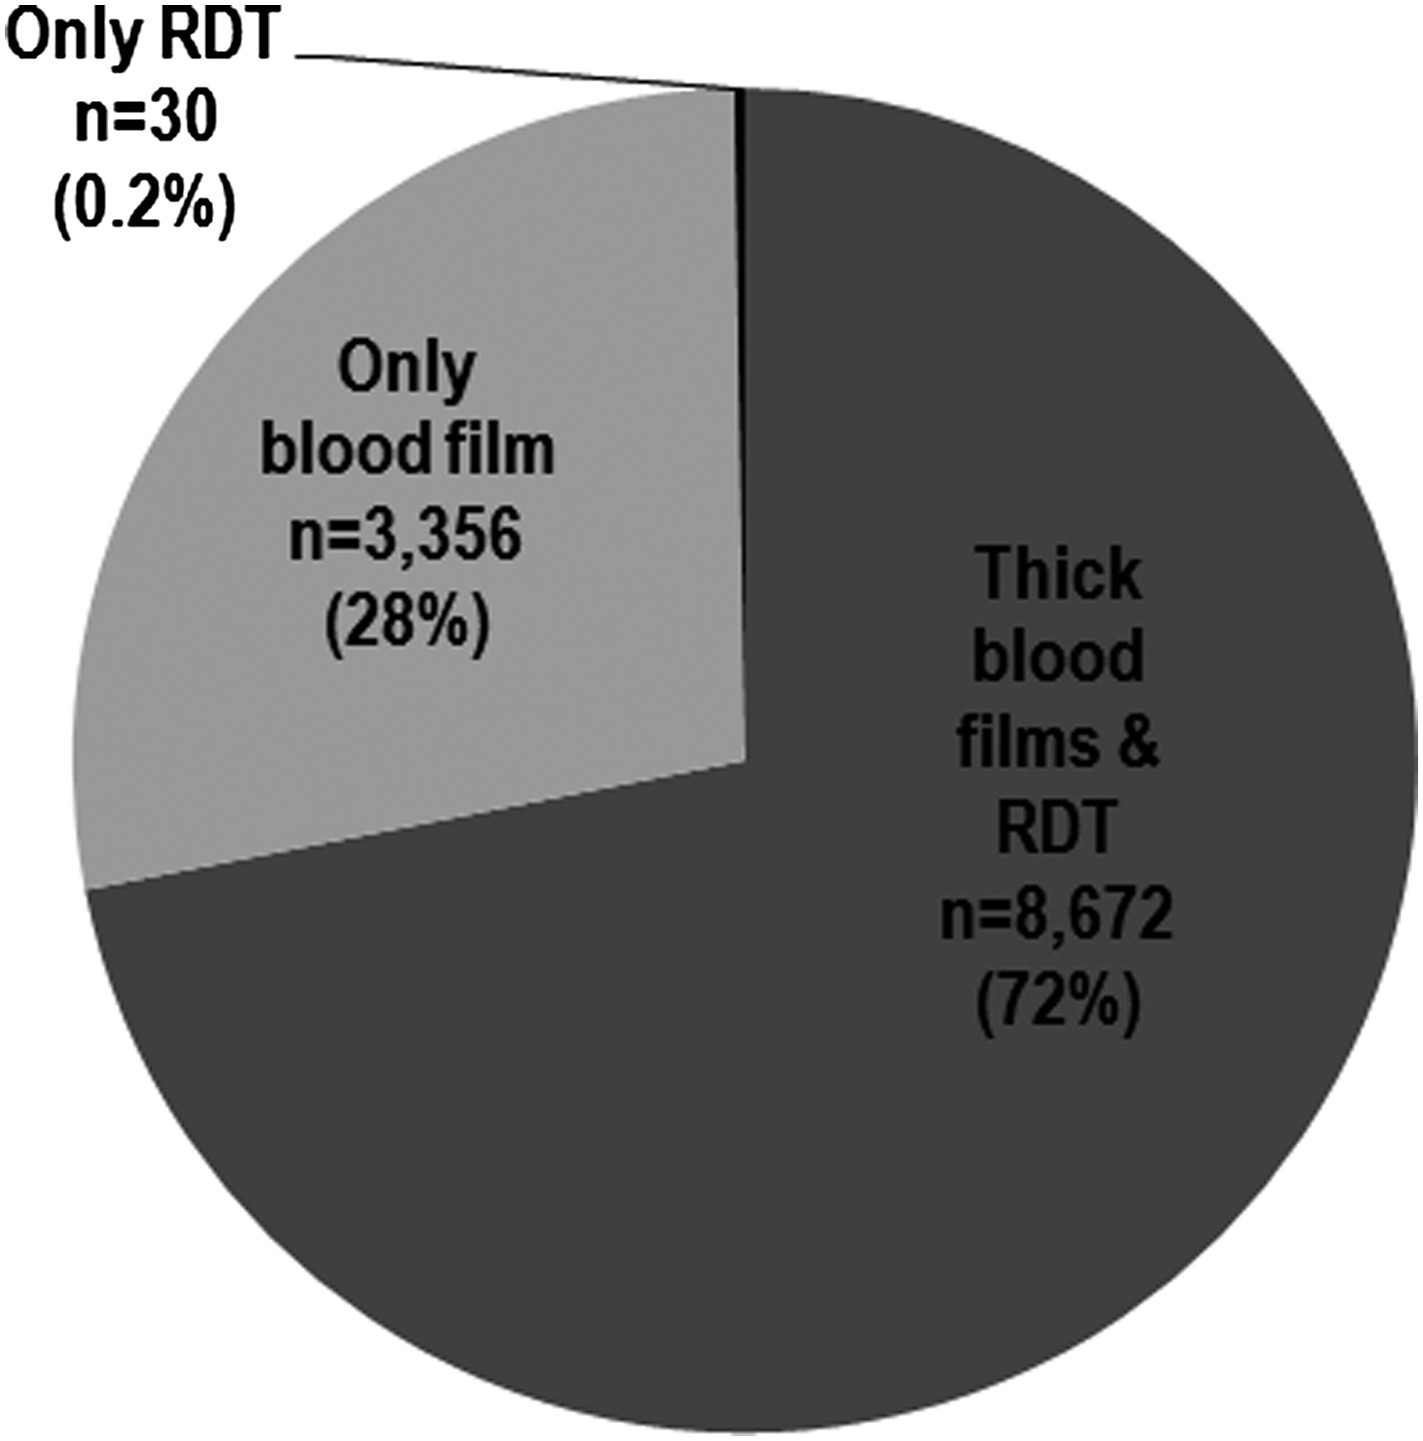
Proportion of children tested according to type of diagnostic used.
Tables
Table 1
Baseline characteristics of 8390 children tested for malaria using blood film, by survey location
| Characteristic | Location of survey | Overall (n=8390) | |||
|---|---|---|---|---|---|
| Burkina Faso (n=2821) | Mozambique (n=2266) | Rwanda (n=2085) | Senegal (n=1218) | ||
| Communities surveyed, n | 537 | 607 | 490 | 371 | 2005 |
| (a) Children tested for malaria, n (%) | |||||
| Parasitemia | 2821 (99) | 2266 (100) | 2085 (99) | 1218 (99) | 8390 (99) |
| Positive result among children tested for parasitemia | 1696 (60) | 578 (25) | 16 (0.8) | 22 (1.8) | 2312 (28) |
| Pƒ-HRP-2 | 2821 (100) | na | 2060 (99) | 1217 (99) | 6098 (99)* |
| Positive results among children tested for Pƒ-HRP-2 | 2051 (73) | na | 35 (1.7) | 27 (2.2) | 2113 (35) |
| (b) Type of immunization received, n (%) | |||||
| Bacille Calmette Guerin (BCG) | 2799 (99) | 2004 (96) | 2050 (100) | 1160 (98) | 8013 (98) |
| Diphtheria–tetanus–pertussis (DTP) | 2721 (97) | 2107 (97) | 2055 (98) | 1161 (98) | 8044 (98) |
| Measles | 2225 (80) | 1668 (78) | 1727 (86) | 830 (73) | 6450 (80) |
| Poliomyelitis | 2810 (100) | 2156 (99) | 2061 (100) | 1204 (100) | 8231 (99) |
| Vitamin A | 87 (9.3) | 1554 (87) | 351 (72) | 190 (59) | 2182 (62) |
| (c) Children's characteristics | |||||
| Age in months, median (IQR) | 22 (13–32) | 20 (13–31) | 24 (14–36) | 19 (12–29) | 22 (13–32) |
| Girls, n (%) | 1347 (48) | 1151 (51) | 1020 (49) | 551 (45) | 4069 (48) |
| Primigravidae, n (%) | 443 (16) | 477 (21) | 432 (21) | 251 (21) | 1603 (19) |
| Low birth weight, n (%) | 867 (31) | 1003 (44) | 672 (32) | 536 (44) | 3078 (37) |
| (d) Malaria-based interventions, n (%) | |||||
| Child's family owns bed net | 2160 (77) | 1528 (67) | 1983 (95) | 1040 (85) | 6711 (80) |
| Child received antimalarial during past week | 314 (11) | 117 (5.2) | 50 (2.4) | 24 (2.0) | 505 (6.0) |
| Child's house had indoor insecticide spraying | 22 (0.8) | 541 (24) | na | 148 (12) | 711 (8.5)† |
| Mother took antimalarial during child's gestational period | 2616 (93) | 1109 (50) | 337 (16) | 1110 (91) | 5162 (62) |
| (e) Genetic mechanisms of malaria protection, median (IQR) | |||||
| Mean predicted HbS allele frequency | 0.06 (0.05–0.06) | 0.03 (0.01–0.03) | 0.03 (0.03–0.03) | 0.07 (0.06–0.07) | 0.04 (0.03–0.06) |
| Median predicted G6PDd allele frequency | 0.06 (0.05–0.09) | 0.15 (0.15–0.17) | 0.04 (0.04–0.05) | 0.10 (0.09–0.13) | 0.08 (0.05–0.14) |
| (f) Climate of communities surveyed, median (IQR) | |||||
| Annual range of enhanced vegetation index (EVI) | 0.29 (0.24–0.32) | 0.33 (0.22–0.40) | 0.25 (0.20–0.29) | 0.28 (0.18–0.34) | 0.28 (0.22–0.33) |
| Annual mean of EVI for the year | 0.22 (0.18–0.25) | 0.40 (0.32–0.47) | 0.39 (0.36–0.42) | 0.18 (0.16–0.20) | 0.29 (0.20–0.40) |
| No. of days which EVI above annual mean | 136 (120–160) | 88 (56–128) | 320 (168–384) | 208 (184–264) | 152 (120–200) |
| No. of days for rainy season (corresponding to first and last day EVI above annual mean) | 136 (120–152) | 128 (72–344) | 344 (296–352) | 216 (152–352) | 168 (120–344) |
-
*
Pƒ-HRP-2 testing not conducted as part of DHS survey protocol for Mozambique.
-
†
Information on insecticide spraying not collected as part of survey.
Table 2
Relative risk of malaria infection after standard vaccination and vitamin A supplementation among children 6–59 months of age
| Type of immunization | No. of children vaccinated/total tested (%) | No. of children with positive blood test (%) | Unadjusted RR | Adjusted RR (95% CI)‡,§ | ||
|---|---|---|---|---|---|---|
| No vaccine | Vaccine | Unweighted | Weighted (IPW) | |||
| (a) Plasmodium species (parasitemia)* | ||||||
| Bacille Calmette Guerin (BCG) | 8013/8140 (98) | 41 (32) | 2227 (28) | 0.81 | 1.25 (0.81–1.91) | 1.24 (0.76–2.05) |
| Diphtheria–tetanus–pertussis (DTP) | 8044/8235 (98) | 83 (44) | 2202 (27) | 0.49 | 0.88 (0.64–1.20) | 0.06 (0.01–0.47) |
| Measles | 6450/8069 (80) | 473 (29) | 1784 (28) | 0.93 | 1.11 (0.96–1.29) | 1.01 (0.20–5.19) |
| Poliomyelitis | 8231/8272 (99) | 14 (34) | 2278 (28) | 0.74 | 0.80 (0.37–1.73) | 0.74 (0.27–2.01) |
| Vitamin A supplement | 2182/3523 (62) | 596 (44) | 438 (20) | 0.31 | 0.46 (0.39–0.54) | 0.43 (0.36–0.52) |
| (b) Plasmodium falciparum (antigenemia) | ||||||
| Bacille Calmette Guerin (BCG) | 6006/6047 (99) | 9 (22) | 2102 (35) | 1.91 | 4.06 (2.00–8.28) | 3.52 (1.66–7.48) |
| Diphtheria–tetanus–pertussis (DTP) | 5933/6054 (98) | 59 (49) | 2049 (35) | 0.55 | 1.34 (0.88–2.02) | 0.06 (0.01–0.38) |
| Measles | 4776/5937 (80) | 410 (35) | 1679 (35) | 0.99 | 1.15 (0.97–1.38) | 0.68 (0.15–3.12) |
| Poliomyelitis | 6.072/6084 (99) | 5 (42) | 2111 (35) | 0.75 | 1.39 (0.55–3.49) | 0.93 (0.37–2.35) |
| Vitamin A supplement | 629/1749 (36) | 621 (56) | 75 (12) | 0.10 | 0.23 (0.17–0.29) | 0.22 (0.16–0.29) |
-
HRP-2: histidine rich protein-2; RR: relative risk; CI: confidence interval; IPW: inverse probability weighted model.
-
*
Tested in four countries: Burkina Faso, Mozambique, Rwanda and Senegal.
-
†
Tested in three countries: Burkina Faso, Rwanda and Senegal.
-
‡
Adjusted for the following factors: age, gender, wealth index score, mother's highest level of education, malaria treatment during previous week, ownership of bed net, proportion of household members under 5 years using bed net during previous night, indoor household insecticide spraying, mother's access to antenatal care during last pregnancy, mother's knowledge regarding vertical HIV transmission, malaria transmission season, and type of community setting (urban vs rural).
-
§
Inverse probability weighting (IPW) based on propensity score model with following factors: age, gender, low birth weight, presence of radio or television, urban versus rural setting, breastfeeding status, wealth index score, mother's age, mother's highest education level, antenatal care during last pregnancy, and mother's tetanus status during last pregnancy.
Table 3
Modifiers of the association between vitamin A supplementation and malaria infection among children 6–59 months of age
| Characteristics at blood testing | Level in the model | Plasmodium species (parasitemia)* | Plasmodium falciparum (antigenemia)† | |||||
|---|---|---|---|---|---|---|---|---|
| No. of children with positive blood film (%) | Unadjusted RR | Adjusted model3 | ||||||
| No vitamin A | Vitamin A | RR (95% CI) | p Value (interaction term) | Adjusted RR‡ (95%CI) | p Value (interaction term) | |||
| (a) Individual level | ||||||||
| Children's characteristics | ||||||||
| Age at malaria screening | 6–35 Months | 484 (43) | 344 (20) | 0.33 | 0.46 (0.38–0.55) | <0.01# | 0.26 (0.20–0.34) | <0.01# |
| 36–59 Months | 112 (54) | 94 (21) | 0.23 | 0.34 (0.25–0.47) | 0.09 (0.05–0.14) | |||
| Gender | Girl | 274 (44) | 226 (21) | 0.34 | 0.54 (0.44–0.67) | 0.29 | 0.23 (0.16–0.32) | 0.99 |
| Boy | 322 (45) | 212 (19) | 0.29 | 0.40 (0.32–0.49) | 0.23 (0.17–0.30) | |||
| Pregnancy order of child | Primigravidae | 522 (47) | 366 (21) | 0.30 | 0.45 (0.38–0.53) | 0.27 | 0.20 (0.15–0.27) | 0.04 |
| Multigravidae | 74 (31) | 72 (15) | 0.41 | 0.51 (0.39–0.66) | 0.33 (0.22–0.48) | |||
| Birth weight | 2500 mg or greater | 332 (42) | 204 (15) | 0.24 | 0.39 (0.32–0.48) | 0.01 | 0.27 (0.20–0.36) | 0.02 |
| Less than 2500 mg | 264 (48) | 234 (28) | 0.43 | 0.53 (0.43–0.66) | 0.13 (0.09–0.18) | |||
| Treatment for intestinal worms during past 6 months | Not received | 554 (46) | 212 (25) | 0.39 | 0.50 (0.40–0.61) | 0.08 | 0.38 (0.28–0.52) | 0.07 |
| Received | 37 (30) | 221 (17) | 0.46 | 0.66 (0.52–0.86) | 0.15 (0.11–0.21) | |||
| Malaria-based interventions | ||||||||
| Malaria treatment during previous week | Not received | 550 (44) | 404 (19) | 0.31 | 0.44 (0.37–0.52) | 0.24 | 0.20 (0.16–0.27) | 0.02 |
| Received | 46 (49) | 34 (33) | 0.51 | 0.88 (0.62–1.26) | 1.01 (0.60–1.68) | |||
| Mother took antimalarial during child's gestational period | No | 102 (28) | 226 (22) | 0.69 | 0.78 (0.59–1.03) | <0.001 | 0.38 (0.19–0.74) | 0.05 |
| Yes | 491 (50) | 210 (19) | 0.23 | 0.36 (0.30–0.45) | 0.20 (0.16–0.27) | |||
| Family owns bed net | Does not own bed net | 141 (47) | 123 (22) | 0.32 | 0.43 (0.34–0.56) | 0.42 | 0.20 (0.15–0.26) | 0.70 |
| Owns bed net | 455 (44) | 315 (41) | 0.31 | 0.48 (0.40–0.58) | 0.24 (0.18–0.32) | |||
| (B) Community level (primary sampling unit) | ||||||||
| Type of setting | Rural | 518 (50) | 370 (25) | 0.35 | 0.46 (0.39–0.56) | 0.95 | 0.22 (0.17–0.30) | 0.91 |
| Urban | 78 (26) | 68 (9.4) | 0.29 | 0.34 (0.22–0.51) | 0.22 (0.12–0.40) | |||
| Genetic mechanisms of malaria protection | ||||||||
| Mean predicted HbS allele frequency§ | Less than 2.5% | 14 (20) | 104 (14) | 0.78 | 0.78 (0.32–1.91) | <0.01# | - | 0.26# |
| 2.5–4.9% | 181 (41) | 269 (25) | 1.49 | 0.95 (0.64–1.42) | 0.96 (0.24–3.91) | |||
| 5% or greater | 401 (48) | 65 (18) | 0.21 | 0.31 (0.17–0.56) | 0.17 (0.08–0.39) | |||
| Median predicted G6PDd allele frequency§ | Less than 7.5% | 336 (47) | 47 (11) | 0.04 | 5.42 (2.01–14.6) | <0.001# | 1.43 (0.28–7.21) | 0.02# |
| 7.5–14.9% | 194 (43) | 128 (18) | 0.80 | 0.89 (0.52–1.50) | 0.41 (0.12–1.34) | |||
| 15% or greater | 66 (40) | 263 (25) | 0.65 | 0.74 (0.46–1.19) | - | |||
| Climate of communities surveyed | ||||||||
| Season of malaria transmission | Dry season | 198 (42) | 220 (19) | 0.32 | 0.40 (0.31–0.52) | 0.45 | 0.06 (0.03–0.13) | <0.001 |
| Wet season | 398 (46) | 218 (22) | 0.32 | 0.53 (0.42–0.66) | 0.39 (0.28–0.53) | |||
| Length of rainy season | Less than 120 days | 168 (49) | 151 (21) | 0.27 | 0.43 (0.31–0.61) | <0.001# | 0.28 (0.15–0.50) | 0.03# |
| 120–179 Days | 334 (56) | 105 (26) | 0.27 | 0.45 (0.33–0.62) | 0.22 (0.15–0.31) | |||
| 180 Days or more | 94 (23) | 182 (17) | 0.70 | 0.77 (0.56–1.05) | 0.21 (0.10–0.43) | |||
| Length of time enhanced vegetation index above annual mean | Less than 120 days | 105 (42) | 220 (21) | 0.38 | 0.50 (0.37–0.69) | 0.18# | 0.37 (0.09–1.60) | 0.84# |
| 120–179 Days | 486 (52) | 206 (27) | 0.34 | 0.52 (0.42–0.66) | 0.33 (0.24–0.45) | |||
| 180 Days or more | 5 (3.3) | 12 (3.2) | 0.97 | 0.43 (0.12–1.62) | 0.66 (0.16–2.85) | |||
| Range of enhanced vegetation index per year | Less than 0.20 | 46 (25) | 41 (7.9) | 0.26 | 0.38 (0.22–0.63) | 0.18# | 0.24 (0.13–0.47) | 0.13# |
| 0.20–0.29 | 247 (44) | 105 (17) | 0.25 | 0.48 (0.36–0.64) | 0.36 (0.25–0.53) | |||
| 0.30 or greater | 303 (51) | 292 (28) | 0.38 | 0.48 (0.39–0.61) | 0.19 (0.13–0.29) | |||
| Annual mean for enhanced vegetation index | Less than 0.20 | 150 (37) | 21 (7.2) | 0.13 | 0.17 (0.11–0.28) | <0.01# | 0.16 (0.10–0.25) | 0.01# |
| 0.20–0.29 | 309 (59) | 89 (24) | 0.22 | 0.51 (0.37–0.70) | 0.34 (0.23–0.51) | |||
| 0.30 or greater | 137 (33) | 328 (22) | 0.56 | 0.61 (0.46–0.81) | 0.56 (0.20–1.53) | |||
-
HRP-2: histidine rich protein 2; RR: relative risk; CI: confidence interval; na: not applicable: ref: reference category; HbS: hemoglobin S; G6PD: glucose 6-phosphate dehydrogenase deficiency.
-
*
Tested in four countries: Burkina Faso, Mozambique, Rwanda and Senegal.
-
†
Tested in three countries: Burkina Faso, Rwanda and Senegal.
-
‡
Adjusted for the following factors: age, gender, wealth index score, mother's highest level of education, malaria treatment during previous week, ownership of bed net, proportion of household members under 5 years using bed net during previous night, indoor household insecticide spraying, mother's access to antenatal care during last pregnancy, mother's knowledge regarding vertical HIV transmission, malaria transmission season, and type of community setting (urban vs rural).
-
§
Geographical waypoints were not recorded for 40 communities. Subjects from these PSUs were excluded from analysis.
-
#
Covariate treated as continuous term when testing for effect modification in the model.
Additional files
-
Supplementary file 1
Comparison of subject groups with complete and missing information on confounders.
- https://doi.org/10.7554/eLife.03925.008
-
Supplementary file 2
Comparison of standardized bias for factors associated with vaccine/vitamin A supplement uptake, before and after inverse probability weighting (IPW).
- https://doi.org/10.7554/eLife.03925.009
-
Supplementary file 3
Overview of immunization schedules for each country.
- https://doi.org/10.7554/eLife.03925.010
Download links
A two-part list of links to download the article, or parts of the article, in various formats.
Downloads (link to download the article as PDF)
Open citations (links to open the citations from this article in various online reference manager services)
Cite this article (links to download the citations from this article in formats compatible with various reference manager tools)
Vitamin A supplements, routine immunization, and the subsequent risk of Plasmodium infection among children under 5 years in sub-Saharan Africa
eLife 4:e03925.
https://doi.org/10.7554/eLife.03925


