Widespread correlation patterns of fMRI signal across visual cortex reflect eccentricity organization
- Princeton University, United States
- University of Toronto, Canada
- Worcester State University, United States
Figures
Figure 1 with 2 supplements
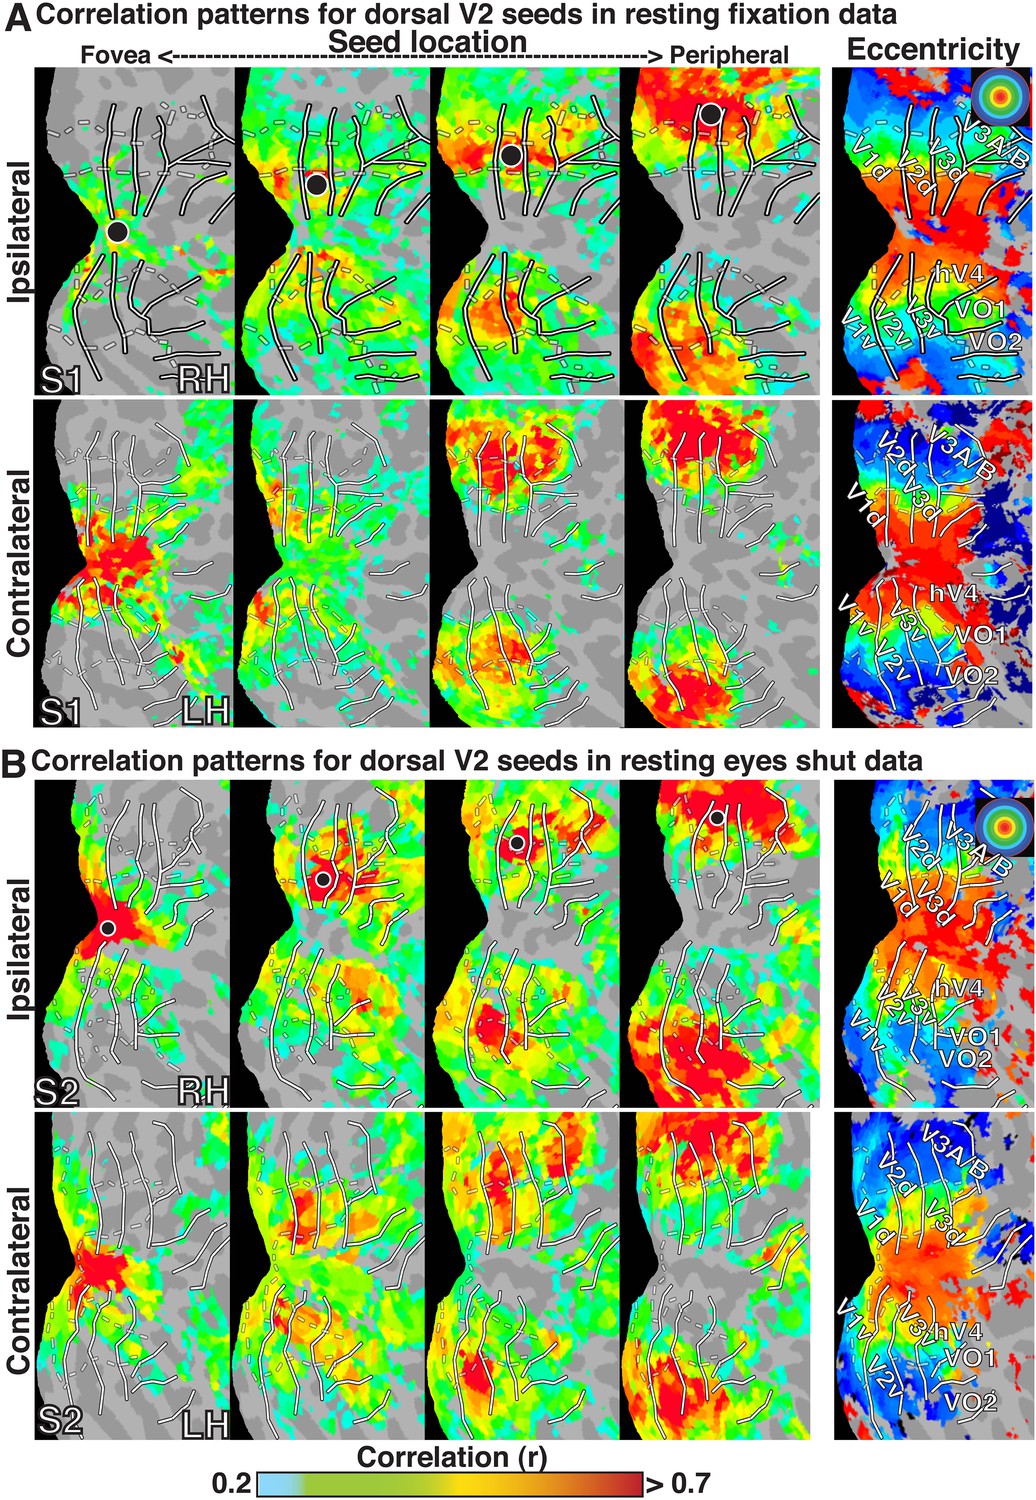
Seed-based correlations on resting state in individual subjects.
Correlation maps in both hemispheres of (A) subject S1 for resting fixation and (B) subject S2 for resting eyes shut at four seed locations (<1.0°, ∼2.5°, ∼5.5°, ∼11.5°; left to right) in dorsal V2 of the right hemisphere. For each seed, the strongest correlations (red / yellow) span several visuotopic areas within an eccentricity range roughly corresponding to that of the seed area (black dot) in both the ipsilateral and contralateral hemispheres. The correlations have a similar organization to eccentricity maps (far right). To facilitate visual comparisons between hemispheres, the left hemisphere images have been horizontally reflected. Solid white bars mark borders between visual field maps. White dashed bars outline three bands of iso-eccentricity.
Figure 1—figure supplement 1
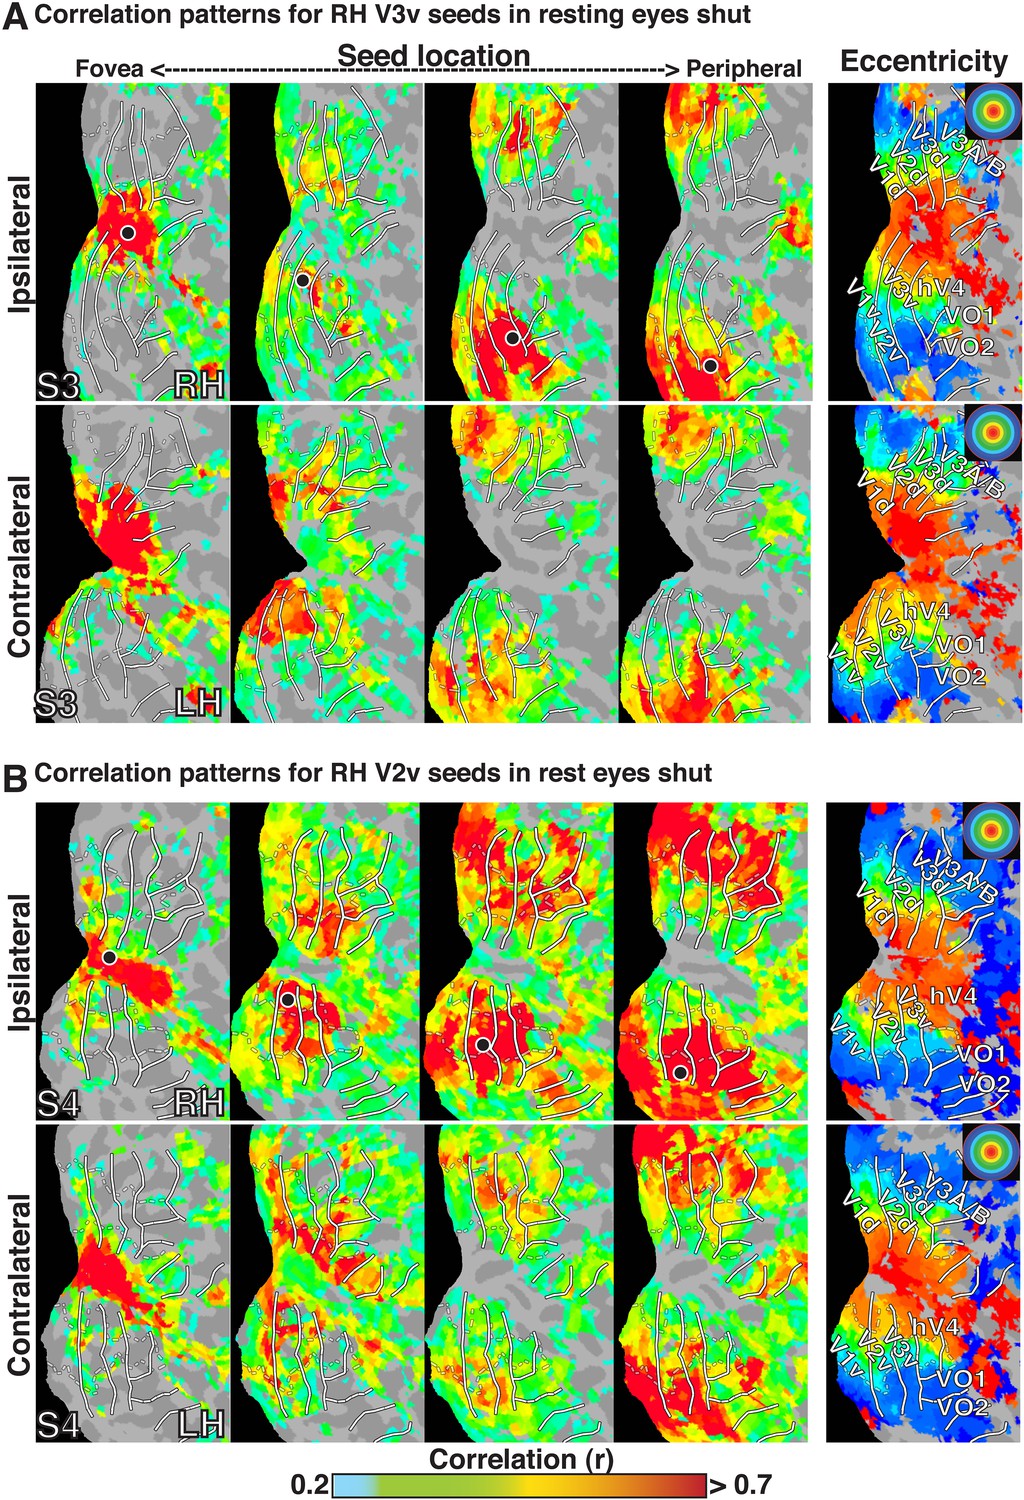
Seed-based correlations on resting state eyes shut in individual subjects.
Correlation maps in both hemispheres of (A) subject S3 at four seed locations (<1.0°, ∼2.5°, ∼5.5°, ∼11.5°; left to right) in ventral V3 of the right hemisphere and (B) of subject S4 in ventral V2 of the right hemisphere. For each seed, the strongest correlations (red / yellow) span several visuotopic areas within an eccentricity range roughly corresponding to that of the seed area (black dot). The correlations have a similar organization to eccentricity maps (far right). To enable comparisons between hemispheres, the left hemisphere images have been horizontally reflected. Conventions the same as Figure 1.
Figure 1—figure supplement 2
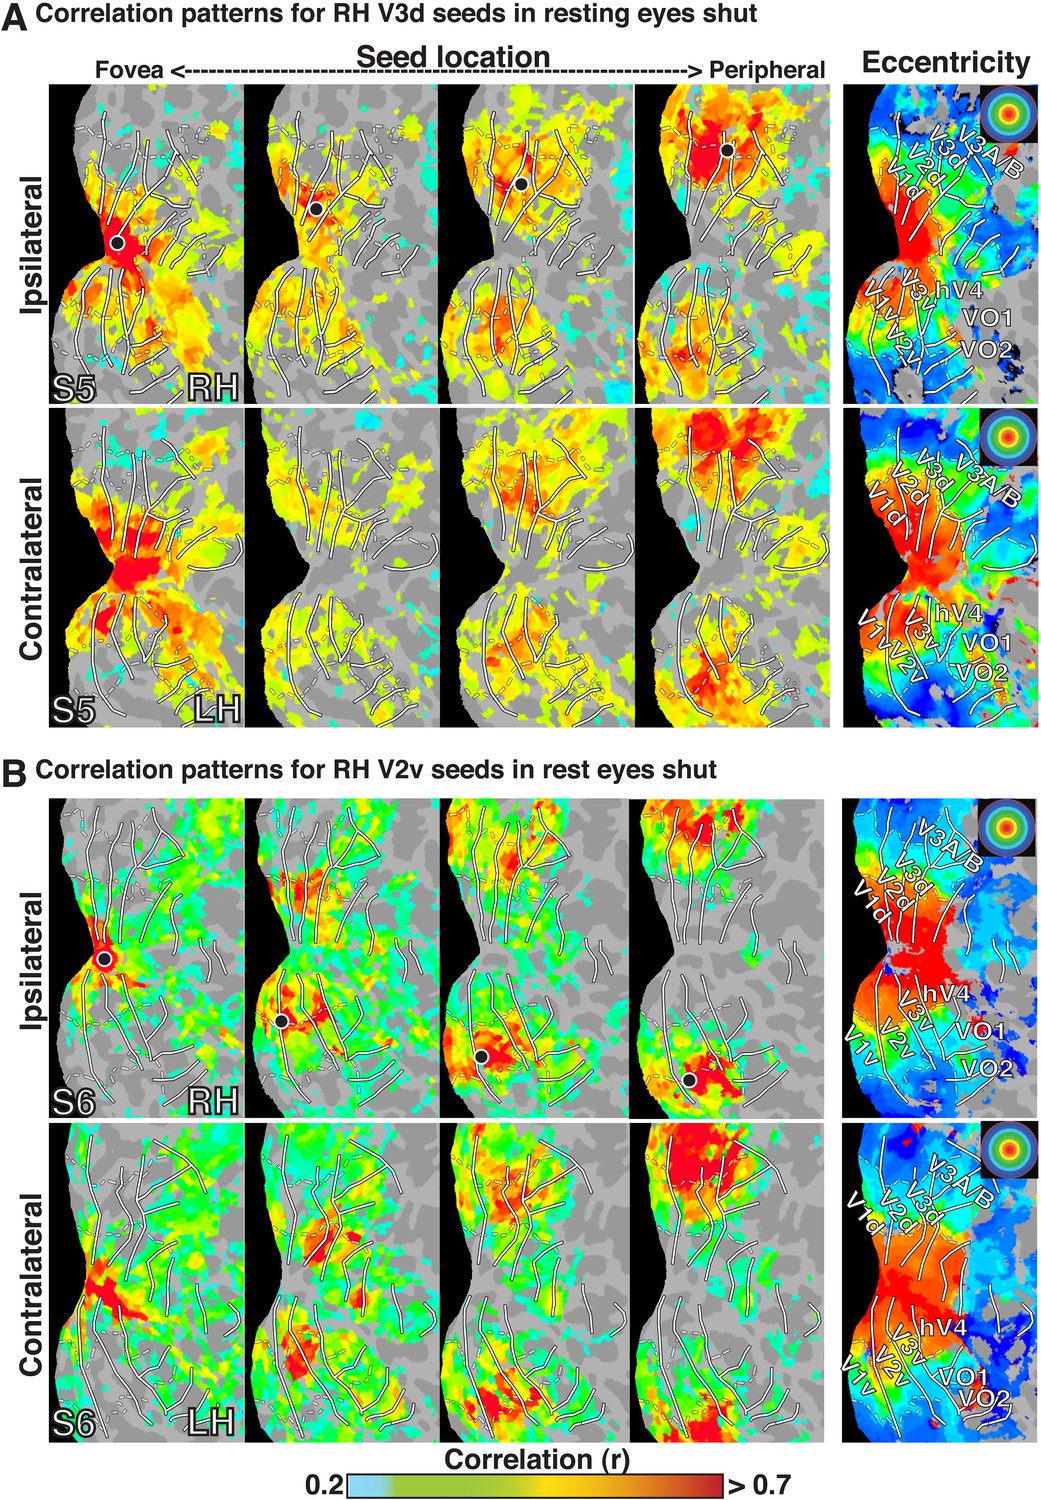
Seed-based correlations on resting state eyes shut in individual subjects.
Correlation maps in both hemispheres of (A) subject S5 at four seed locations (<1.0°, ∼2.5°, ∼5.5°, ∼11.5°; left to right) in dorsal V3 of the right hemisphere and (B)of subject S6 in ventral V2 of the right hemisphere . For each seed, the strongest correlations (red / yellow) span several visuotopic areas within an eccentricity range roughly corresponding to that of the seed area (black dot). The correlations have a similar organization to eccentricity maps (far right). To enable comparisons between hemispheres, the left hemisphere images have been horizontally reflected. Conventions the same as Figure 1.
Figure 2
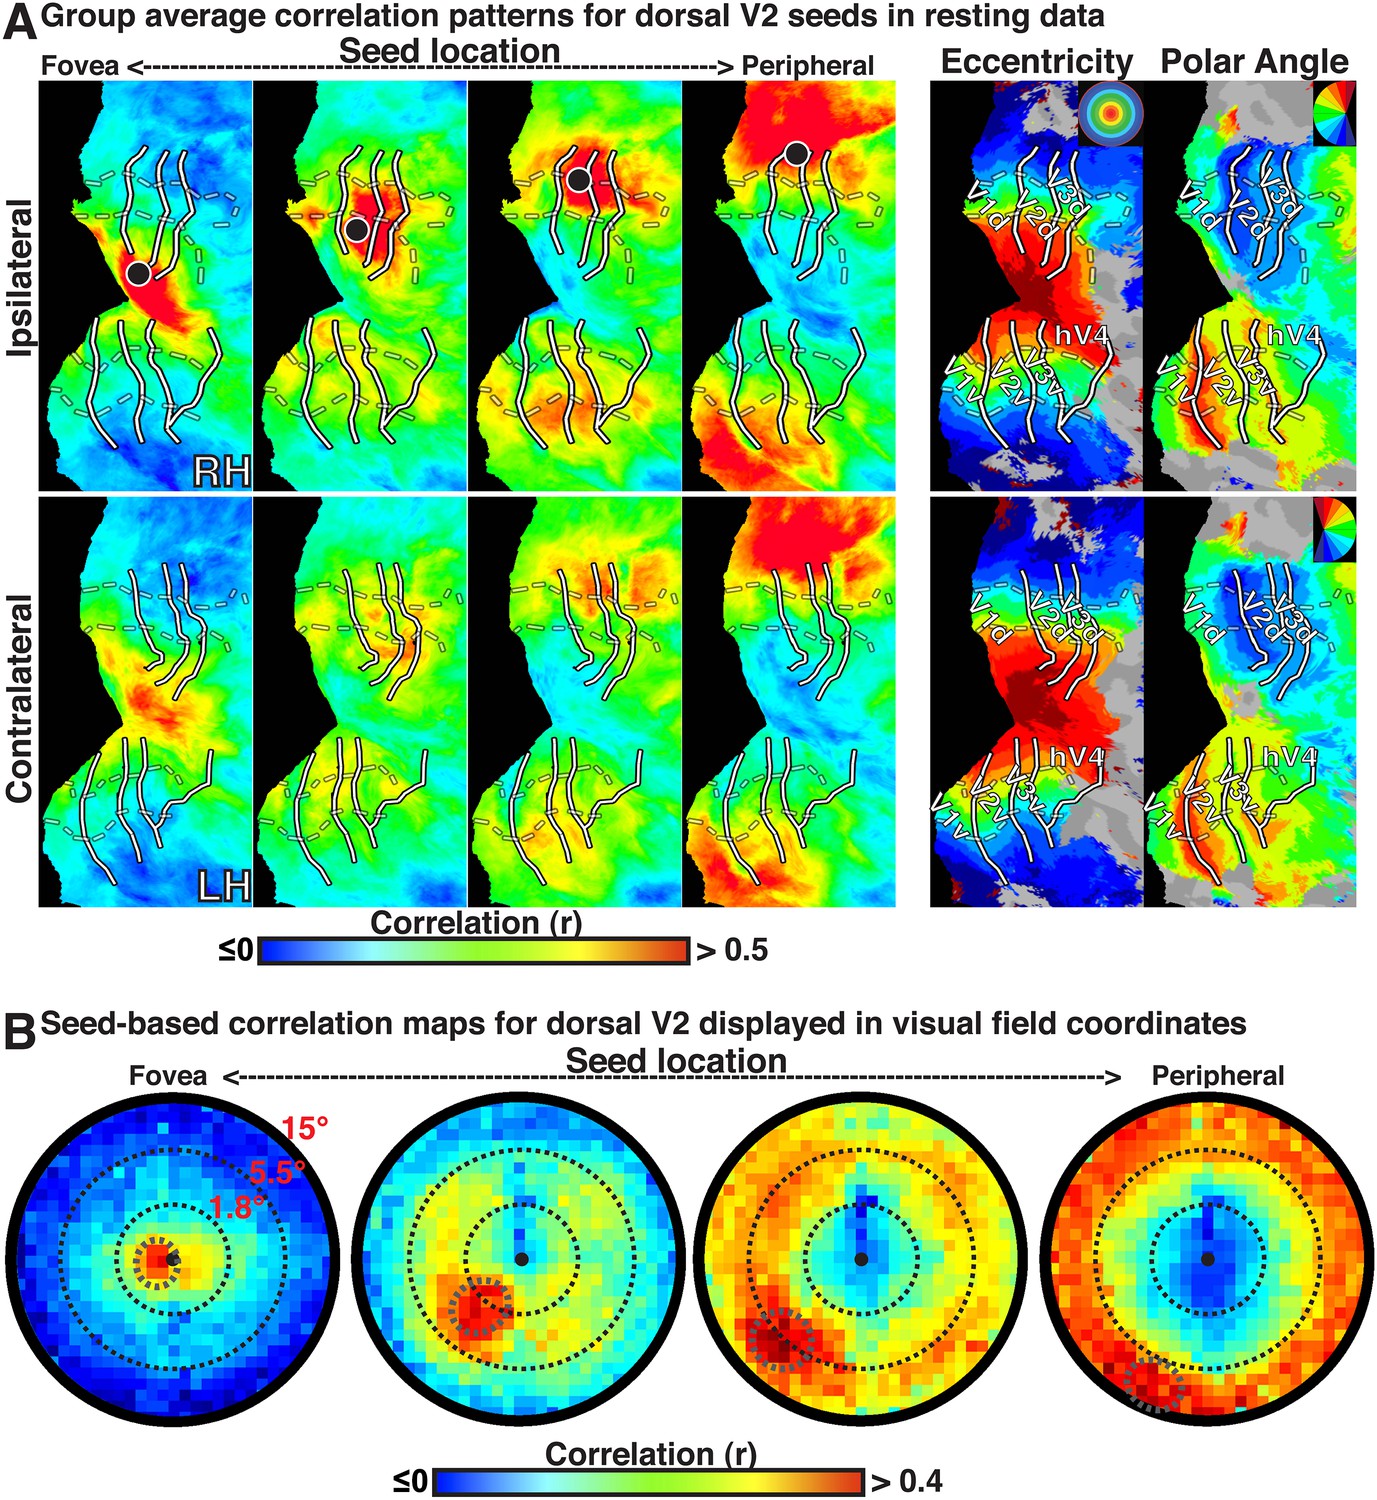
Group average seed-based correlations on resting state data.
(A) Correlation maps in both hemispheres of group average data for resting fixation at four seed locations (<1.0°, ∼2.5°, ∼5.5°, ∼11.5°; left to right) in dorsal V2. For each seed, the strongest correlations (red / yellow) span several visuotopic areas within an eccentricity range roughly corresponding to that of the seed area (black dot) in both the ipsilateral and contralateral hemispheres. The correlations have a similar organization to eccentricity maps (far right). To facilitate visual comparisons between hemispheres, the left hemisphere images have been horizontally reflected. Solid white bars mark borders between visual field maps. White dashed bars outline three bands of iso-eccentricity. (B) Seed-based correlations plotted as a function of visual field representation for four seed locations. Eccentricity values are derived from a log-scaled stimulus (see ‘Materials and methods’). Black, dashed circles denote distance from fixation in visual degrees for each seed location.
Figure 3

Group average seed-based correlations on movie viewing data.
(A) Correlation maps in both hemispheres of group average data for movie viewing at four seed locations (<1.0°, ∼2.5°, ∼5.5°, ∼11.5°; left to right) in dorsal V2. For each seed, the strongest correlations (red / yellow) span several visuotopic areas within an eccentricity range roughly corresponding to that of the seed areas (black dot). The correlations have a similar organization to the eccentricity maps (far right column of Fig. 2). Conventions the same as Figure 2. (B) Seed-based correlations plotted as a function of visual field representation for the four seed locations. Black, dashed circles denote the seed area.
Figure 4

Illustration of eccentricity binning correlations on resting state.
(A) Correlation maps in left hemisphere of subject S4 for 3 seed bin locations (<0.5–0.84°, 3.71–4.63°, 10.36–12.50°; left to right) in dorsal V3 and subject S4's eccentricity map (right). Grayscale dots mark approximate seed bin locations. (B) Correlations with all ventral V3 bins are plotted for the three dorsal seed locations. The strongest correlations between dorsal and ventral V3 were at, and around, iso-eccentricity representations. (C) The entire correlation matrix for all eccentricity locations between dorsal and ventral V3 (center) revealed a similar pattern where correlations were strongest at or near iso-eccentricity (i.e., the diagonal), and weaker for bins with large radial distances (e.g., foveal vs peripheral-most). Radial distance (left) was strongly correlated with the measured group connectivity (r = 0.84) and was uncorrelated to the cortical distance (right).
Figure 5
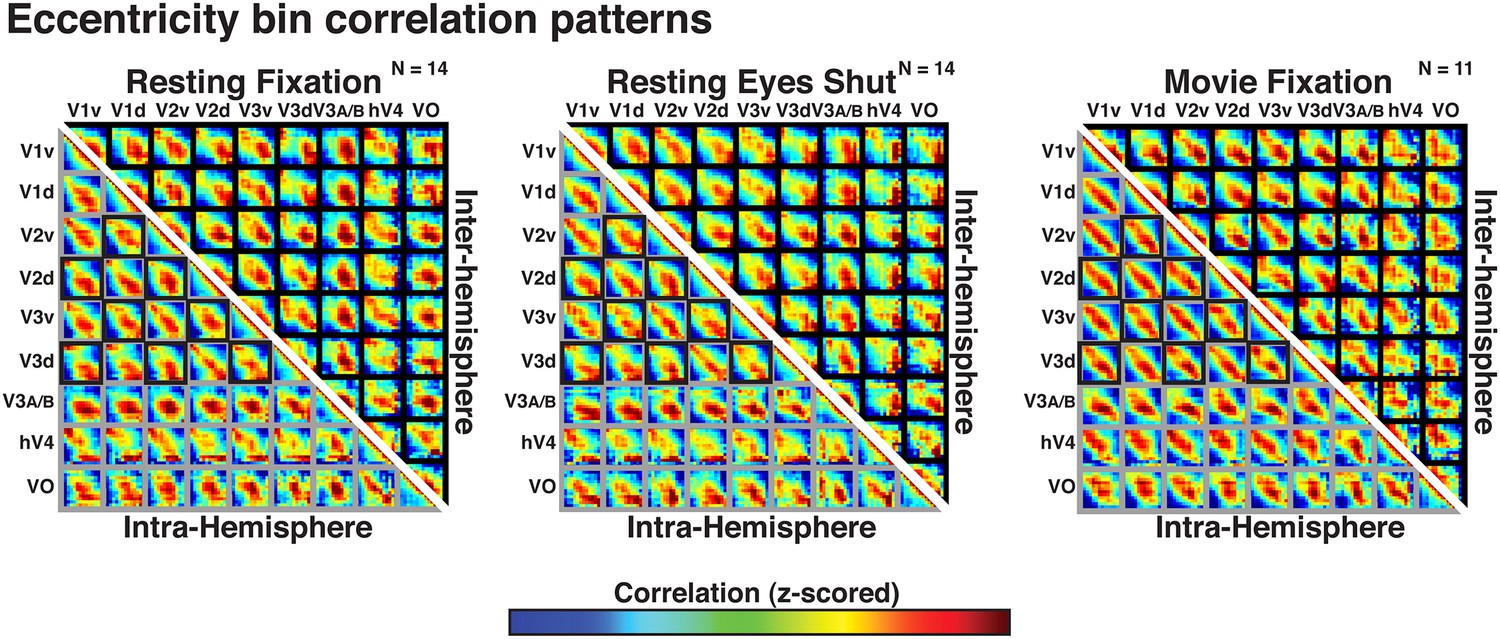
Correlation matrices for resting state and movie viewing conditions.
Intra- (bottom-left matrix triangle) and inter-hemisphere (top-right matrix triangle) correlations are shown for all pairwise comparisons between visual areas V1, V2, V3, hV4, VO1-2, and V3A-B for resting fixation (left matrix), resting eyes shut (center matrix), and movie viewing (right matrix) experiments. For each pair of visual areas, the strongest correlations (red) are at corresponding eccentricity bins and its neighbors (diagonal in each sub-matrix). Grey and black boxes bound area pairs with overlapping and non-overlapping visual field representations, respectively.
Figure 6 with 3 supplements
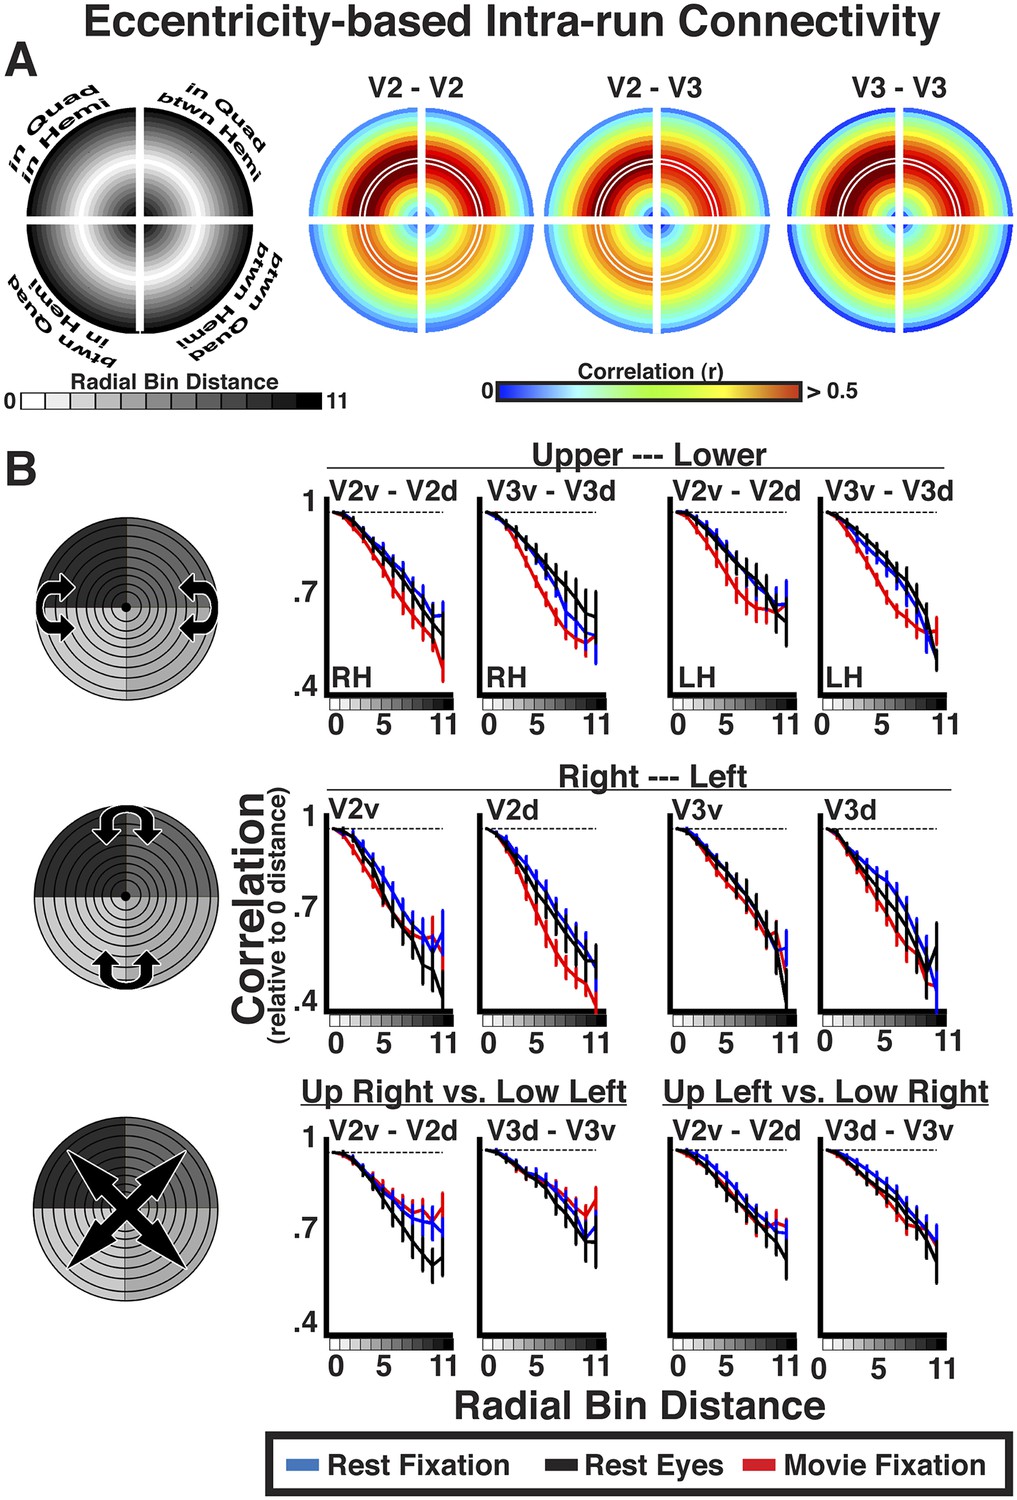
Intra-run eccentricity-based connectivity analyses for resting-state and movie viewing conditions.
(A) Radial bin distance correlation plots between resting-state data bins for within quadrant/within hemisphere (upper left), within quadrant/between hemisphere (upper right), between quadrant/within hemisphere (lower left), and between quadrant/between hemisphere (lower right) comparisons. In each quadrant, the mid-radial arc (white outline) corresponds to the average correlation at iso-eccentricity with outer and inner arcs corresponding to average correlations at increasingly larger radial distances. (B) Average individual subject correlations are plotted for areas V2 and V3 as a function of radial distance between the upper and lower visual fields (top), right and left visual fields (middle), as well as across both left and right and upper and lower visual fields (bottom) for all conditions. Correlations are normalized to the average correlations at iso-eccentricity (0-radial distance). All correlations were strongest at the 0-radial distance and steadily decreased at larger distances for all conditions.
Figure 6—figure supplement 1

Intra-run eccentricity-based connectivity analyses for resting-state and movie viewing conditions without meridian data.
Average individual subject correlations are plotted for areas V2 and V3 as a function of radial distance between the upper and lower visual fields (top), right and left visual fields (middle), as well as across both left and right and upper and lower visual fields (bottom) for all conditions. Meridian data were removed prior to binning. Data corresponding to 60° of polar angle centered on the horizontal meridian was removed for comparisons between dorsal and ventral regions. Data corresponding to 90° of polar angle centered on each vertical meridian was removed for inter-hemisphere comparisons. All correlations were strongest at the 0-radial distance (iso-eccentricity) and steadily decreased at larger distances for all conditions.
Figure 6—figure supplement 2

Intra-run angular-based connectivity analyses for resting-state and movie viewing conditions.
(A) Average individual subject correlations are plotted for areas V2 and V3 as a function of angular distance within an area (top), between the upper and lower visual field (second row), right and left visual fields (third row), as well as across both left and right and upper and lower visual fields (bottom) for all conditions. (B) Average individual subject correlations are plotted for mirror symmetric connections between upper and lower visual fields (top) and between right and left visual fields (bottom). See Figure 6 for conventions.
Figure 6—figure supplement 3
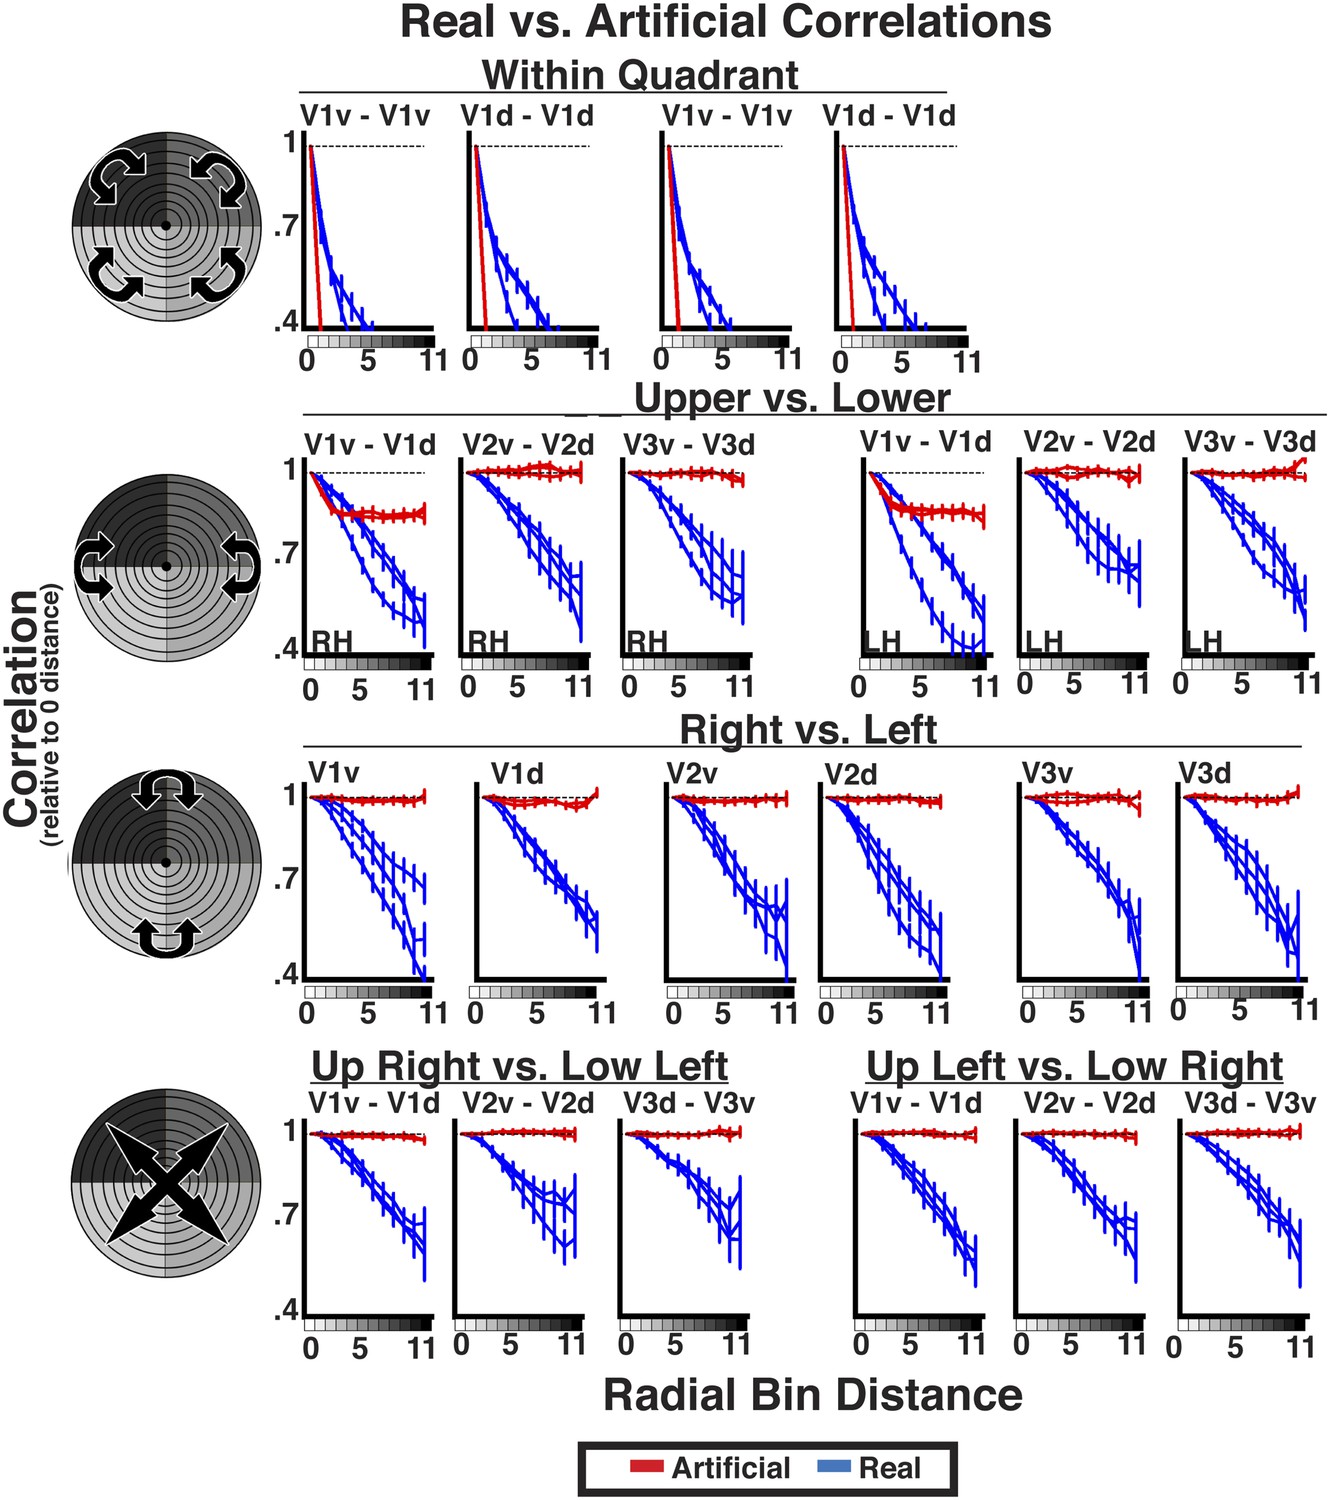
Real data vs artificial data.
Comparison of average individual subject correlations for real (blue) and artificial (red) data. Data are plotted for areas V1, V2, and V3 as a function of radial distance between the upper and lower visual fields (top), right and left visual fields (middle), as well as across both left and right and upper and lower visual fields (bottom) for all conditions. The pattern of correlations between real and artificial data differed for all comparisons. For the real data, correlations decreased as a function of radial distance in every comparison. For the artificial data, correlations decreased as a function of radial distance only for within quadrant and (partially) for between anatomically adjacent areas. For comparisons between dorsal and ventral regions and between hemispheres, artificial data correlations did not vary as a function of radial distance. Even for within quadrant, the slope of the correlations across radial distances was markedly different between real and artificial data. These plots demonstrate that the effect of radial distance on correlation strength cannot be explained by spatial correlations due to intrinsic properties of BOLD imaging or our preprocessing as these were preserved in the artificial data.
Figure 7
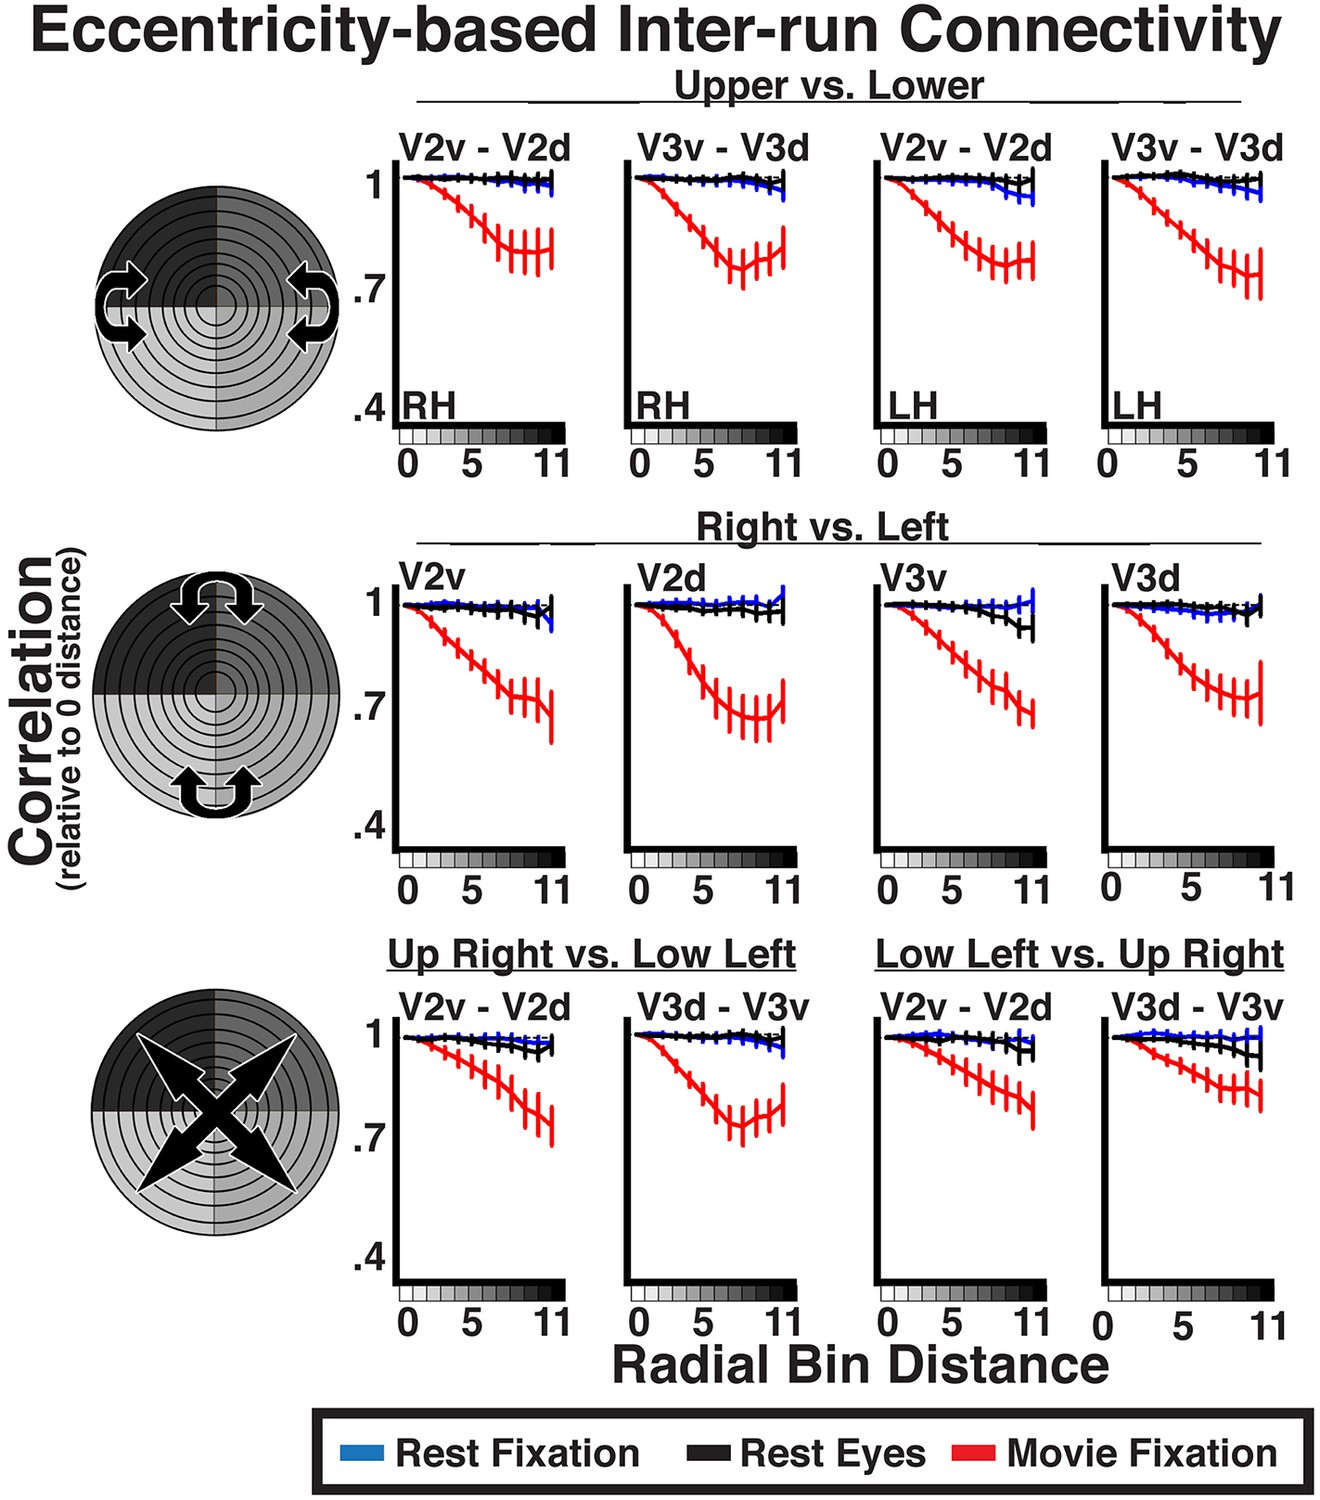
Inter-run eccentricity-based connectivity analyses for resting-state and movie viewing conditions.
For the movie viewing condition, average individual subject inter-run correlations between hemispheres as well as between dorsal and ventral portions of V2 and V3 were strongest at the 0-radial distance (iso-eccentricity) and steadily decreased at larger distances. For resting state data, correlations did not vary as a function of radial distance. See Figure 6 for conventions.
Figure 8 with 2 supplements

Radial and angular distance plots.
Resting state correlation bins plotted as a function of average radial and angular distance (ΔE and ΔA, respectively) for areas V1, V2, V3, and hV4. Intra- and inter- hemisphere correlations are plotted in the left and right hemifields, respectively. For intra-hemisphere correlations (left hemifield), the mid arc (oval; see legend) corresponds to the average correlation at the intersection of iso-eccentricity and iso-polar angle. There is no iso-polar angle for inter-hemisphere comparisons (right hemifield), so plotted data begin off the horizontal meridian at an iso-polar distance of one, and correspond to the correlations between bins adjacent to the vertical meridian. Outer and inner arcs correspond to larger radial distance correlations (same conventions as symmetry plots in Figure 6A). Arcs closer to the vertical meridian correspond to larger angular distances (see legend). For each plot, for example, V2–V3, arcs above the mid arc (+ΔA) illustrate correlations between relatively more upper visual field representations of V2 and relatively lower visual field representations of V3 (reverse for below mid arc, −ΔA). For comparisons with area hV4, there was no data for some radial and angular distances (black arcs).
Figure 8—figure supplement 1
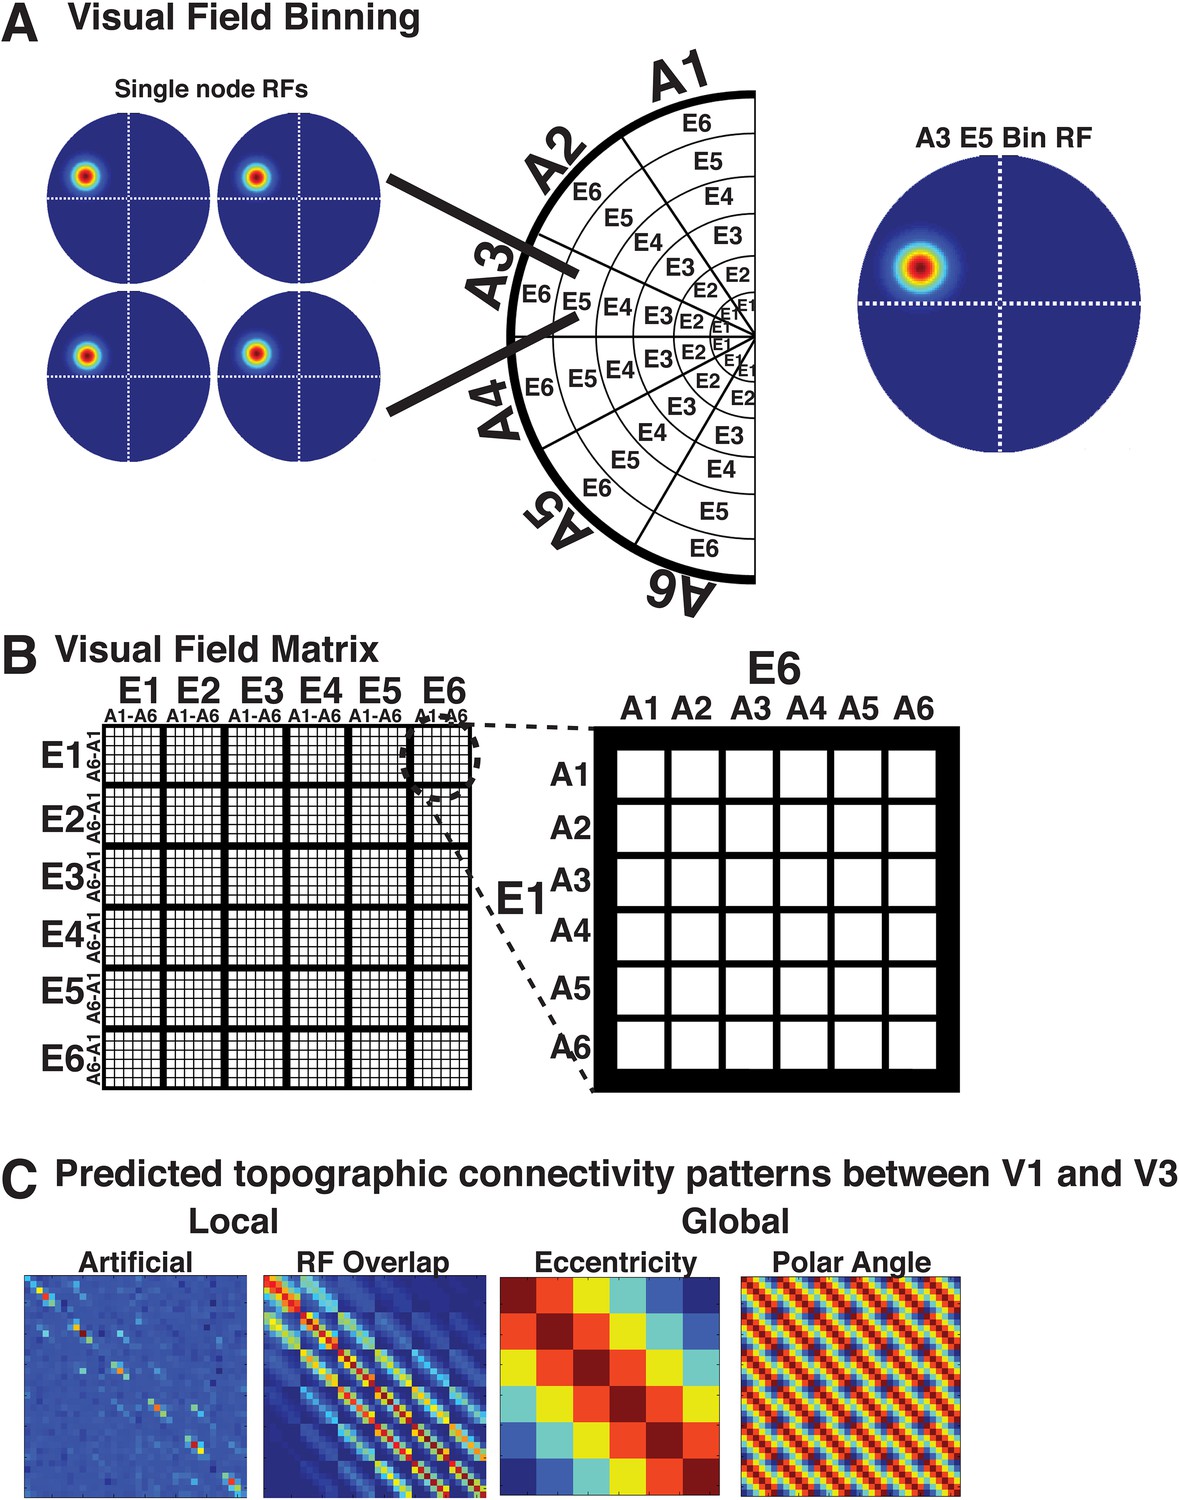
Connectivity patterns for model fitting.
(A) For areas V1, V2, V3, and hV4, data were divided into six bins of eccentricity (E1–E6), each containing six bins of polar angle (A1–A6). (B) Illustration of the conversion from visual field representation to matrix representation for all pairwise (36 × 36) bin correlations. (C) Illustrations of four predicted patterns of intra-hemisphere connectivity between areas V2 and V3 (from left to right): (1) Noise, (2) RF overlap, (3) Eccentricity, and (4) Polar angle.
Figure 8—figure supplement 2
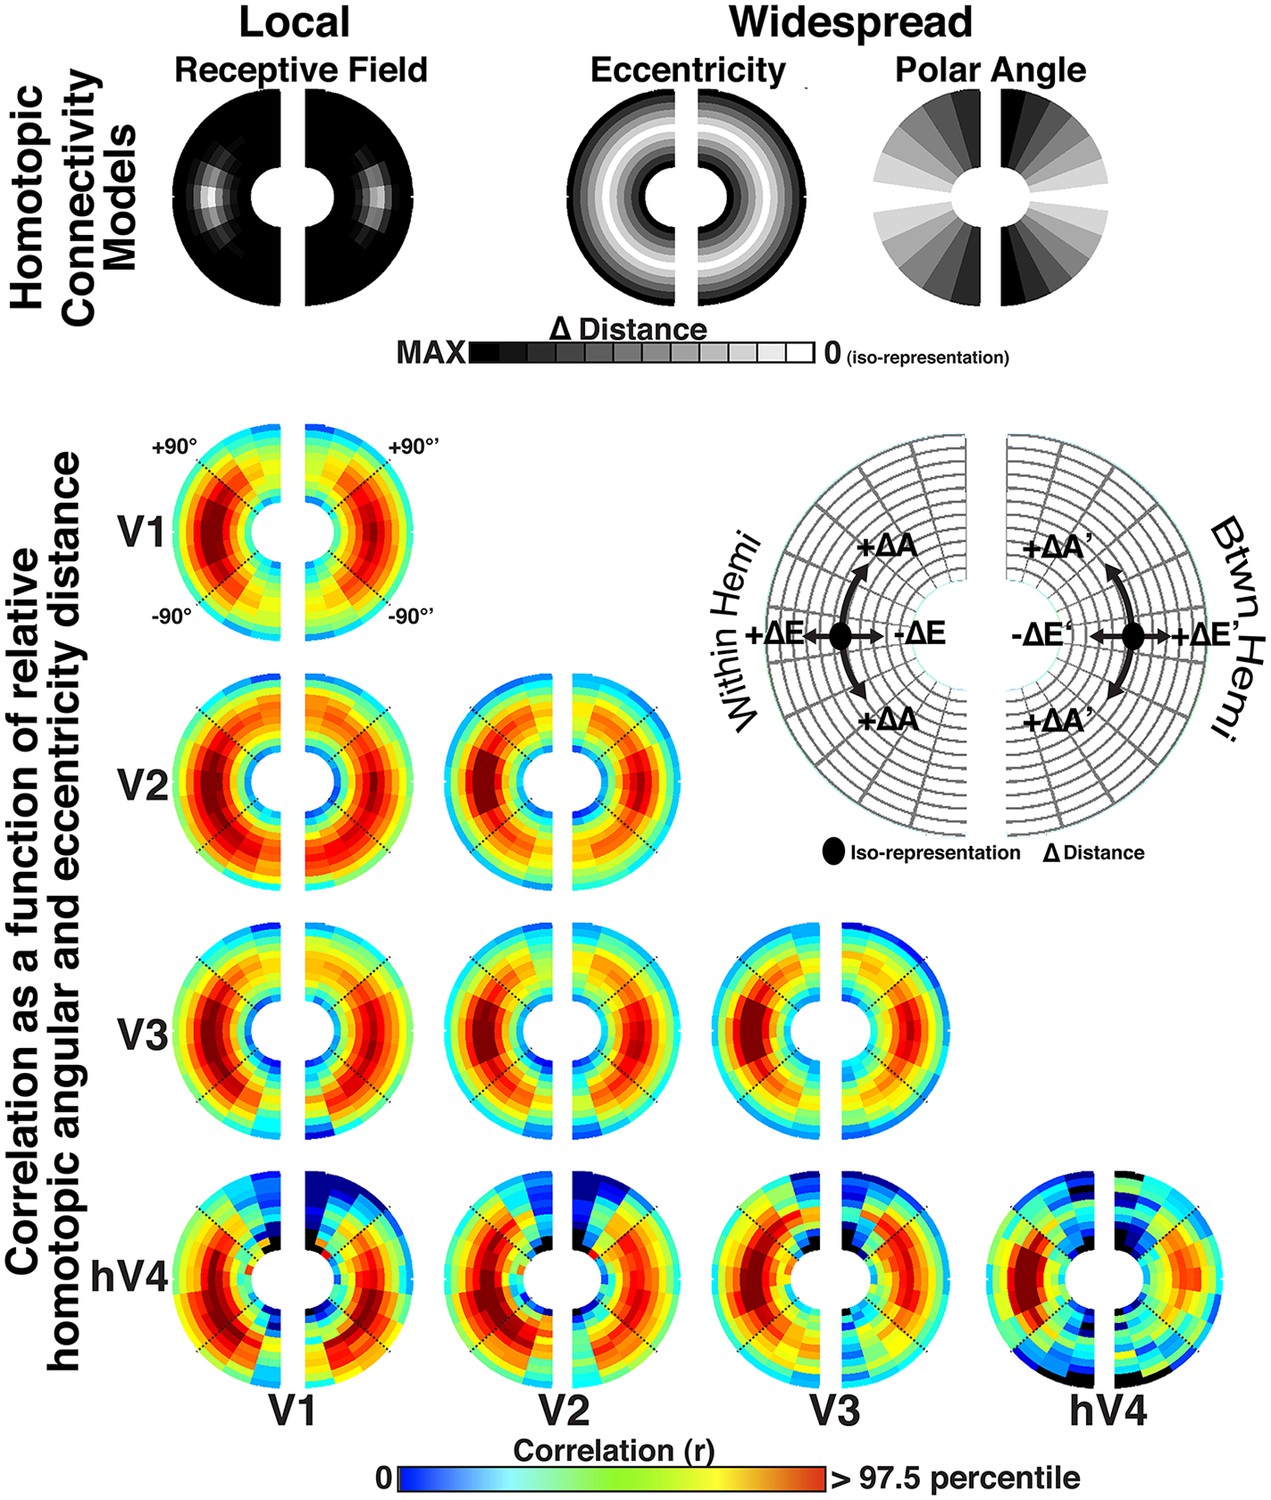
Homotopic radial and angular distance plots.
Correlation bins are plotted as a function of average radial and angular distance for V1, V2, V3, and hV4. Intra- and inter- hemisphere correlations are plotted in the left and right hemifields, respectively. For inter-hemisphere comparisons, the visual field position of bins in one hemifield is mirror reflected across the vertical meridian (homotopic angular distances denoted as A′ and eccentricity distances as E′, see top-right legend). In each hemifield, the mid arc (oval; see legend) corresponds to the average correlation at the intersection of iso-eccentricity and iso-polar angle. All other conventions the same as Figure 8.
Figure 9 with 3 supplements
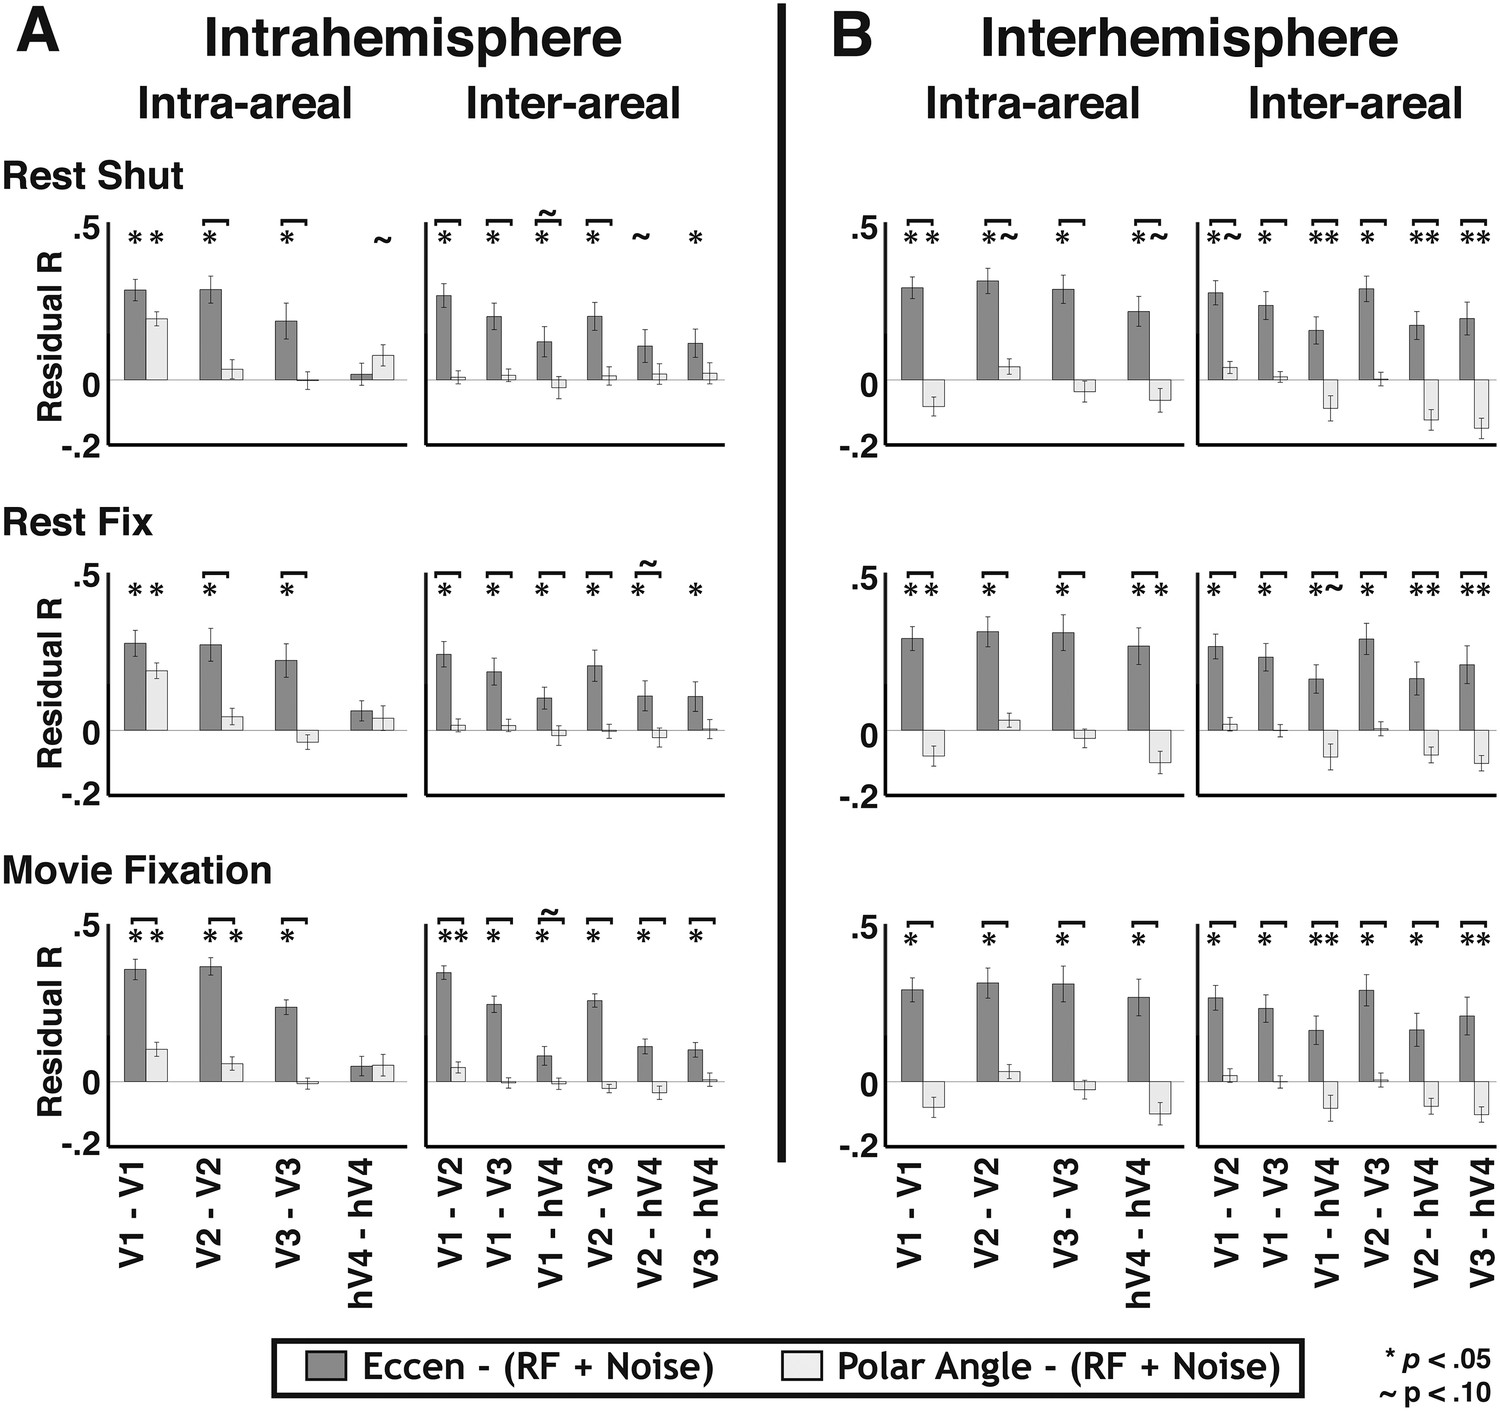
Residual correlations with eccentricity and polar angle predictors.
(A) Intra- and (B) inter- hemisphere average individual subject correlations between the unexplained variance from an overlapping RF model fit and eccentricity (medium gray bars) and polar angle (light gray bars) predictors are plotted for all pairs of visual areas V1, V2, V3, and hV4. Residual correlations were significantly above 0 for 56/60 eccentricity comparisons (ps < 0.05; FDR corrected; one-sample t-test) and were significantly greater than polar angle correlations for 49/60 comparisons (ps < 0.05, FDR corrected; paired t-test). Correlations between the residuals and the eccentricity predictor were comparable within and across areas, as well as within and across hemispheres, though were generally weaker for comparisons with hV4. Notations above each bar denote significance relative to the null hypothesis (one-sample t-test) and brackets denote significant differences between conditions (two-sample t-test). * ps < 0.05; ∼ps < 0.10 (FDR corrected).
Figure 9—figure supplement 1
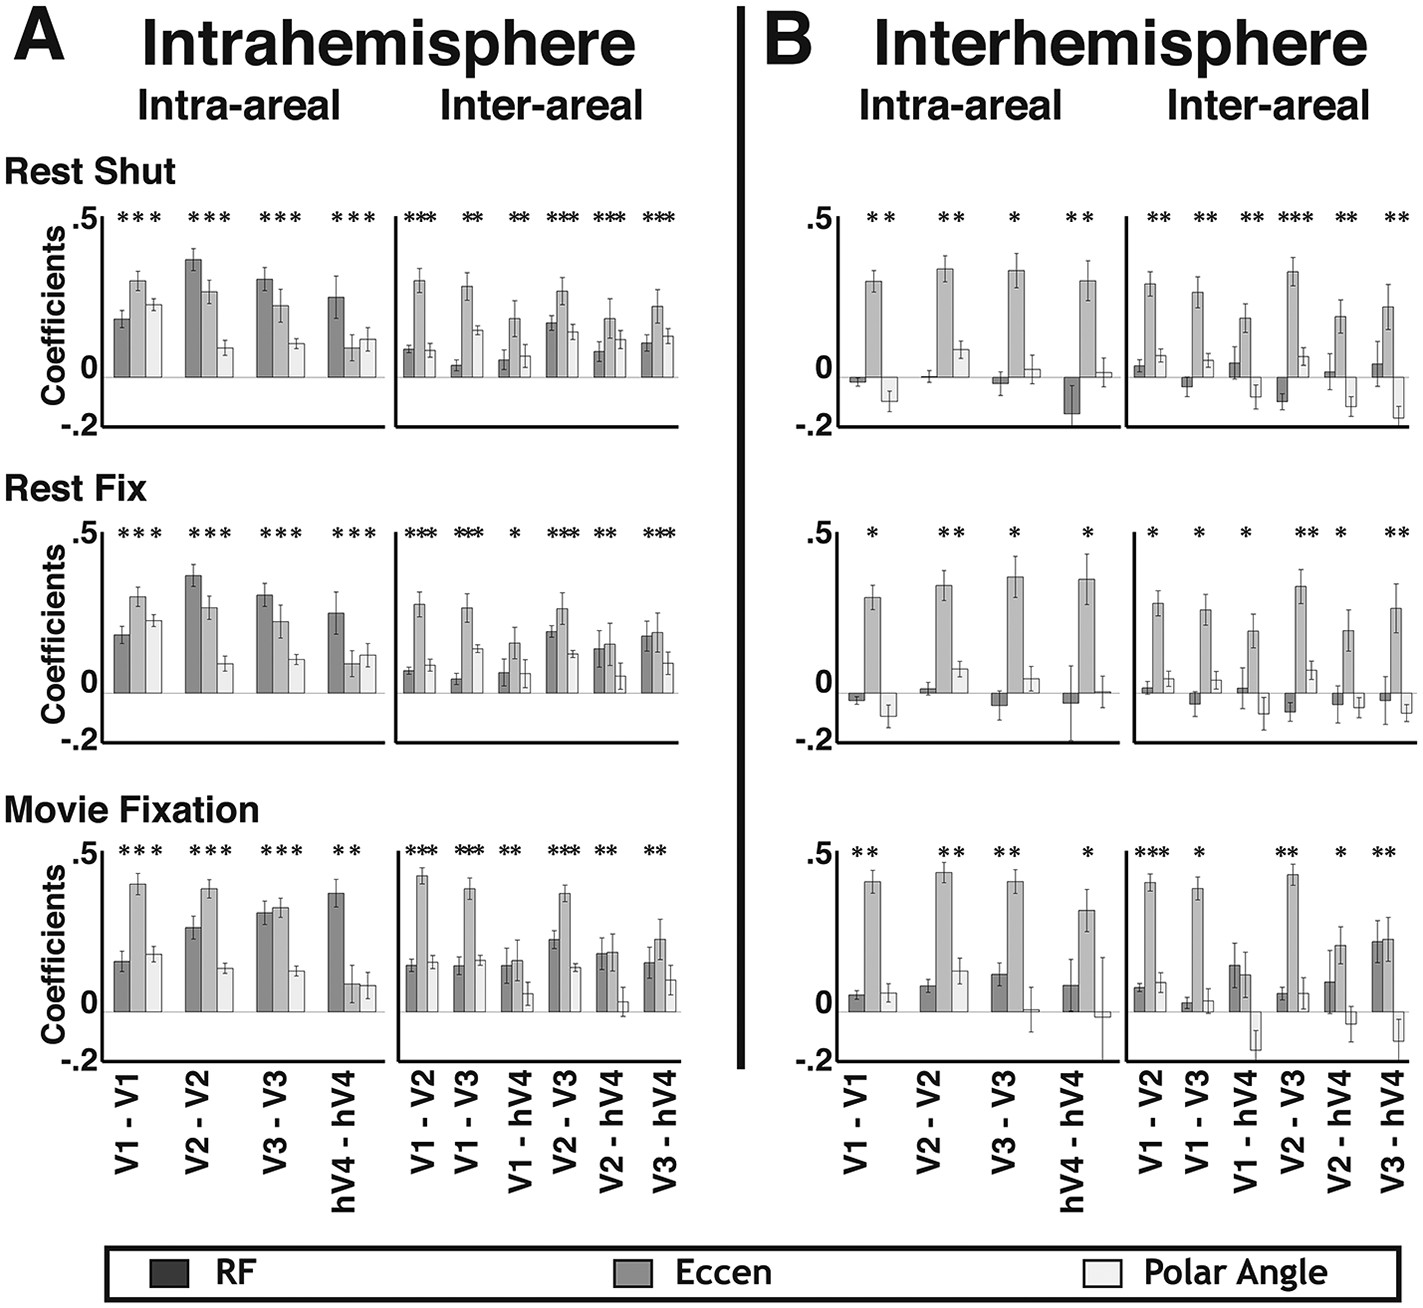
Intra- and inter- hemisphere effects of local and widespread connectivity.
(A) Intra- and (B) inter- hemisphere group mean coefficients plotted from the linear regression with a model that included two predictors of local connectivity (Noise and overlapping RF) and two predictors of widespread connectivity (Eccentricity and polar angle). Significant effects of overlapping RF (dark gray) and polar angle (white) were generally observed for intra-hemisphere comparisons. Significant effects of eccentricity (light gray) were generally observed for both intra- and inter- hemisphere comparisons. *ps < 0.05 (FDR corrected).
Figure 9—figure supplement 2
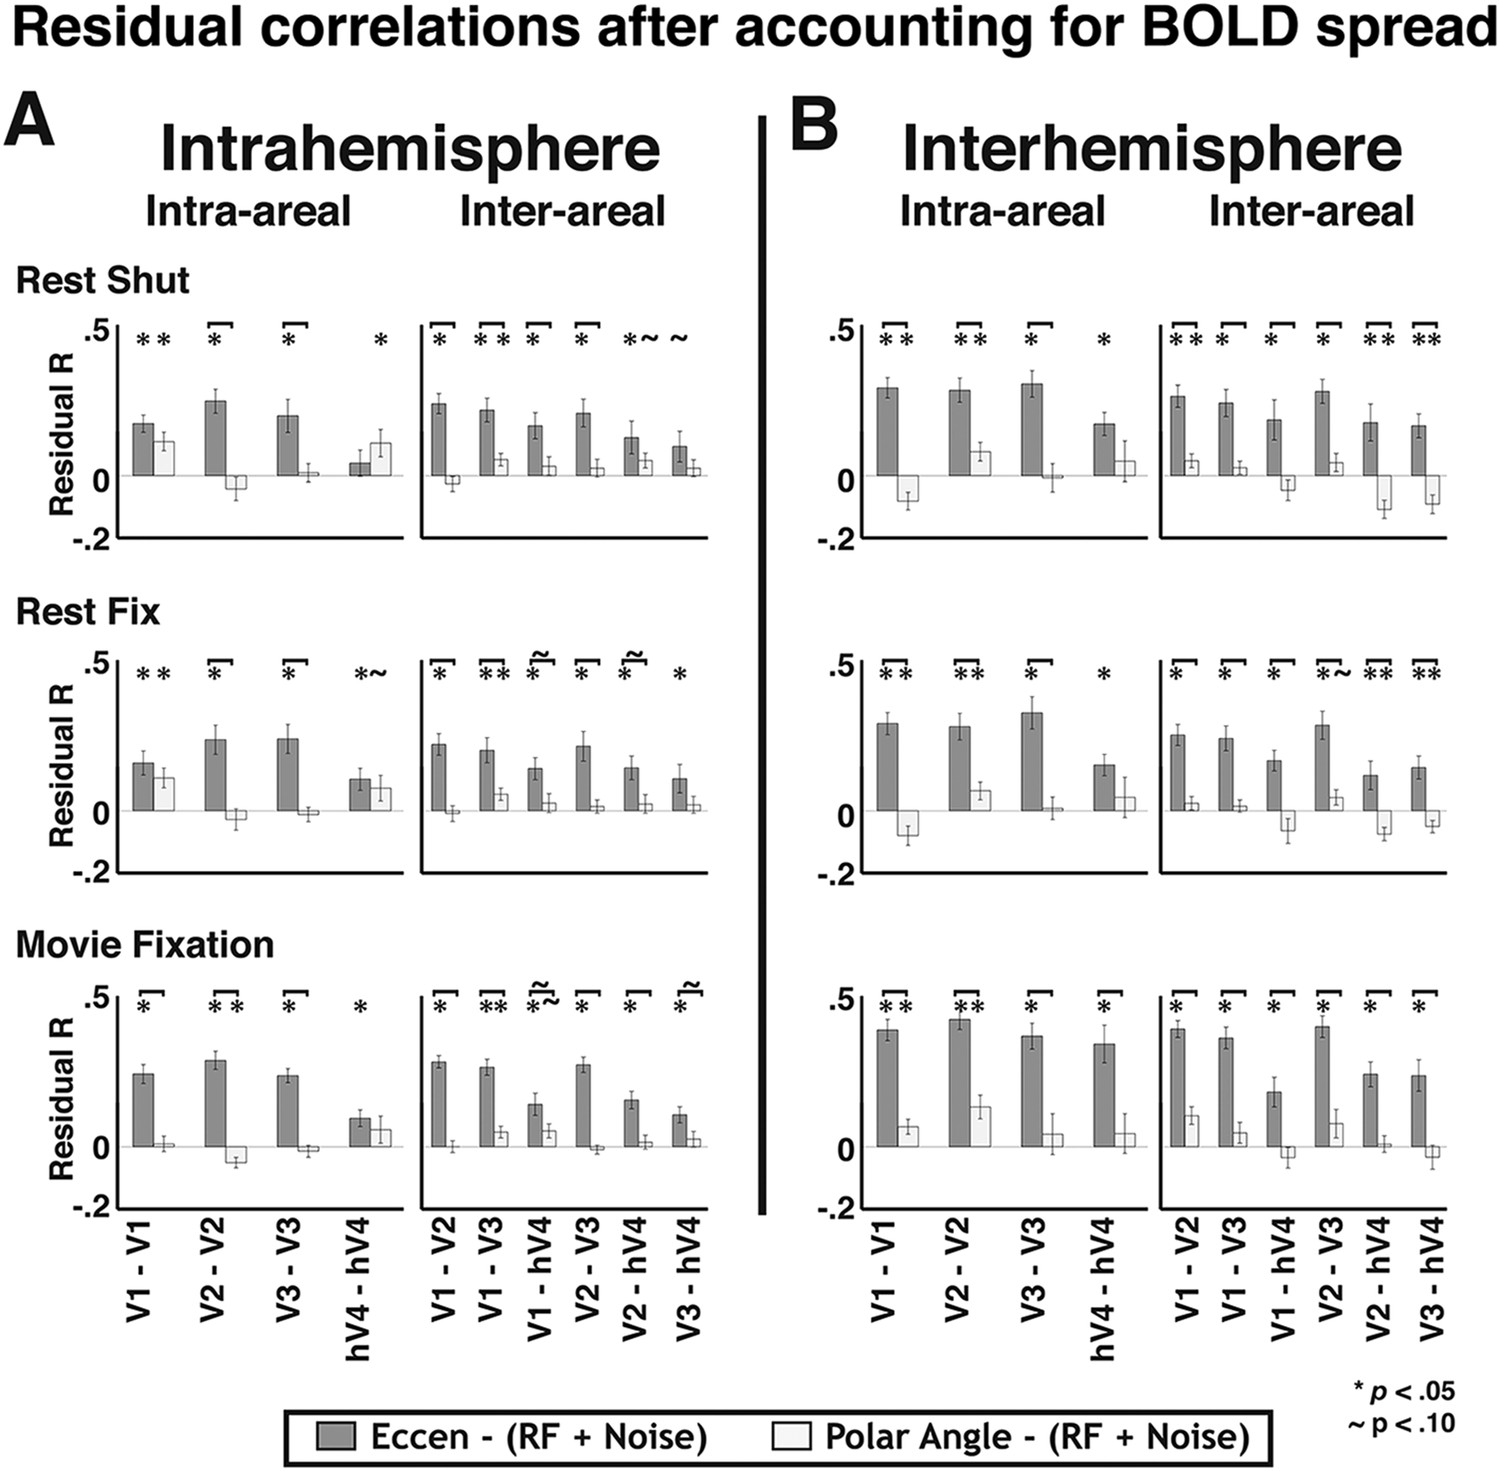
Residual correlations with eccentricity and polar angle predictors after accounting for potential effects of BOLD signal spread.
(A) Intra- and (B) inter- hemisphere group mean correlations between the unexplained variance after simulating the spread of the BOLD signal across RFs (via Cholesky analysis) and eccentricity (medium gray bars) and polar angle (light gray bars) predictors are plotted for all pairs of visual areas V1, V2, V3, and hV4. The Cholesky analysis accounts for any additional effects of the point spread function on overlapping RF connectivity pattern. Residual correlations were significantly above 0 for 58/60 eccentricity comparisons (ps < 0.05; FDR corrected; one-sample t-test) and were significantly greater than polar angle correlations for 46/60 comparisons (ps < 0.05; FDR corrected; paired t-test). Overall, the results were little changed from the initial residual correlations. Notation conventions the same as Figure 9. *ps < 0.05; ∼ps < 0.10 (FDR corrected).
Figure 9—figure supplement 3
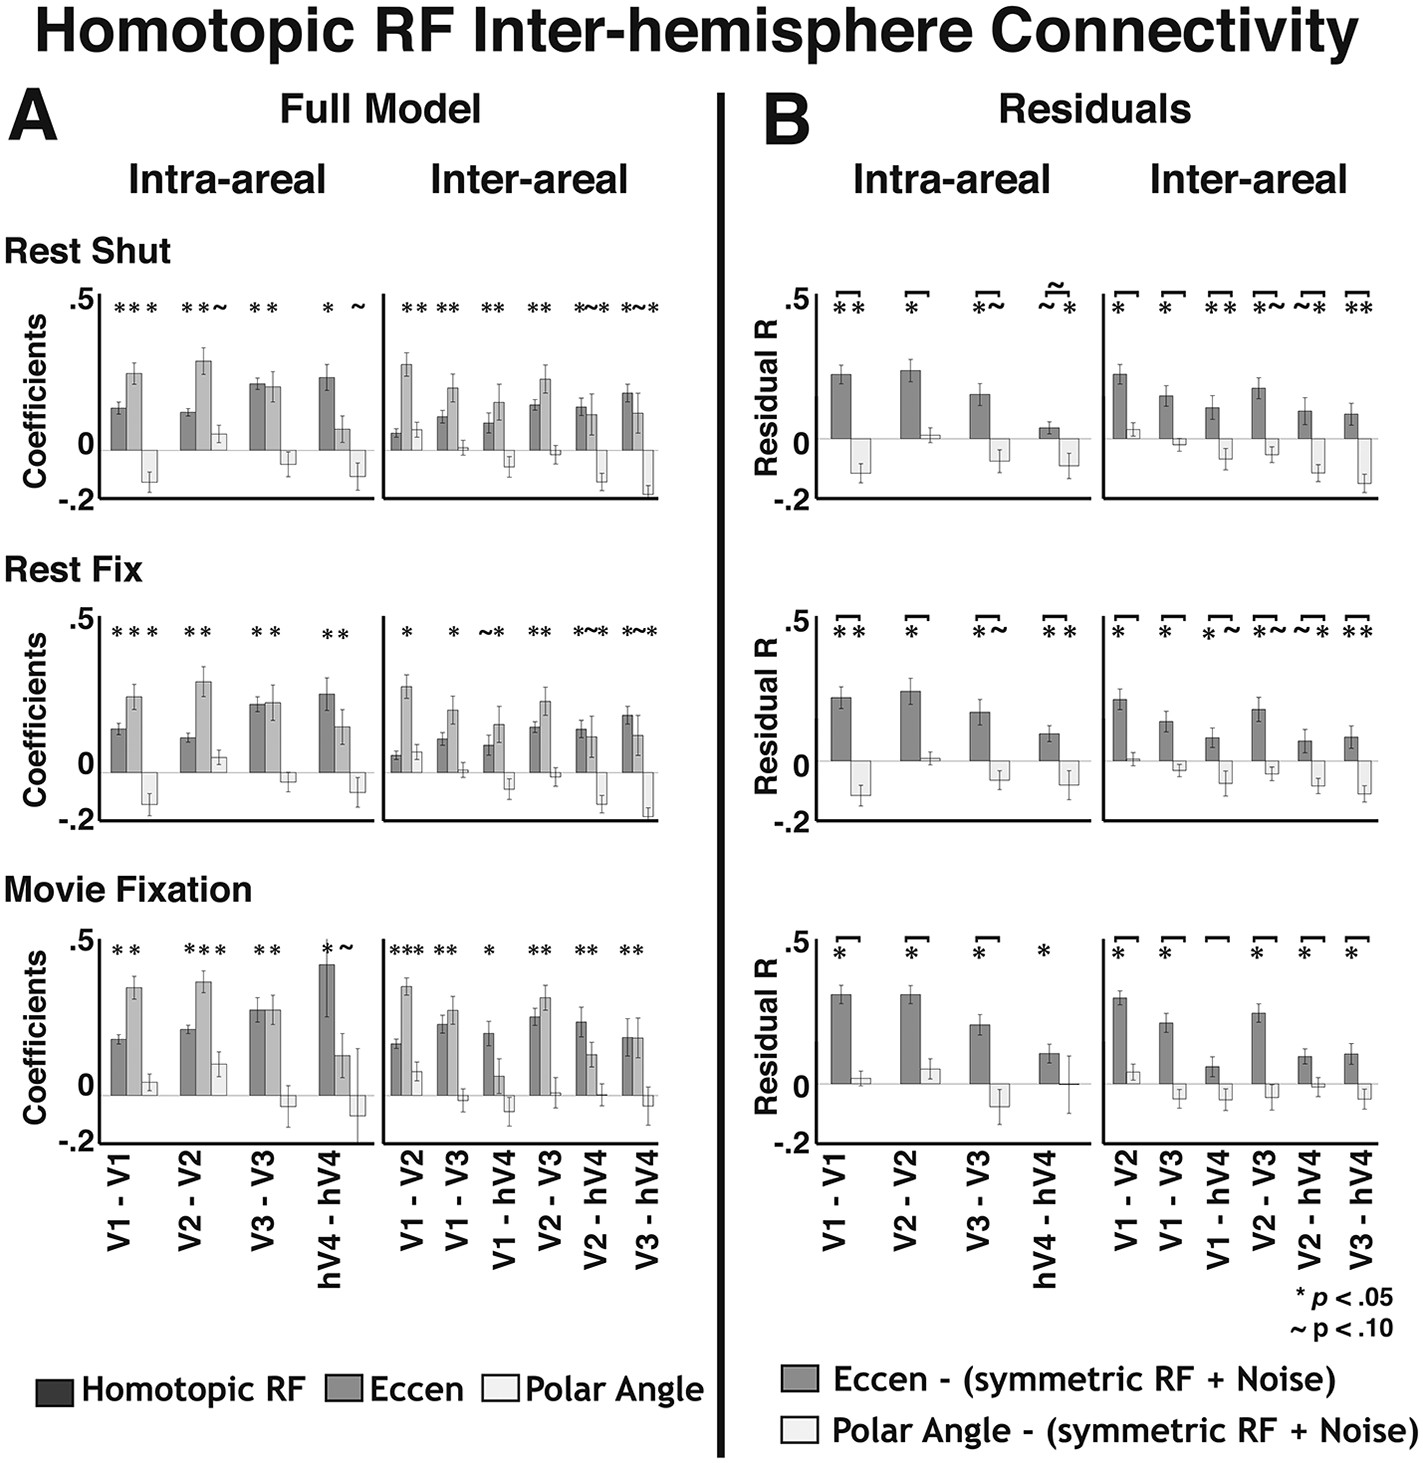
Effect of homotopic connectivity.
(A) Coefficients are plotted for inter-hemisphere comparisons from a linear regression with a model that included homotopic RF connectivity, eccentricity, and polar angle predictors. In contrast to the overlapping RF predictor, significant effects of homotopic RF connectivity were observed for some inter-hemisphere comparisons. Conventions the same as Figure 9—figure supplement 1. (B) Inter- hemisphere group mean correlations between the unexplained variance from a homotopic RF connectivity model fit and eccentricity (medium gray bars) and polar angle (lightest gray bars) predictors are plotted for all area pairs of visual areas V1, V2, V3, and hV4. Residual correlations were significantly above 0 for 26/30 eccentricity comparisons (ps < 0.05; FDR corrected; one-sample t-test) and were significantly greater than polar angle correlations for 28/30 comparisons (ps < 0.05; FDR corrected; paired t-test). Overall, the results were similar to the initial residual correlations. Notation conventions the same as Figure 9. *ps < 0.05; ∼ps < 0.10 (FDR corrected).
Author response image 1
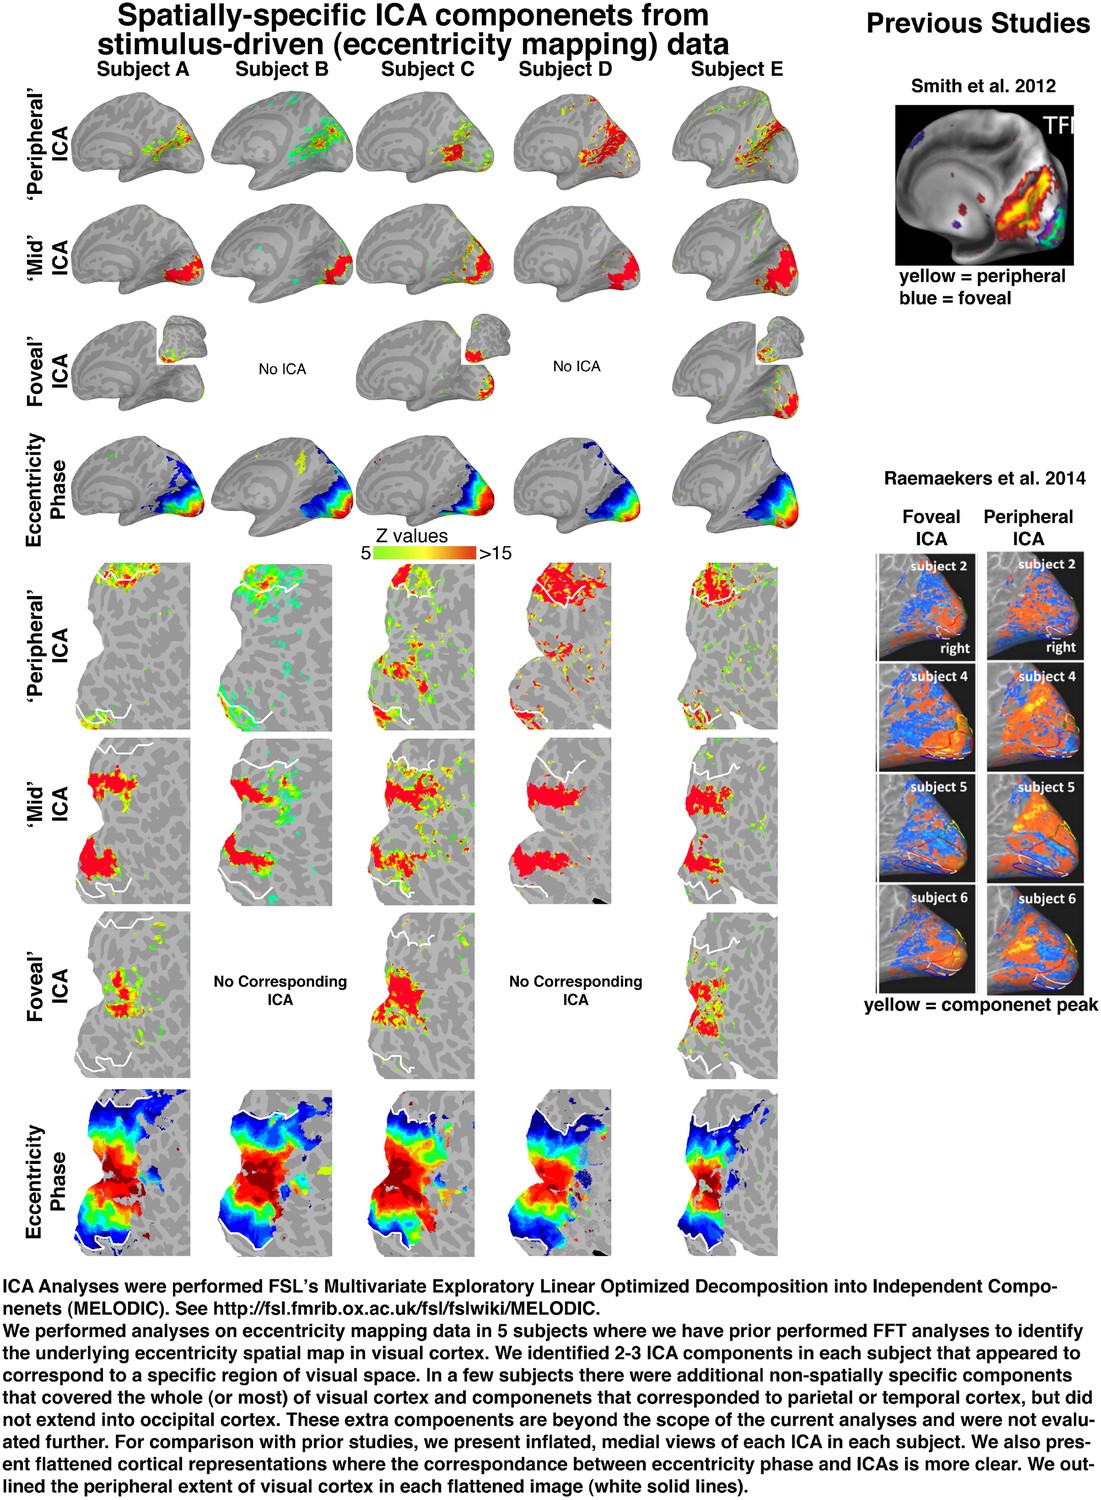
Spatially-specific ICA components from stimulus-driven (eccentricity mapping) data.
Author response image 2
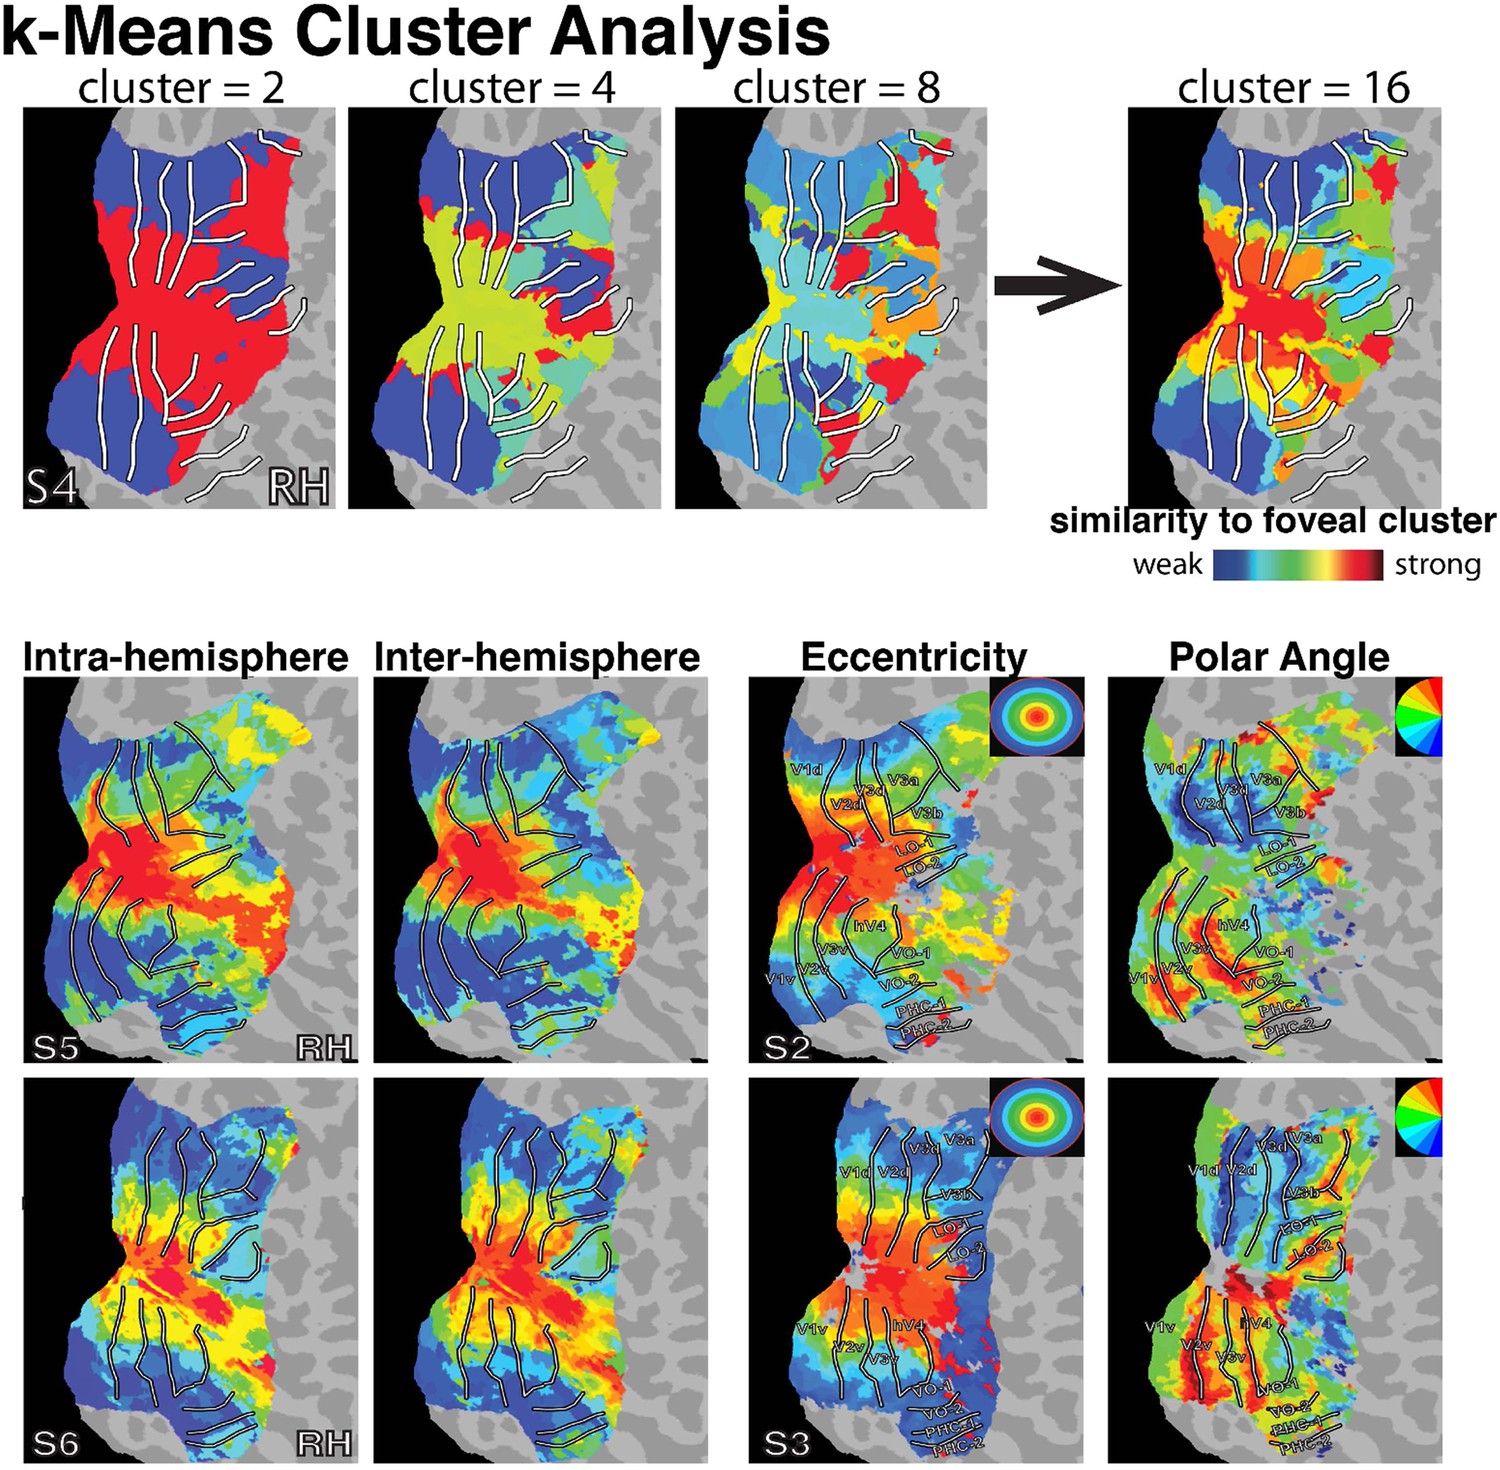
K-Means Cluster Analysis.
Author response image 3

Polar Angle-based Intra-run Connectivity.
Author response image 4
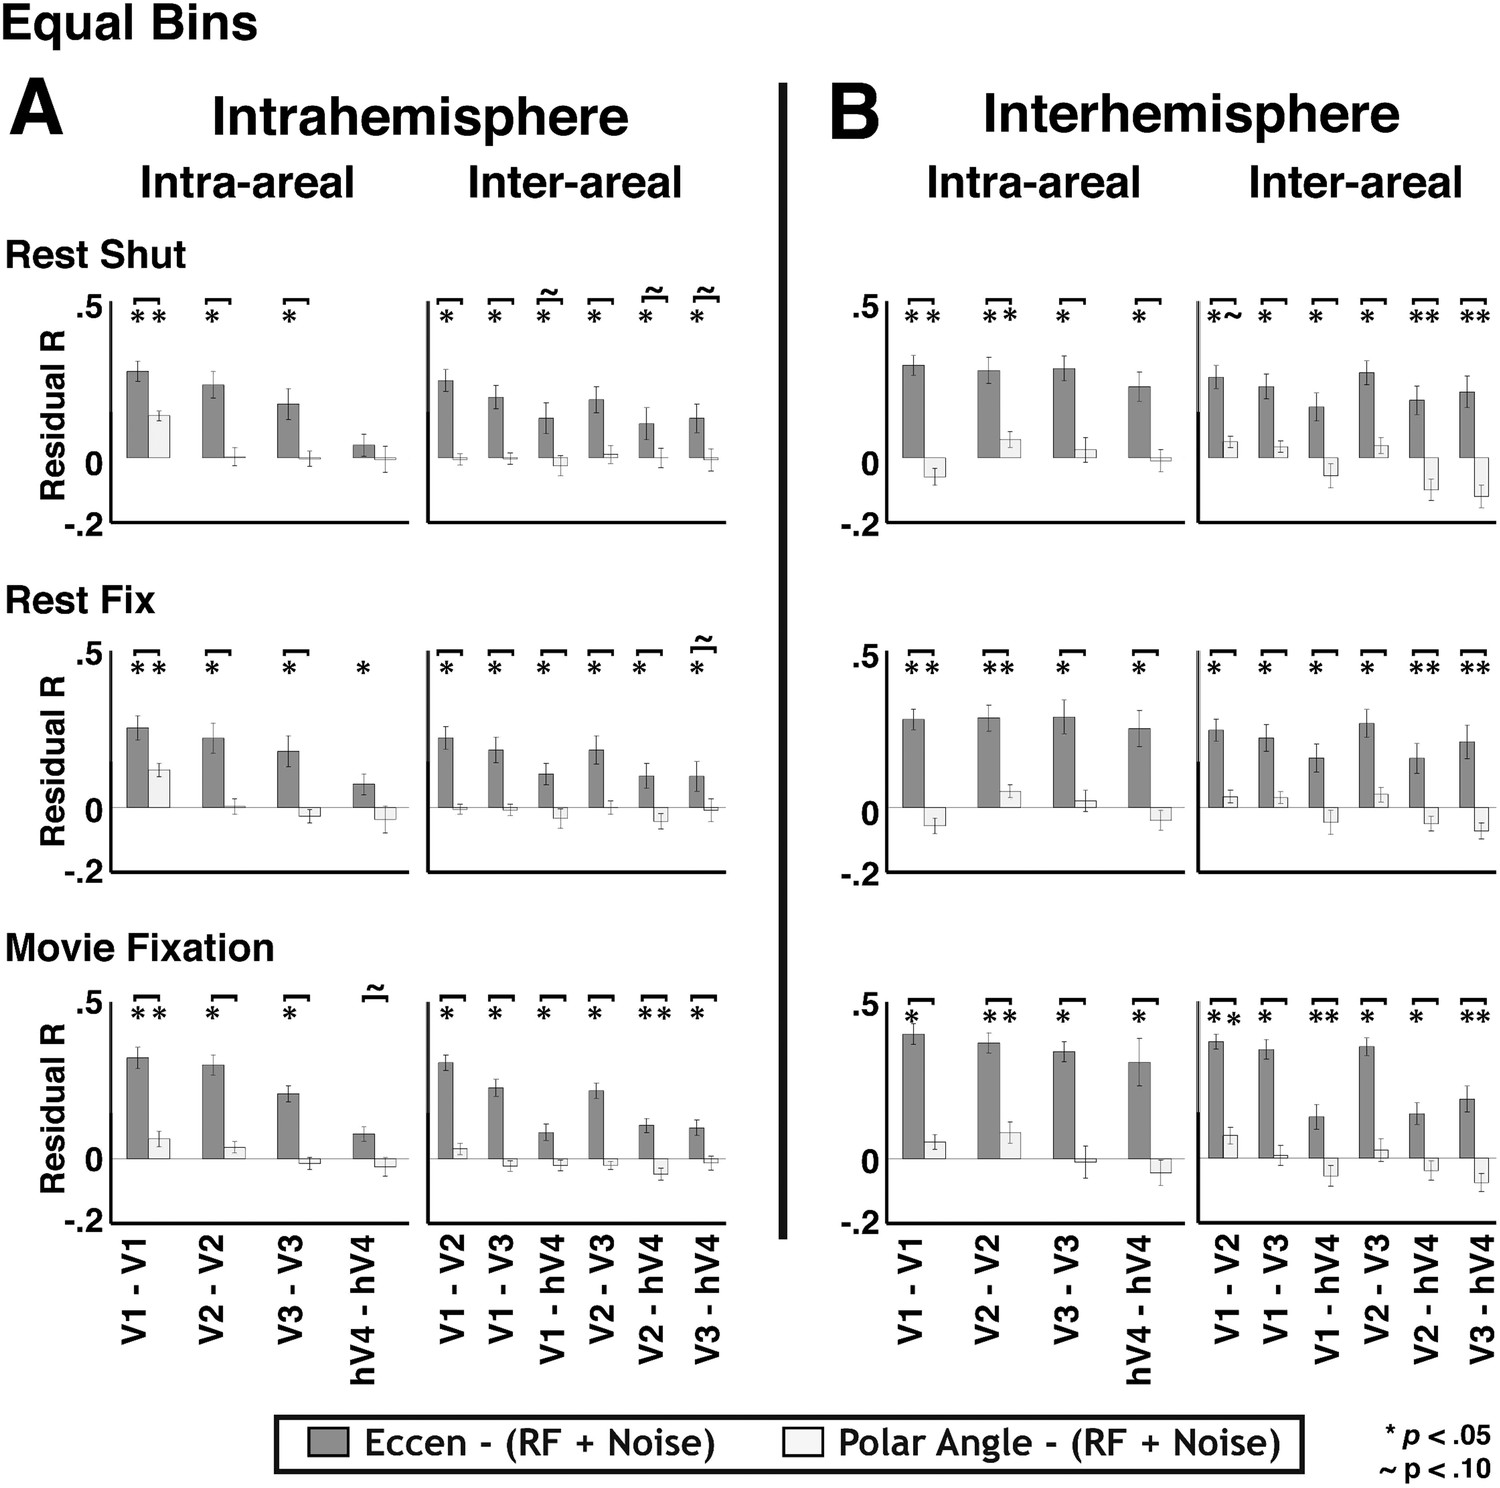
Equal Bins.
Download links
A two-part list of links to download the article, or parts of the article, in various formats.
Downloads (link to download the article as PDF)
Open citations (links to open the citations from this article in various online reference manager services)
Cite this article (links to download the citations from this article in formats compatible with various reference manager tools)
Widespread correlation patterns of fMRI signal across visual cortex reflect eccentricity organization
eLife 4:e03952.
https://doi.org/10.7554/eLife.03952


