Clathrin-independent pathways do not contribute significantly to endocytic flux
- Medical Research Council Laboratory of Molecular Biology, United Kingdom
- New England Biolabs, Inc., United States
Figures
Figure 1 with 1 supplement
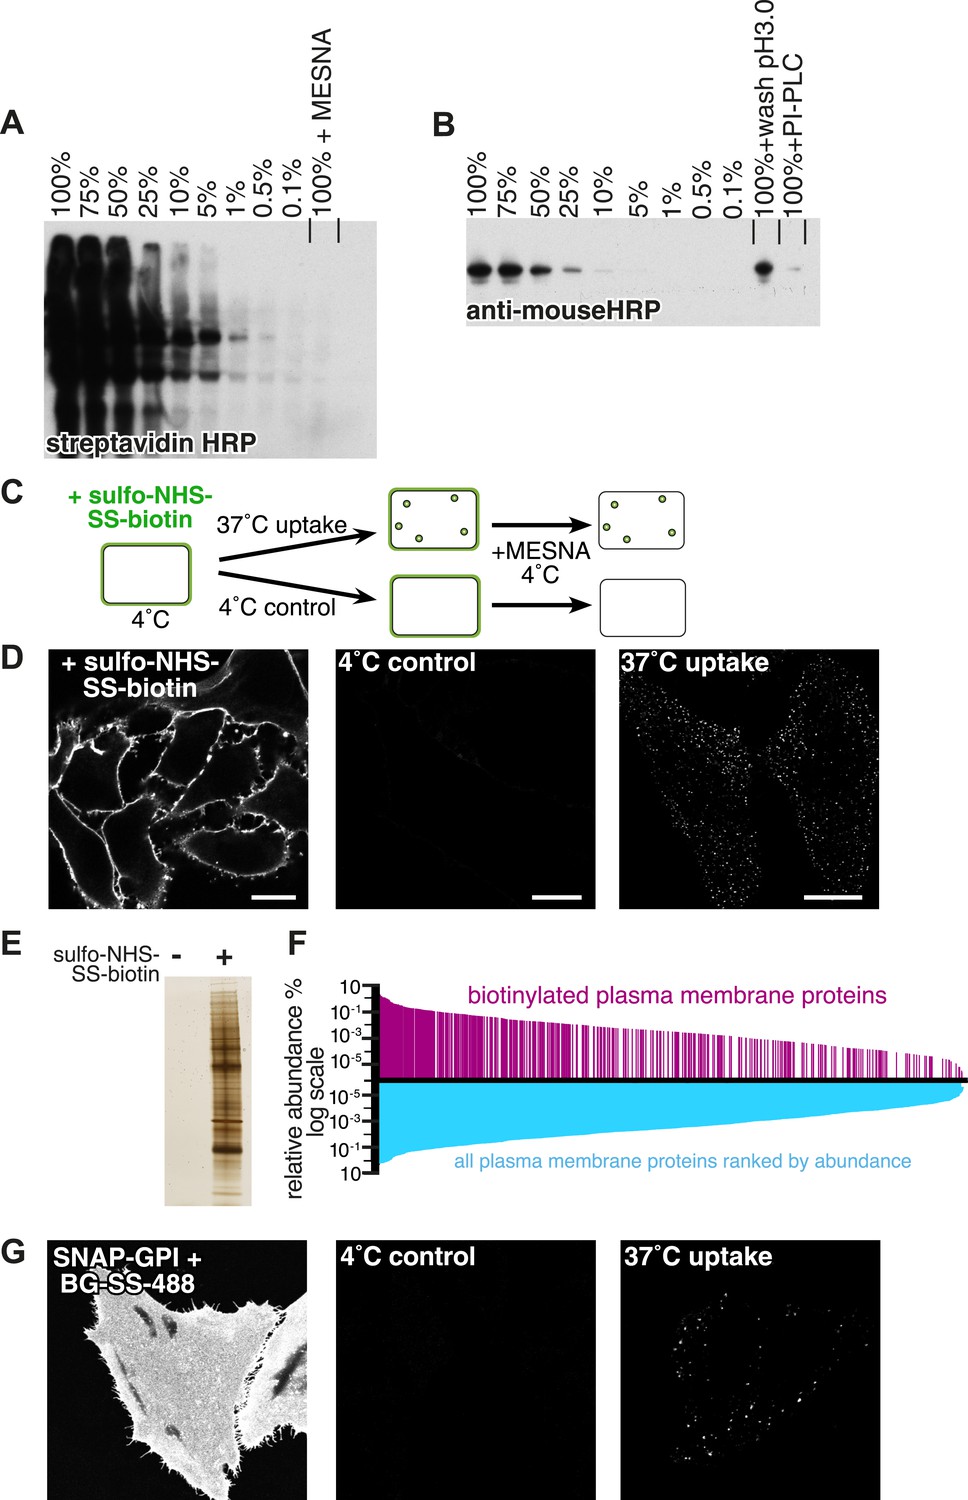
Experimental strategy and assay validation.
(A) Following surface biotinylation with sulfo-NHS-SS-biotin, HeLa cell lysate was serially diluted with non-biotinylated control cell lysate, and the amount of labelling was detected using streptavidin-HRP after SDS-PAGE and blotting. Incubation with 100 mM MESNa prior to cell lysis was enough to remove more than 99.9% of the initial signal. (B) Lysate from cells labelled with anti-CD59 antibody was serially diluted with non-labelled control cell lysate, and the amount of labelling was detected using an anti-mouse HRP antibody. Acid wash removed around 50% of the initial surface signal. PI-PLC, which cleaves the GPI-anchor in CD59, removed up to 90% of the initial signal. (C) Cartoon to illustrate endocytosis assay. Cell surface proteins were labelled with sulfo-NHS-SS-biotin at 4°C, then the reaction was quenched and cells were rapidly transferred to 37°C to allow endocytosis. Control cells were kept at 4°C. After defined time for endocytosis, cells were rapidly returned to 4°C, and surface-exposed biotin was removed using the membrane impermeable reducing agent MESNa. Biotin label was detected using fluorescent streptavidin, after fixation and permeabilisation. (D) Confocal images from control experiment to demonstrate total surface labelling with sulfo-NHS-SS-biotin, negative control, and labelling of endocytic vesicles, as illustrated in C. Bars are 20 μm. (E) Silver stained SDS-PAGE gel following surface biotinylation with sulfo-NHS-SS-biotin and streptavidin pull-down. Non-biotinylated cells provided a negative control. (F) Surface biotinylation labels the full range of plasma membrane proteins ranked according to their relative abundance in the plasma membrane. The relative abundance of plasma membrane proteins in HeLa cells was calculated based on a previously published study (Kulak et al., 2014). These are represented graphically ranked by abundance in blue, while proteins were detected in our experiments are shown in magenta. The data are listed in Figure 1—source data 1. (G) Confocal images of HeLa cells stably expressing SNAP-GPI. Cells labelled at 4°C with BG-SS-488. Control cells were treated with MESNa to remove external fluorophore after incubation only at 4°C. Warming to 37°C for 90 s before MESNa treatment at 4°C allows identification of endocytic vesicles.
-
Figure 1—source data 1
Plasma membrane proteins identified by mass spectrometry.
Biotinylated proteins identified in this study are listed by accession number, together with the estimated abundance takenfrom Kulak et al., 2014. A zero in the biotinylated proteins column indicates that we did not identify that protein. Calculation of PM abundance is described in the methods section.
- https://doi.org/10.7554/eLife.03970.004
Figure 1—figure supplement 1
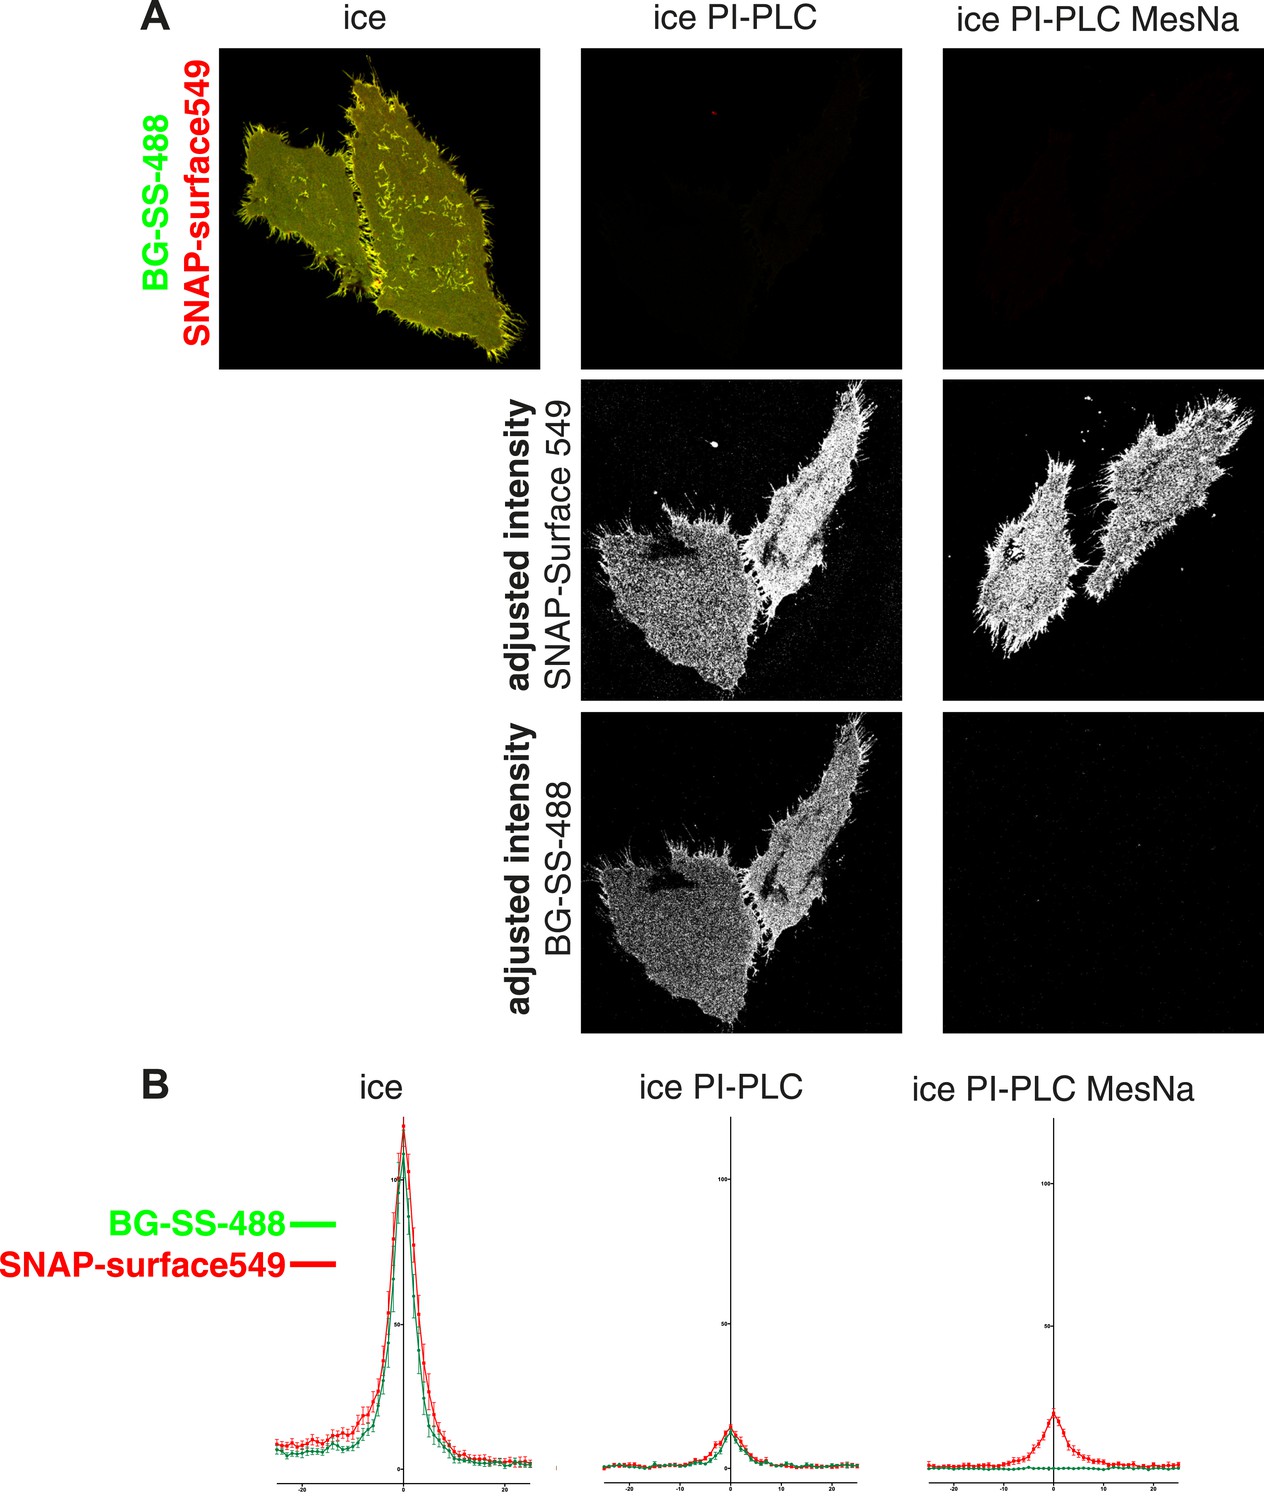
Removal of extracellular fluorophore from BG-SS-fluorophore labelled SNAP-tag by reduction with MESNa is highly efficient.
(A) Cells expressing SNAP-GPI were simultaneously labeled at 4°C with BG-SS-488 and SNAPsurface549. The latter is not reducible. They were then treated with PI-PLC or PI-PLC and then MESNa. Both treatments reduced the amount of label significantly (top row of images). However when remaining cell surface label was inspected by adjusting the intensity post-acquisition (lower panels), differential effects in the removal of the two fluorophores were observed. PI-PLC reduced the signal of both fluorophores evenly. However, when cells were treated with PI-PLC followed by MESNa the levels of reducible BG-SS-488 become practically undetectable. (B) Quantification of images from the same experiment shown in A. Images used for quantification were confocal cross sections of cells. Line profiles across the plasma membrane of the cell were combined to produce average traces of fluorescence intensity. The removal of BG-SS-488 in the MESNa + PI-PLC treated cells is clearly more efficient than removal of SNAP-surface549.
Figure 2 with 7 supplements
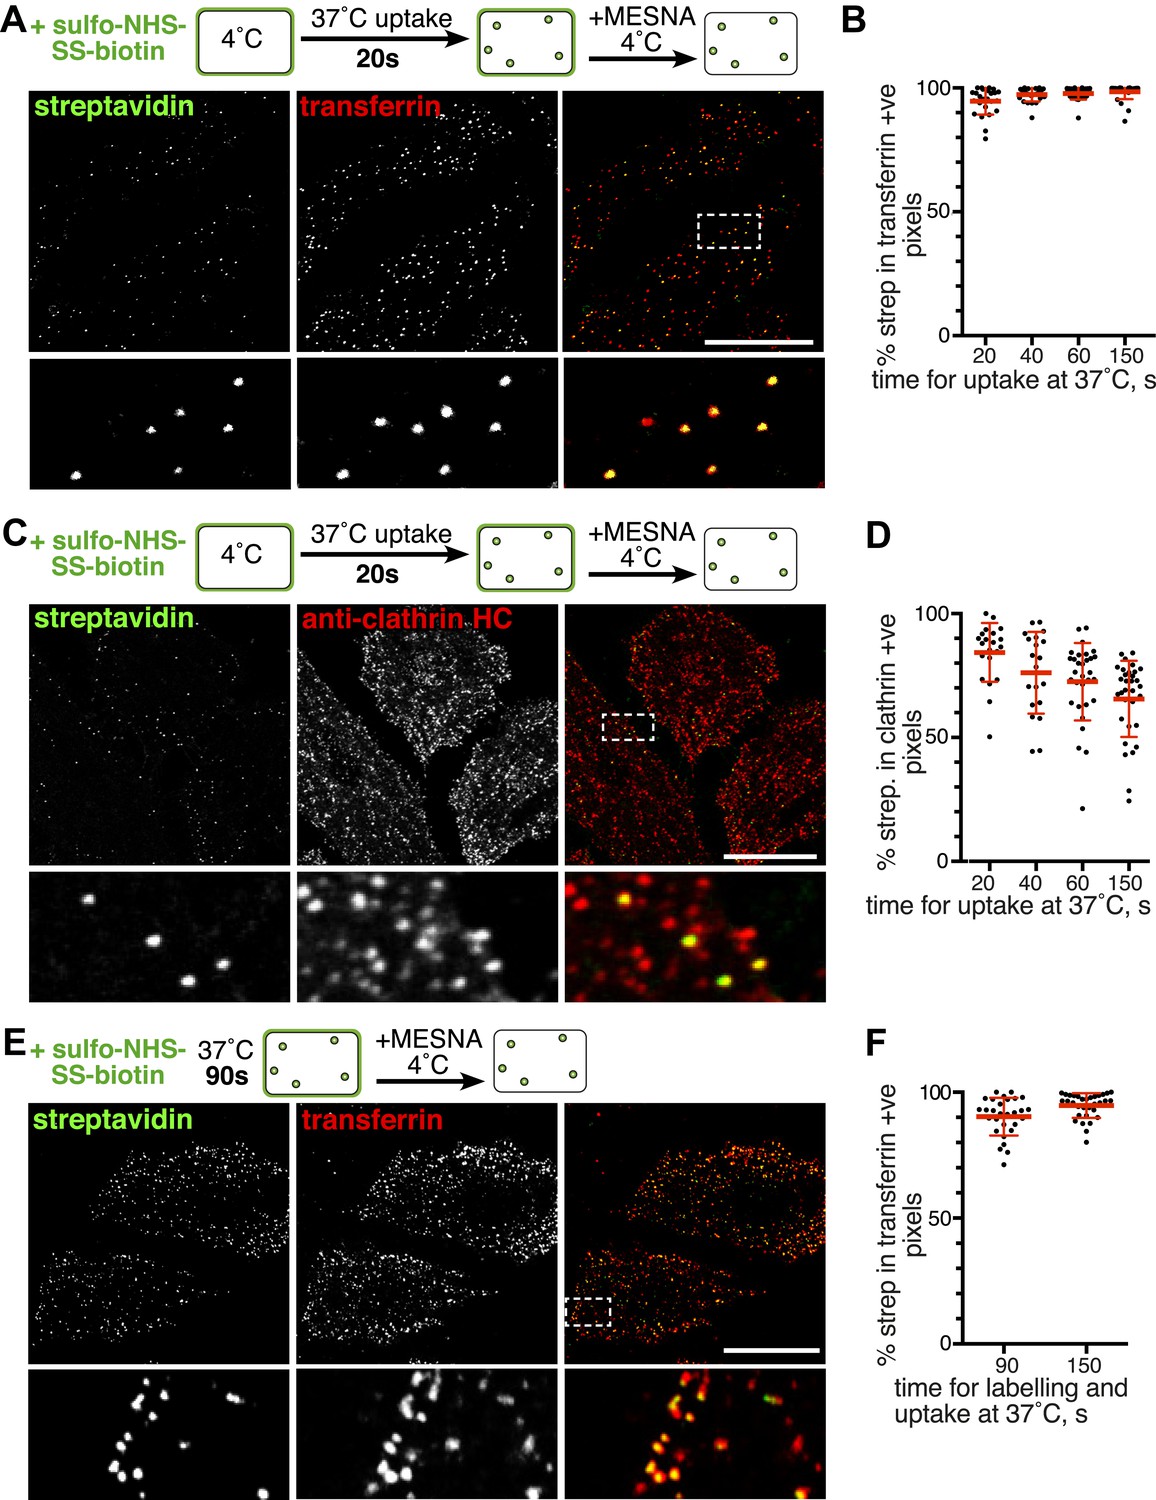
Over 95% of total endocytosed protein co-localises with markers for clathrin-mediated endocytosis.
(A) Confocal images of co-internalisation of all membrane proteins, labelled at 4°C with sulfo-NHS-SS-biotin, and transferrin-546. Internalisation was for 20 s at 37°C. Biotin was detected with streptavidin-488. Note that labelling with biotin and transferrin at 4°C was carried out consecutively, so transferrin was not biotinylated. The presence of external transferrin in nascent coated pits explains transferrin-positive, strepatavidin-negative puncta (see Figure 2—figure supplement 2). Zoomed in area in the lower panels is indicated with a box. Bar is 20 μm. (B) Quantification of proportion of internalised protein, detected as in A, that co-localises with transferrin. Bars are mean and SD, the data are from one experiment that was repeated three times with the same overall result. (C) Confocal images of total endocytosed membrane protein, labelled at 4°C with sulfo-NHS-SS-biotin as shown, and indirect immunofluorescence staining for clathrin heavy chain. Internalisation was for 20 s at 37°C. Biotin was detected with streptavidin-488. (D) Quantification of proportion of total internalised protein that co-localises with clathrin, at the times of internalisation indicated. Bars are mean and SD, the data are from one experiment that was repeated three times with the same result. (E) Confocal images of co-internalisation of total membrane protein and transferrin-546, with 90 s at 37°C for labelling and uptake as illustrated in the cartoon. Bar is 20 μm. (F) Quantification of proportion of internalised protein, detected as in E, that co-localises with transferrin, at the times for continuous labelling and internalisation indicated. Bars are mean and SD, the data are from one experiment that was repeated three times with the same result.
Figure 2—figure supplement 1
Macropinosomes are readily identified by labelling with sulfo-NHS-SS-biotin.
Cells were labeled with sulfo-NHS-SS-biotin and transferrin-546, allowed to endocytose at 37°C for the times indicated, MESNA-treated, fixed, and stained with streptavidin-488. Occasionally, cells contained larger endocytic structures (>0.5 µm) that were intensely labeled with fluorescent streptavidin but did not contain transferrin, despite the presence of transferrin in the medium during incubation at 37°C. These structures correspond to macropinosomes. No clear correlation between their abundance and incubation time at 37°C was observed. Bar is 15 μm.
Figure 2—figure supplement 2
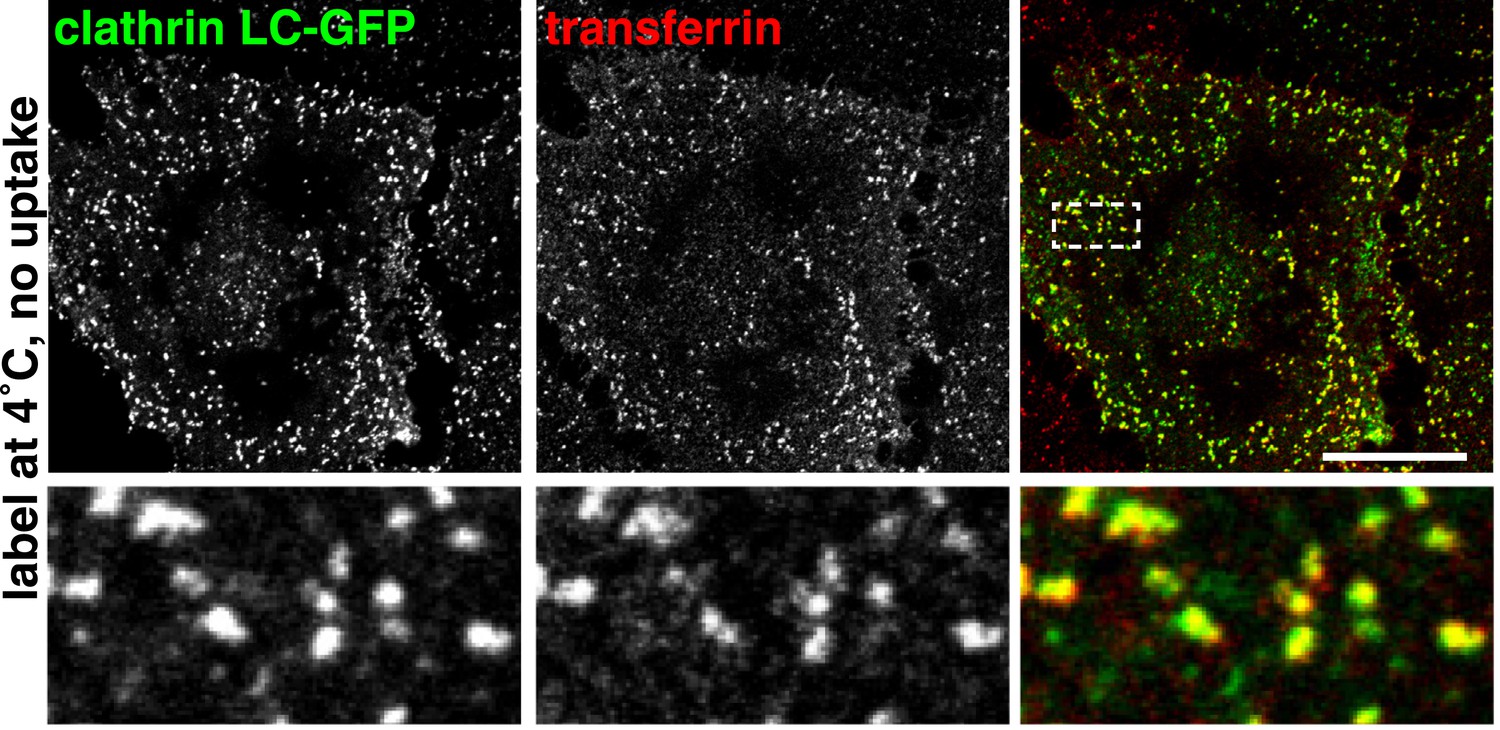
Surface-bound transferrin is highly concentrated within clathrin-coated pits.
Cells were transfected with clathrin light chain-GFP, cooled to 4°C, labelled with transferrin-546, fixed, and imaged. Bar is 20 μm. The boxed region is shown in the lower panels.
Figure 2—figure supplement 3
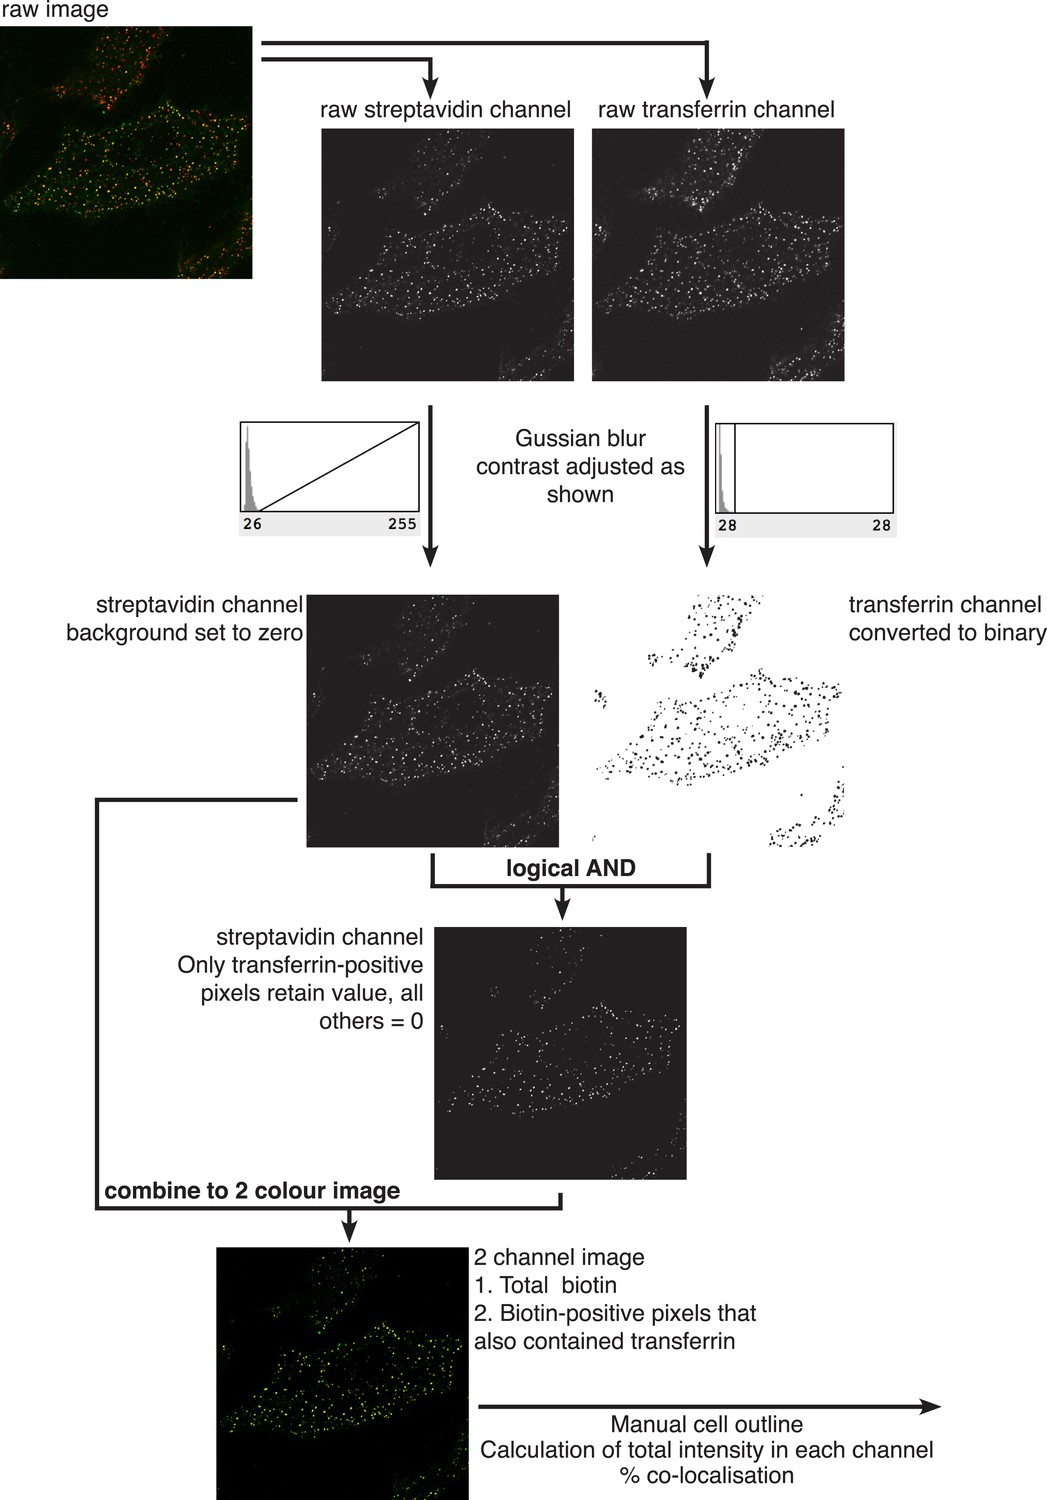
Quantification of percent co-localisation.
All processing was carried out in Image J. Two channel raw images were acquired by confocal microscopy. The channels were separated, subjected to Gaussian blur with σ = 0.7, and then contrast adjusted using the histogram of pixel intensities as shown. In the streptavidin/biotin channel, the base of the histogram was used to set pixel intensity = 0, maximal pixel intensity was not altered. In the transferrin channel, which is used to generate a binary mask, pixel intensity = 0 and maximal pixel intensity were both set to the base of the histogram of pixel intensities as shown. Following dilation of positive pixels in the binary mask a logical ‘AND’ operation was carried out to isolate those pixels in the streptavidin channel that also are positive in the transferrin binary mask. This image was combined with the original biotin image in a two colour overlay, and manually drawn regions of interest were used to calculate total pixel intensity in the biotin channel, and total pixel intensity in the same channel from transferrin-positive pixels.
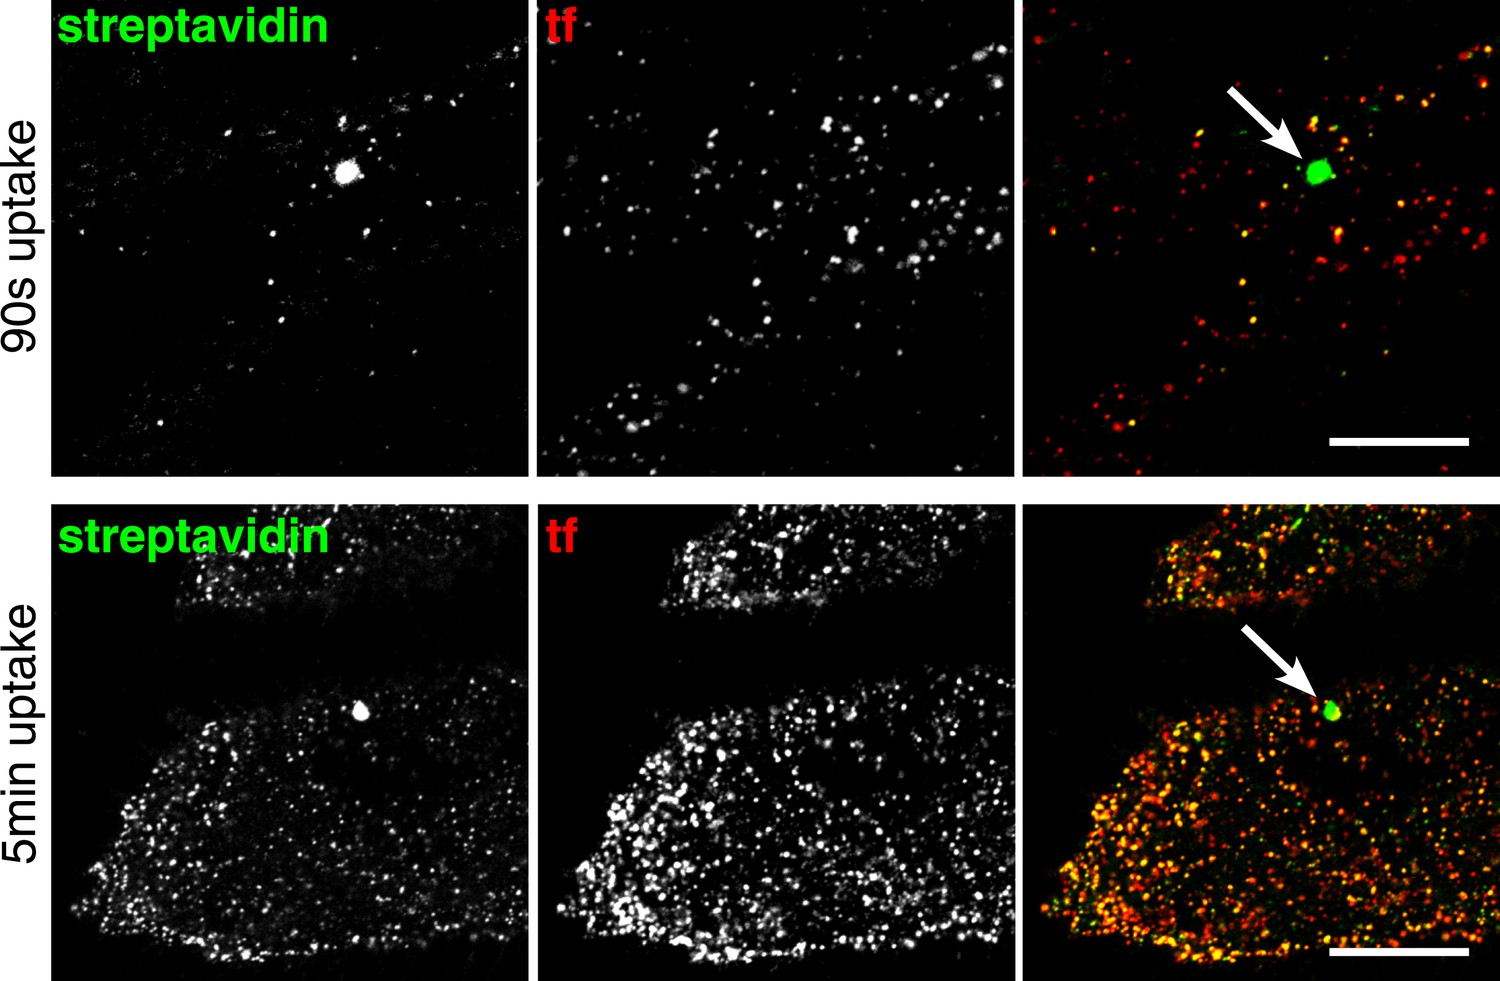
Figure 2—figure supplement 4
Co-localisation between internalised sulfo-NHS-SS-biotin and transferrin after labelling at 4°C and 90 s of internalisation at 37°C.
Confocal images of co-internalisation of total membrane protein, labeled at 4°C with sulfo-NHS-SS-biotin, and transferrin-546. Internalisation was for 90 s at 37°C. Biotin was detected with streptavidin-488 after MESNA treatment. Note that labelling with biotin and transferrin at 4°C was carried out consecutively, so transferrin was not biotinylated. Zoomed in area of the lower panel is indicated with a box. Bar is 20 μm.
Figure 2—figure supplement 5
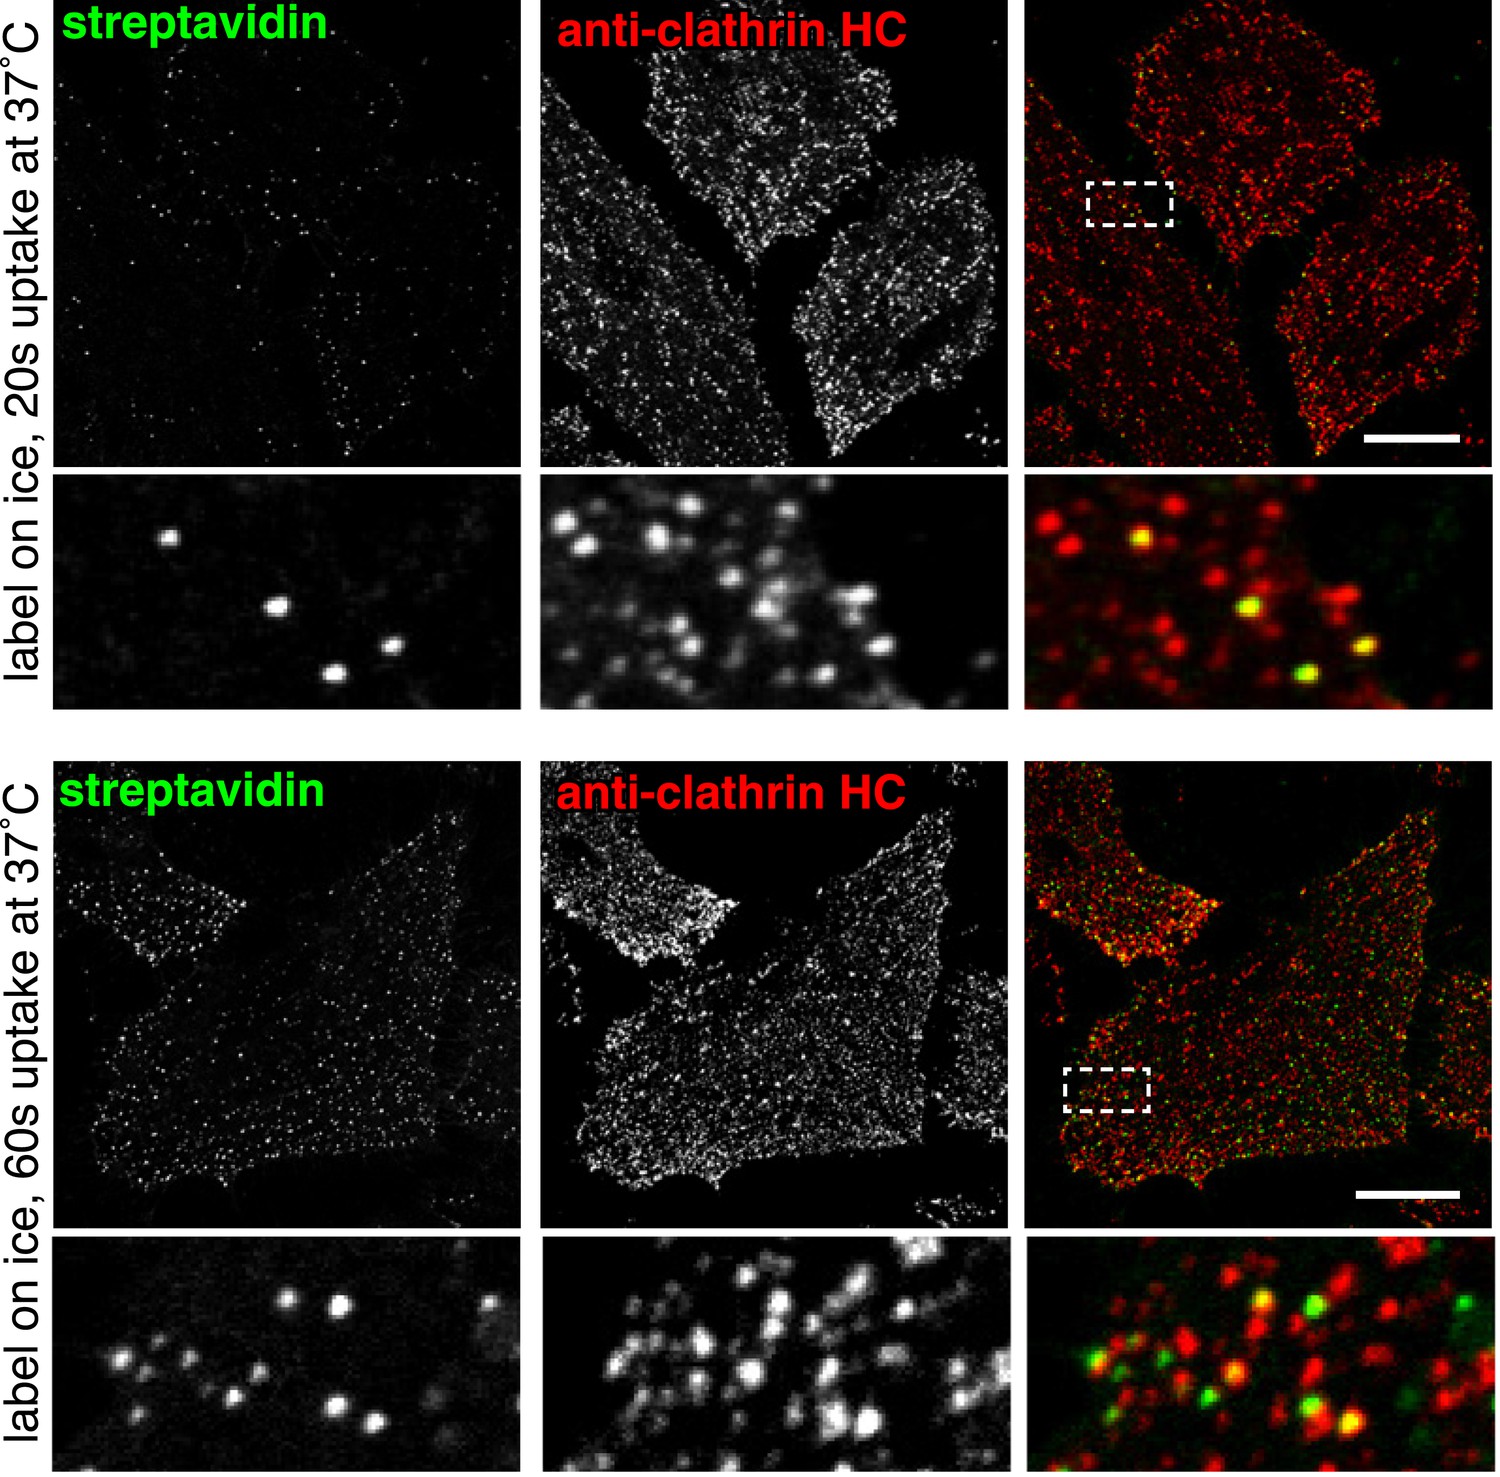
Co-localisation between internalised sulfo-NHS-SS-biotin and clathrin after 20 s and 60 s of internalisation at 37°C.
HeLa cells labeled at 4°C with sulfo-NHS-SS-biotin, were moved to 37°C for the indicated time-points. Surface biotin was removed by MESNA treatment, the cells were fixed and permeabilised, and then stained with streptavidin-488, and antibodies against clathrin heavy chain by indirect immunofluorescence. Box indicates zoomed region, bars are 20 μm. 20 s image also shown in Figure 2.
Figure 2—figure supplement 6
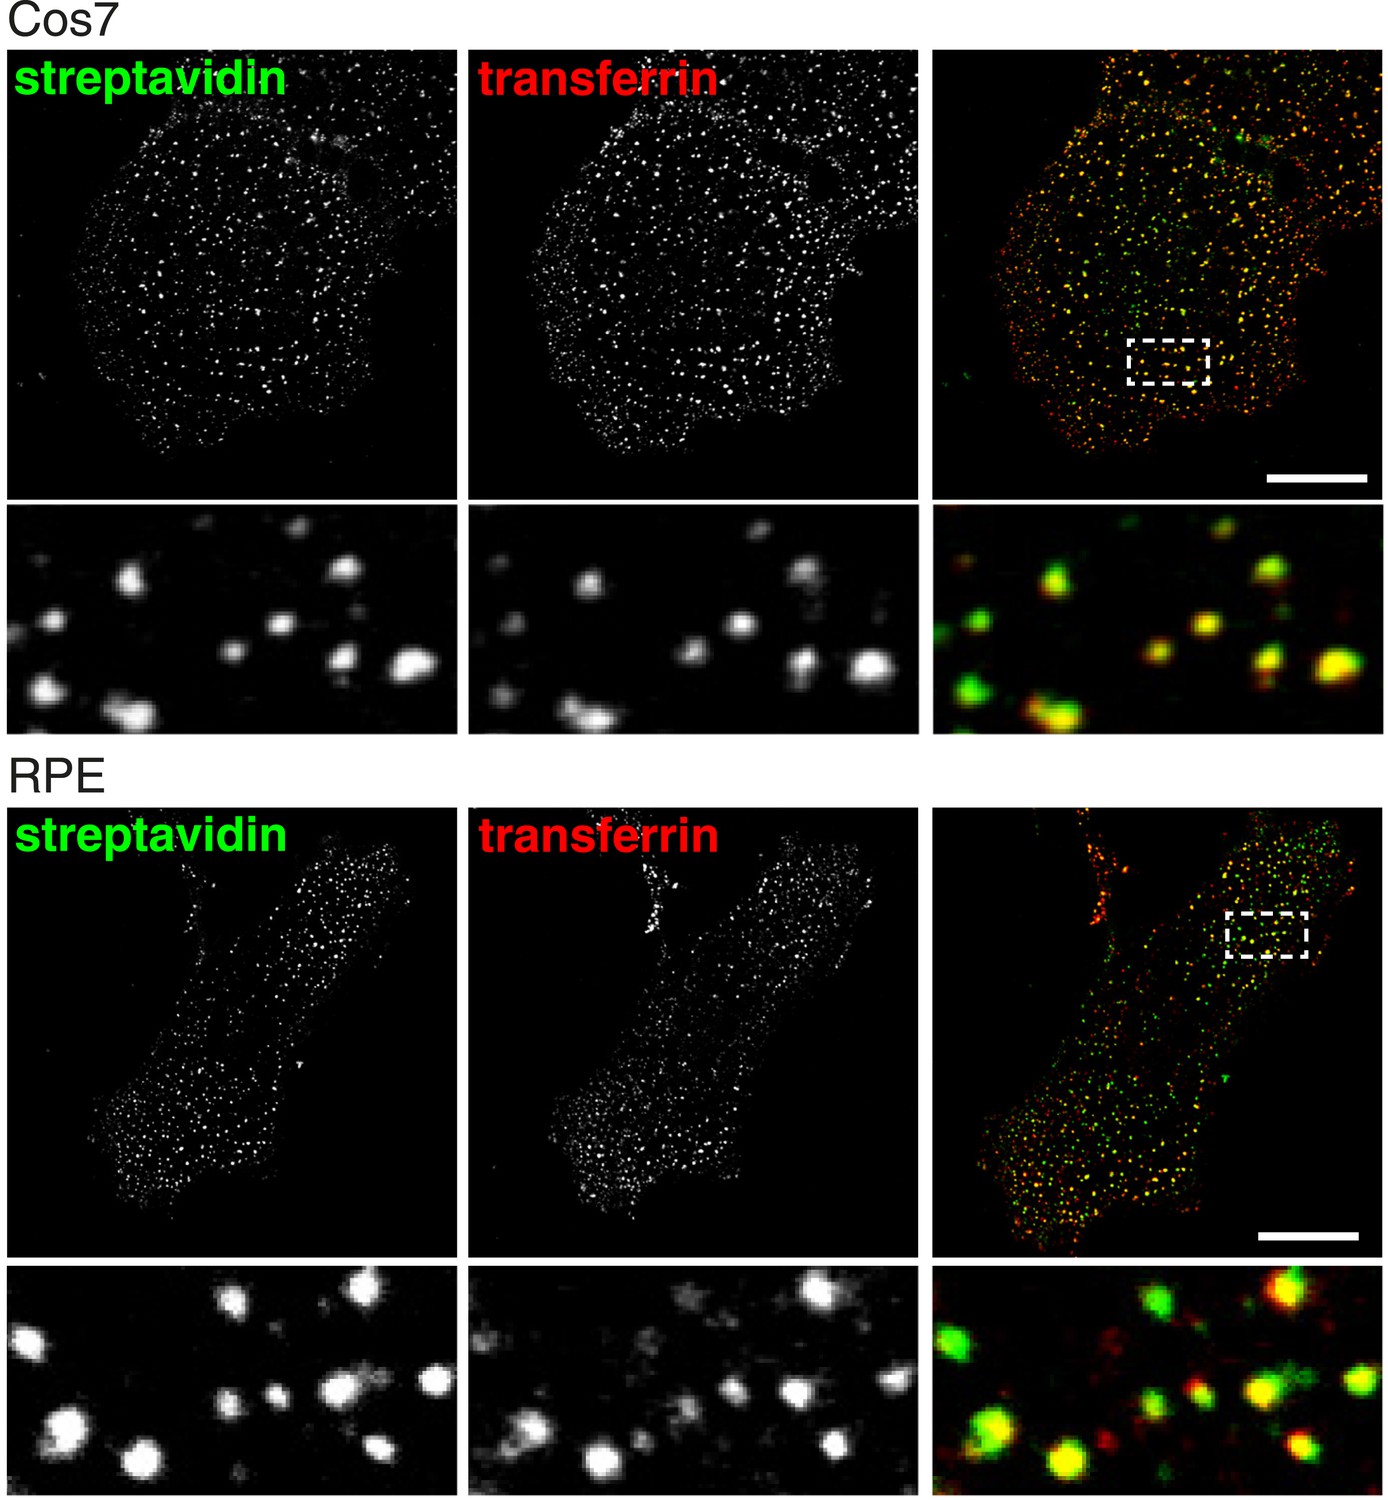
Total endocytosed protein and transferrin co-localise after 90 s uptake in Cos7 and RPE cells.
Confocal images of co-internalisation of total membrane protein, labeled at 4°C with sulfo-NHS-SS-biotin, and transferrin-546. Internalisation was for 90 s at 37°C. Biotin was detected with streptavidin-488. Note that labelling with biotin and transferrin at 4°C was carried out consecutively, so transferrin was not biotinylated. Zoomed in area of the lower panel is indicated with a box. Bar is 20 μm.
Figure 2—figure supplement 7
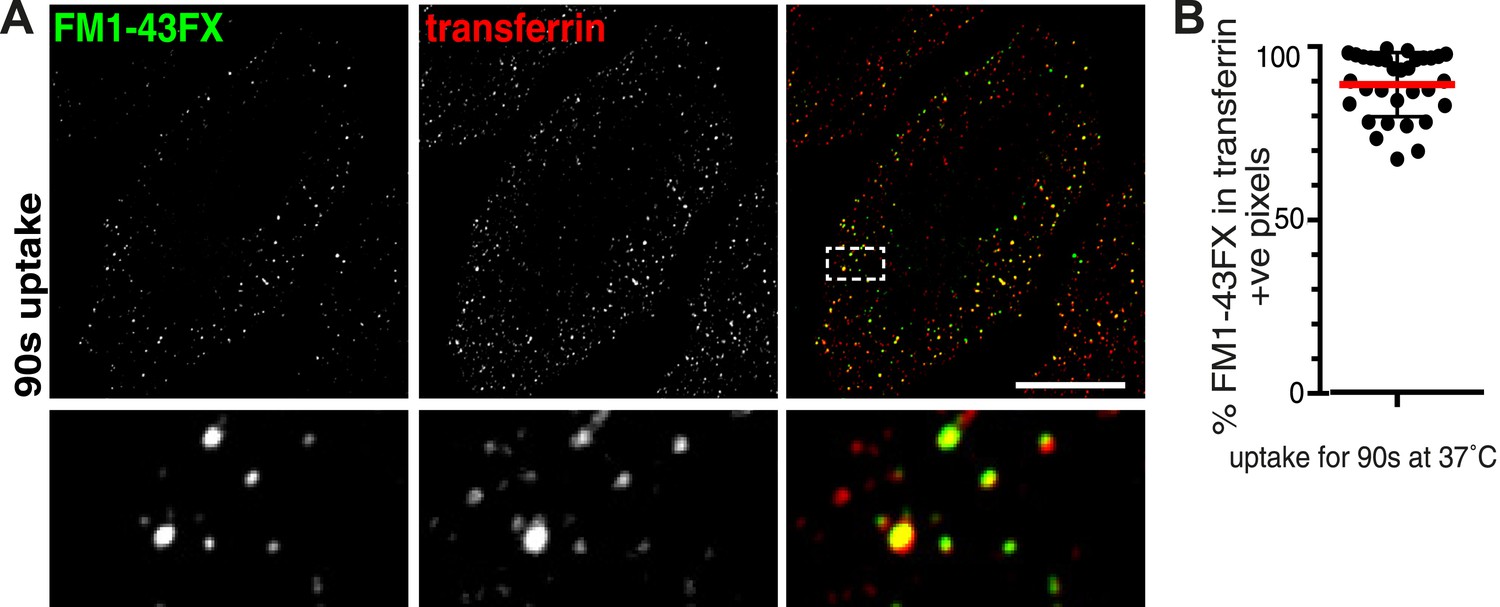
Absence of membrane-positive, transferrin-negative vesicles.
(A) Cells were labelled with the membrane dye FM1-43FX and transferrin at 4°C, warmed to 37°C for 90 s, plasma membrane dye was removed by washes with ice-cold PBS, and were imaged at 4°C without fixation. Transferrin-positive puncta that do not contain FM1-43FX are likely to represent clathrin-coated pits that have not budded from the plasma membrane. Contrast levels have been set so that residual background plasma membrane staining with FM1-43FX is excluded. Zoomed in area of the lower panel is indicated with a box. Bar is 20 μm. (B) Quantification of the proportion of FM1-43FX signal detected in intracellular puncta that is present in transferrin-positive pixels. Note that cells where FM1-43FX clearly stained many intracellular membranes due to cell disruption were excluded from the analysis. Bars are mean, SD. Each point is one cell region.
Figure 3 with 2 supplements
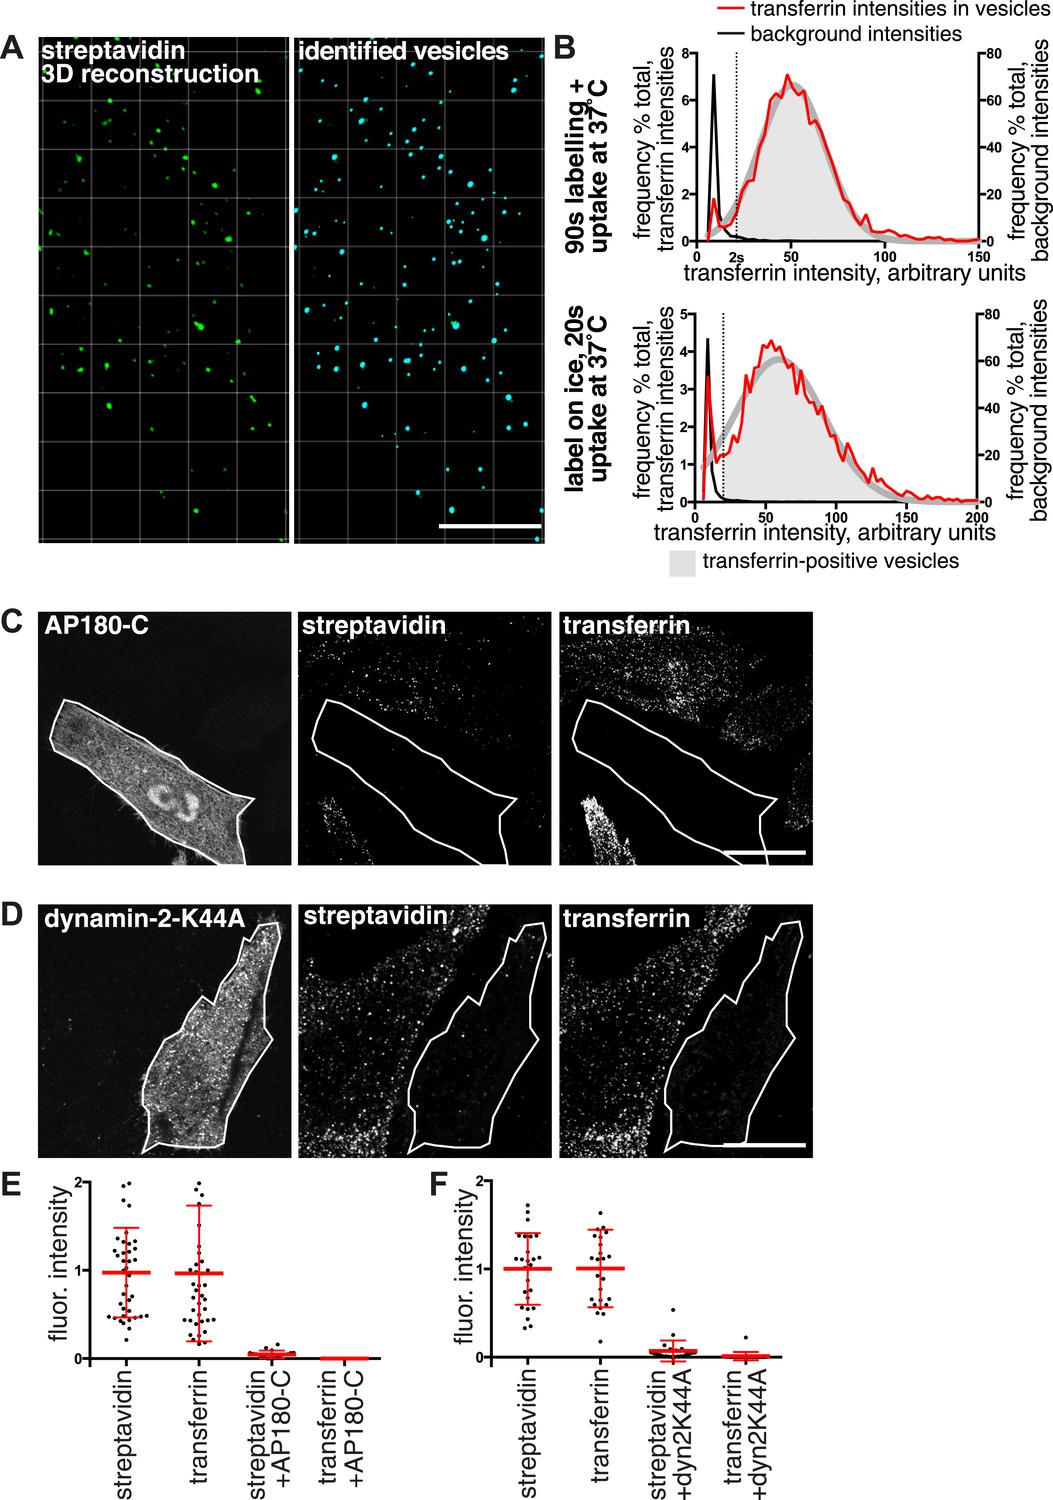
Over 95% of total endocytosed protein enters the cell via clathrin-coated pits.
(A) 3D projection of cell volumes following interalisation of sulfo-NHS-SS-biotin for 90 s at 37°C. Streptavidin-488 fluorescence is shown in the left panel, vesicle objects recognised with Imaris software from the streptavidin signal are shown in the right panel. Bar 5 μm. (B) Analysis of the transferrin cargo load of endocytic vesicle objects identified as in A, after 20 s and 90 s of uptake as shown. Frequency distribution of mean transferrin intensity in individual vesicles is shown as the red line. Frequency distribution of transferrin intensities for the same vesicles after offsetting the transferrin channel by 500 nm provides a set of background intensities, shown as a black line and not plotted to the same y-axis scale. Cut-offs are shown as dotted lines and correspond to the 95 percentile for the offset values. The distribution of transferrin intensity, in the majority of endosomes, can be described by a Gaussian distribution (dark grey line). (C) Internalisation of sulfo-NHS-SS-biotin and transferrin-647, for 15 min, in cells expressing AP180C-IRES-GFP. Internalised biotin was detected by MESNa treatment and labelling with streptavidin, a wash at pH3.0 removed external transferrin. Transfected cells are outlined in white. Bars are 20 μm. (D) Internalisation of sulfo-NHS-SS-biotin and transferrin-647, for 15 min, in cells expressing dynamin-2-K44A-dsRed. Internalised biotin was detected by MESNa treatment and labelling with streptavidin, a wash at pH3.0 removed external transferrin. Transfected cells are outlined in white. Bars are 20 μm. (E) Quantification of total protein and transferrin endocytosis in cells expressing AP180C-IRES-GFP as C. Each point is mean fluorescence intensity of one cell region, after background subtraction. Background was determined empirically from control experiments with only labelling at 4°C. Values are all normalised so mean of control = 1. Bars mean and SD, data are all from one experiment, the experiment was repeated three times. (F) Quantification is for cells expressing dynamin-2-K44A-dsRed as shown in D. See E for details.
Figure 3—figure supplement 1
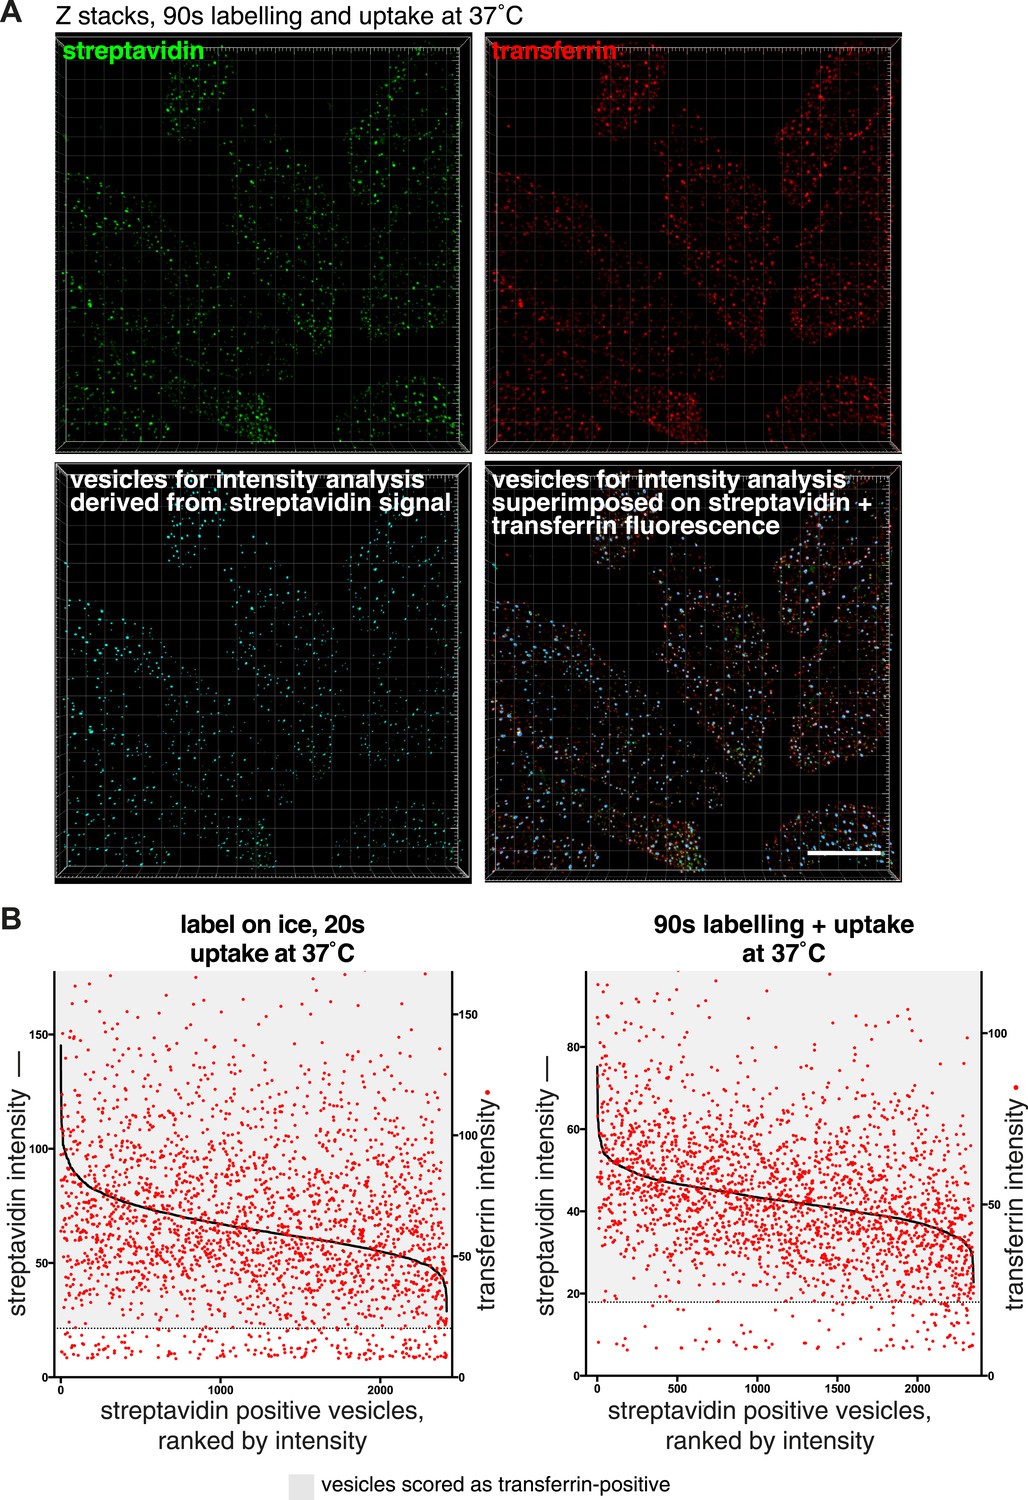
Correlation between streptavidin (total endocytosed protein) and transferrin intensities in endocytic vesicles.
(A) Projections of confocal z-stacks showing raw fluorescence images of internalised biotin, labelled with streptavidin, and transferrin, after 90 s internalisation. The streptavidin image was used to identify endocytic vesicles using Imaris software as displayed in the lower left panel. The lower right panel displays the software-recognised vesicle objects superimposed on streptavidin and transferrin fluorescence. Bar 15 μm. (B) Correlation between the mean fluorescence intensity of streptavidin and transferrin present in individual endosomes. Individual endosomes have has been ranked from high to low streptavidin intensity. Red dots correspond to the transferrin intensity in the particular endosome. Dotted line represents the cut-off for transferrin-positive endosomes, based on 95th percentile of background intensities as described in the main text. Transferrin positive endosomes are within in the greyed area.
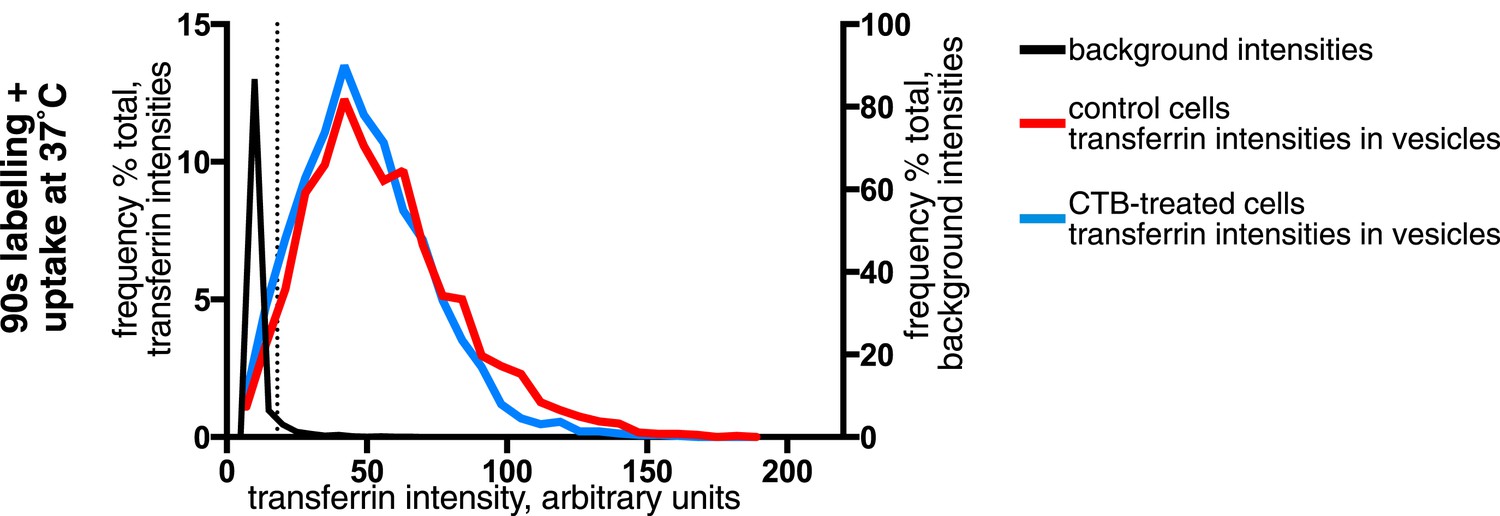
Figure 3—figure supplement 2
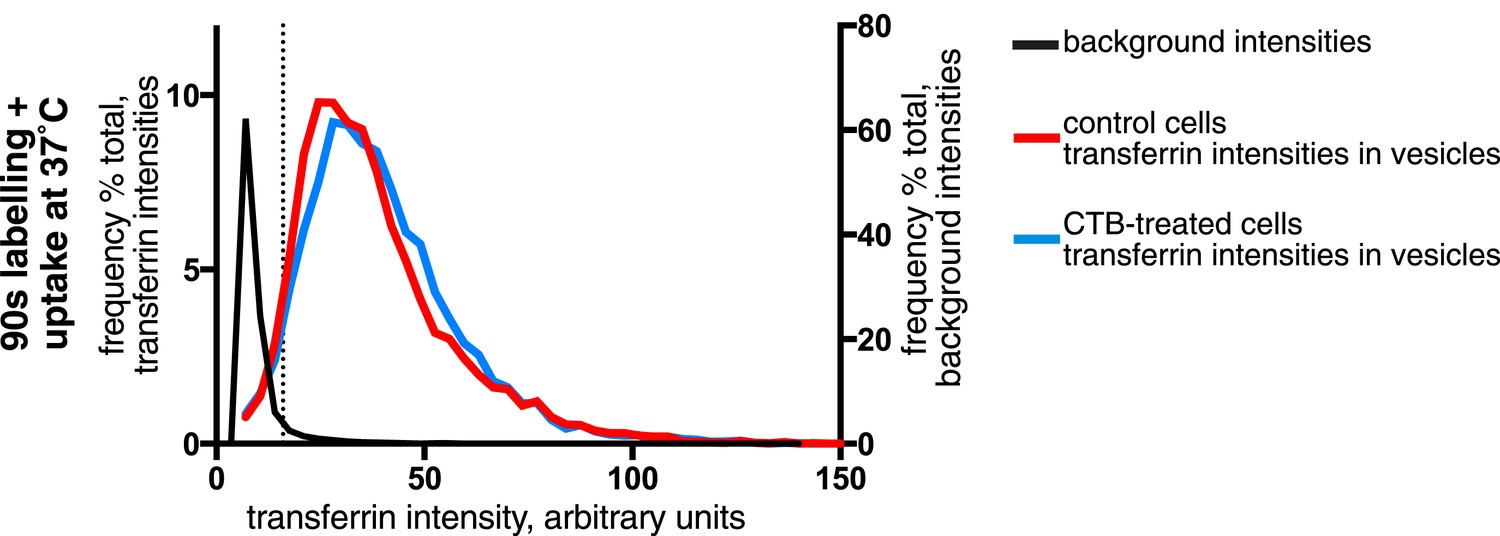
Effect of CTB-binding on transferrin intensities in endocytic vesicles.
Analysis of the transferrin cargo load of endocytic vesicle objects identified as in Figure 3A after 90 s of uptake in control and CTB-labeled cells as shown. Frequency distribution of transferrin intensities for the same vesicles after offsetting the transferrin channel by 500 nm provides a set of background intensities, shown as a black line and not plotted to the same y-axis scale. Cut-off is shown as a dotted line and corresponds to the 95 percentile for the offset values. The proportion of vesicles that are potentially transferrin-negative (the fraction below the dotted line) is not altered by CTB-binding.
Figure 4 with 1 supplement
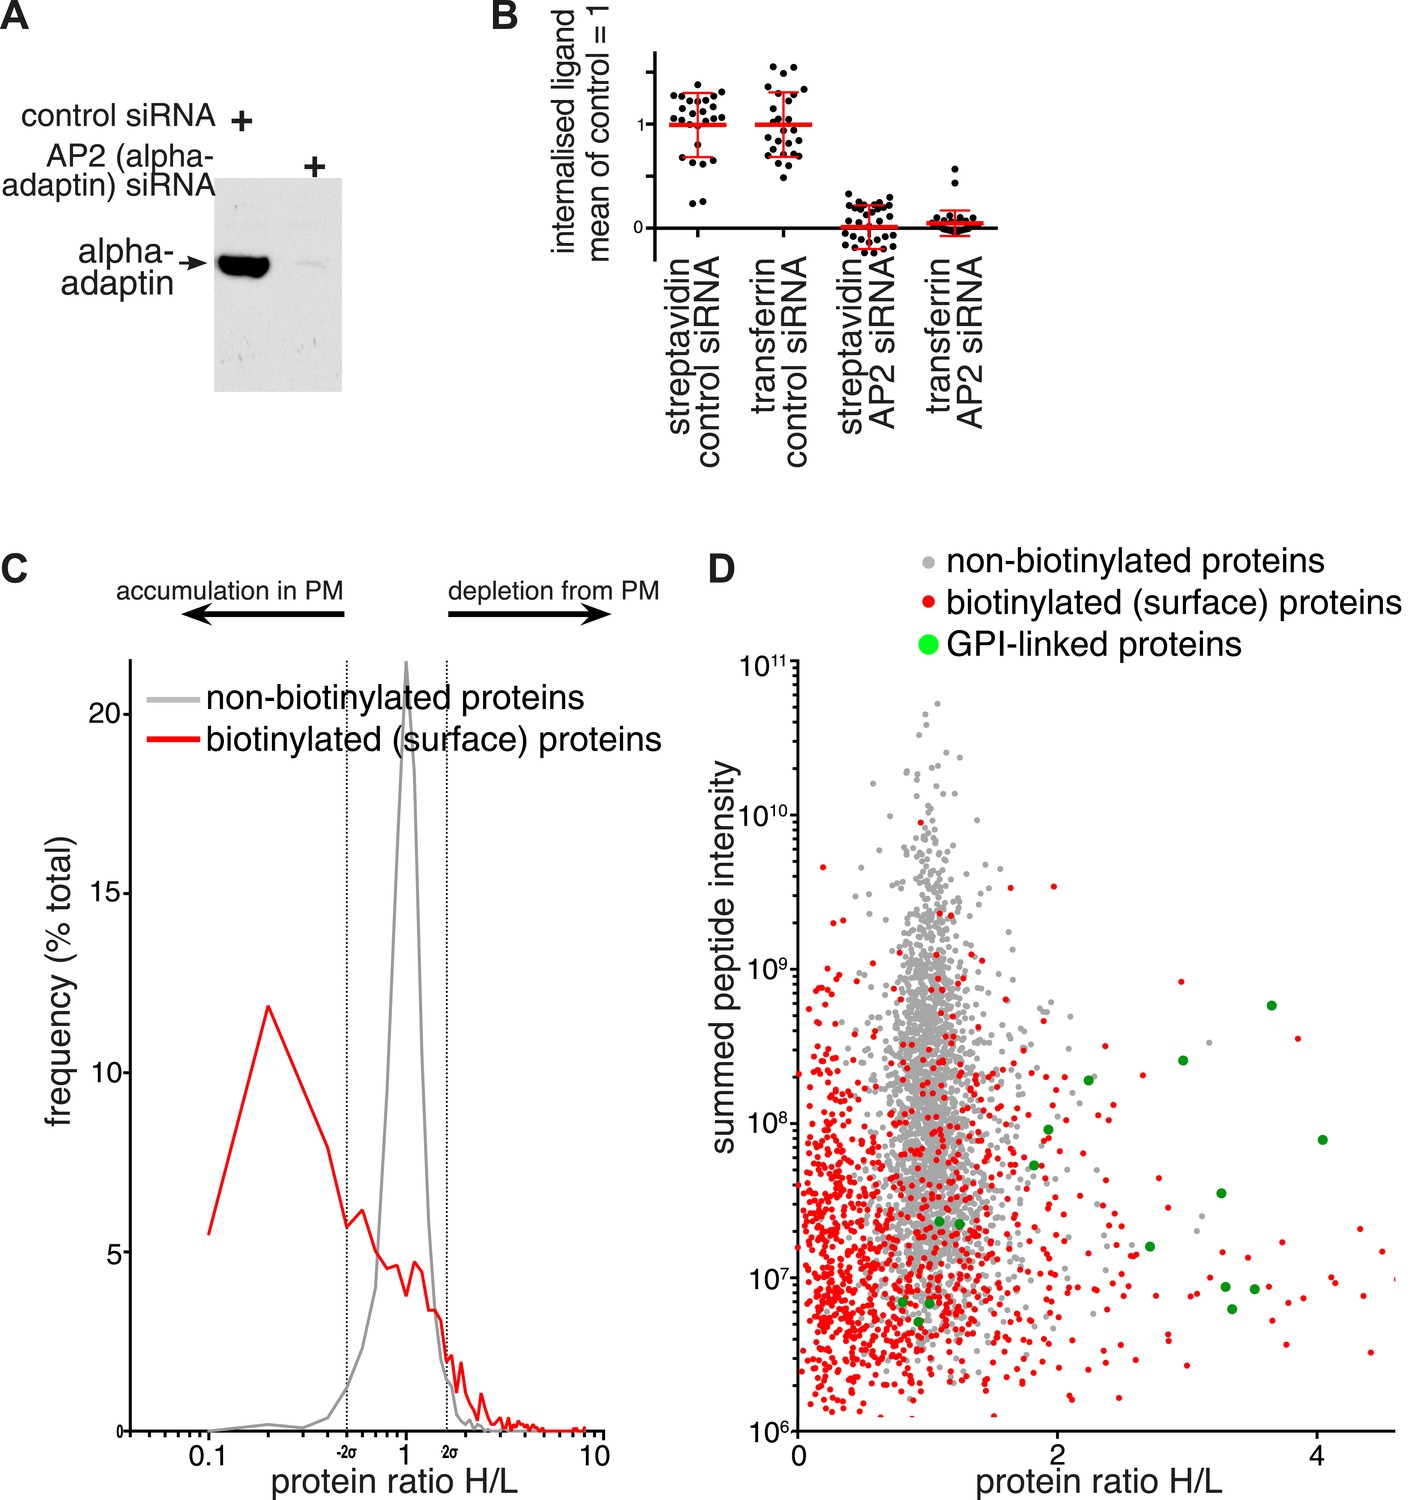
Changes in plasma membrane protein composition in cells depleted of AP2.
(A) Western blot for the AP2 alpha subunit following non-targeting or alpha adaptin (AP2) siRNA treatment. (B) Internalisation of sulfo-NHS-SS-biotin and transferrin-647, for 15 min, in cells transfected with control and alpha adaptin (AP2) siRNAs. Internalised biotin was detected after MESNa treatment and labelling with streptavidin, a wash at pH3.0 removed external transferrin. Each point is one cell region, bars are mean and SD. Background was calculated from cells labelled at 4°C, and immunofluorescence identified those cells where the siRNA efficiently reduced alpha adaptin levels. (C) Frequency distribution of SILAC ratios for surface biotinylated (red line) and non-labelled (grey line) proteins from control (Heavy isotopes) and AP2-siRNA (Light isotopes) transfected cells. Dotted lines represent two standard deviations on either side of the mean for the SILAC ratio distribution of non-labelled proteins. (D) SILAC protein ratios comparing control (Heavy isotopes) and AP2-siRNA (Light isotopes) transfected cells, plotted against summed peptide intensities. Biotinylated plasma membrane proteins isolated by precipitation with streptavidin-agarose are shown in red. Non-biotinylated proteins corresponding to intracellular proteins are shown in grey and served as an internal control. GPI-anchored proteins, are shown in green.
-
Figure 4—source data 1
SILAC ratios for biotinylated and non-biotinylated proteins.
Proteins shaded green were classified as depleted from the the plasma membrane upon AP2 siRNA treatment, those shaded redwe classified as accumulated.
- https://doi.org/10.7554/eLife.03970.019
Figure 4—figure supplement 1
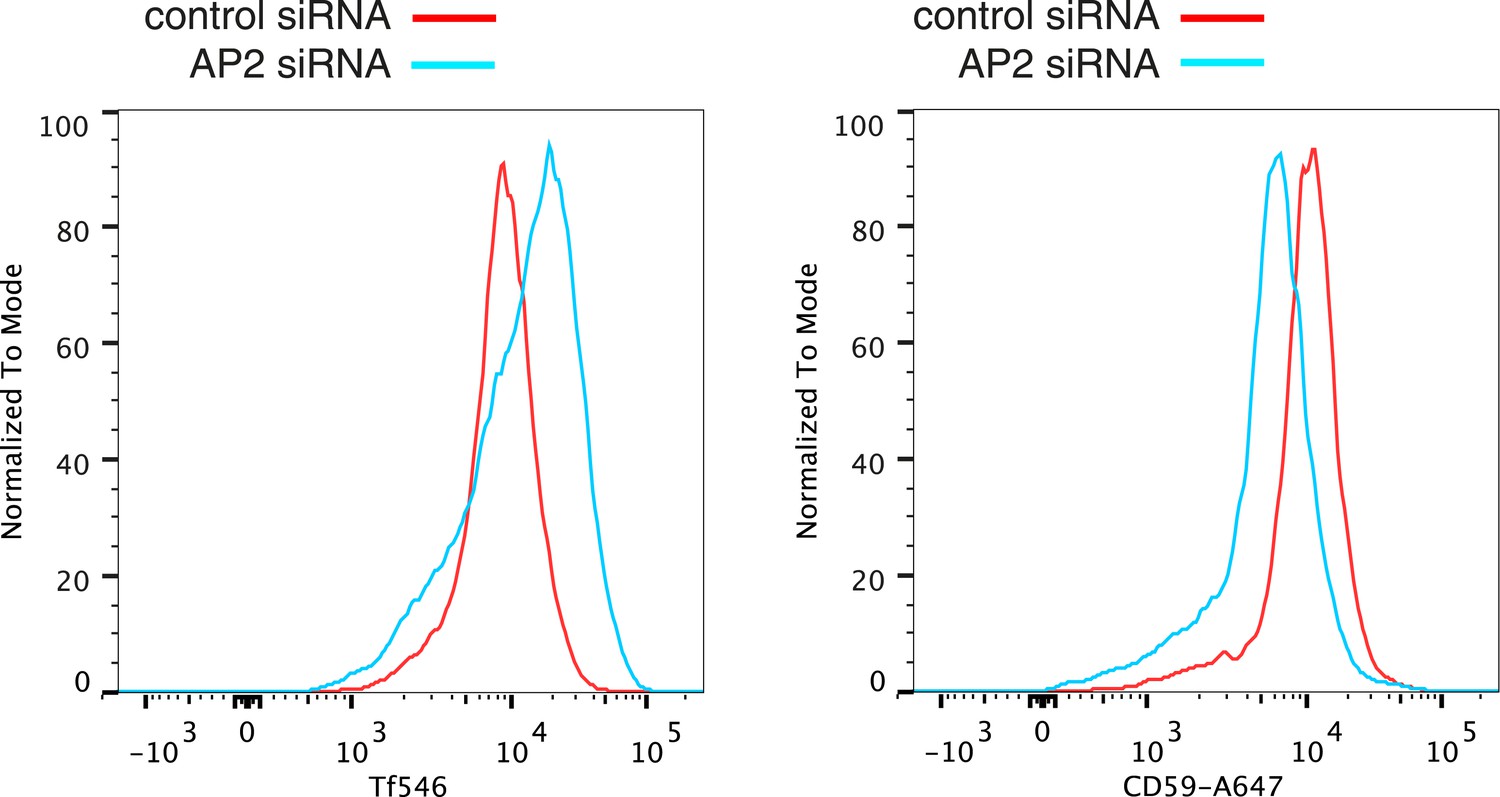
Verification of changes in plasma membrane protein levels detected by SILAC.
Flow cytometry was used to analyse plasma membrane abundance of transferrin receptor and CD59. Cells were transfected with control siRNA or siRNA to knock down expression of the alpha adaptin subunit of the AP2 complex (‘AP2 siRNA’) and then labeled at 4°C with anti-CD59-AlexaFluor647 and Transferrin-546.
Figure 5 with 1 supplement
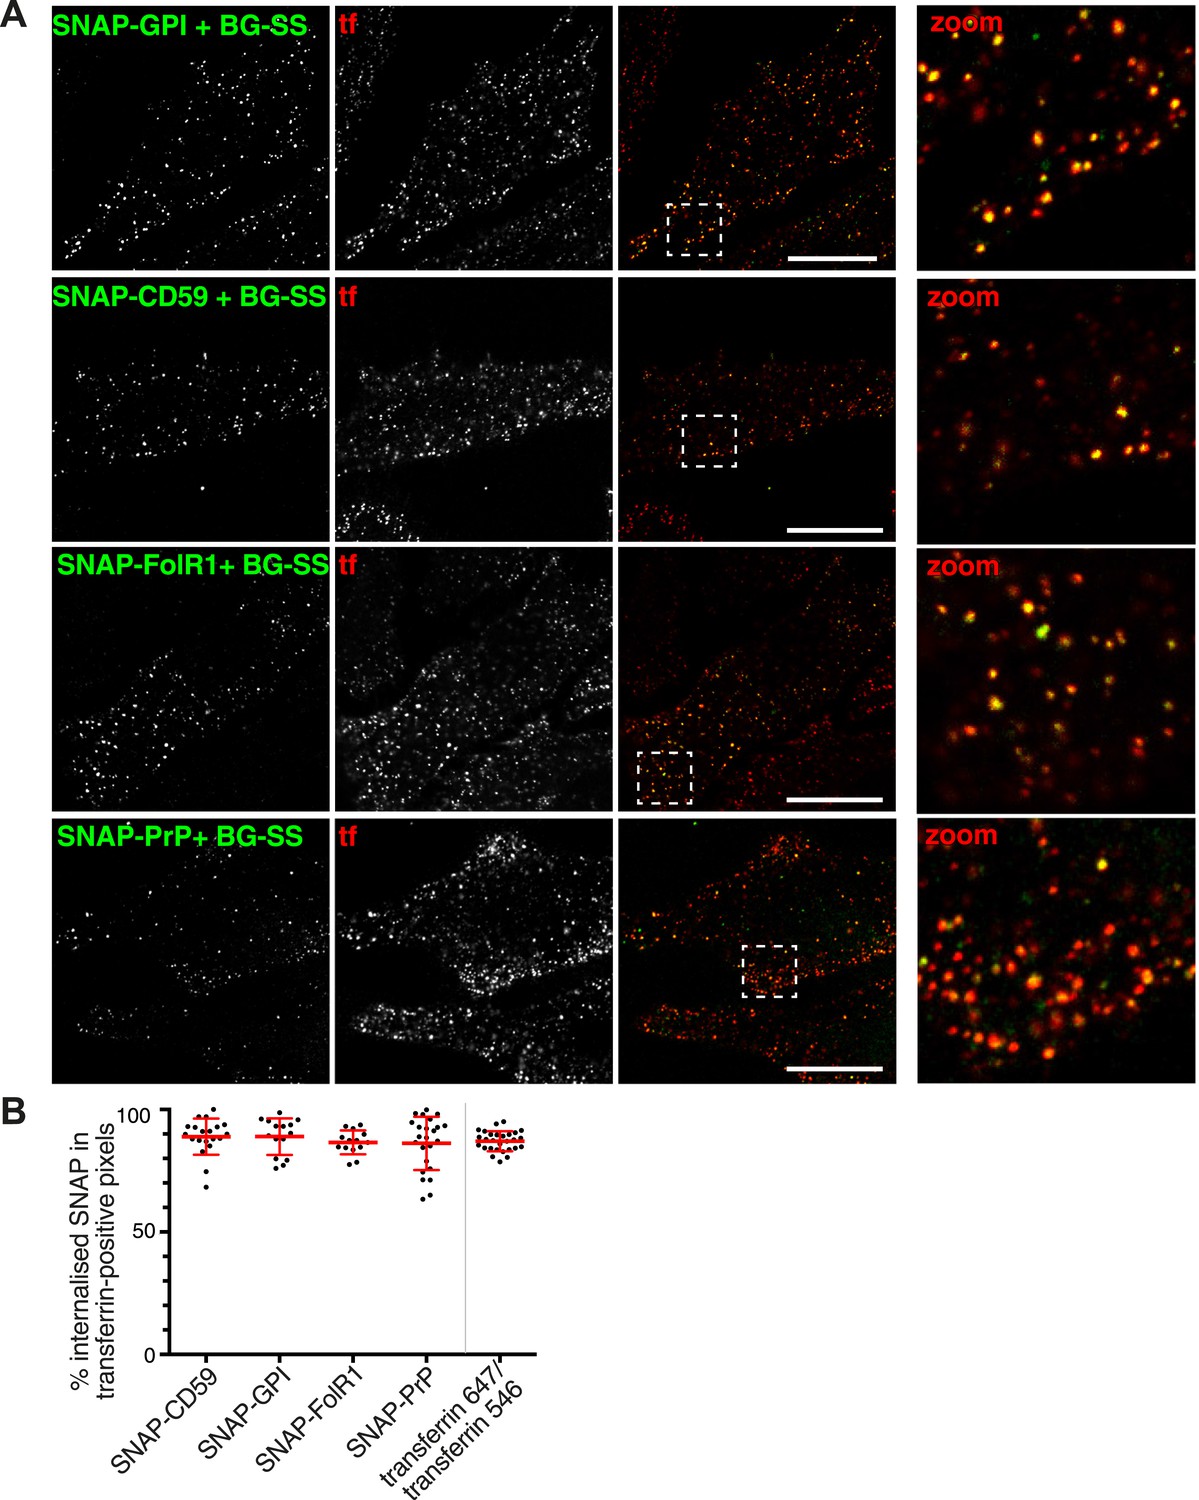
GPI-anchored proteins co-localise with transferrin in primary endocytic vesicles.
(A) Confocal images of cells transfected with the SNAP-tagged GPI-anchored proteins indicated. Labelling with BG-SS-488 and transferrin-546 at 37°C for 90 s. External 488 fluorophore was removed by reduction with MESNa. Right hand panels are zoomed views of the regions indicated, bars are 10 μm. (B) Quantification of co-localisation between internalised GPI-anchored proteins revealed with BG-SS-488 and MESNa as in A, and transferrin-546. In order to provide an empirical estimate of the sensitivity of quantification, two fluorescently labelled transferrin probes were mixed and added to the cells. Bars are mean and SD.
Figure 5—figure supplement 1
Effect of CTB-binding on transferrin intensities in endocytic vesicles defined by uptake of GPI-linked protein.
Analysis of the transferrin cargo load of endocytic vesicle objects identified as in Figure 3A after 90 s of uptake in control and CTB-labeled cells as shown. Cells were stably expressing SNAP-CD59, endocytic vesicles were defined by BG-SS-488 labelling and MESNa treatment. Frequency distribution of transferrin intensities for the same vesicles after offsetting the transferrin channel by 500 nm provides a set of background intensities, shown as a black line and not plotted to the same y-axis scale. Cut-off is shown as a dotted line and corresponds to the 95 percentile for the offset values. The proportion of vesicles that are potentially transferrin-negative (the fraction below the dotted line) is not altered by CTB-binding.
Figure 6 with 1 supplement

Clathrin-dependent endocytosis of GPI-anchored proteins.
(A) Doubly labelled anti-CD59-546-SS-488 allows comparison of MESNa reduction and PI-PLC treatment as methods for detecting internalised GPI-anchored protein. Cells were labelled at 4°C, warmed to 37°C for 90 s, and treated consecutively with MESNa and PI-PLC. Circles indicated antibody-positive puncta that appear internalised, but are demonstrated to be extracellular by the absence of MESNa-protected 488 fluorophore. Bar is 10 μm. (B) Internalisation of BG-SS-549 and transferrin-647, for 15 min, in cells stably expressing SNAP-CD59 and transiently transfected with AP180C-IRES-GFP. Internalised BG-SS-549 was detected after MESNa treatment and wash at pH3.0 to remove external transferrin. Transfected cells are outlined in white. Bars are 10 μm. (C) Internalisation of BG-SS-488 and transferrin-647, for 15 min, in cells stably expressing SNAP-CD59 and transiently transfected with dynamin-2-K44A-dsRed. Internalised BG-SS-488 was detected by MESNa treatment, a wash at pH3.0 removed external transferrin. Transfected cells are outlined in white. Bars are 10 μm. (D) Quantification of SNAP-CD59 and transferrin endocytosis in cells expressing AP180C-IRES-GFP as A. Each point is mean fluorescence intensity of one cell region, after background subtraction. Background was determined empirically from control experiments with only labelling at 4°C. Values are all normalised so mean of control = 1. Bars mean and SEM, data are all from one experiment, the experiment was repeated three times. (E) Quantification is for cells expressing dynamin-2-K44A-dsRed as shown in C. See D for details.
Figure 6—figure supplement 1
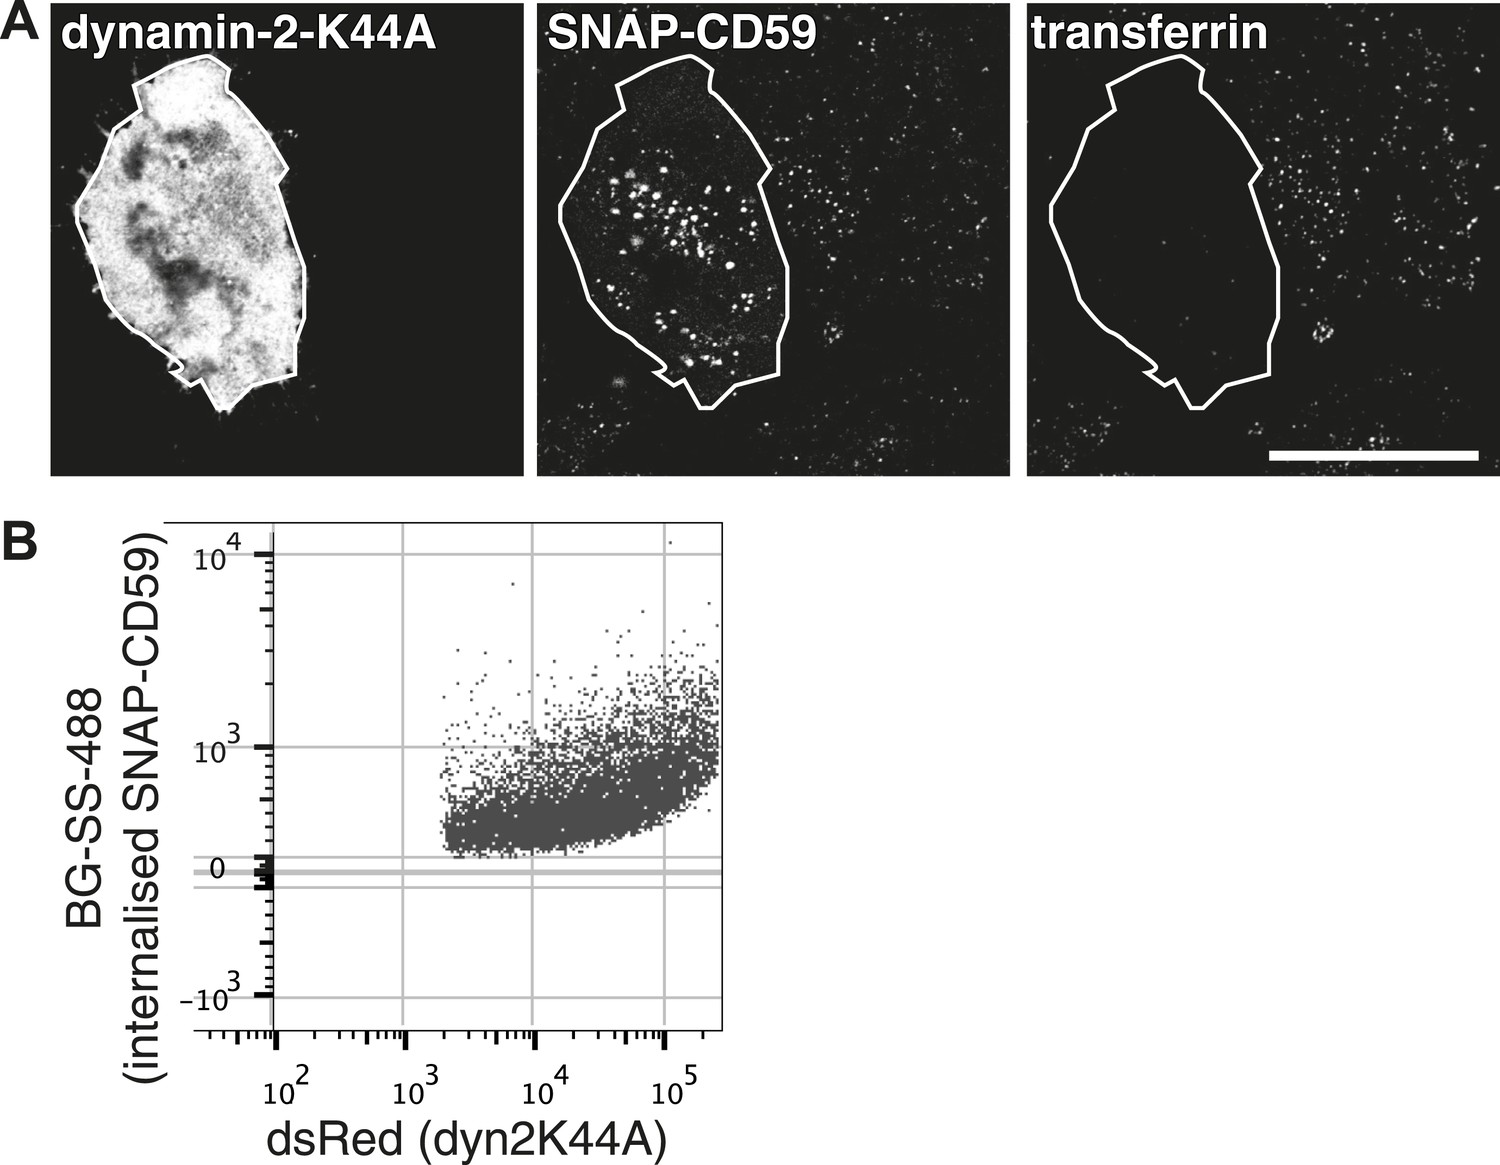
Endocytic structures induced by high dynamin-2-K44A expression.
(A) Hela cells stably expressing SNAP-CD59 and transiently transfected with dynamin-2-K44A-dsRed were labeled with BG-SS-488 and transferrin-647 for 15 min at 37°C. Note that the cell shown has a very high level of dynamin-2-K44A expression, and this has induced abundant macropinosomes that are clearly larger than the normal endosomes in neighbouring cells. This is an extreme illustrative example. (B) Flow cytometry measuring internalisation of SNAP-CD59 in the population of cells transfected with dynamin-2-K44A-dsRed as in A. Note that as the expression of dynamin-2-K44A increases, SNAP-CD59 actually also goes up (Figure 6E).
Figure 7 with 1 supplement
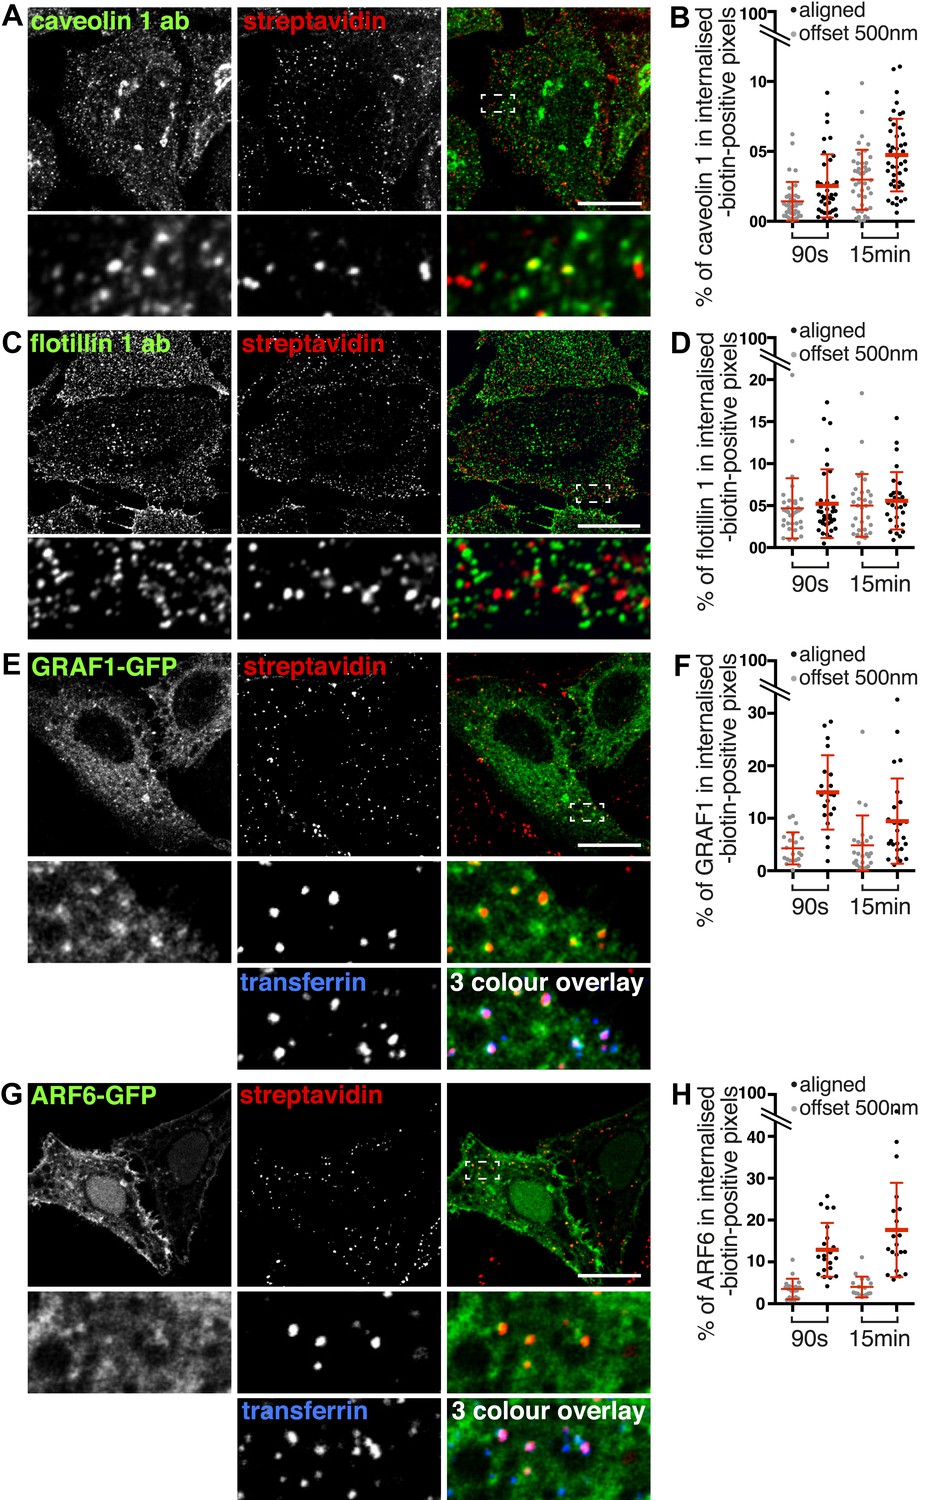
Labelling of the total population of endocytosed proteins does not provide evidence for significant protein flux through clathrin-independent pathways.
(A, C, E, G) Confocal images showing distribution of the marker indicated (caveolin 1, flotillin 1, GRAF1, ARF6), together with total internalised protein after 90 s of endocytosis, revealed as in Figure 1D. In the case of GRAF1 and ARF6, additional images showing co-internalised transferrin are also shown. Bars are all 10 μm. (B, D, F, H) Quantification of co-localisation between the markers caveolin 1, flotillin 1, GRAF 1 and ARF6, and internalised protein labelled with sulfo-NHS-SS-biotin and MESNa treatment. Internalisation was for 90 s or 15 min. In order to establish empirically the degree of overlap between internalised protein and relevant marker expected by chance, quantification was carried out both with the images in the correct register, and also with one channel manually offset approximately 500 nm from the other. Bars are mean and SD, each point is one cell region.
Figure 7—figure supplement 1
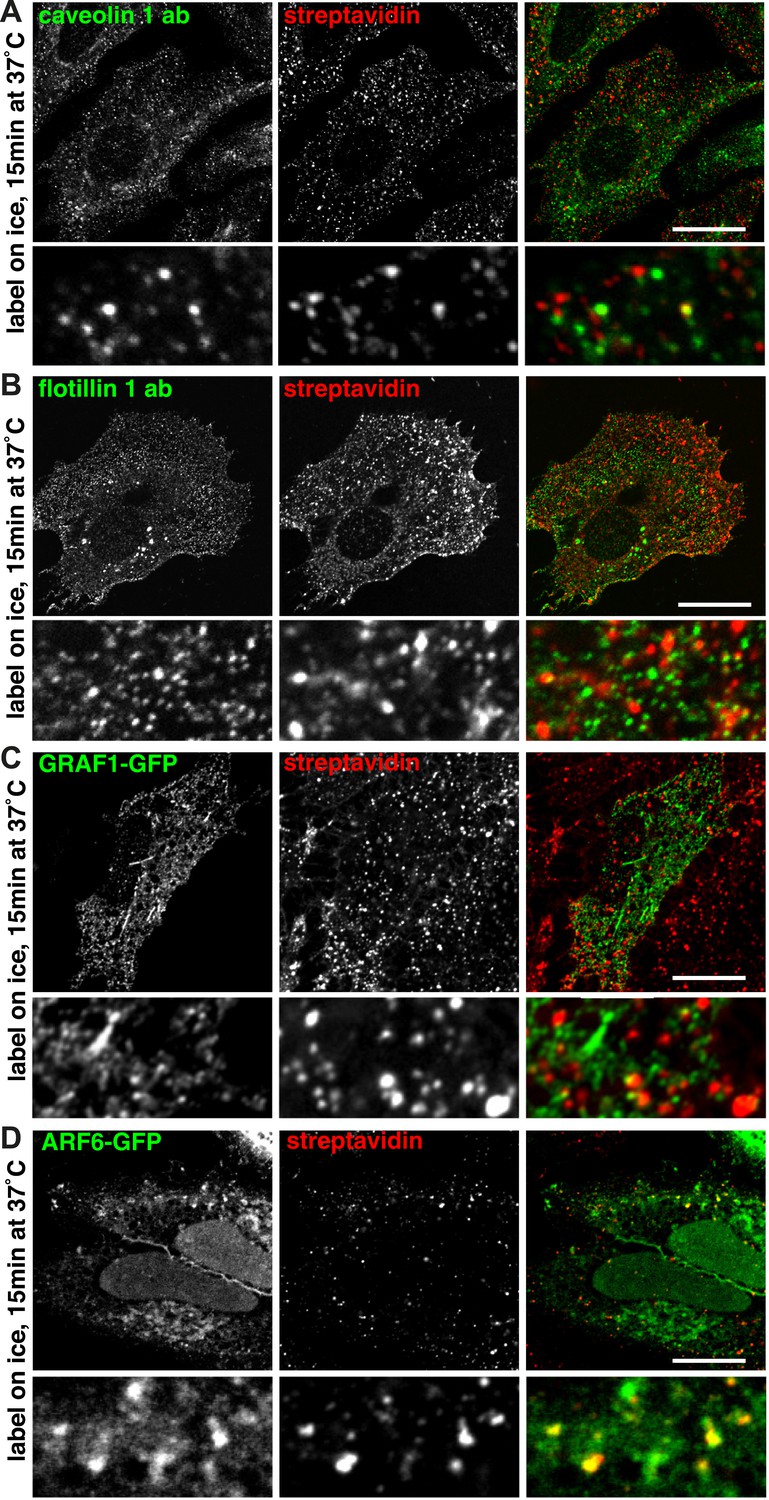
Labelling of the total population of endocytosed proteins does not provide evidence for significant protein flux through clathrin-independent endocytic pathways.
(A, B, C, D) Confocal images showing distribution of the marker indicated (caveolin 1, flotillin 1, GRAF1, ARF6), together with internalised biotinylated protein after 15 min of endocytosis. Labelling was done as in Figure 1D. This is the same experiment as shown in Figure 7, but a longer time-point.
Figure 8 with 2 supplements
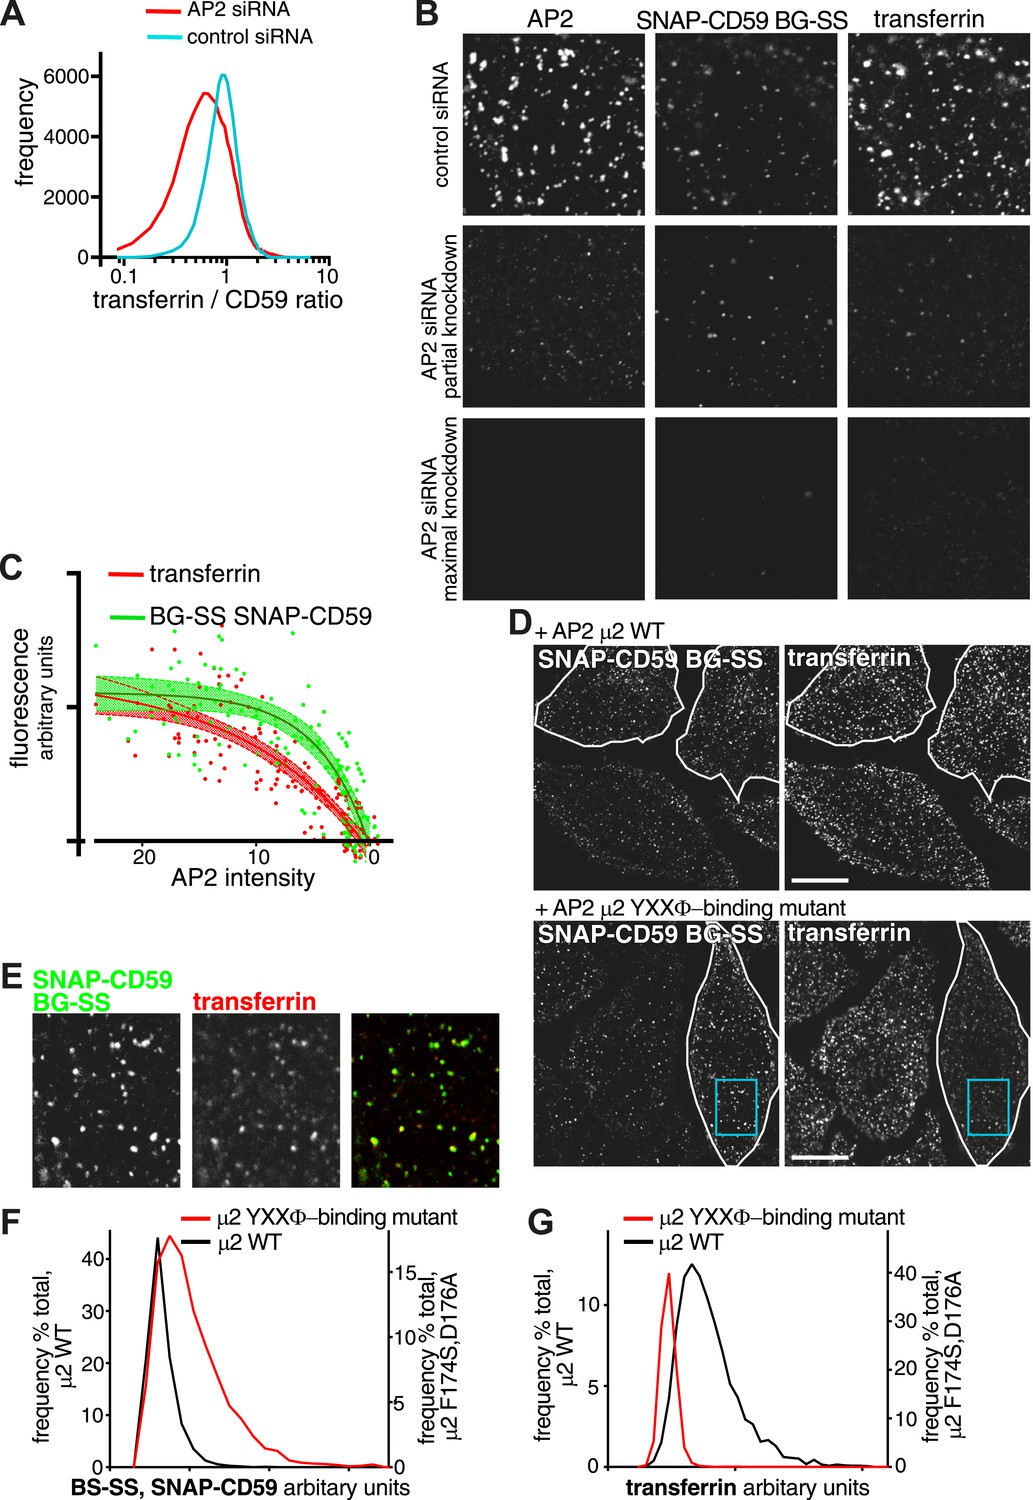
Differential effects on uptake of transferrin receptor and GPI-anchored proteins via coated pits.
(A) Frequency distribution of the ratio between internalised transferrin and internalised SNAP-CD59 in individual HeLa cells, determined by flow cytometry as in Figure 8—figure supplement 1. (B) AP-2 knockdown can affect endocytosis of clathrin coated vesicle cargo proteins differentially. HeLa cells stably expressing SNAP-CD59 were transfected with AP2 siRNA and assayed at various timepoints up to 72 hr after transfection. Uptake of BG-SS-488 and transferrin-546 was for 15 min. Cells were MESNa treated, acid washed, fixed and stained with anti-alpha-adaptin. Top row; AP2 levels appear normal. Second row; AP2 levels are intermediate, transferrin uptake is blocked while SNAP-CD59 uptake is less severely inhibited. Third row; AP2 levels are very low and uptake of both SNAP-CD59 and transferrin is blocked. (C) Correlation of the amount of internalised transferrin and SNAP-CD59 with the amount of AP-2 present in each cell from the above experiment. Data were fit to a simple one-phase association. Shaded area around the curve fitted corresponds to 95% CI. (D) HeLa cells stably expressing SNAP-CD59 were transfected with µ2-IRES-GFP or µ2(F174S/D176A)-IRES-GFP. After 4 days, cells were incubated at 37°C for 150 s with transferrin-647 and BG-SS-546. The white lines outline transfected cells. The blue box highlights a region shown in E. Bars 20 μm. (E) Co-localisation between internalised SNAP-CD59 and transferrin in a cell expressing µ2(F174S/D176A)-IRES-GFP. (F) Frequency distribution of CD59 cargo load within individual vesicles. Cells were labelled as in D. Vesicles were identified as objects in 3D reconstructions from confocal images with Imaris software using the transferrin signal. (G) As F, but displaying transferrin cargo load in the same population of vesicles.
Figure 8—figure supplement 1
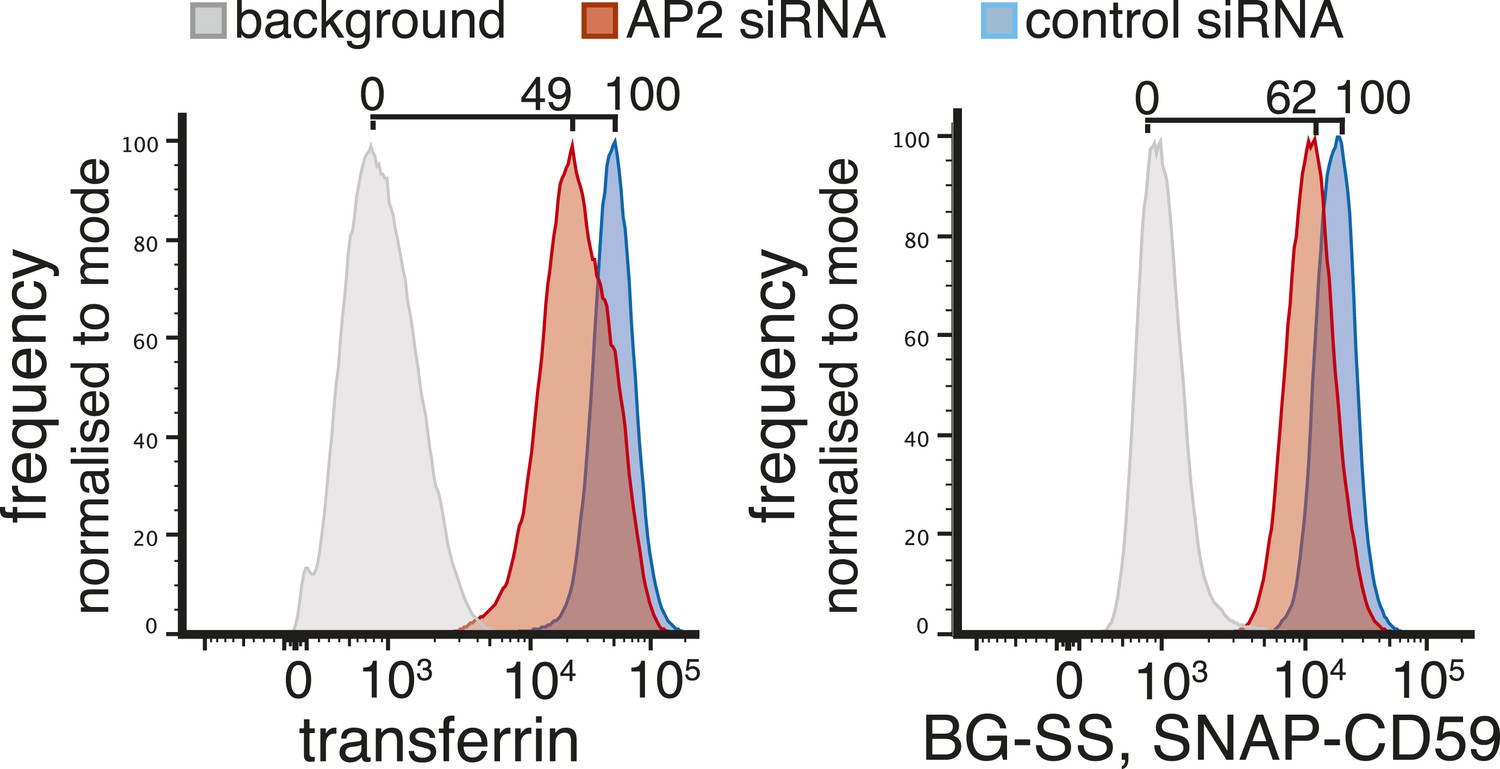
Reduction of AP-2 (alpha adaptin) levels affects the amount of uptake of both transferrin and SNAP-CD59, 50 hr after siRNA transfection.
Cells stably expressing SNAP-CD59 were incubated at 37°C for 15 min with BG-SS-549 and transferrin-647. Surface label was removed with MESNa and acid wash and then the cells were analysed by flow cytometry.
Figure 8—figure supplement 2
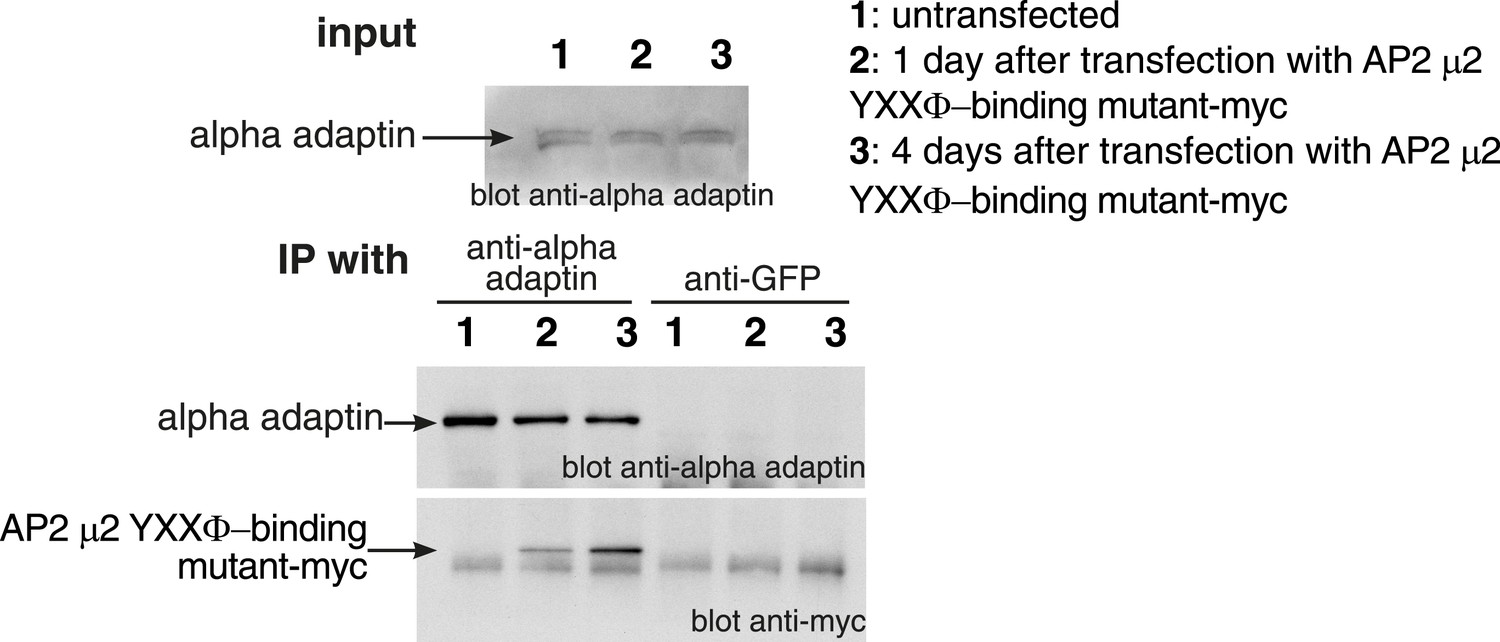
Incorporation of mutant μ2 subunits into AP2 complexes.
Cells were transfected with plasmids expressing the μ2 YXXΦ-binding mutant-myc as shown. Cell lysates were subjected to immunoprecipitation with anti-alpha adaptin, or as a negative control anti-GFP antibodies. Immunoprecipitates were analysed by Western blotting with anti-alpha adaptin and anti-myc antibodies.
Videos
Video 1
Object recognition for quantification of cargo load in individual endocytic vesicles.
Cells were labelled for 90 s at 37°C with sulfo-NHS-SS-biotin and transferrin-546. After MESNA treatment internalised proteins were labelled with streptavidin-488. 3D reconstructions were obtained from confocal z-stacks of whole cell volumes. Streptavidin channel (green), transferrin channel (red), an overlay of both channels, and then the same overlay with objects recognised as vesicles superimposed in blue, are shown consecutively.
Download links
A two-part list of links to download the article, or parts of the article, in various formats.
Downloads (link to download the article as PDF)
Open citations (links to open the citations from this article in various online reference manager services)
Cite this article (links to download the citations from this article in formats compatible with various reference manager tools)
Clathrin-independent pathways do not contribute significantly to endocytic flux
eLife 3:e03970.
https://doi.org/10.7554/eLife.03970


