Early intrinsic hyperexcitability does not contribute to motoneuron degeneration in amyotrophic lateral sclerosis
- Paris Descartes University, France
Figures
Figure 1 with 1 supplement
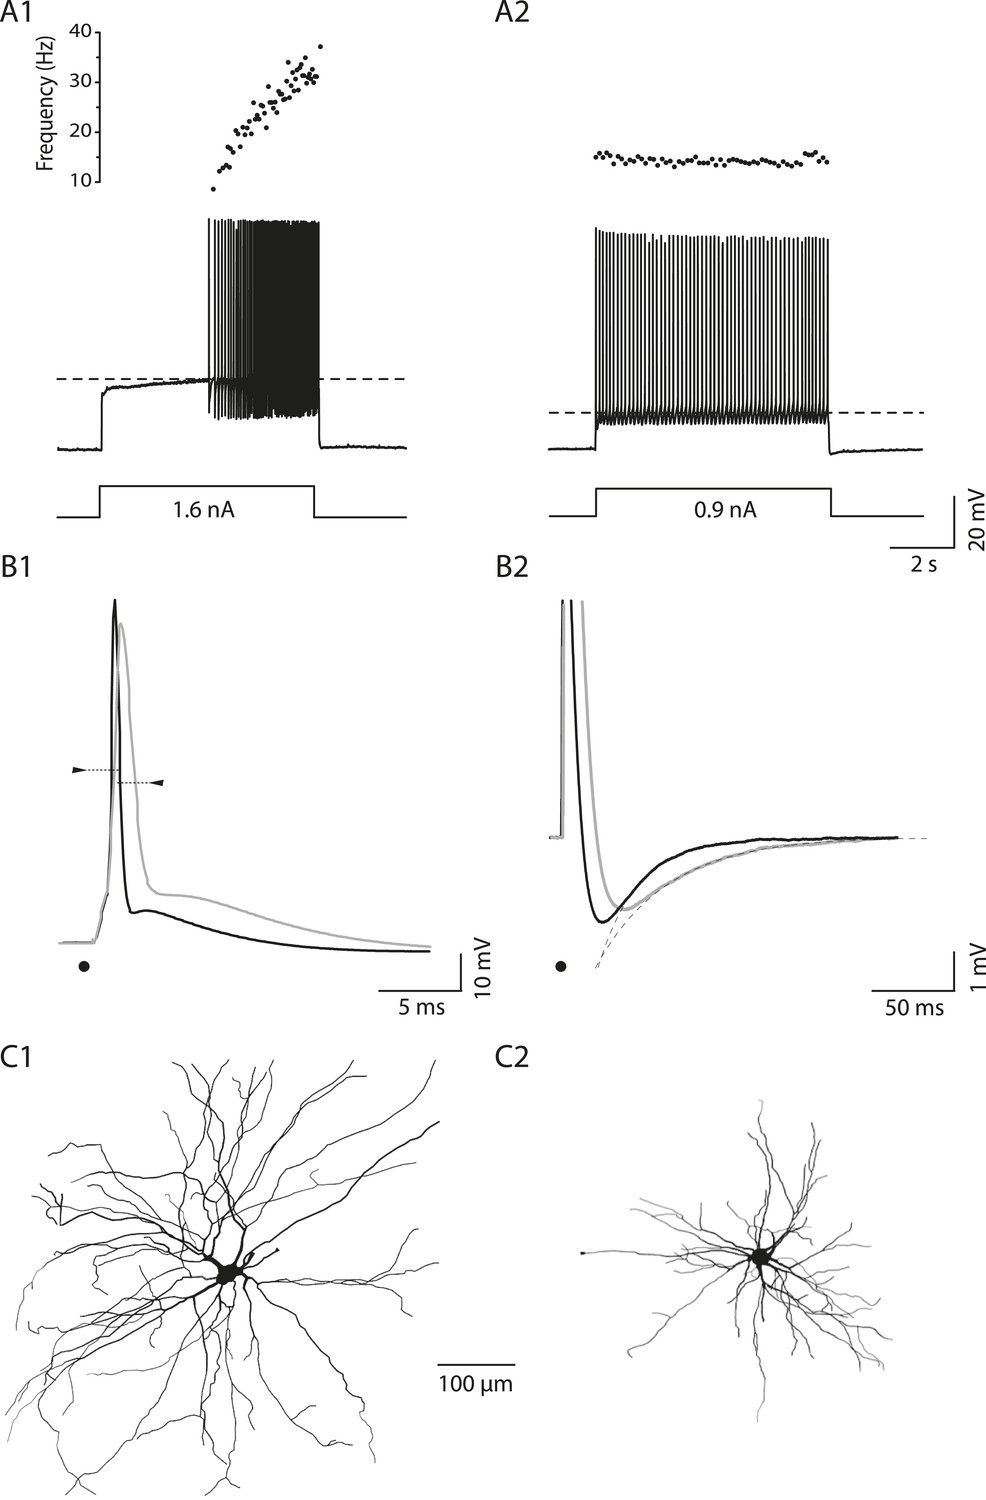
Electrical and morphological properties of motoneurons displaying the delayed and the immediate firing patterns.
(A1) WT motoneuron displaying the delayed firing pattern in response to a 5 s pulse. The current intensity was the minimal intensity necessary to elicit firing in our searching protocol (rheobase). Bottom: injected-current (square pulses), middle: voltage-response and top: instantaneous firing frequency. The horizontal dashed line shows the voltage threshold for spiking (−50 mV). (A2) Response of a WT motoneuron displaying the immediate firing pattern. Same arrangement as in A1. (Voltage threshold for spiking: −59 mV). (B1) Single action potentials from a delayed (black line) and an immediate (gray line) firing WT motoneurons elicited by a short square pulse of current. The arrowheads point to the horizontal dotted bar drawn at half action potential amplitudes. (B2) Same records at a longer time base in order to show the after hyperpolarisation (AHP). Dashed lines are the exponential fits of the AHP relaxation. The relaxation time constants are 17 ms and 37 ms for the delayed firing and the immediate firing motoneurons, respectively. Note that the relaxation time constant is longer in the immediate firing motoneuron than in the delayed firing one. C Reconstructed dendritic trees of WT delayed (C1) and immediate (C2) firing motoneurons. The axon was not reconstructed in either case. Reconstructions are projected in the same plane as the slice.
Figure 1—figure supplement 1
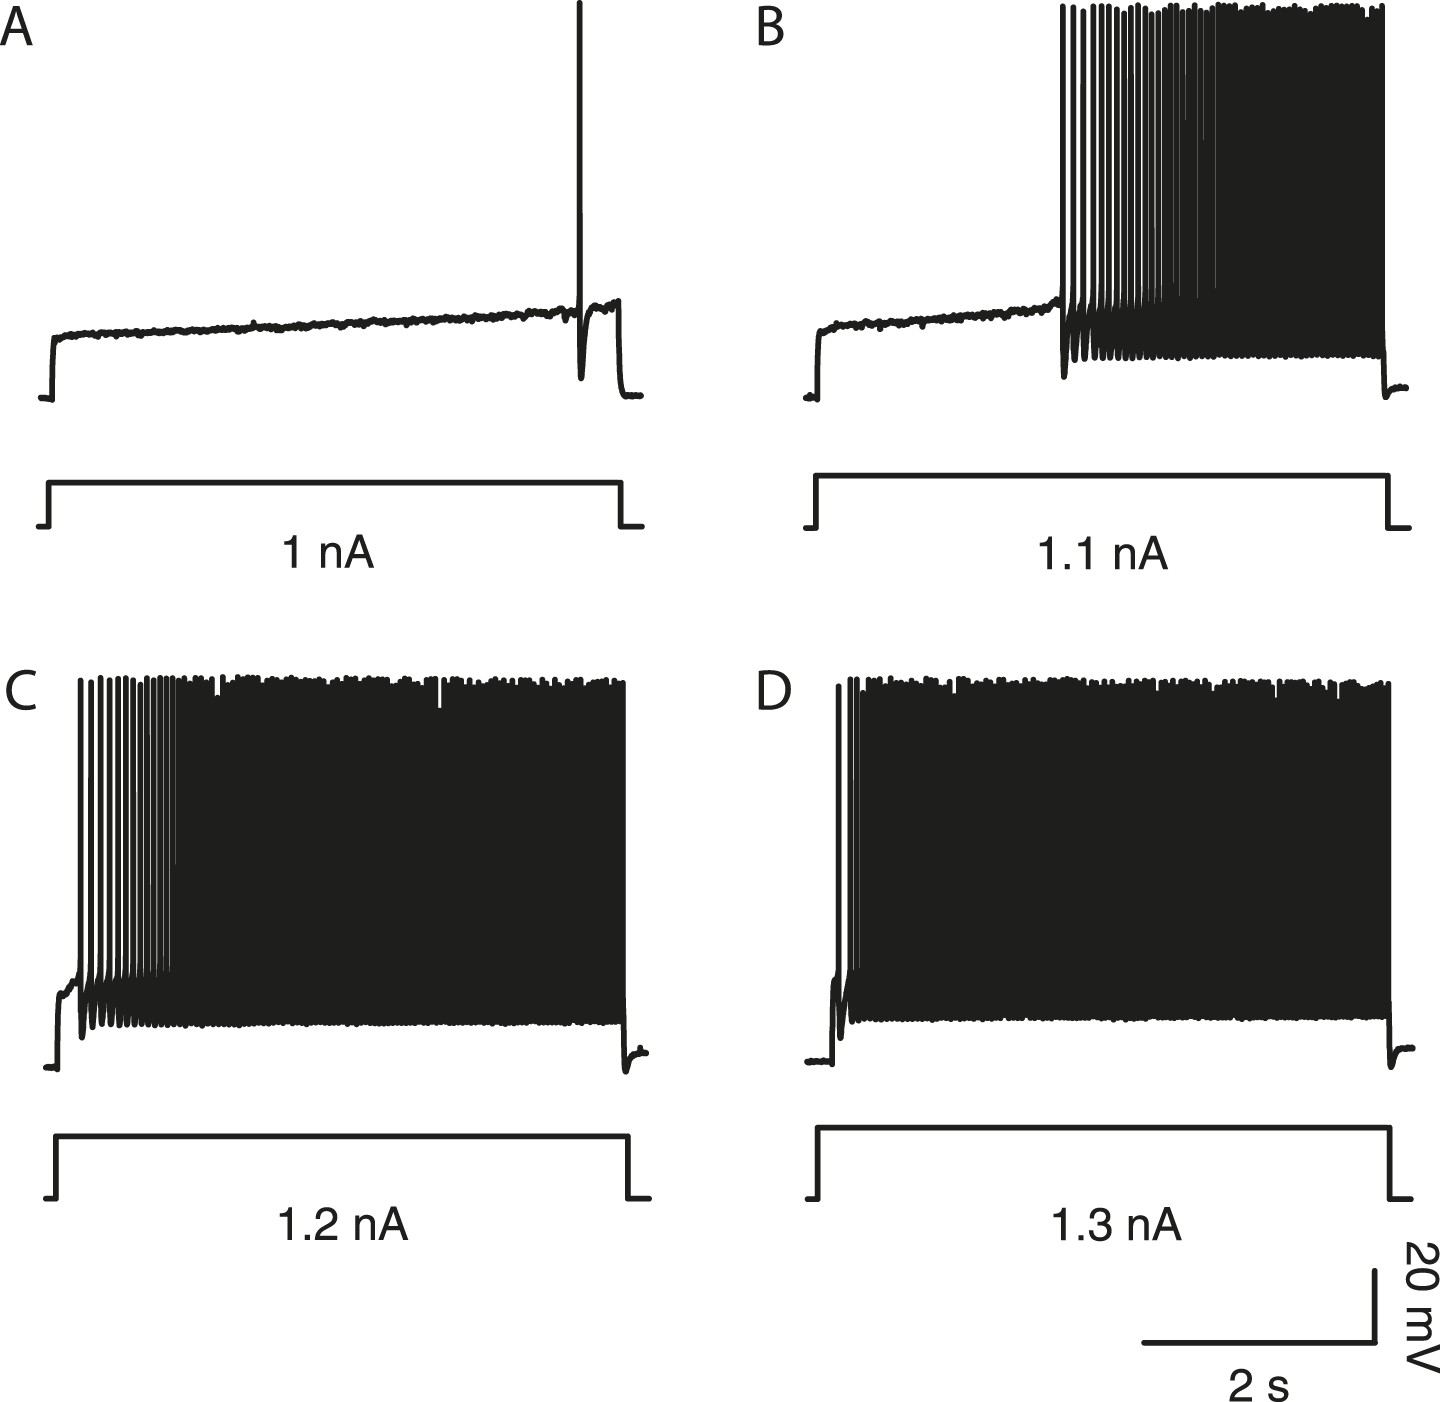
In delayed firing motoneurons, the delay depends on the intensity of stimulation.
(A–D) Responses of a delayed firing motoneuron to long lasting pulses (5 s) of increasing amplitude. Bottom: injected-current (square pulses in nA). Top: voltage-response (in mV). Note that the delay decreased when the current intensity increased.
Figure 2
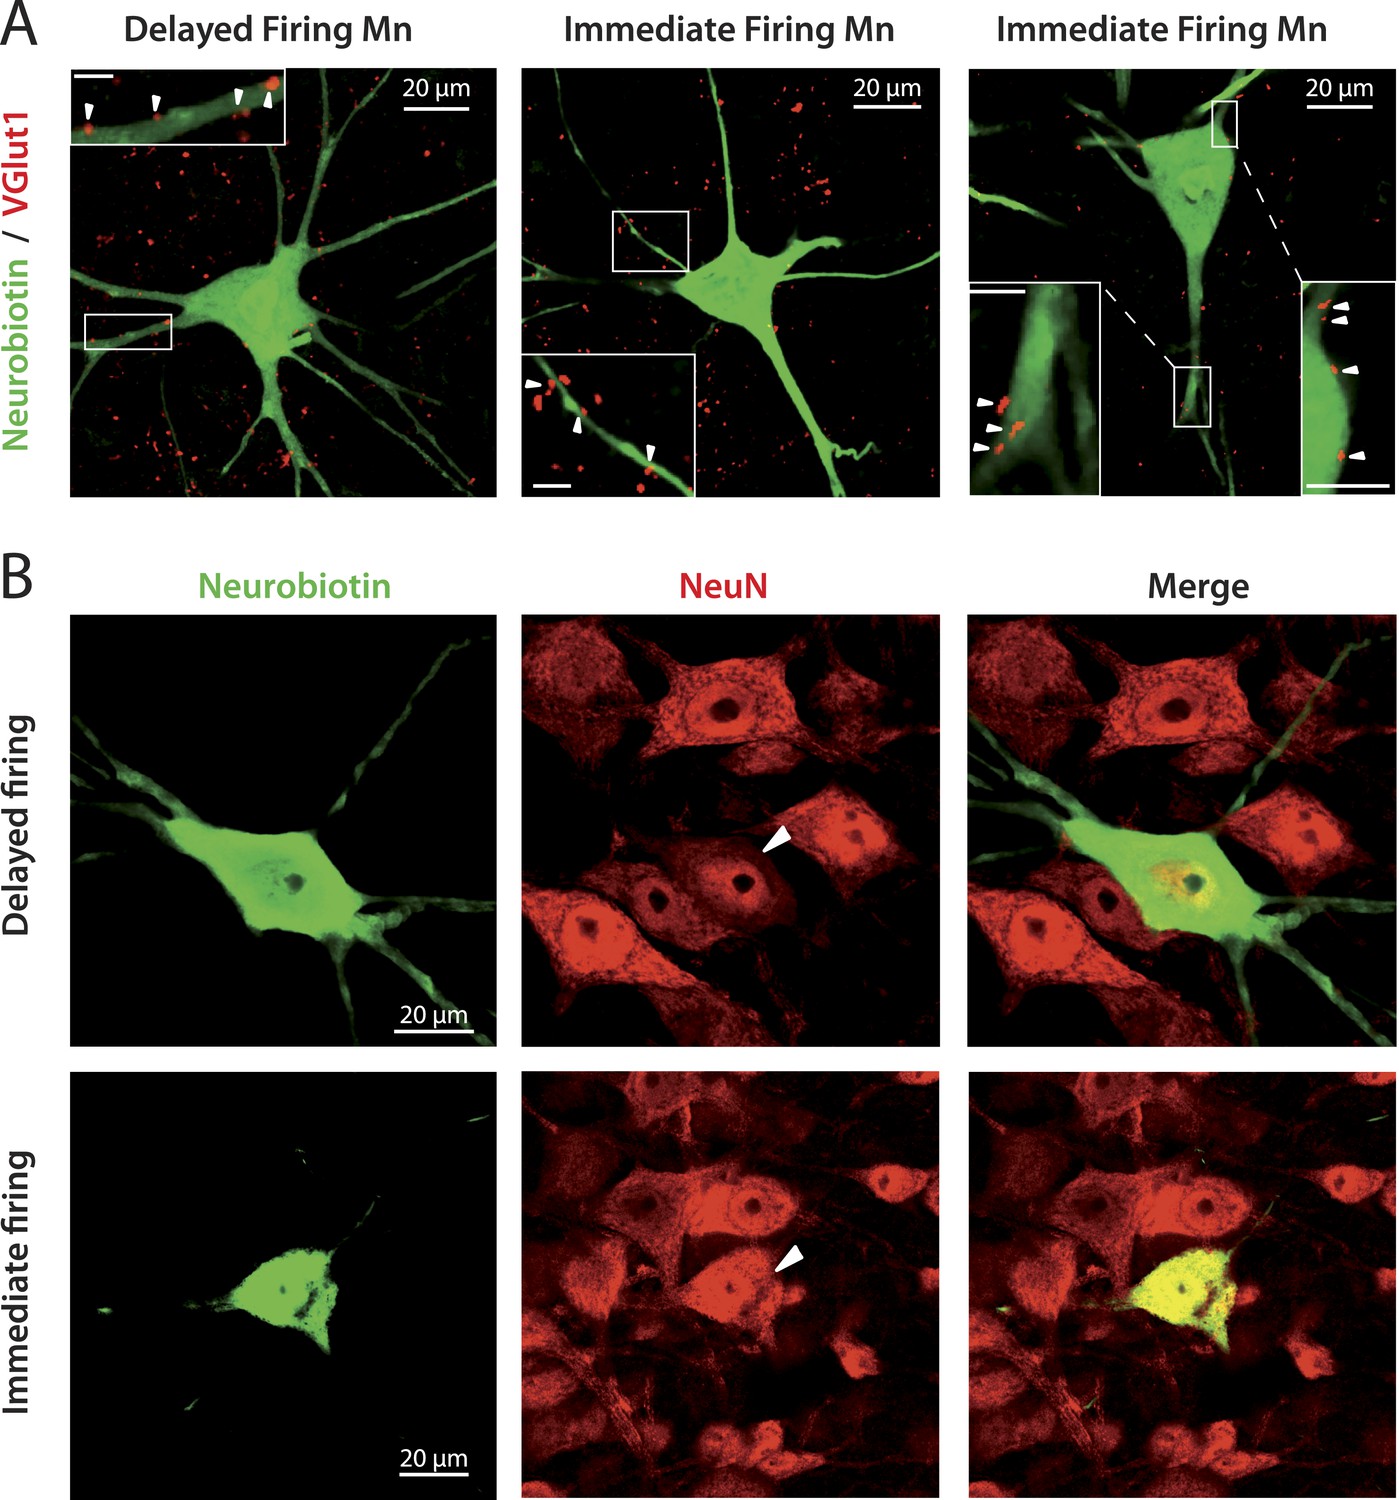
immediate and delayed firing motoneurons both receive VGlut1 inputs and express NeuN.
(A) Vglut1 (red) synaptic inputs are apposed to neurobiotin (green) filled motoneurons (examples of appositions pointed by arrowheads in the inserts that show enlargements of the areas surrounded by rectangles). The bar scale in all insets is 5 μm. (B) NeuN staining (red) of neurobiotin (green) filled motoneurons. The arrowheads point to the cell bodies of the motoneurons that have been intracellularly filled during the electrophysiological experiment.
Figure 3
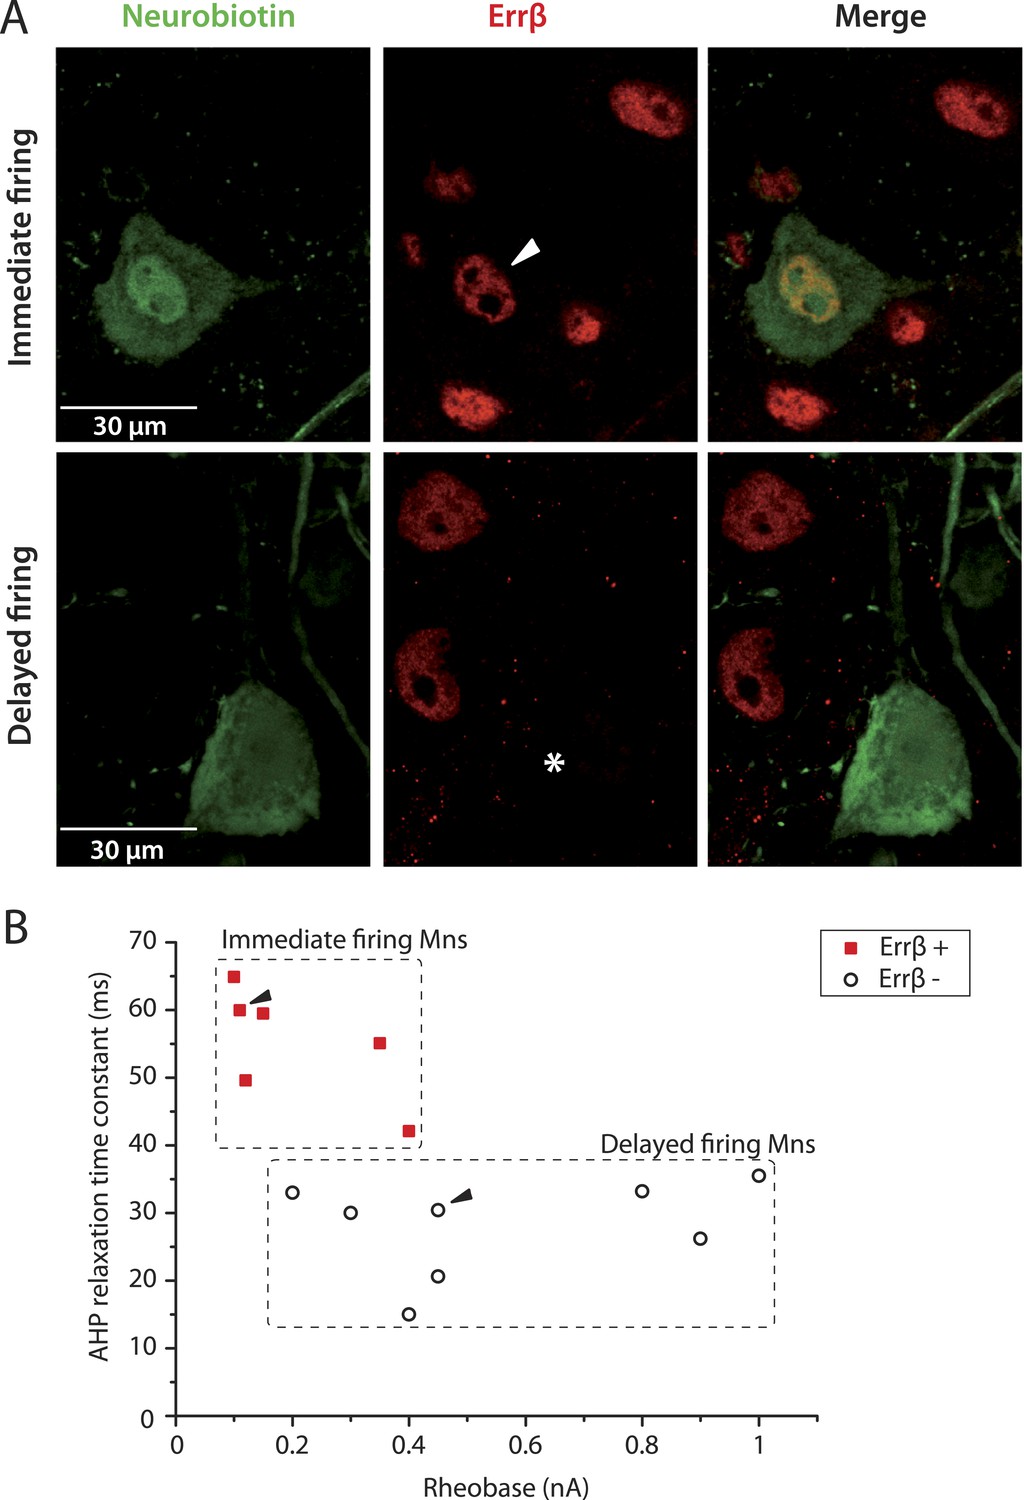
Immediate firing motoneurons, but not delayed firing motoneurons, express ERRβ.
(A) Examples of Errβ. staining (red) in neurobiotin (green) filled motoneurons. The arrowhead in the first row points to the nucleus (Errβ−positive) of the recorded motoneuron. The asterisk in the second row indicates that the nucleus of the recorded motoneuron was Errβ−negative. (B) Plot of the AHP relaxation time constants against the rheobases for labelled motoneurons. All immediate firing motoneurons were Errβ−positive whereas all delayed firing motoneurons were Errβ−negative. Arrowheads point to the motoneurons illustrated in A.
Figure 4
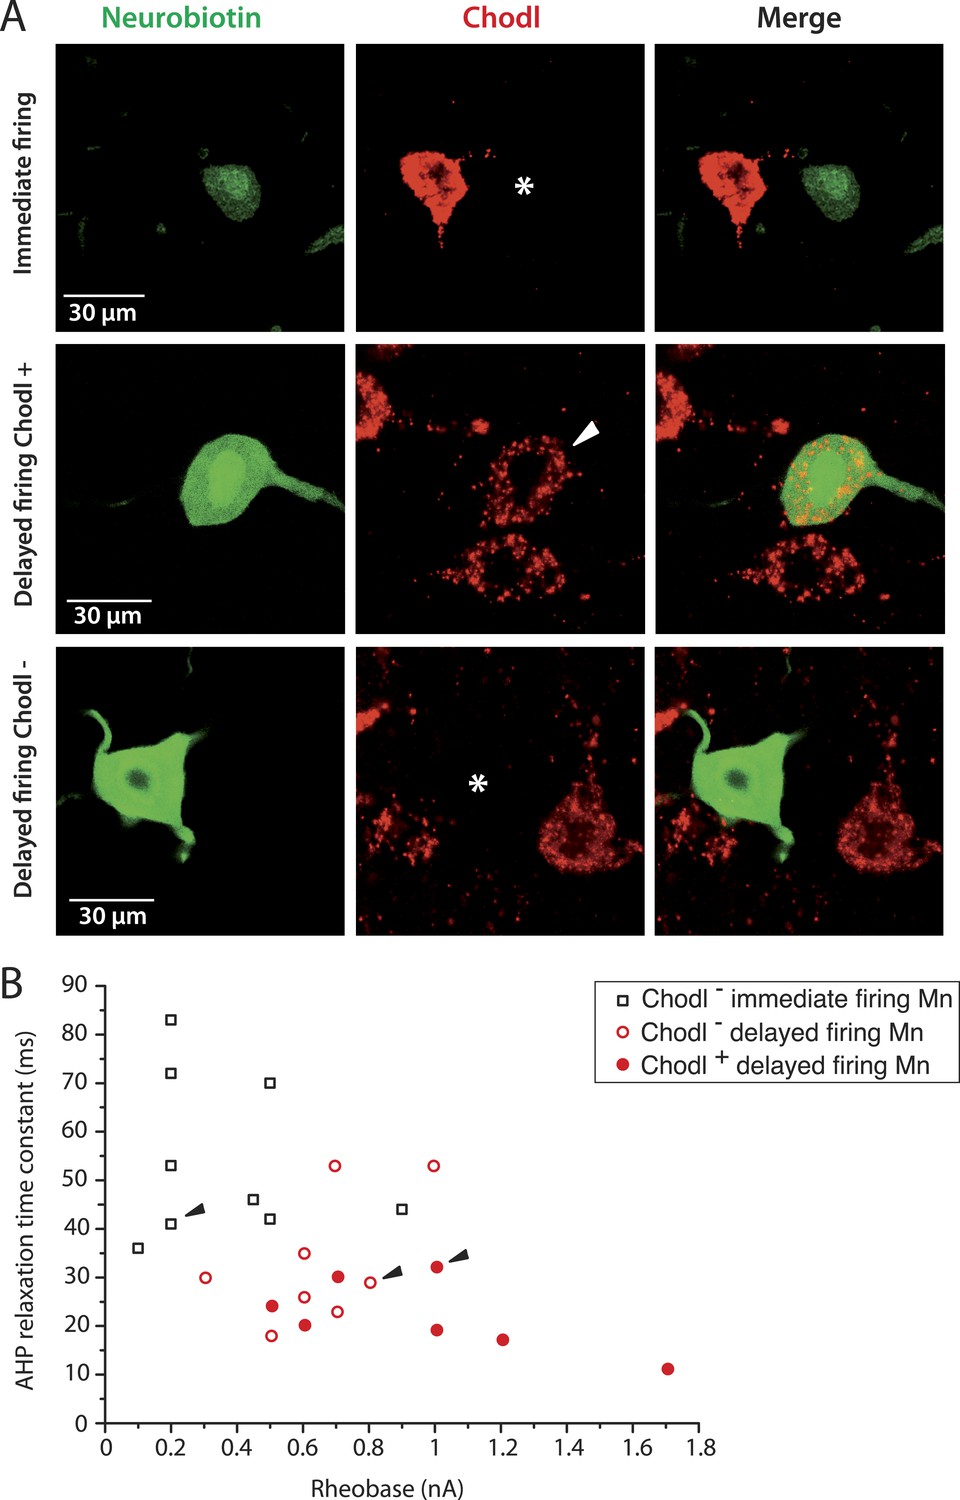
The largest delayed firing motoneurons express chondrolectin mRNA contrary to immediate firing motoneurons.
(A) Examples of chondrolectin in situ hybridizations (red) in neurobiotin filled motoneurons (green). The asterisks in the first and third rows indicate that the cell body of the recorded motoneuron was chondrolectin negative. The arrowhead in the second row indicates that chondrolectin is expressed in this delayed firing motoneuron. (B) Plot of the AHP relaxation time constants against the rheobase for the investigated motoneurons. About half of the delayed firing motoneurons (the ones that display the highest rheobase) were chondrolectin-positive. All the immediate firing motoneurons were chondrolectin-negative. Arrowheads point to the motoneurons illustrated in A.
Figure 5
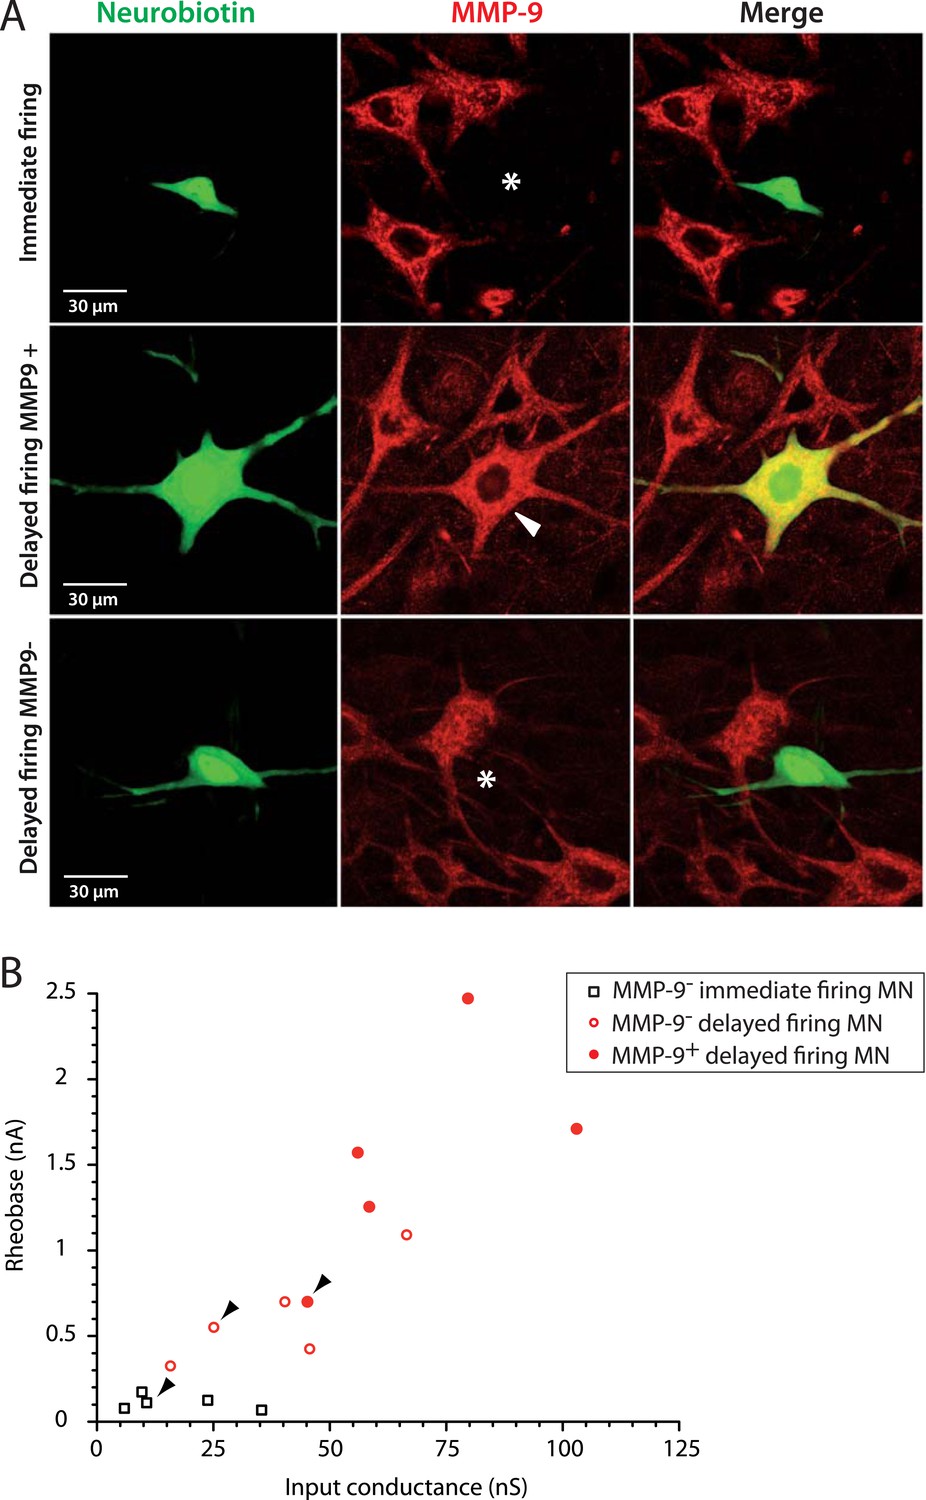
The largest delayed firing motoneurons express MMP9 contrary to immediate firing motoneurons.
(A) Examples of MMP9 labelling in neurobiotin filled motoneurons (green). The asterisks in the first and third rows indicate the cell body of the recorded motoneurons devoid of MMP9 expression. The arrowhead in the second row indicates that MMP9 was expressed in this delayed firing motoneuron. (B) Plot of the rheobase against the input conductance for the investigated motoneurons. Half of the delayed firing motoneurons (the ones that display the highest rheobases and input conductances) were MMP9-positive. All the immediate firing motoneurons were MMP9-negative. Arrowheads point to the motoneurons illustrated in A.
Figure 6
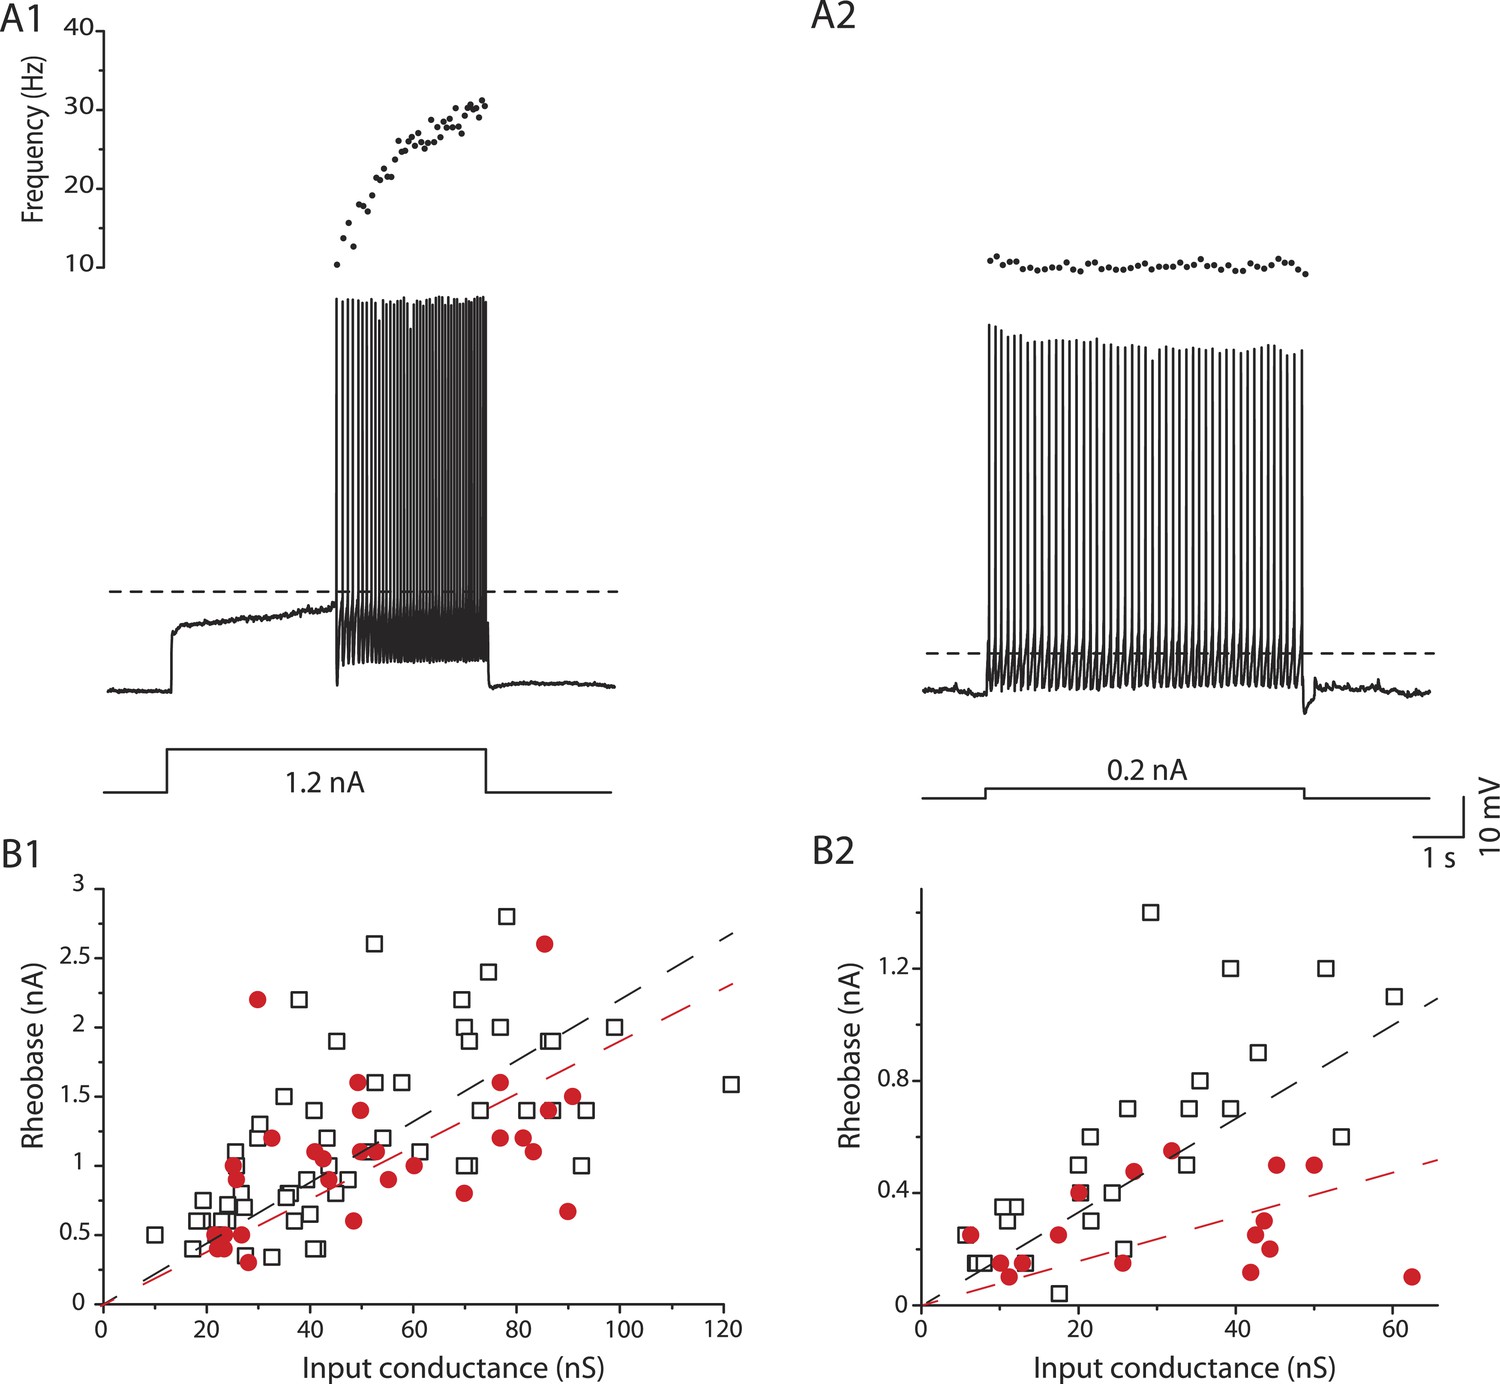
mSOD1 immediate firing motoneurons are selectively hyperexcitable.
(A1-2) mSOD1 motoneurons displaying the delayed firing pattern (A1) and the immediate firing pattern (A2). The current intensity was the minimal intensity necessary to elicit firing (rheobase). Bottom: injected-current (square pulses), middle: voltage-response and top: instantaneous firing frequency. The horizontal dashed line shows the voltage threshold for spiking (−37 mV for the delayed firing motoneuron and −48 mV for the immediate firing motoneuron). (B1-2) Plot of rheobase as a function of input conductance for delayed (B1) and immediate (B2) firing motoneurons. In each plot, open squares are for WT motoneurons whereas red dots are for mSOD1 motoneurons. Linear regressions are indicated by dashed lines.
Figure 7 with 1 supplement
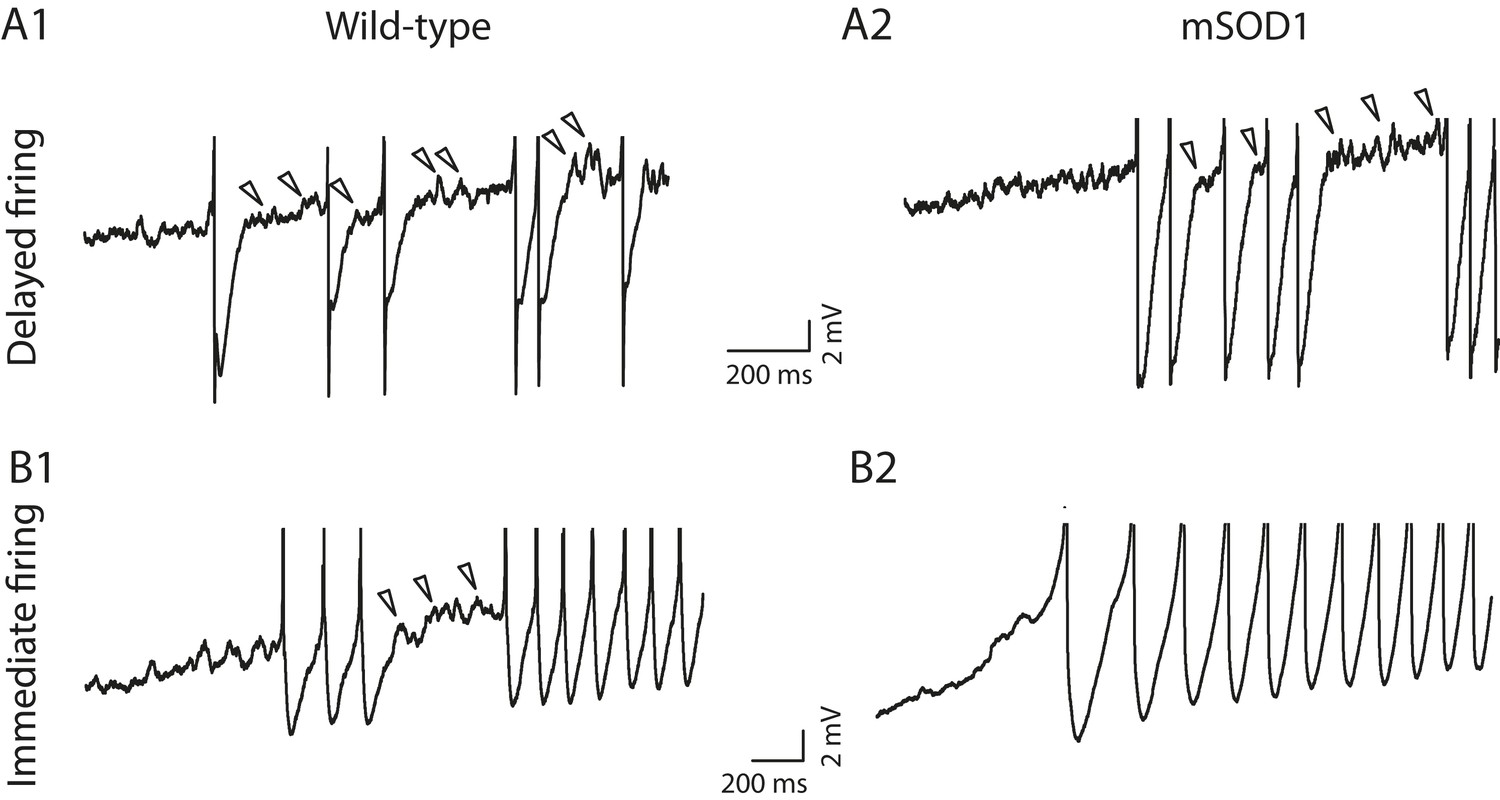
Absence of mixed mode oscillations in mSOD1 immediate firing motoneurons.
Beginning of the discharge during the injection of slow triangular ramp of current at 0.1 nA/s velocity. See Figure 7—figure supplement 1 for the full traces and F–I curves. Arrowheads point to oscillations between full spikes, the signature of mixed mode oscillations. Note that there is no oscillations between spikes in the mSOD1 immediate firing motoneuron (B2).
Figure 7—figure supplement 1
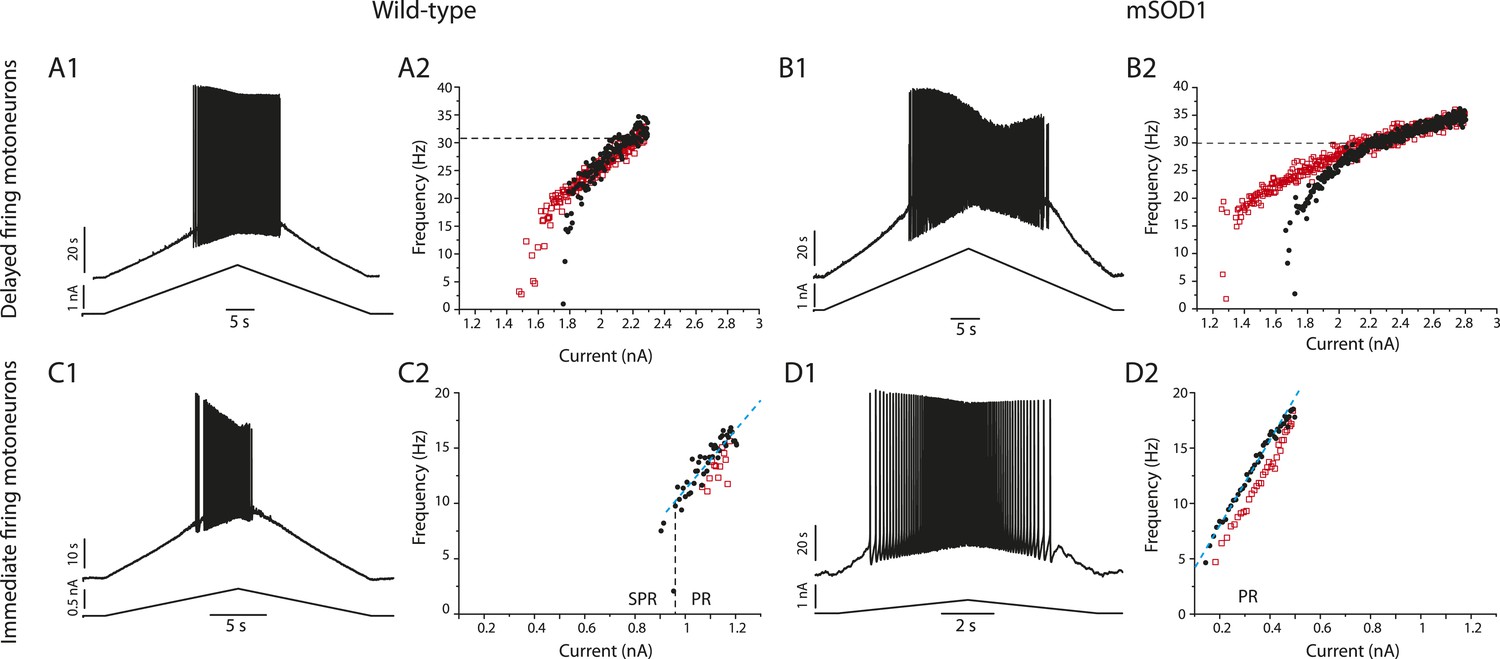
Responses of a delayed firing motoneuron (upper row) and of an immediate firing motoneuron (lower row) to a slow current ramp.
Same motoneurons as in Figure 7. (A1–A2) WT delayed firing motoneuron. (A1) Bottom: injected-current (slow triangular ramp at the 0.1 nA/s velocity) and top: voltage-response. (A2) F–I curves for the ascending (black dots) and descending ramps (red squares). Note that the recrutement current occurs at higher intensity than the de-recruitment current. (B1–B2) mSOD1 delayed firing motoneuron. In A2 and B2 the dashed horizontal line points to the frequency reached during the ascending phase (black dots) 0.5 s after the motoneuron has started to discharge. These frequencies are 28 Hz for the WT delayed firing motoneuron in A2 and 30 Hz for the mSOD1 delayed firing motoneuron in B2. (C1–C2) WT immediate firing motoneuron. The vertical dashed line is the separation between the subprimary range in which MMOs are present and the primary range (PR) in which MMOs are absent during the ascending ramp. The oblique blue dashed line is the linear regression in the primary range. Its slope (29 Hz/nA) is the gain. (D1–D2) mSOD1 immediate firing motoneuron. MMOs are absent, there is only a primary range (PR) during the ascending ramp (gain: 41 Hz/nA).
Figure 8
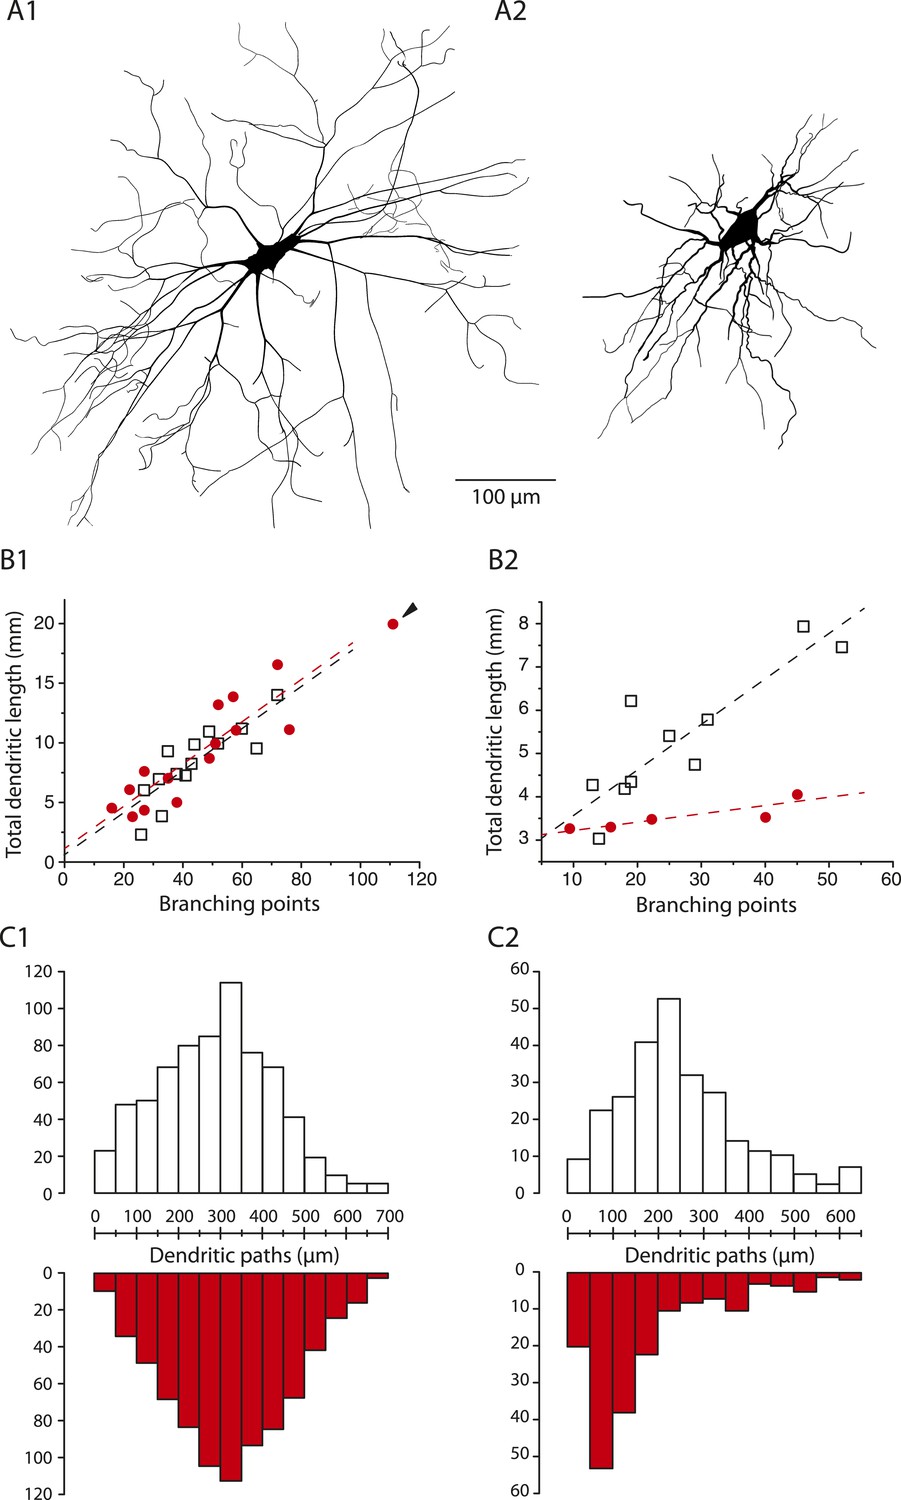
The dendritic tree of immediate firing motoneurons is shrunk in mSOD1 mice.
(A1-2) Reconstructed dendritic trees of mSOD1 delayed (A1) and immediate (A2) firing motoneurons. The axons were not reconstructed. (B1-2) Plots of total dendritic length as a function of number of branching points for delayed firing motoneurons (B1) and immediate firing motoneurons (B2). In each plot, open squares are for WT motoneurons whereas red dots are for mSOD1 motoneurons. Arrowhead in B1 points at an outlying over-branching mSOD1 delayed motoneuron. Linear regressions are indicated by dashed lines. (C1-2) Distribution of the dendritic paths for delayed (C1) and immediate firing motoneurons (C2). Distributions between WT (open columns) and mSOD1 (red columns) dendritic paths are compared for each firing patterns.
Tables
Table 1
Electrophysiological properties
| WT mice | mSOD1 mice | p-value | ||
|---|---|---|---|---|
| Resting membrane potential (mV) | Delayed firing | −64 ± 3 | −65 ± 3 | 0.2 |
| −70/−56 | −70/−59 | |||
| N = 63 | N = 31 | |||
| Immediate firing | −65 ± 3 | −64 ± 2 | 0.2 | |
| −71/−59 | −70/−60 | |||
| N = 31 | N = 18 | |||
| p-value | 0.3 | 0.1 | ||
| Input conductance (nS) | Delayed firing | 52 ± 28 | 54 ± 30 | 0.8 |
| 10/151 | 22/153 | |||
| N = 63 | N = 31 | |||
| Immediate firing | 33 ± 24 | 33 ± 16 | 0.6 | |
| 6/98 | 6/62 | |||
| N = 31 | N = 18 | |||
| p-value | 0.0007 | 0.01 | ||
| Rheobase (nA) | Delayed firing | 1.2 ± 0.6 | 1.1 ± 0.5 | 0.4 |
| 0.3/2.8 | 0.3/2.6 | |||
| N = 57 | N = 30 | |||
| Immediate firing | 0.6 ± 0.4 | 0.3 ± 0.2 | 0.008 | |
| 0.05/1.6 | 0.1/0.6 | |||
| N = 29 | N = 16 | |||
| p-value | <0.0001 | <0.0001 | ||
| Voltage threshold for spiking (mV) | Delayed firing | −33 ± 7 | −31 ± 10 | 0.7 |
| −47/−17 | −50/−10 | |||
| N = 58 | N = 30 | |||
| Immediate firing | −44 ± 7 | −49 ± 6 | 0.03 | |
| −50/−41 | −50/−30 | |||
| N = 30 | N = 17 | |||
| p-value | <0.0001 | <0.0001 | ||
| Voltage threshold for spiking–Resting membrane potential (mV) | Delayed firing | 31 ± 8 | 33 ± 10 | 0.4 |
| 17/49 | 13/50 | |||
| N = 59 | N = 31 | |||
| Immediate firing | 20 ± 7 | 14 ± 5 | 0.005 | |
| 8/31 | 6/21 | |||
| N = 30 | N = 17 | |||
| p-value | <0.0001 | <0.0001 | ||
| Recruitment current on ramp (nA) | Delayed firing | 1.1 ± 0.6 | 1.1 ± 0.5 | 0.8 |
| 0.1/2.8 | 0.3/2.5 | |||
| N = 51 | N = 29 | |||
| Immediate firing | 0.6 ± 0.5 | 0.3 ± 0.3 | 0.02 | |
| 0.07/2 | 0.07/1 | |||
| N = 25 | N = 15 | |||
| p-value | 0.001 | <0.0001 | ||
| Action potential amplitude (mV) | Delayed firing | 89 ± 13 | 87 ± 11 | 0.5 |
| 66/121 | 71/111 | |||
| N = 29 | N = 19 | |||
| Immediate firing | 84 ± 11 | 81 ± 15 | 0.4 | |
| 66/104 | 61/110 | |||
| N = 21 | N = 13 | |||
| p-value | 0.2 | 0.2 | ||
| Action potential width (ms) | Delayed firing | 1.4 ± 0.5 | 1.3 ± 0.4 | 0.6 |
| 0.7/2.5 | 0.6/2.2 | |||
| N = 29 | N = 19 | |||
| Immediate firing | 1.7 ± 0.4 | 1.8 ± 0.6 | 0.7 | |
| 1.1/2.9 | 0.9/3.1 | |||
| N = 21 | N = 13 | |||
| p-value | 0.04 | 0.01 | ||
| AHP relaxation time constant (ms) | Delayed firing | 27 ± 9 | 23 ± 5 | 0.2 |
| 11/50 | 15/34 | |||
| N = 21 | N = 12 | |||
| Immediate firing | 42 ± 12 | 48 ± 27 | 1 | |
| 21/60 | 19/91 | |||
| N = 11 | N = 7 | |||
| p-value | 0.004 | 0.02 | ||
Table 2
Morphological properties
| WT mice | mSOD1 mice | p-value | ||
|---|---|---|---|---|
| Soma area (µm2) | Delayed firing | 630 ± 160 | 620 ± 140 | 0.2 |
| 350/1000 | 270/890 | |||
| N = 60 | N = 31 | |||
| Immediate firing | 530 ± 180 | 454 ± 110 | 0.2 | |
| 260/940 | 250/640 | |||
| N = 30 | N = 17 | |||
| p-value | 0.009 | 0.0002 | ||
| Primary dendrites | Delayed firing | 6.4 ± 2.0 | 6.7 ± 1.2 | 0.3 |
| 4/12 | 5/9 | |||
| N = 14 | N = 14 | |||
| Immediate firing | 6.3 ± 2.7 | 6.4 ± 4.0 | 0.9 | |
| 3/10 | 2/13 | |||
| N = 10 | N = 5 | |||
| p-value | 1 | 0.5 | ||
| Total dendritic length (mm) | Delayed firing | 8.3 ± 2.9 | 8.7 ± 3.8 | 0.9 |
| 2.3/14 | 3.8/16.5 | |||
| N = 14 | N = 14 | |||
| Immediate firing | 5.3 ± 1.5 | 3.6 ± 0.3 | 0.01 | |
| 3.0/8.0 | 3.3/4.1 | |||
| N = 10 | N = 5 | |||
| p-value | 0.01 | 0.0003 | ||
| Dendritic paths (µm) | Delayed firing | 296 ± 135 | 293 ± 139 | 0.8 |
| 5/687 | 15/840 | |||
| N = 653 | N = 449 | |||
| Immediate firing | 252 ± 141 | 181 ± 157 | <0.0001 | |
| 11/803 | 11/685 | |||
| N = 281 | N = 180 | |||
| p-value | <0.0001 | <0.0001 | ||
| Terminal segments length (µm) | Delayed firing | 112 ± 93 | 108 ± 102 | 0.5 |
| 4/457 | 3/742 | |||
| N = 618 | N = 447 | |||
| Immediate firing | 108 ± 91 | 81 ± 92 | 0.001 | |
| 5/545 | 4/584 | |||
| N = 296 | N = 178 | |||
| p-value | 0.6 | 0.001 | ||
-
Note that the ‘overbranching motoneuron’ (arrowhead on Figure 8B1) is excluded for analysis.
Additional files
-
Supplementary file 1
Source data for Tables 1 and 2 and Figures 6 and 8.
Each sheet begins with a description of the properties measured and where they are displayed in the article.
- https://doi.org/10.7554/eLife.04046.015
Download links
A two-part list of links to download the article, or parts of the article, in various formats.
Downloads (link to download the article as PDF)
Open citations (links to open the citations from this article in various online reference manager services)
Cite this article (links to download the citations from this article in formats compatible with various reference manager tools)
Early intrinsic hyperexcitability does not contribute to motoneuron degeneration in amyotrophic lateral sclerosis
eLife 3:e04046.
https://doi.org/10.7554/eLife.04046


