Genome-wide regulatory dynamics of translation in the Plasmodium falciparum asexual blood stages
- University of California, San Francisco, United States
- Howard Hughes Medical Institute, University of California, San Francisco, United States
Figures
Figure 1 with 3 supplements
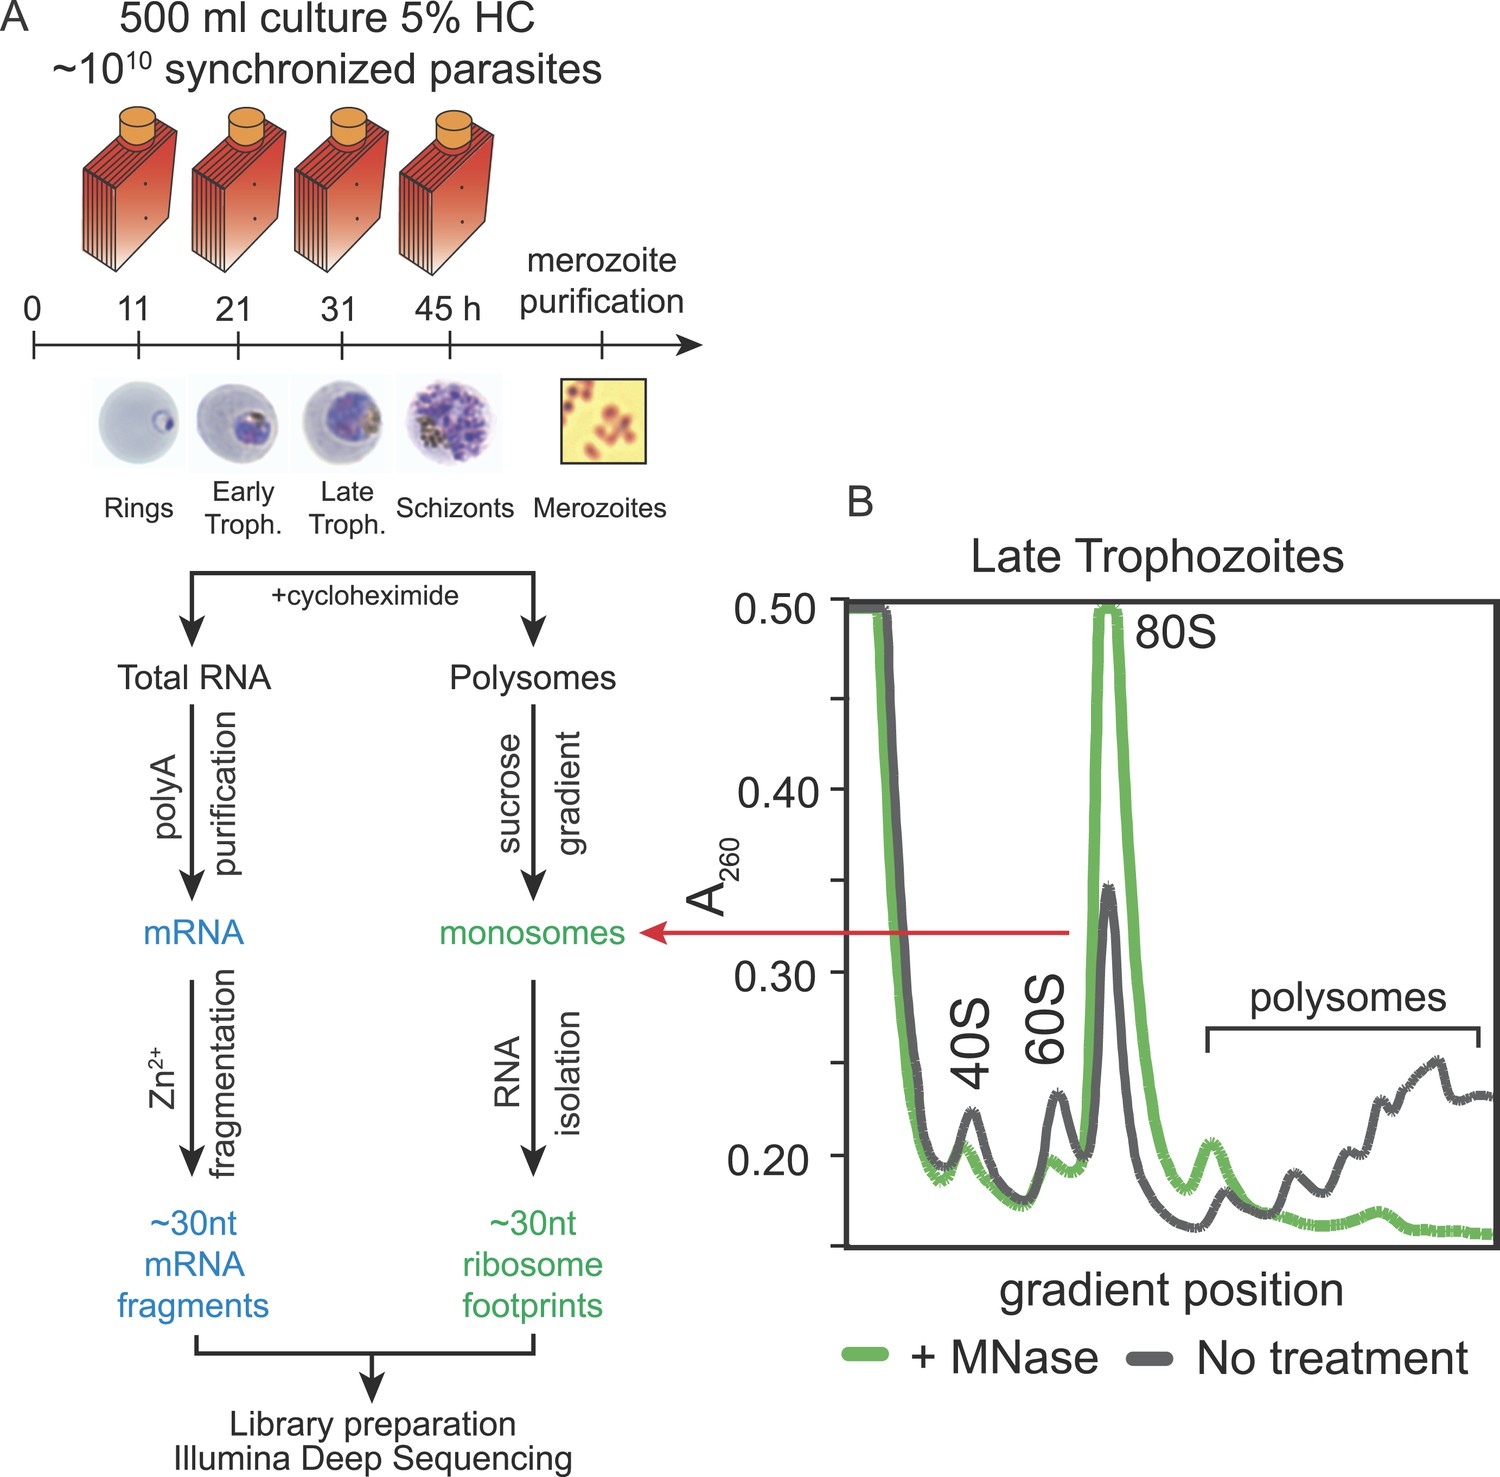
Ribosome profiling of the P. falciparum asexual blood stages, experimental outline.
(A) Synchronized parasite cultures were maintained in hyperflasks at 5% hematocrit and maximum 15% parasitemia. Cycloheximide-treated cultures containing ∼1010 parasites were harvested at ring, early trophozoite, late trophozoite and schizont stages (11, 21, 31, and 45 hpi, respectively) for total RNA or polysome isolation. Merozoites were purified through magnetic isolation of late stage schizonts (see ‘Materials and methods’). Nuclease treated polysomes were fractionated on a sucrose gradient. Ribosome footprints (∼30 nt) derived from the monosome peak (dashed red line) or chemically fragmented polyA purified mRNA (∼30 nt) were used to build sequencing libraries. mRNA and ribosome footprint samples were processed in parallel to create deep sequencing libraries compatible with the Illumina platform. (B) Sucrose gradient A260 absorbance profile of polysome extracts derived from late trophozoites treated with micrococcal nuclease (green, +MNase) or untreated controls (gray, No treatment). Red arrow indicates the 80S monosome peak collected for ribosome footprint library preparation.
-
Figure 1—source data 1
Illumina sequencing mapping statistics against P. facliparum W2 SNP-corrected genome.
- https://doi.org/10.7554/eLife.04106.004
Figure 1—figure supplement 1
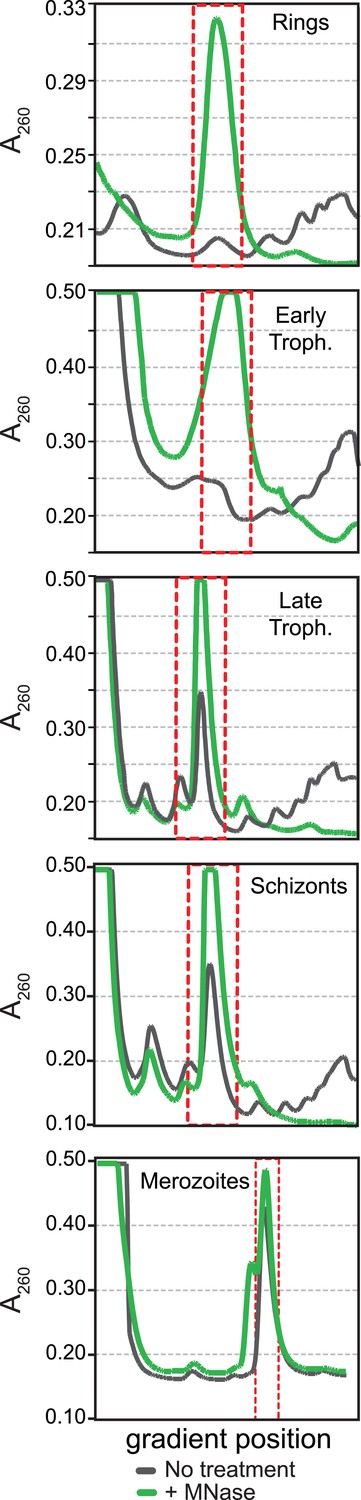
Polysome profiles of the P. falciparum asexual blood stages.
Sucrose gradient A260 absorbance profiles of polysome extracts treated with micrococcal nuclease (green, +MNase) and untreated controls (gray, No treatment). Red dotted line indicates monosome peak harvested for ribosome footprint library generation.
Figure 1—figure supplement 2
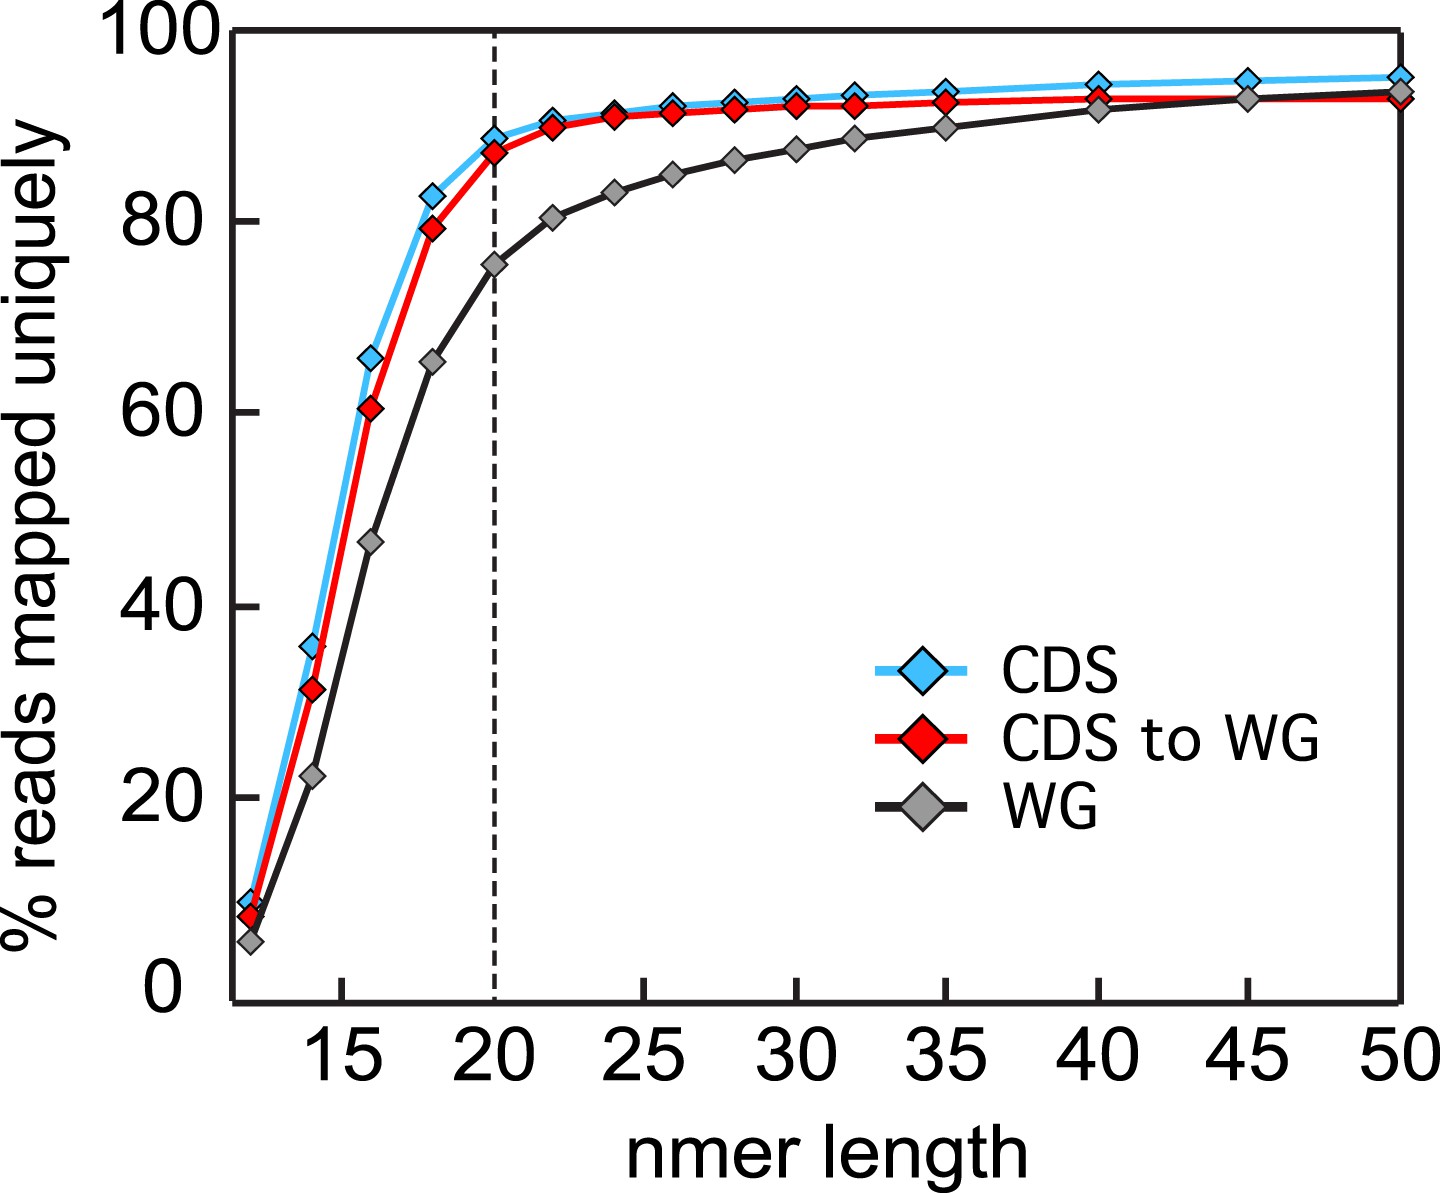
Read size influence on mappability.
Single nucleotide sliding windows ranging from 10 to 50 nt were used to generate in silico libraries of the P. falciparum W2 SNP corrected genome. These were uniquely aligned, allowing no mismatches, to either the whole genome (gray, WG) or the coding sequences (blue, CDS) using Bowtie (Mortazavi et al., 2008) and the percentage of aligned reads were calculated for each window size. The analysis was repeated using sliding windows generated from the coding genome only (red, CDS to WG) for a more representative mappability estimate of an RNA-seq data set. Read sizes of ≥20 nt asymptotically approach maximum mappability percentages.
Figure 1—figure supplement 3
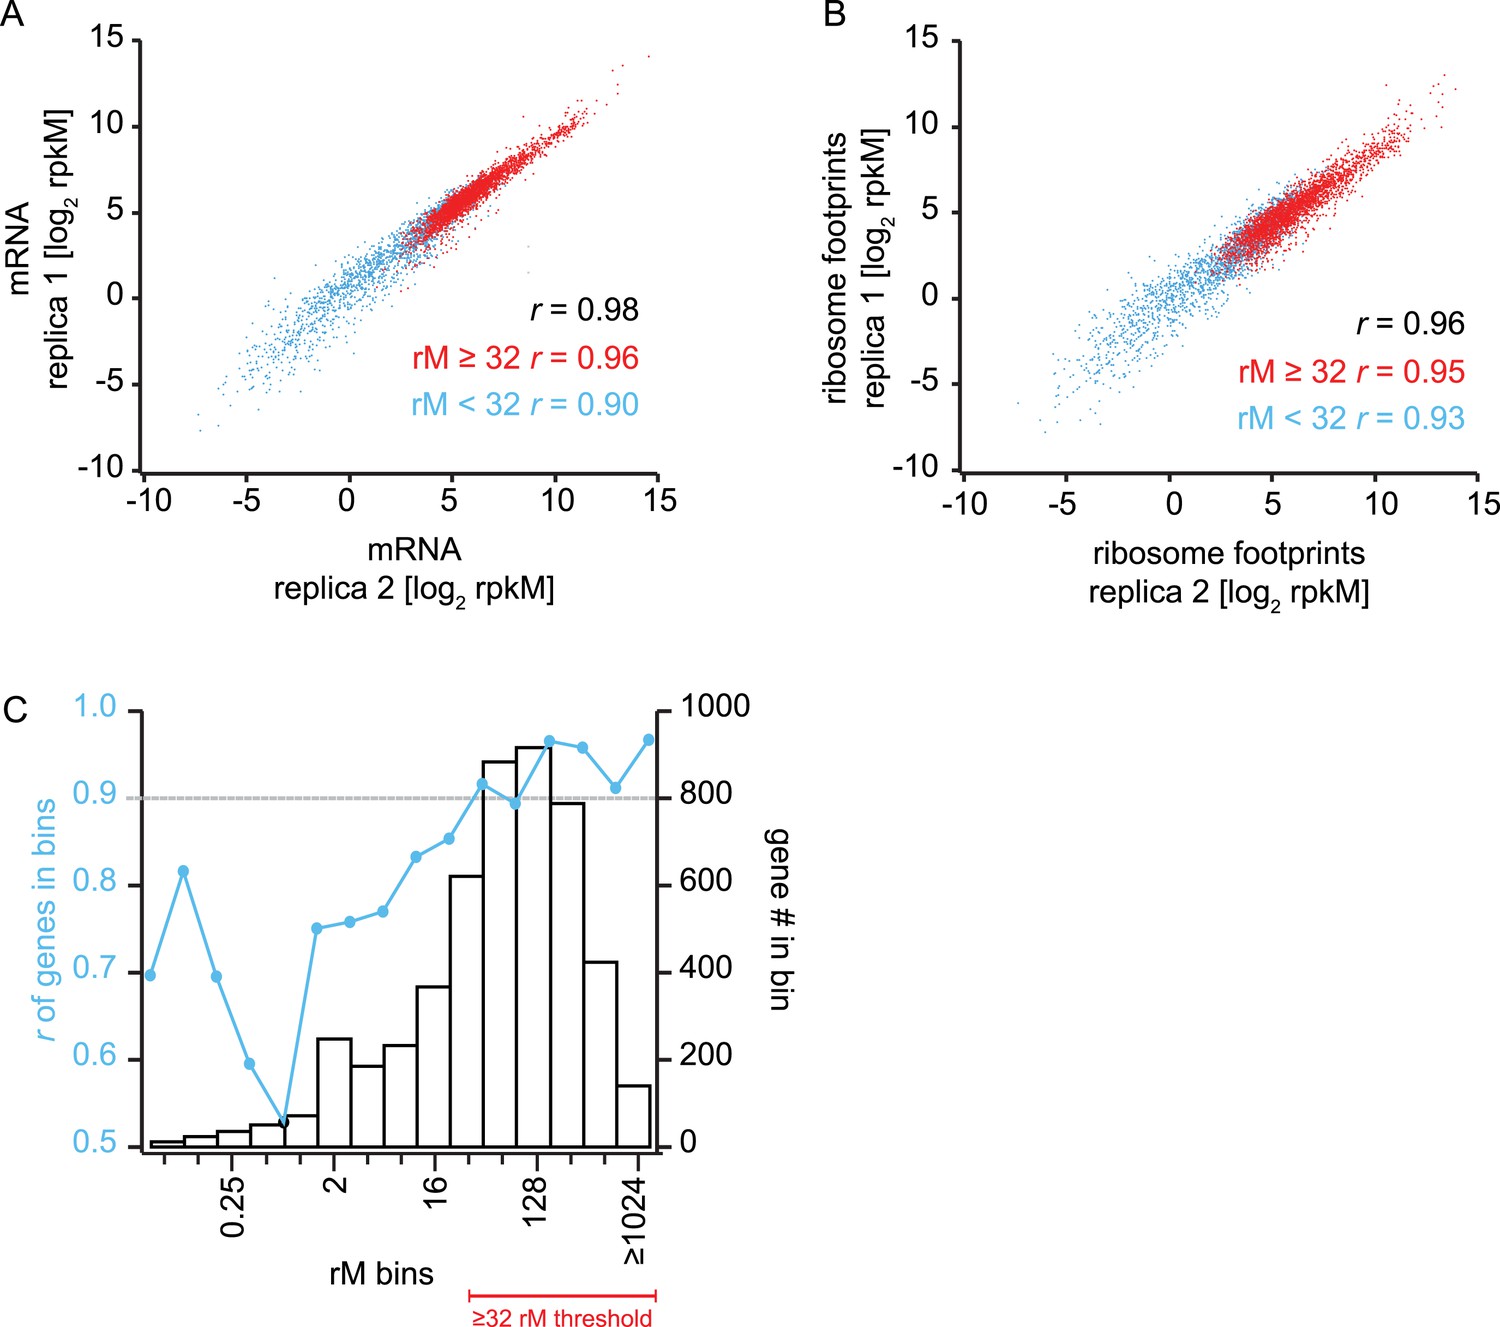
Reproducibility and coverage threshold determination using two fully independent biological replicates.
mRNA abundance measurements (A) and ribosome footprint densities (B) in terms of rpkM in two fully independent biological replicates of the late trophozoite timepoint. Genes with at least ≥32 total mRNA reads counted (rM) are highly reproducible (r ≥ 0.9) across replicas (A and B red dots, and Figure D) whereas low read counts have a negative effect on rpkM reproducibility (A and B blue dots, and C). (C) Genes were binned based on their rM in replica 1. In each bin Pearson correlations of rpkM values of replica 1 and replica 2 were calculated. At 32 rM, r values were consistently above 0.9 indicating that rpkMs calculated for genes with ≥32 rM are highly reproducible across replicates, and this is independent of the number of genes in the bin. r = Pearson correlation coefficient.
Figure 2
Ribosome profiling through the P. falciparum IDC.
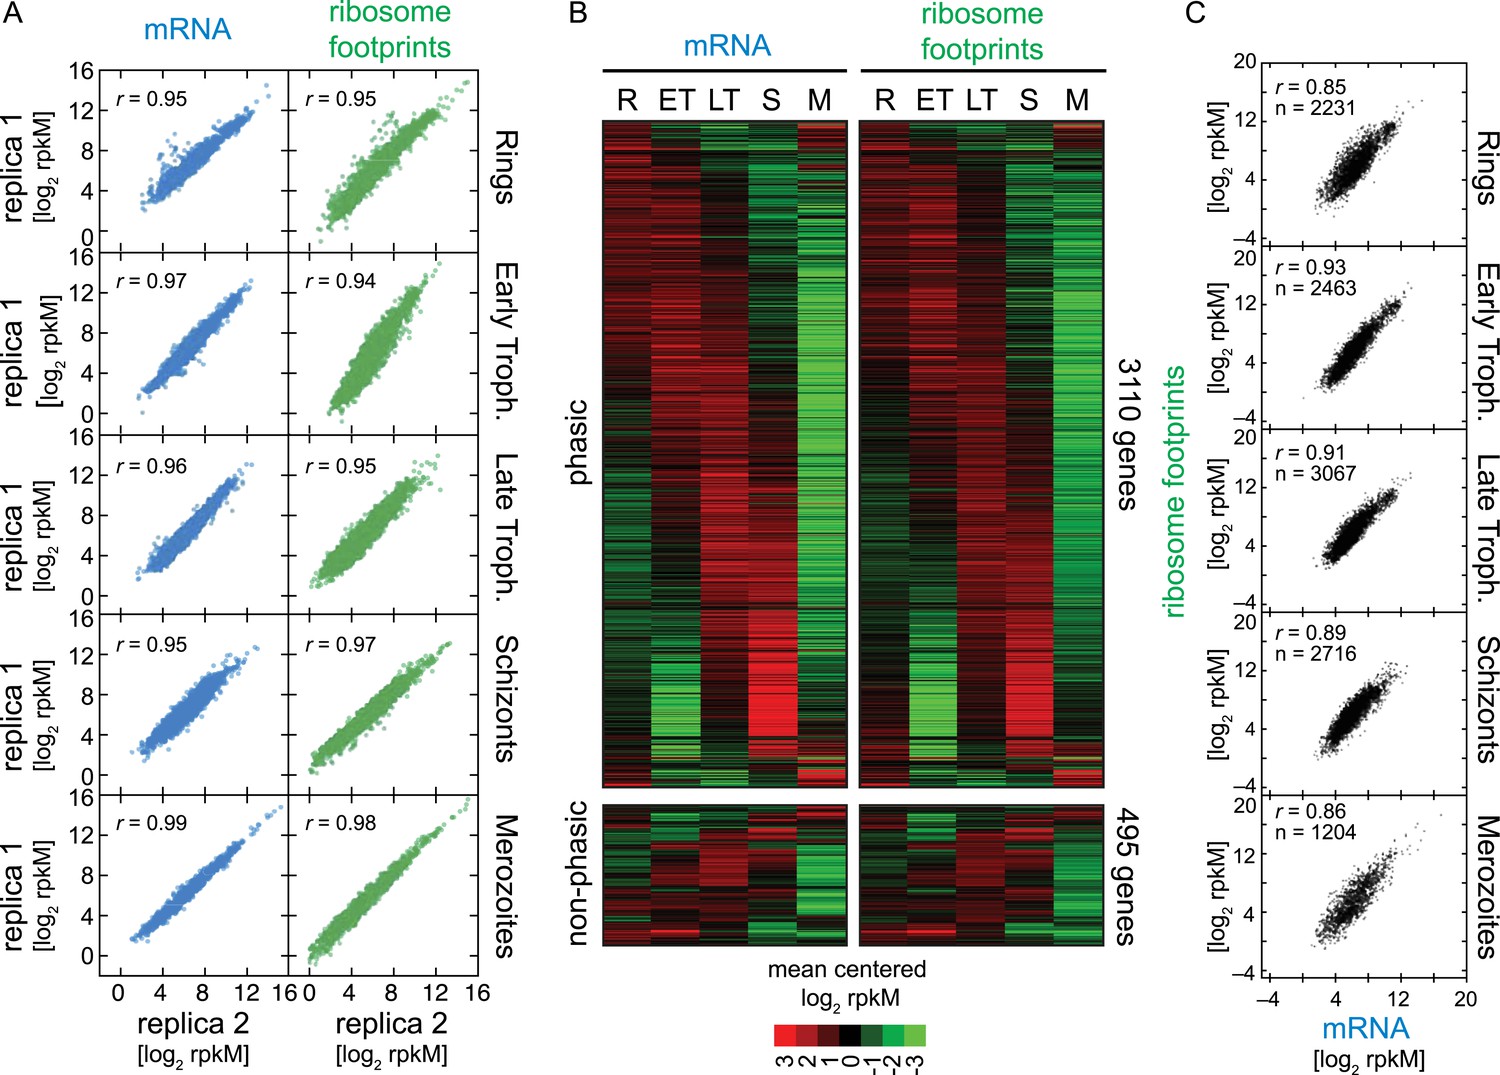
(A) Reproducibility among biological replicates. Two fully independent biological replicas of each stage were sampled for RNA-seq (left panels, blue) and ribosome profiling (right panels, green). Each dot represents the log2 rpkM measured for each gene in each stage. r = Pearson correlation coefficient. (B) Gene expression and translation are tightly coupled during the P. falciparum IDC. Phaseograms of mRNA (left heatmap) and ribosome footprint density (right heatmap) as a function of development for 3110 phasic and 495 non-phasic genes organized in the same order in the left and right heatmap. Data represent mean centered log2 mRNA and ribosome footprint rpkM values for each gene (rows) in each sampled stage (columns). R = rings, ET = early trophozoites, LT = late trophozoites, S = schizonts, M = merozoites. (C) log2 rpkM of mRNA abundance vs ribosome footprint density for all genes expressed (rM ≥ 32) across the IDC. Pearson correlation coefficients r ≥ 85. n = total number of genes.
-
Figure 2—source data 1
P. falciparum ribosome profiling data set.
- https://doi.org/10.7554/eLife.04106.009
Figure 3 with 1 supplement
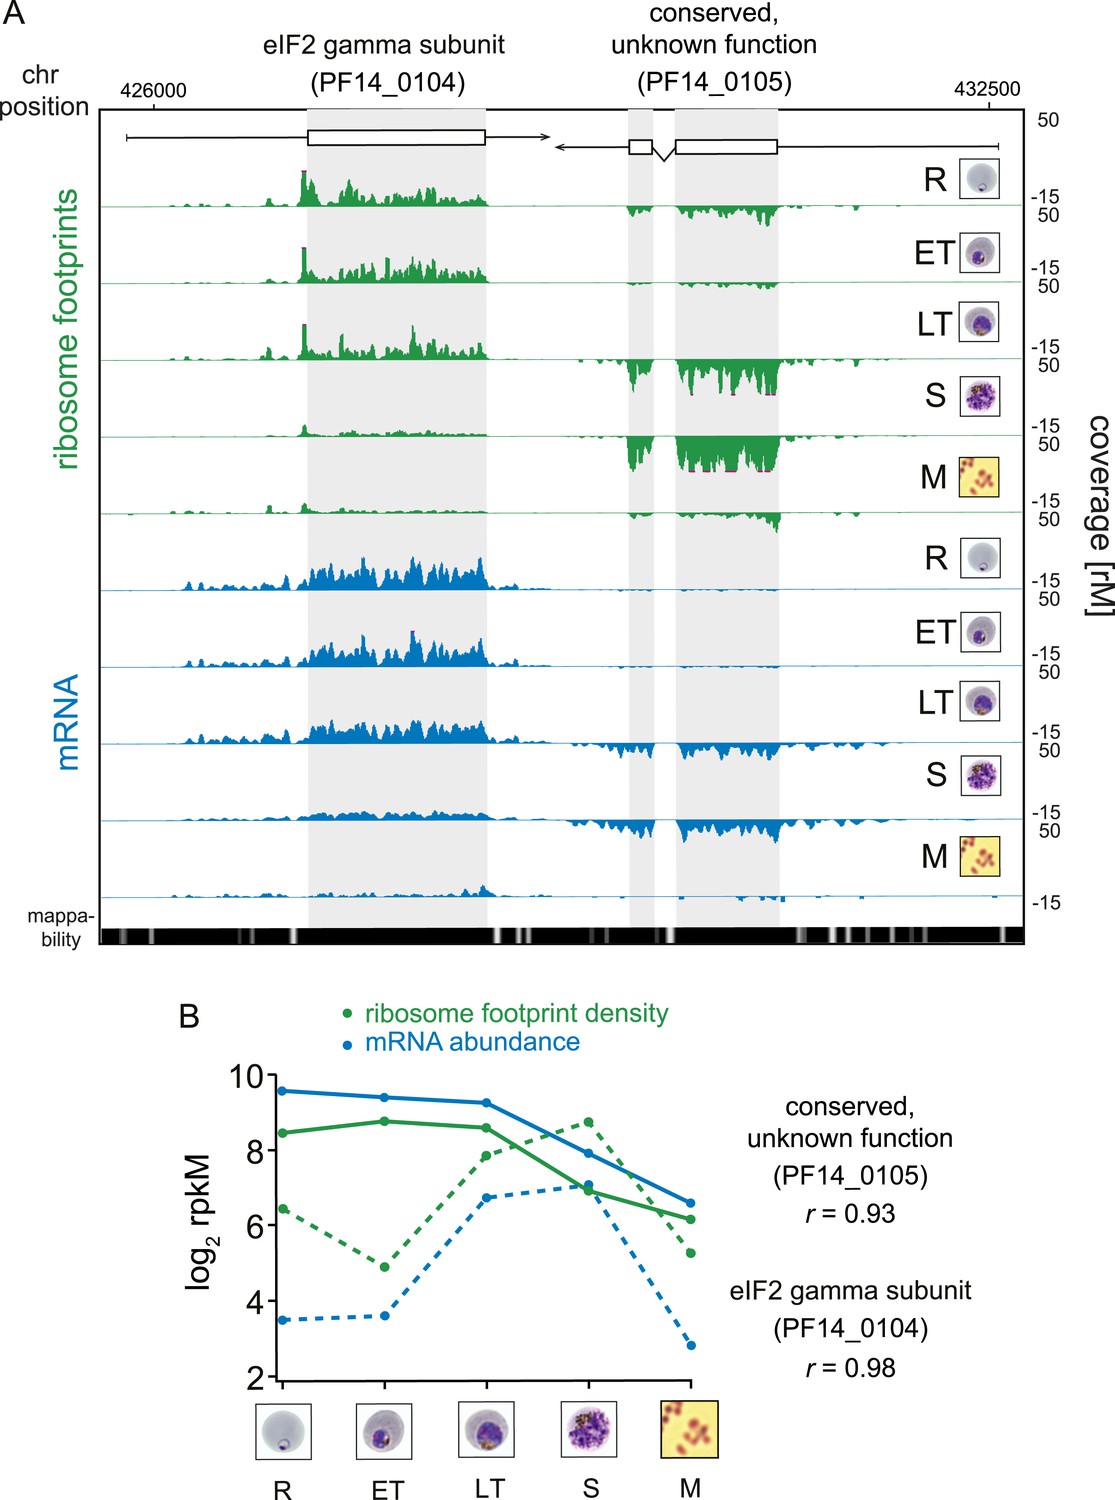
Transcription and translation are highly correlated.
(A) Ribosome footprint (green) and mRNA (blue) coverage profiles of two neighbor genes, the eIF2 gamma subunit (PF14_0104) and the conserved protein PF14_0105 (CDS, white boxes; HMM-defined UTRs, black lines) in rings (R), early trophozoites (ET), late trophozoites (LT), schizonts (S), and merozoites (M). Mappability = mappability score at that position; range 0 (white) to 30 (black). rM = coverage (reads per million reads mapped). (B) mRNA and ribosome footprint density of the genes in (A) correlate during development. r = Pearson correlation coefficient between ribosome footprint density and mRNA abundance of each gene.
Figure 3—figure supplement 1

mRNA abundance and ribosome footprint density are highly correlated for the majority of genes expressed during the IDC.
Pearson correlation of mRNA abundance and ribosome footprint density of every gene expressed in at least three stages (2412 genes).
Figure 4

Genome-wide measurements of translation.
(A) Translational efficiency distributions in each stage. Rings and merozoites have most extreme TE values; ± 2 SD above (yellow bars) and below (blue bars) the mean. TE values of translationally up-regulated merozoite surface protein (MSP6) and the eukaryotic initiation factor 2 alpha kinase 1 (IK1) (blue arrowhead) across the time course remain high and low, respectively. μ = mean log2TE, n = total number of genes. (B) mRNA abundance and translational efficiency heatmap of translationally up- and down-regulated genes (upper panel and lower panel, respectively). Note TE is independent of changes in mRNA abundance for all genes including MSP6 and IK1 (C). R = rings, ET = early trophozoites, LT = late trophozoites, S = schizonts, M = merozoites. n = number of genes, μ = mean, SD = standard deviation.
Figure 5 with 2 supplements
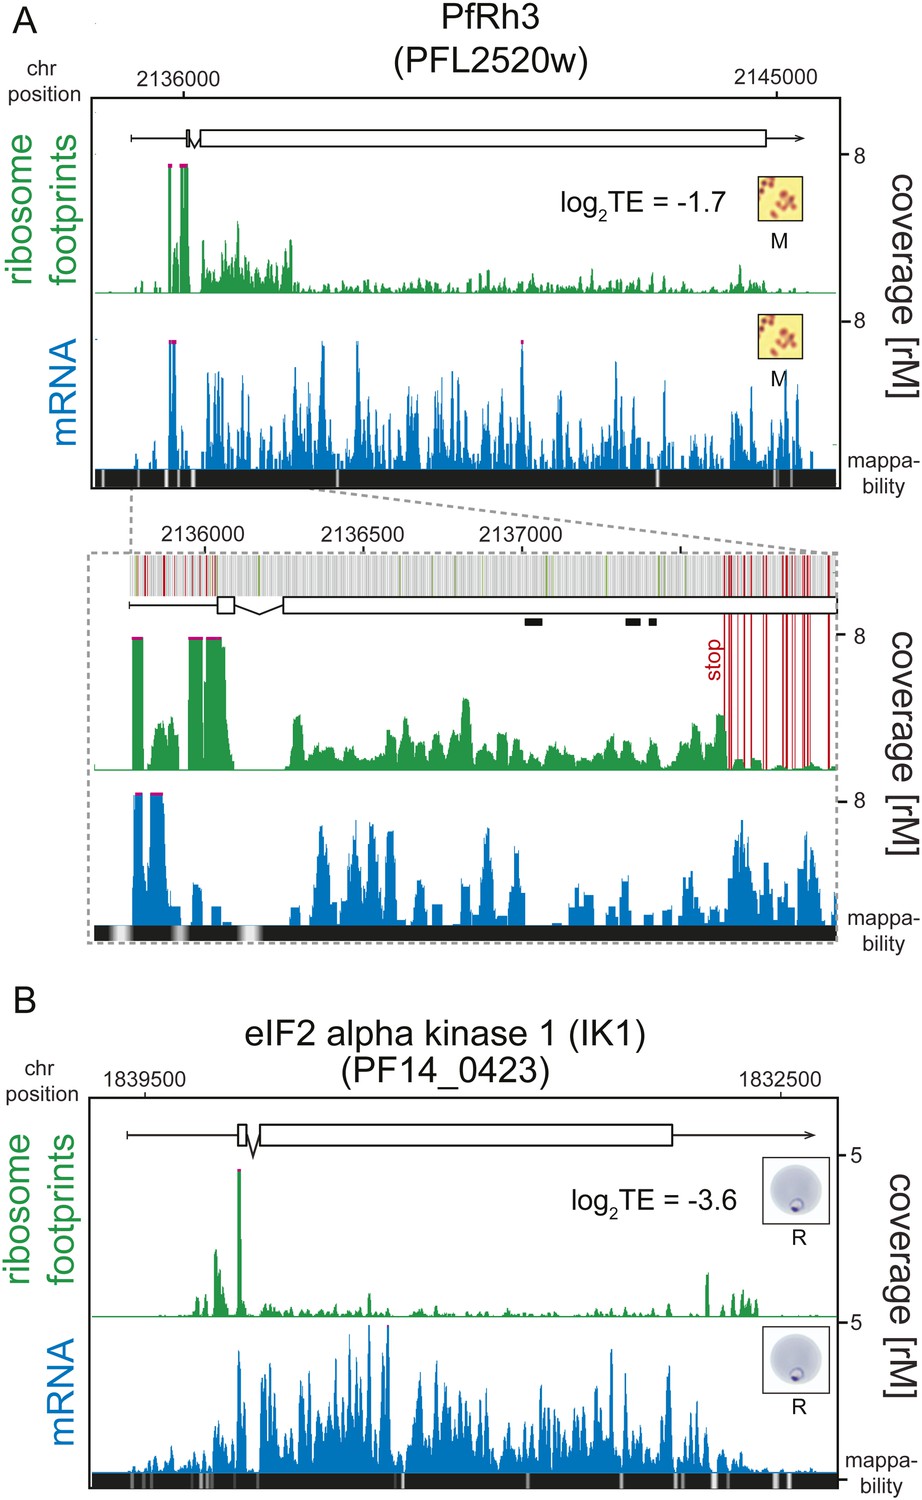
Translationally down-regulated genes have decreased CDS ribosome density.
(A) Ribosome footprint (green) and mRNA (blue) profiles of the PfRh3 pseudogene (PFL2520w) in merozoites (M). In the detail the bars above the gene model indicate AUG, stop, and any other codon, in green, red, and gray, respectively. Boxes indicate the mapping location of peptides identified by mass spectrometry in gametocytes and sporozoites (Florens et al., 2002; Lasonder et al., 2002). Reduction of ribosome footprint coverage occurs upon encounter of consecutive stop codons (extended red lines). (B) eIF2α kinase (PF14_0423) gene in rings (R) showing ribosome footprint accumulation on the 5′ leader, 3′ UTR, and low translational efficiency of the CDS. (CDS, white boxes; HMM-defined UTRs, black lines. Mappability = mappability score at that position; range 0 (white) to 30 (black). rM = coverage (reads per million reads mapped).
Figure 5—figure supplement 1
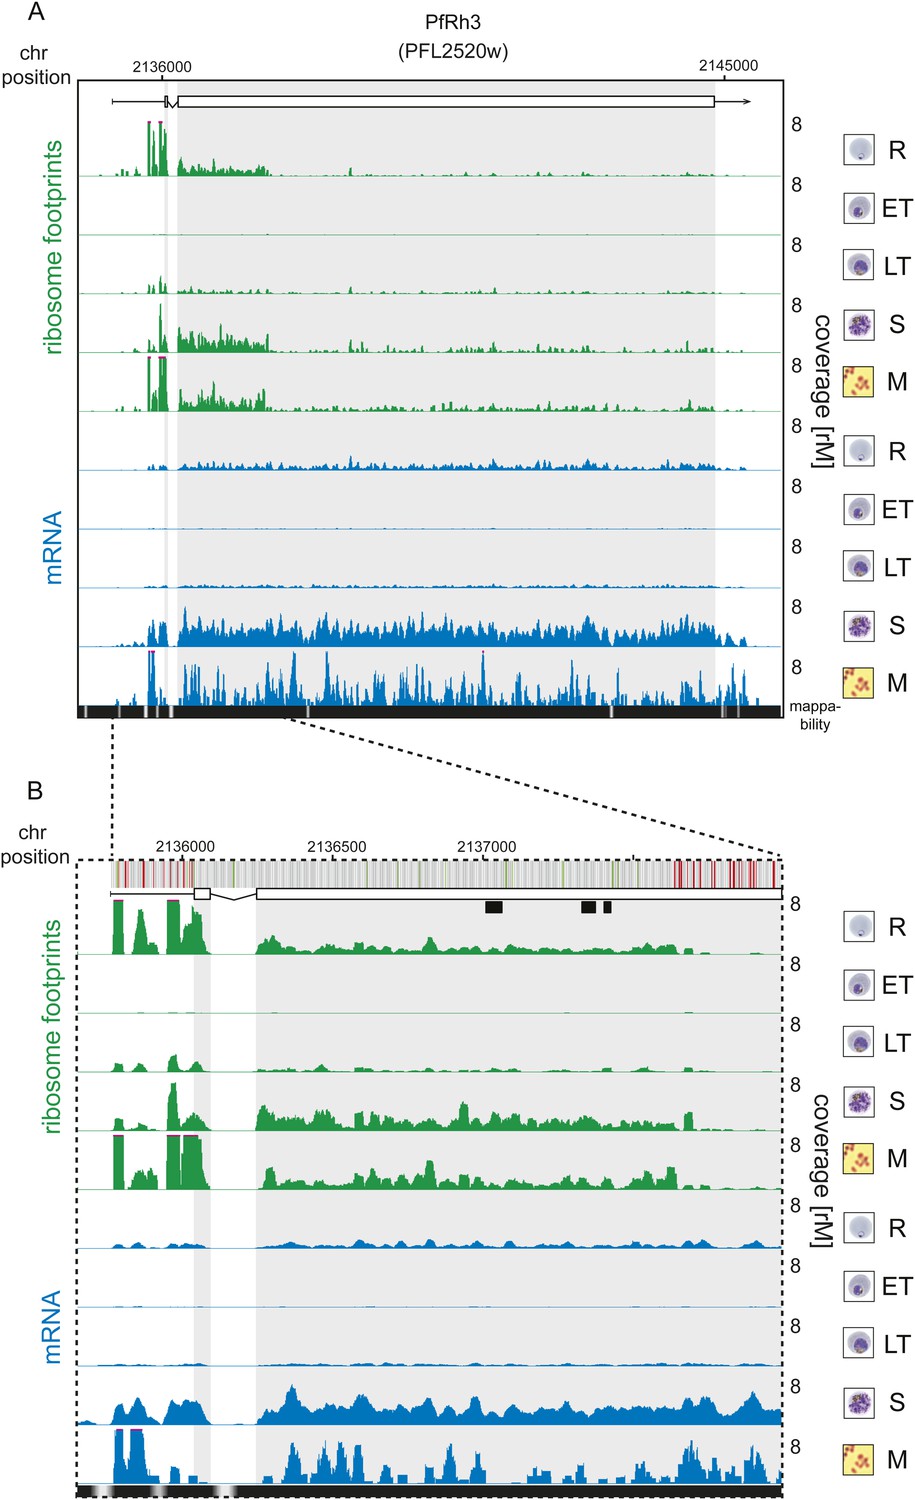
Translation of a truncated form of PfRh3 during the IDC.
Ribosome footprint (green) and mRNA (blue) profiles of the PfRh3 pseudogene (PFL2520w) in rings (R), early trophozoites (ET), late trophozoites (LT), schizonts (S), and merozoites (M). (A) Translation of PfRh3 occurs until ribosomes dissociate upon the encounter of several consecutive in-frame stop codons (visible in B). (B) The vertical bars above the gene model indicate AUG, stop, and any other codon, in green, red, and gray, respectively. Boxes indicate the mapping location of peptides identified by mass spectrometry in gametocytes and sporozoites (Florens et al., 2002; Lasonder et al., 2002).
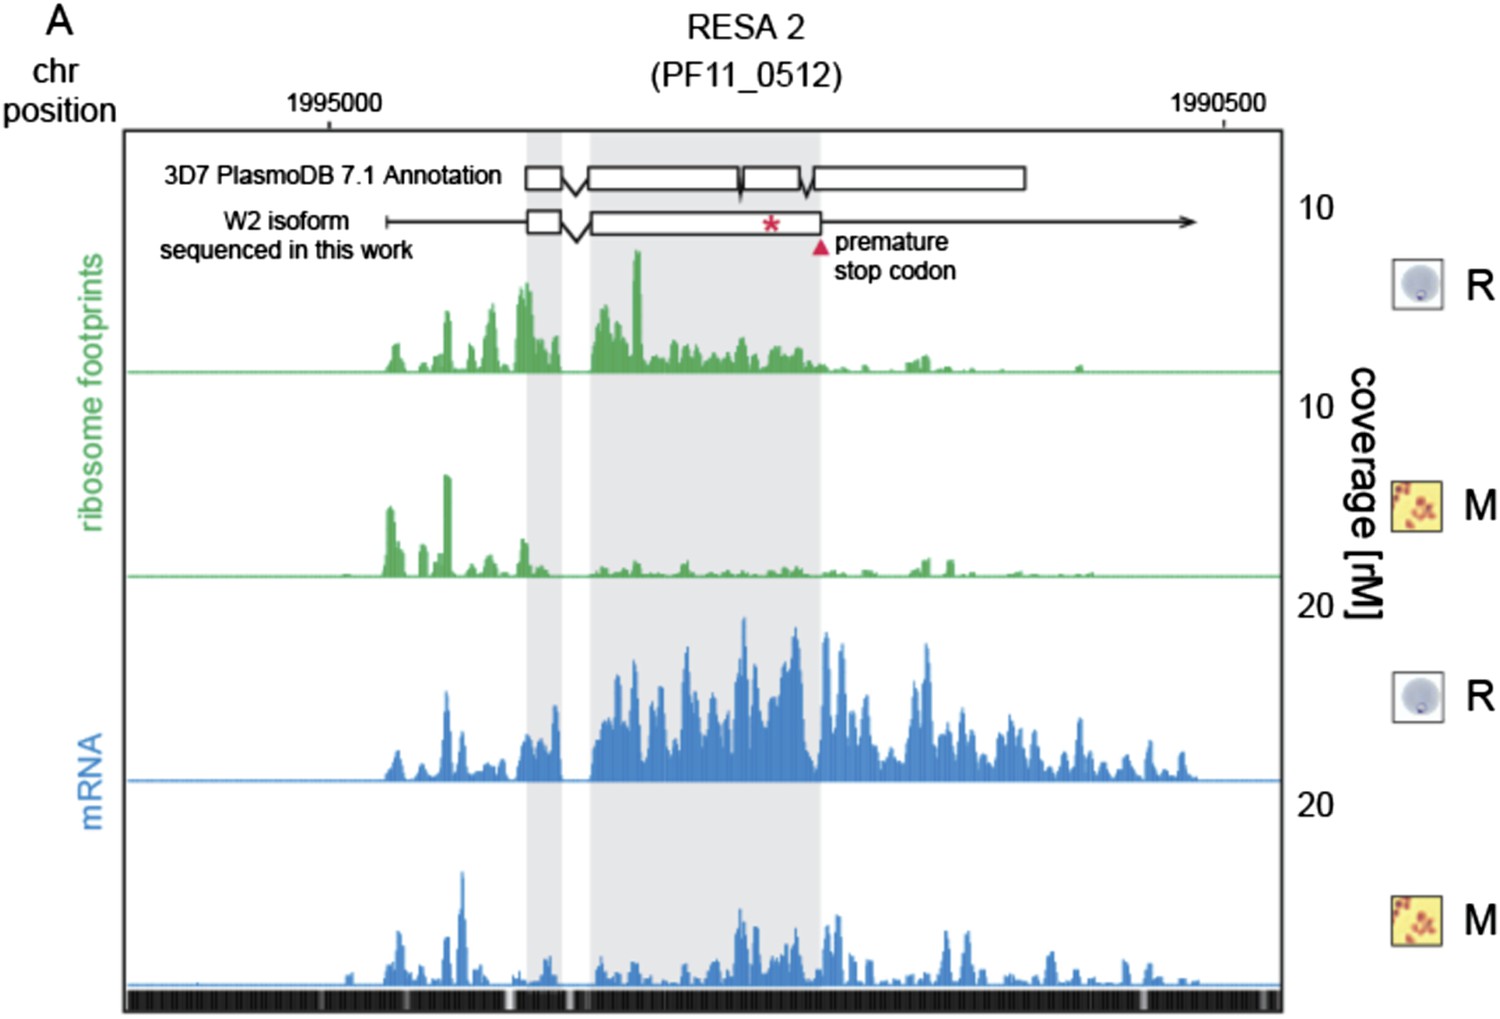
Figure 5—figure supplement 2
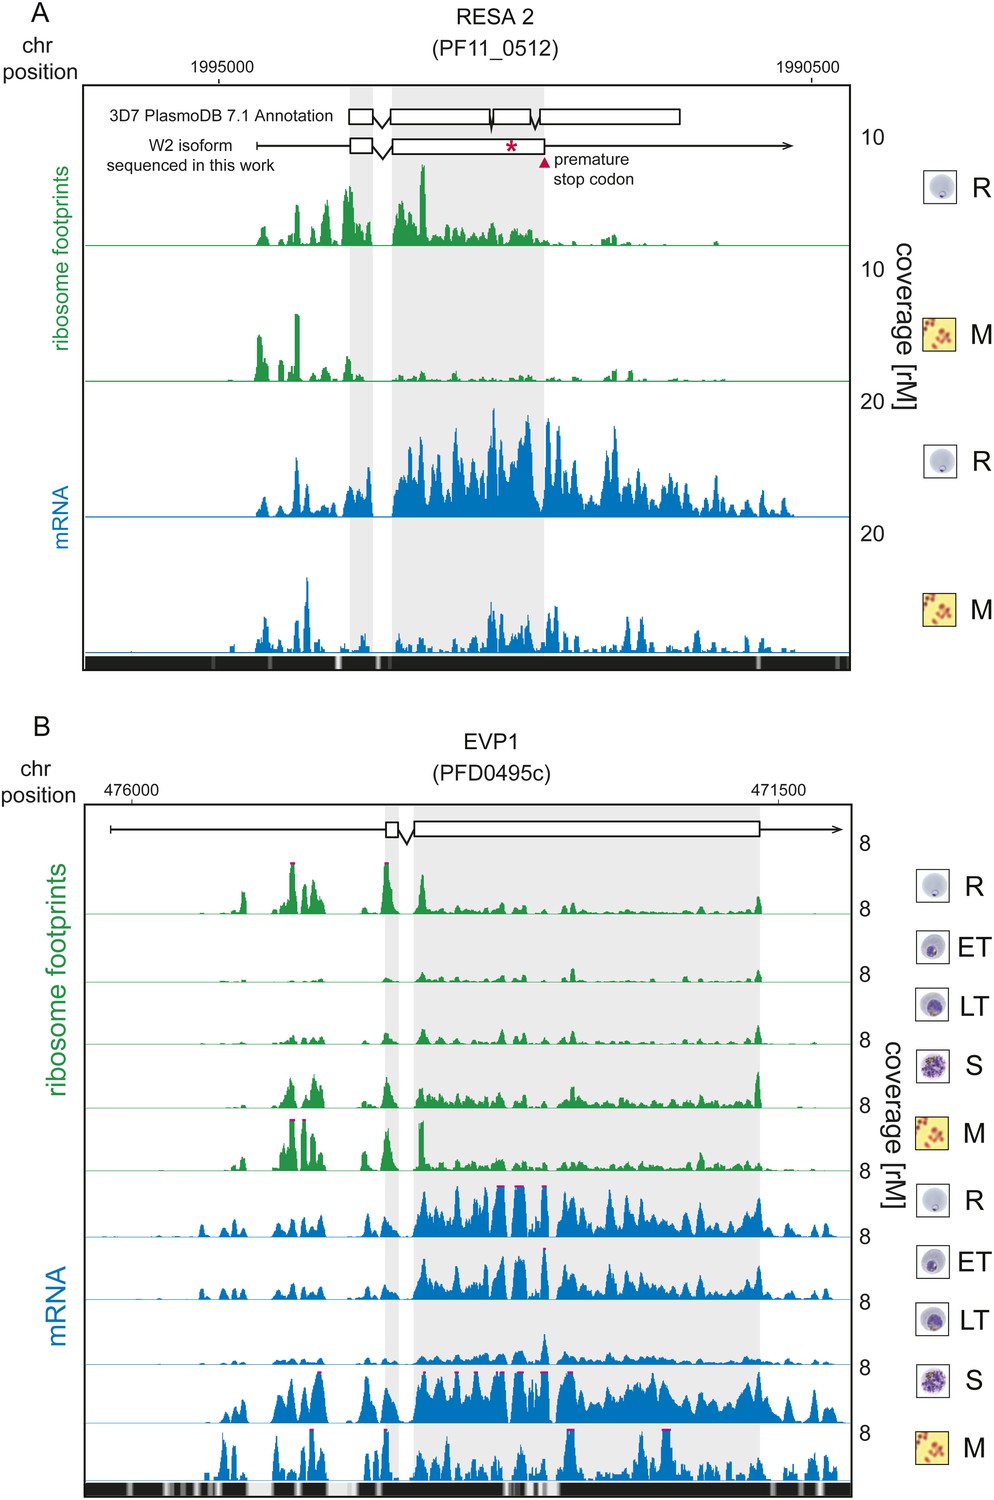
Translationally down-regulated genes have decreased CDS ribosome density.
(A) Ribosome footprint (green) and mRNA (blue) profiles of the ring-infected erythrocyte surface antigen 2, RESA2 pseudogene (PF11_0512) in rings (R) and merozoites (M). Both, the annotated isoform from PlasmoDB version 7.1 and the gene model for the alternate isoform inferred using ribosome profiling and W2 genomic DNA sequencing data from this study is depicted (CDS, white boxes; HMM-defined UTRs, black lines). The red star indicates a homopolymeric tract in which a single base deletion causes a premature stop codon (red triangle), which coincides with the site of ribosome drop off. (B) Ribosome footprint and mRNA profiles of erythrocyte vesicle protein 1, EVP1 (PFD0495c). This gene is transcribed in all stages yet translational efficiencies are relatively low, as evidenced by a depletion of ribosomes on the CDS of the gene particularly in early trophozoites (log2TE = −2.6, −2.9, −1.0, −2.1, −1.4 in rings, early trophozoites, late trophozoites, schizonts, and merozoites, respectively). (CDS, white boxes; HMM-defined UTRs, black lines. Mappability = mappability score at that position; range 0 (white) to 30 (black). rM = coverage (reads per million reads mapped).
Figure 6 with 1 supplement
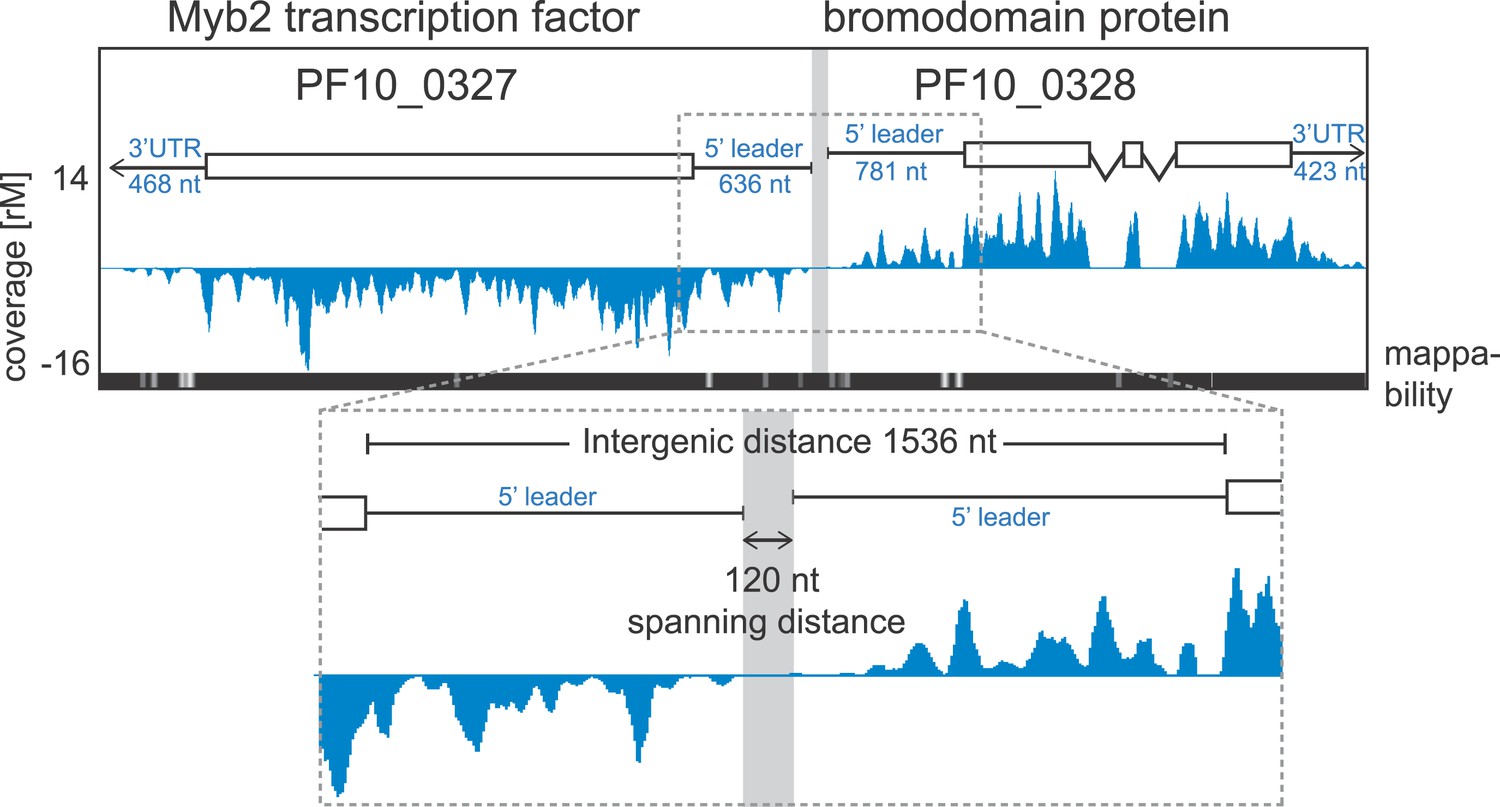
Example of extended transcript annotations using the HMM.
5′ leaders and 3′ UTRs of the gene pair Myb2 (PF10_0327) and bromodomain protein (PF10_0328) were defined using the HMM designed (see ‘Materials and methods’). The sizes of 5′ leaders and 3′ UTRs of these genes in the schizont stage are indicated. The intergenic region is 1536 nt and the spanning distance separating the 5′ leaders is 120 nt. Mappability = mappability score at that position; range 0 (white) to 30 (black). rM = coverage (reads per million reads mapped).
Figure 6—figure supplement 1
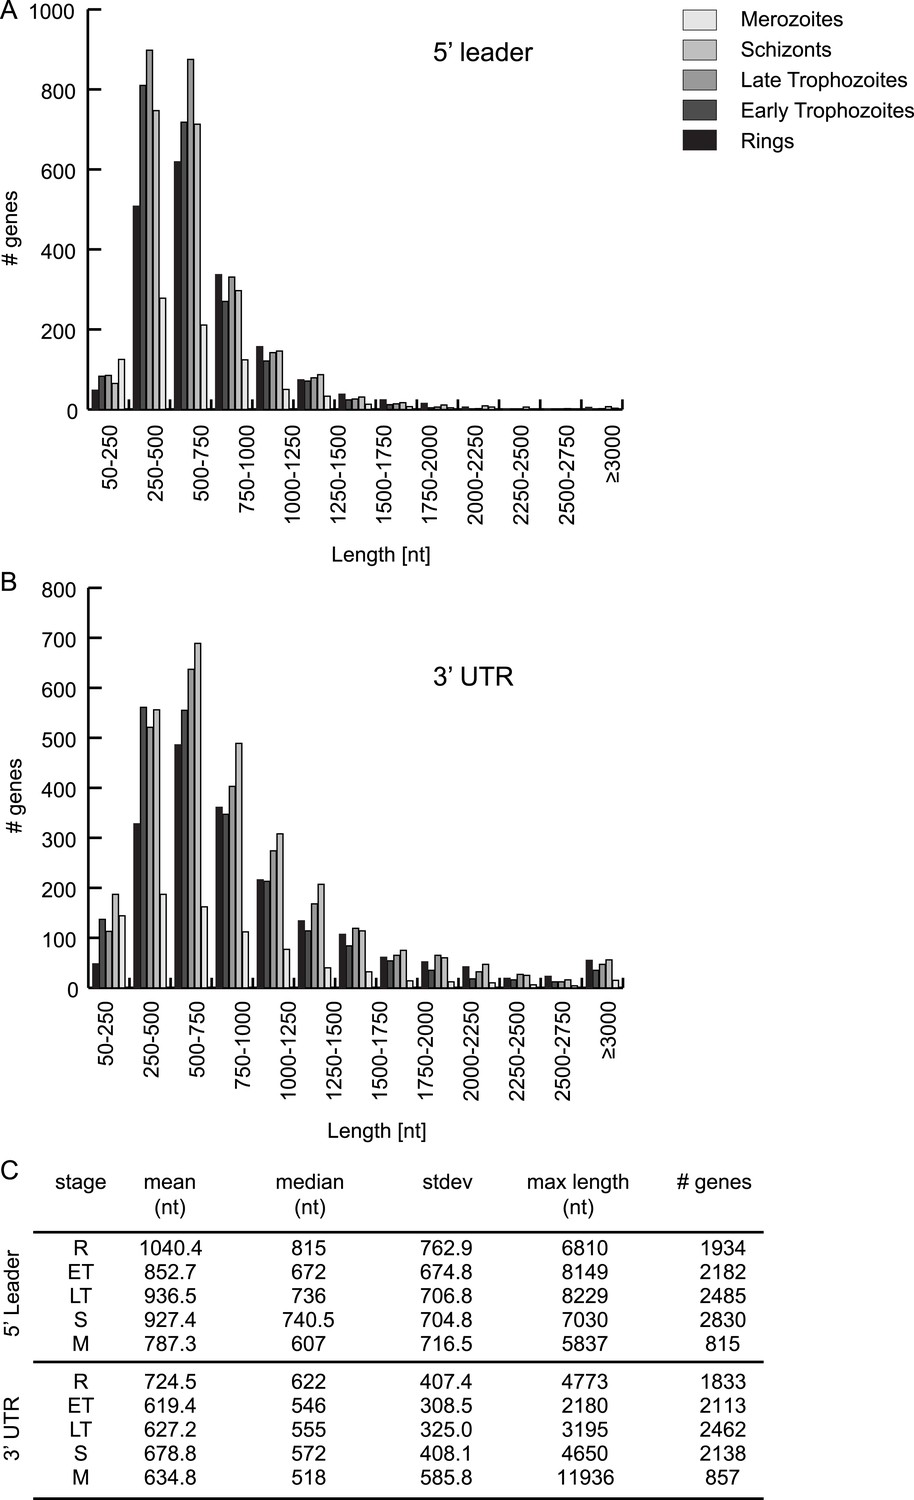
HMM-defined 5′ leader and 3′ UTR characteristics.
5′ leader (A) and 3′ UTR (B) length distribution and their statistics (C) per stage.
Figure 7 with 6 supplements
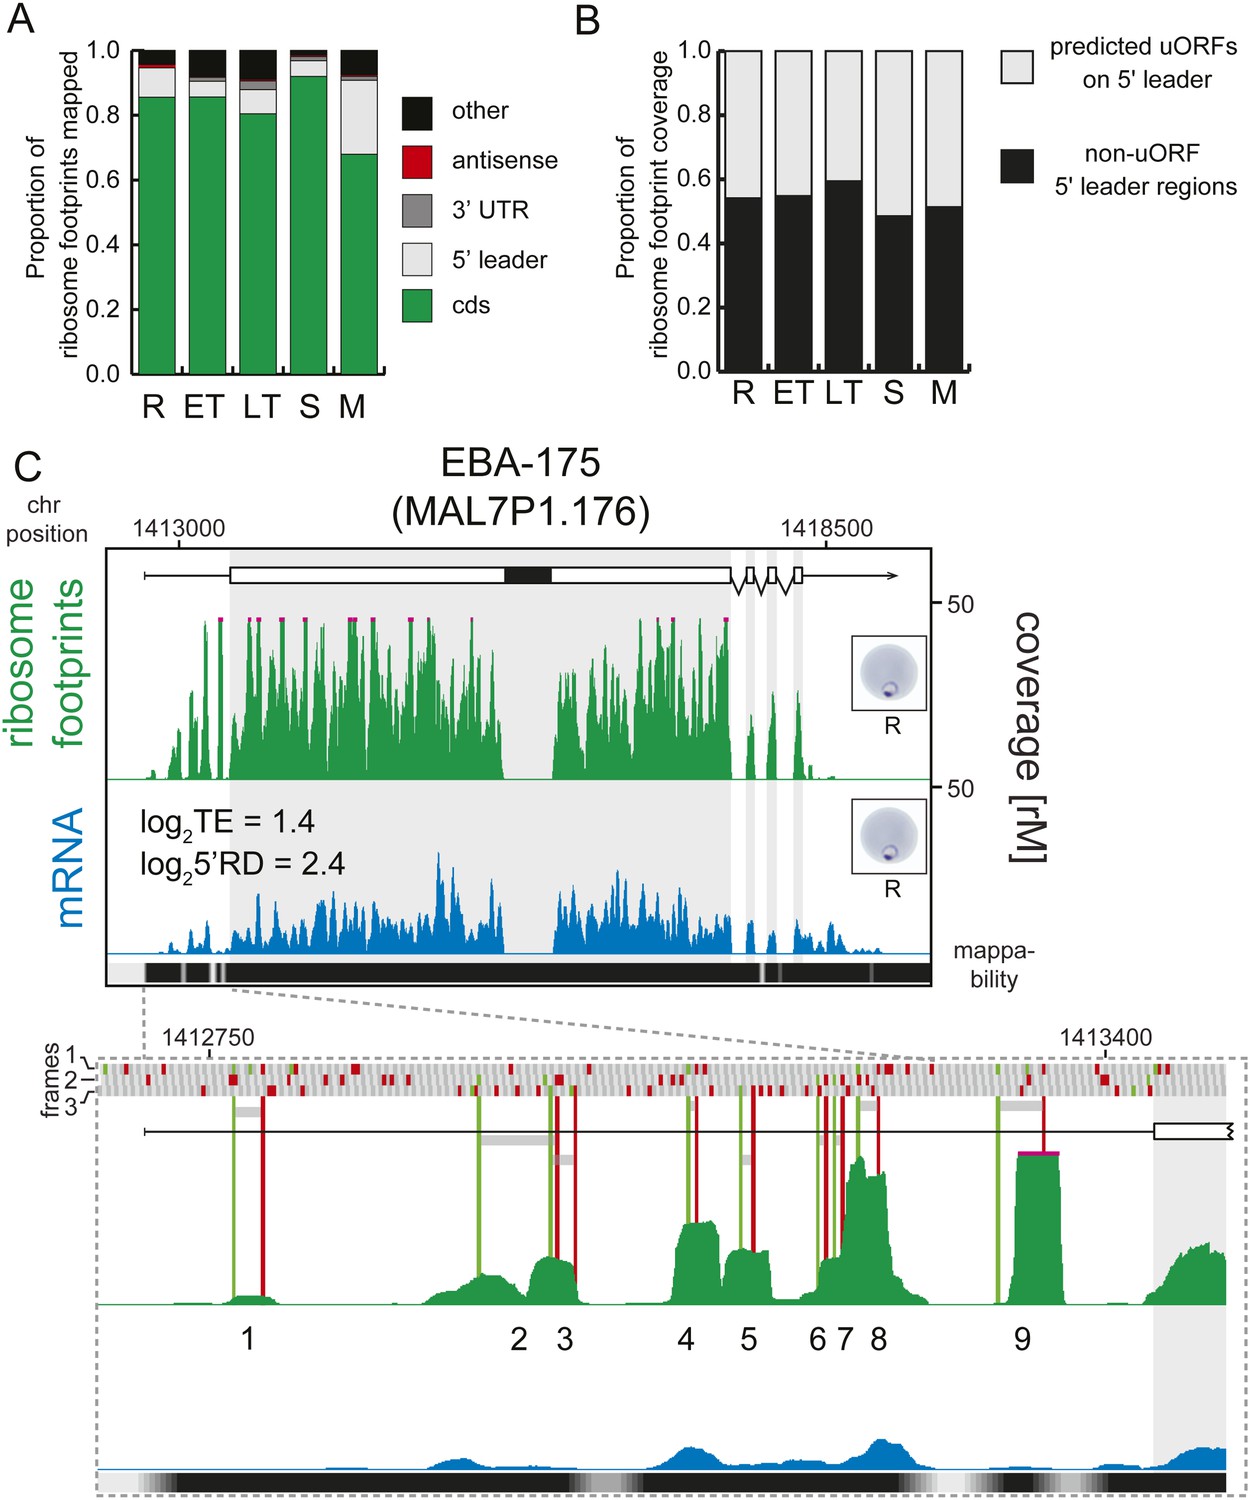
Transcripts accumulate ribosome density within the 5′ leader.
(A) Proportion of mRNA or ribosome footprint reads mapping to CDS, to HMM-defined 5′ leaders and 3′ UTRs, antisense to annotated coding genes or to other regions of the genome such as mitochondria, plastid, tRNA, rRNA, ncRNA, and 5′ leader and 3′ UTR regions not defined by the HMM. (B) Proportion of ribosome footprints mapping inside or outside predicted uORFs in the HMM-defined 5′ leaders. (C) Ribosome footprint (green) and mRNA (blue) profiles of the EBA-175 (MAL7P1.176) gene in rings (R) showing ribosome footprint accumulation on the 5′ leader. In the detail, the bars above the gene model indicate AUG, stop, and any other codon, in green, red, and gray, respectively and in all three possible frames. Gray bars indicate the 9 uORFs present in the 5′ leader, starting with an AUG (green line) and ending with a stop codon (red line). Black bar inside CDS indicates a deletion specific to the W2 strain used in this study. CDS, white boxes; HMM-defined UTRs, black lines. Mappability = mappability score at that position; range 0 (white) to 30 (black). rM = coverage (reads per million reads mapped).
-
Figure 7—source data 1
Predicted uORFs.
- https://doi.org/10.7554/eLife.04106.019
Figure 7—figure supplement 1

5′ leader footprints are derived from ribosomes.
Ribosome footprint read length distributions for reads mapping either to CDSs, 5′ leaders, 3′ UTRs, antisense, rRNAs or tRNAs are plotted. Read lengths of rRNA and tRNA mapping footprints are significantly different than those mapping the 5′ leader, the CDS, or the 3′ UTR of transcripts in all stages. KS = Kolmogorov–Smirnov test. D = KS test statistic. R = rings, ET = early trophozoites, LT = late trophozoites, S = schizonts, M = merozoites.
Figure 7—figure supplement 2
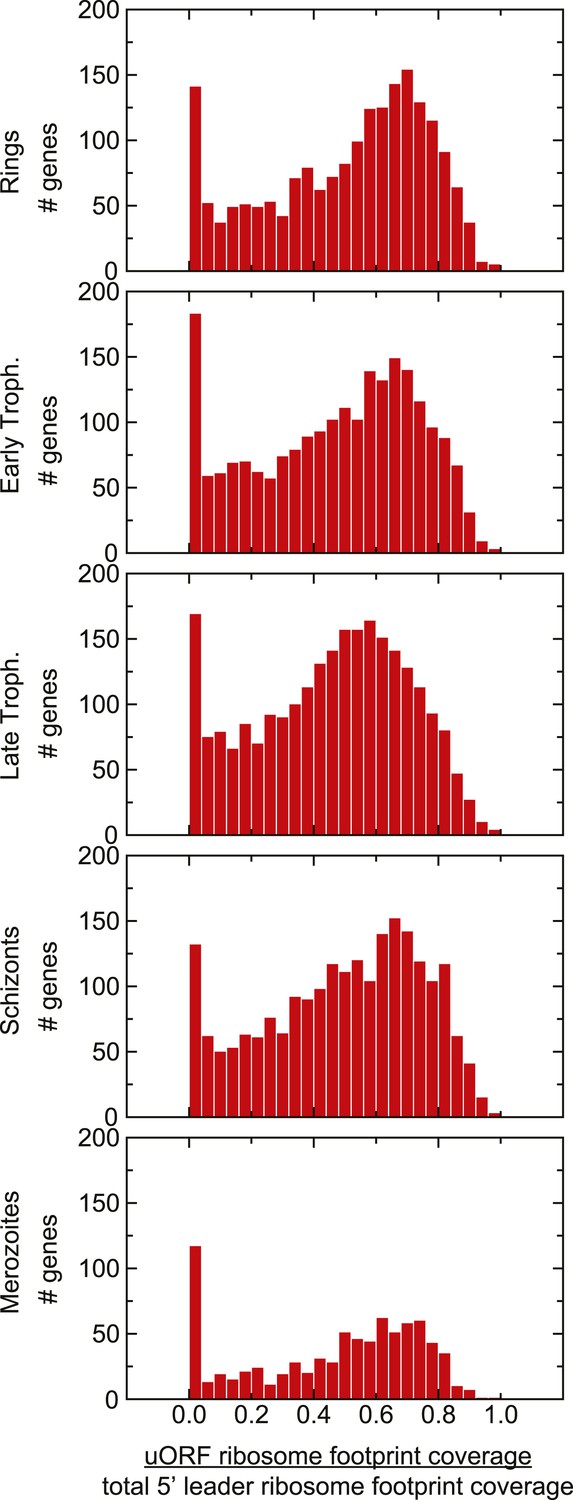
Distribution of uORF coverage on 5′ leaders of genes expressed during the IDC.
The proportion of ribosome footprints mapping inside predicted uORFs was calculated for each gene expressed in each stage. The median of each of these distributions is ∼0.5.
Figure 7—figure supplement 3
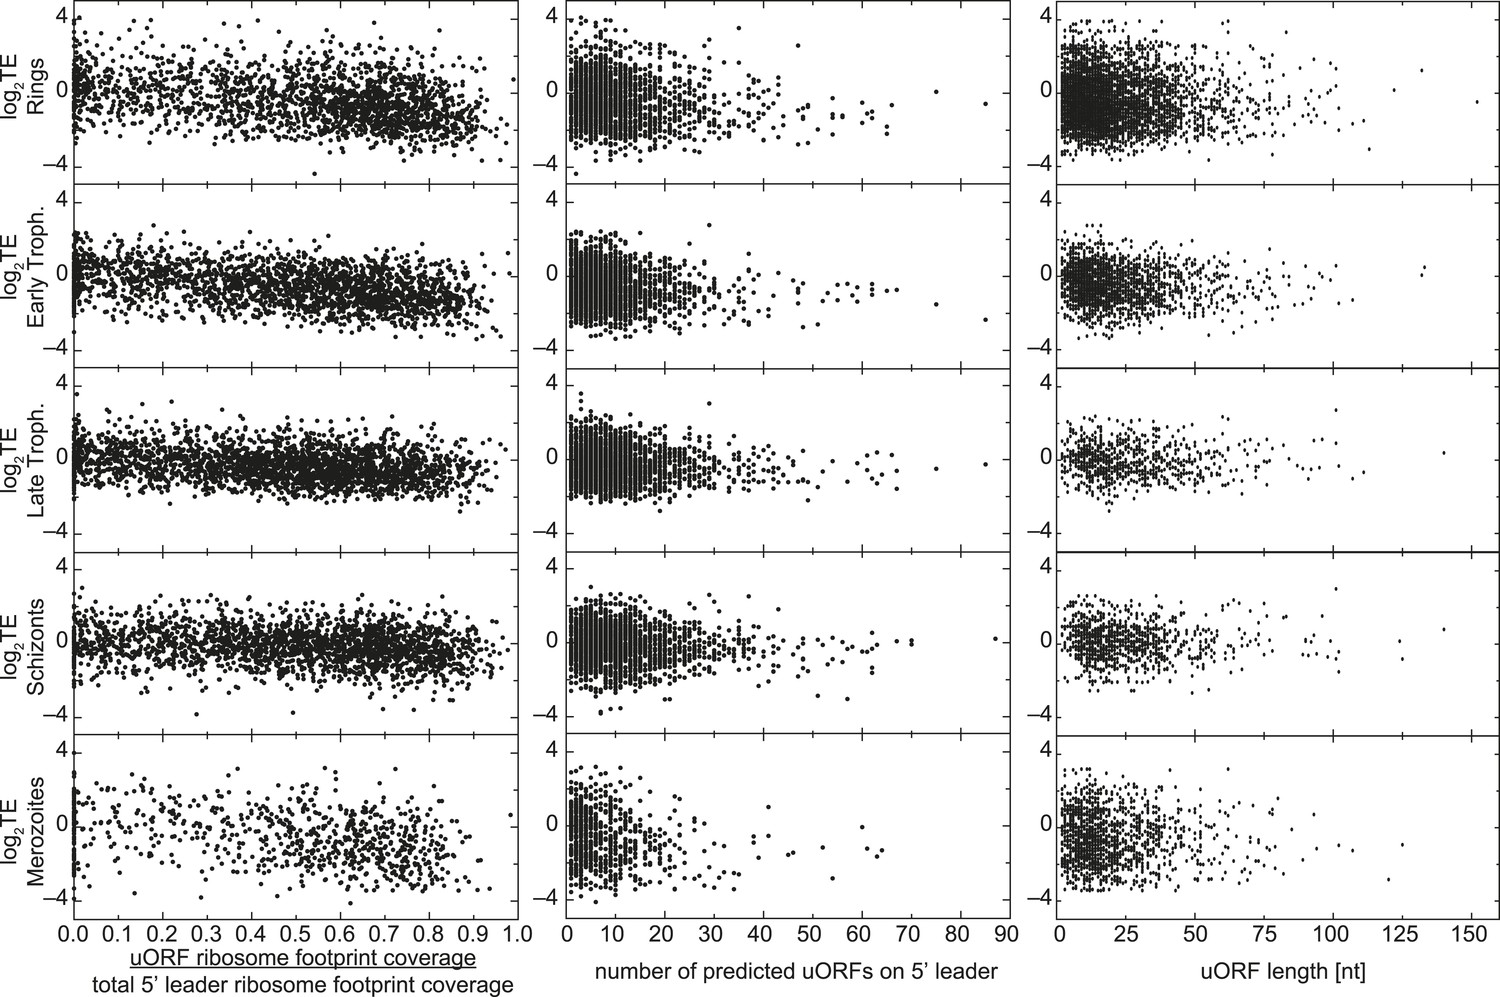
uORFs present on 5′ leaders have no effect on TE.
Translational efficiency (log2TE) for all genes expressed in each stage is plotted against the proportion of reads mapping within uORFs, the number of predicted uORFs, or the length of predicted uORFs in the 5′ leader. No direct relationship between these parameters can be observed.
Figure 7—figure supplement 4

Detection of ribosome density on uORFs.
(A) Ring stage mRNA (blue) and ribosome footprint (green) profiles of VAR2CSA (PFL0030c) are shown. There is virtually no ribosome density on transcript CDS (log2TERings = −4.2). Ribosomes do accumulate on the previously described (Amulic et al., 2009) 360 nt uORF (white box). This region is depicted in more detail in the panel below where the amino acids, AUGs and stop codons of each of the three reading frames are denoted with gray, green, and red bars, respectively. Note that ribosomes start accumulating upstream of the previously described uORF. Mappability at the 3′ end of this antigenic variation gene is poor and therefore no mRNA read coverage can be detected here. (B) Ring stage mRNA (blue) and ribosome footprint (green) profiles of PFE1550w (unknown function) are shown. Translational efficiency of the CDS is log2TERings = −3.6 in rings. 90% of ribosome footprints that map to the 5′ leader of this gene accumulate on one of the six predicted uORFs (detailed figure below). The predicted uORF is 168 nt (56 aa). Mappability = mappability score at that position; range 0 (white) to 30 (black). rM = coverage (reads per million reads mapped).
Figure 7—figure supplement 5
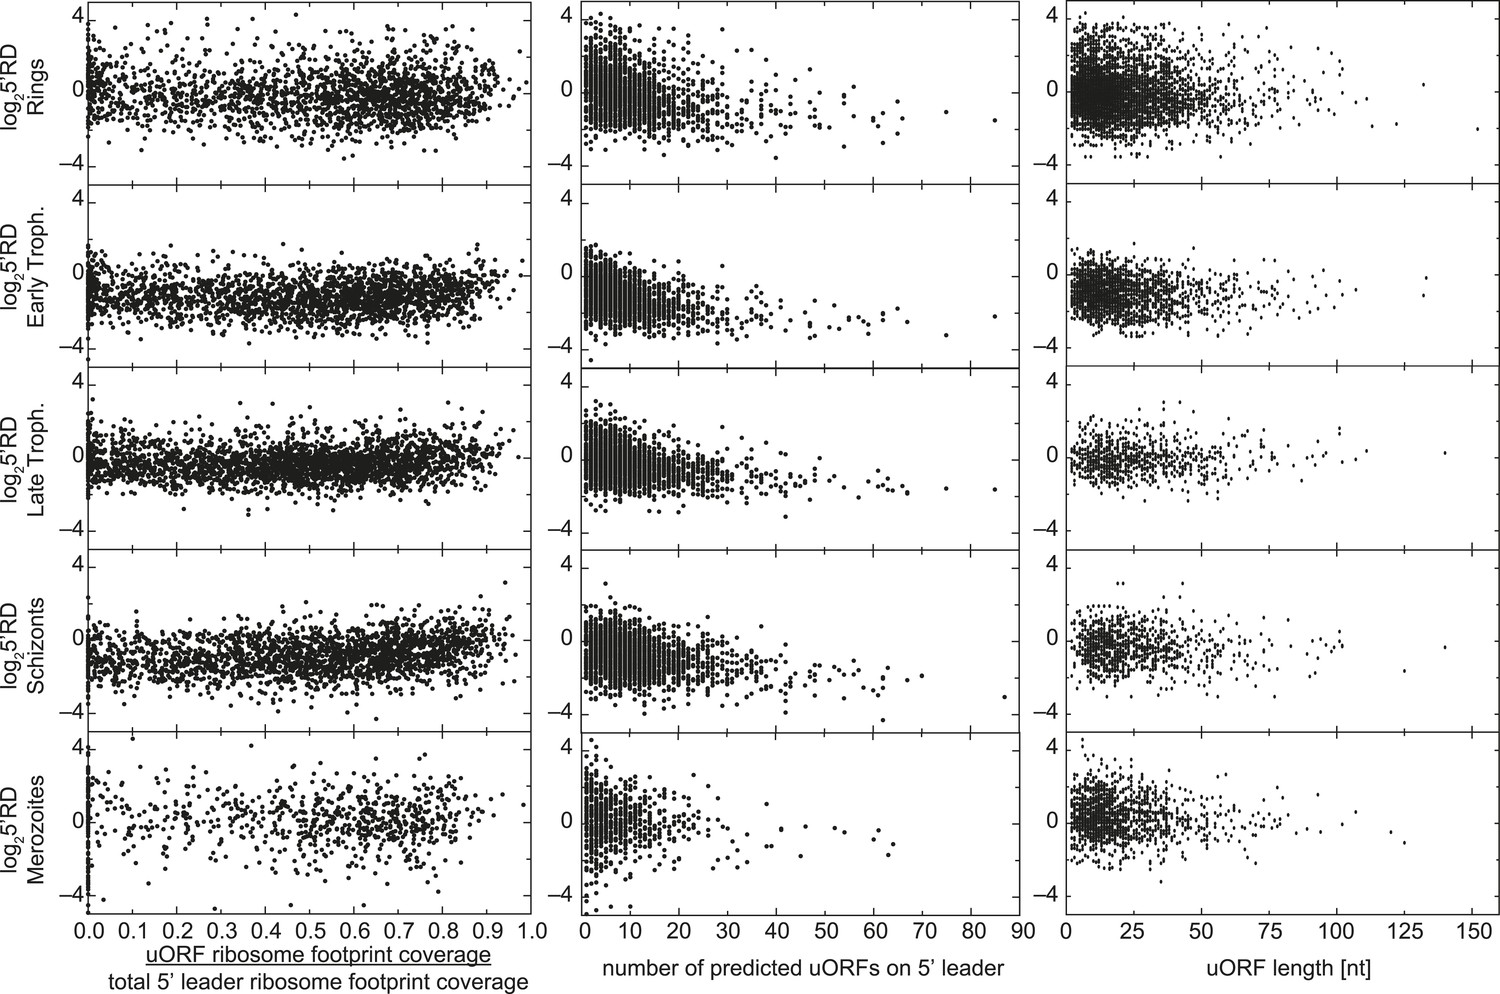
uORFs present on 5′ leaders have no effect on TE.
Ribosome density on the 5′ leader (log25′RD) for all genes expressed in each stage is plotted against the proportion of reads mapping within uORFs, the number of predicted uORFs, or the length of predicted uORFs in the 5′ leader. No direct relationship between these parameters can be observed.
Figure 7—figure supplement 6
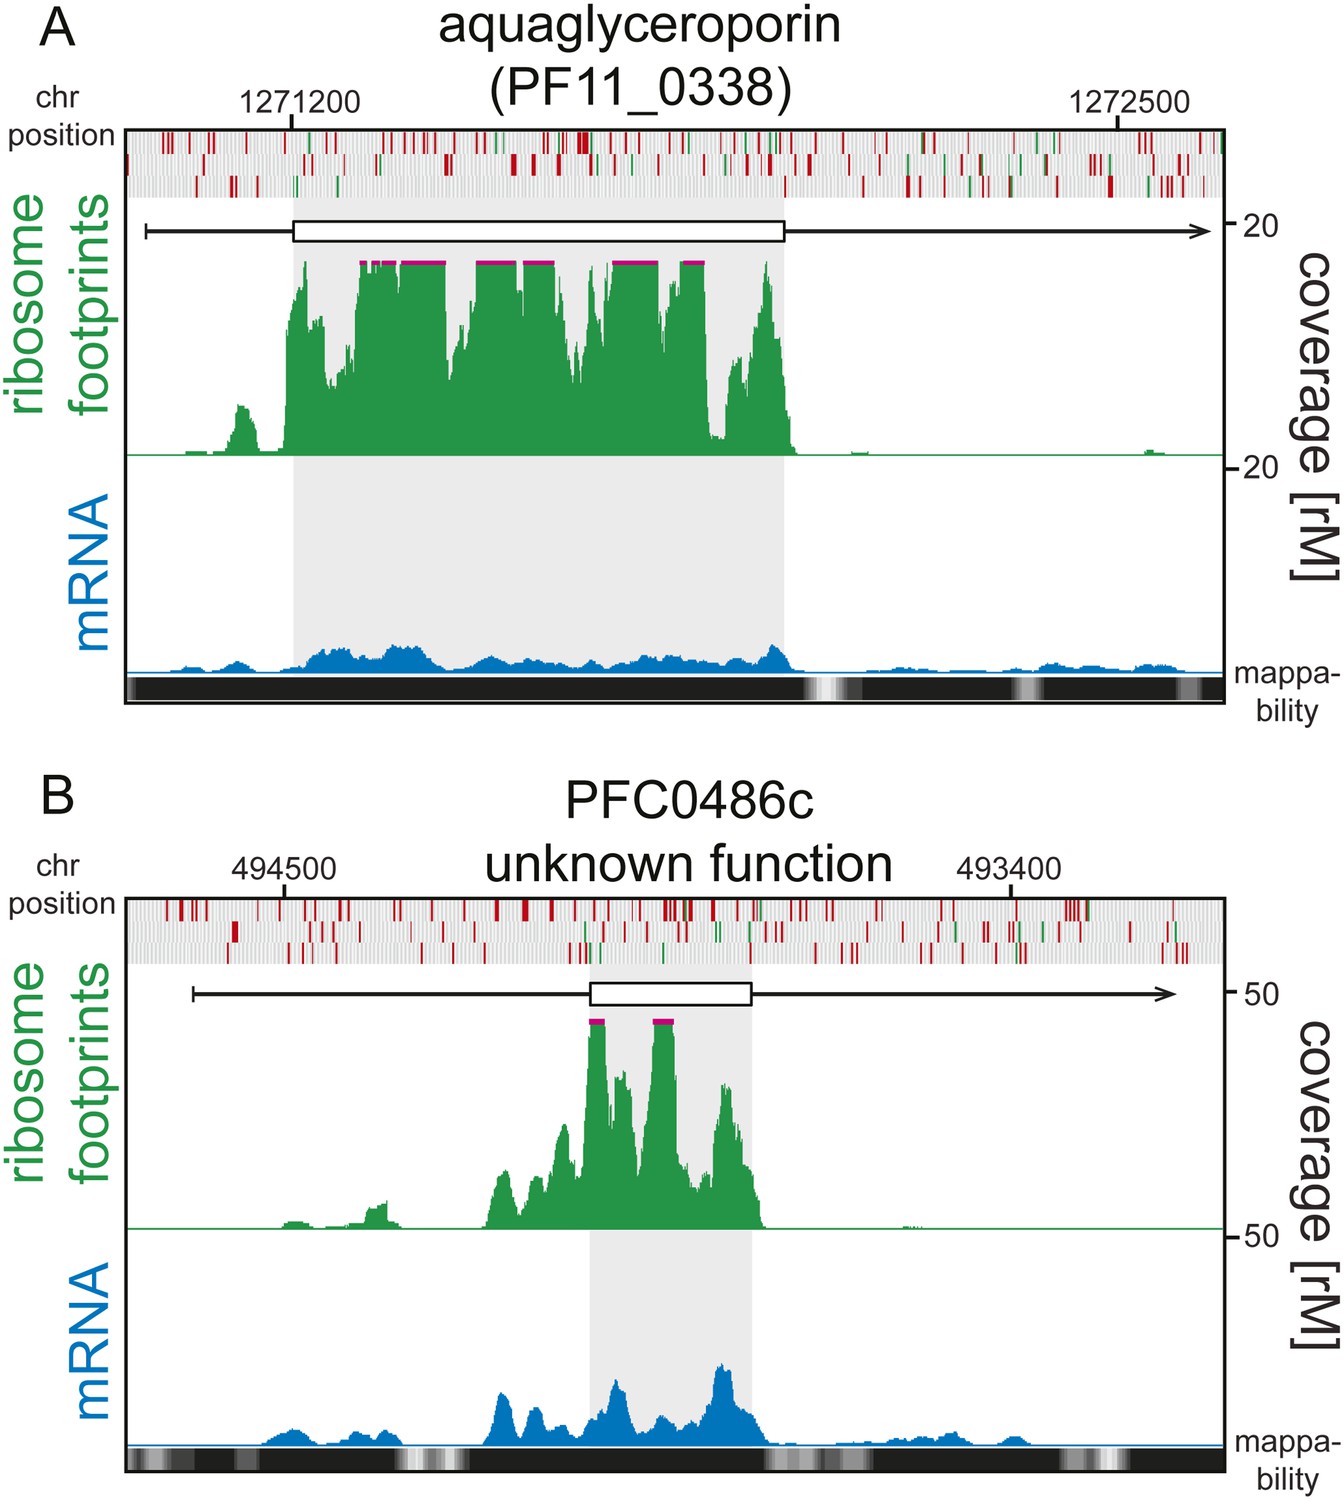
5′ ribosome density can be found on 5′ leaders devoid of AUGs.
Ring stage mRNA (blue) and ribosome footprint (green) profiles of (A) aquaglyceroporin (PF11_0338) and (B) PFC0486c (unknown function) are shown. Both genes display high ribosome density on their 5’ leaders and these are devoid of AUGs. Mappability = mappability score at that position; range 0 (white) to 30 (black). rM = coverage (reads per million reads mapped).
Figure 8
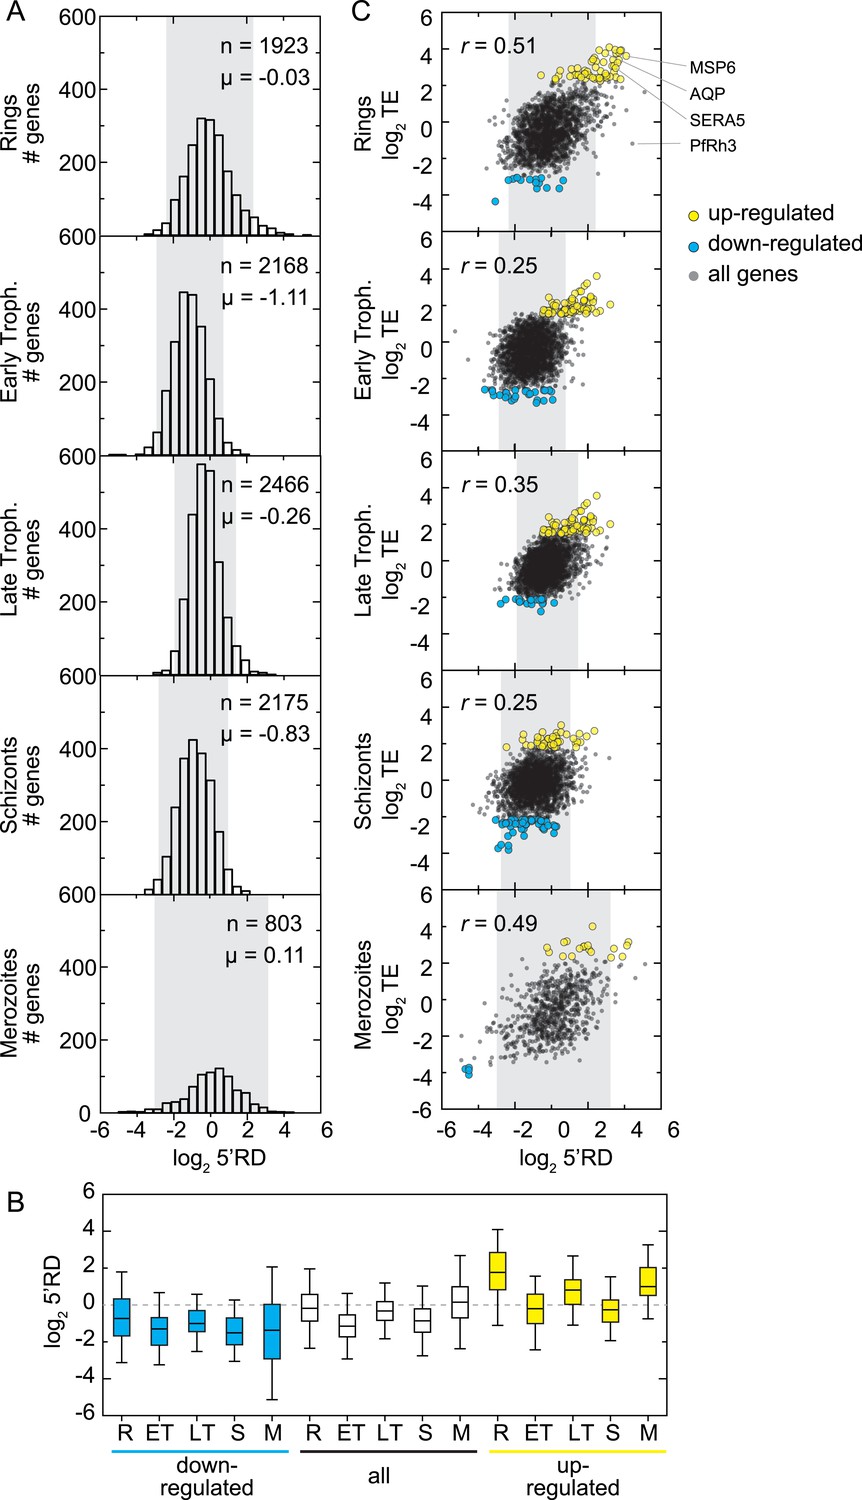
5′ ribosome density is commonly found on genes expressed during the IDC.
(A) 5′ RD distributions in each stage. Transcripts in rings and merozoites have on average higher 5′ RD values; ± 2 SD values lie outside gray shade. μ = mean log25′RD, n = total number of genes. (B) 5′RD values of the translationally up-regulated set of genes (yellow boxes) are relatively higher (average log25′RD R = 1.73, ET = −0.26, LT = 0.78, S = 0.30, M = 1.16.) than the rest (white boxes) or the set of down-regulated (blue buxes) genes. (C) 5′RD weakly correlates with translational efficiency. The translationally up-regulated gene set (yellow circles) is associated with high 5′RD, particularly in rings. The translationally up-regulated genes merozoite surface protein (MSP6), aquaglyceroporin (AQP), serine repeat antigen (SERA5), and the reticulocyte binding protein homologue 3 (PfRh3) are pointed out. r = Pearson correlation coefficient.
Figure 9 with 1 supplement
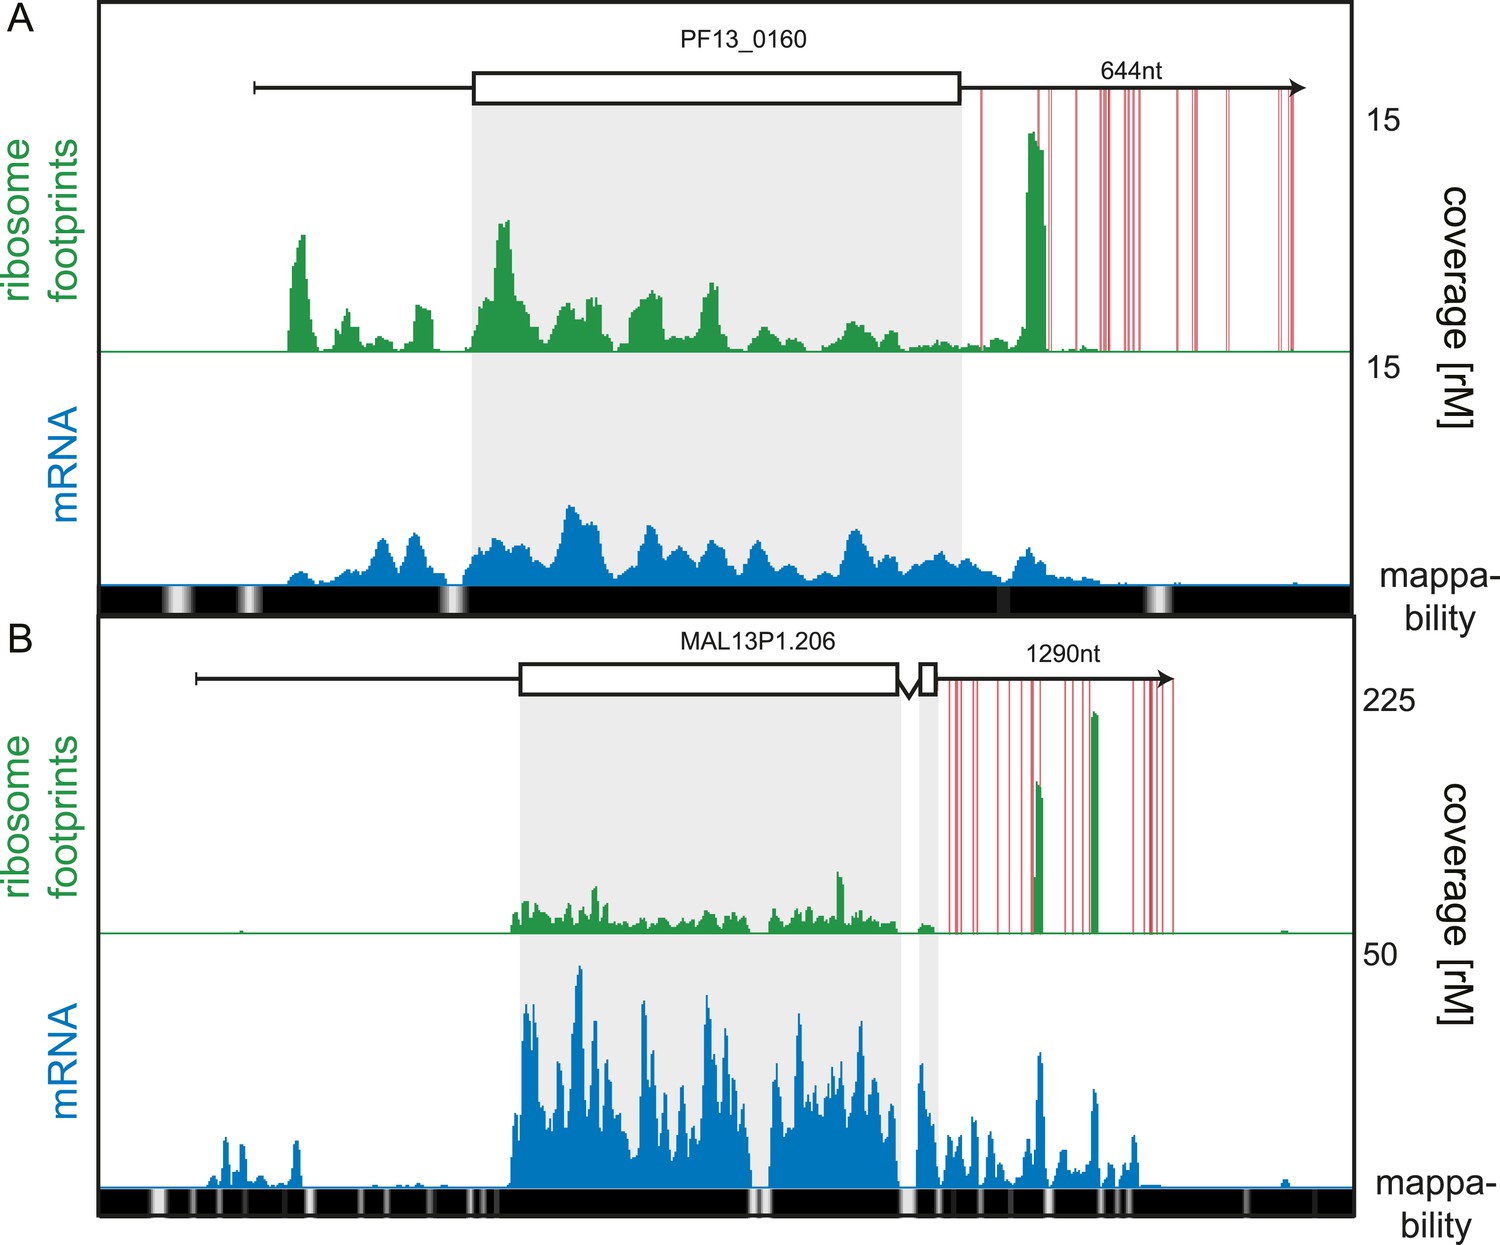
3′ UTR ribosome density.
(A) Late trophozoite stage mRNA (blue) and ribosome footprint (green) profiles of the conserved plasmodium protein, PF13_0160. Ribosomes can be detected up to ∼130 nt beyond the stop codon on the 3′ UTR and accumulate in a single large peak. Red lines indicate in-frame stop codons on the 3′ UTR. (B) Two large peaks of ribosome footprint density can be detected 560 nt and 860 nt downstream from the stop codon in the 3′ UTR of the sodium-dependent phosphate transporter, MAL13P1.206.
-
Figure 9—source data 1
Genes with 3′ UTR ribosome occupancy.
- https://doi.org/10.7554/eLife.04106.028
Figure 9—figure supplement 1
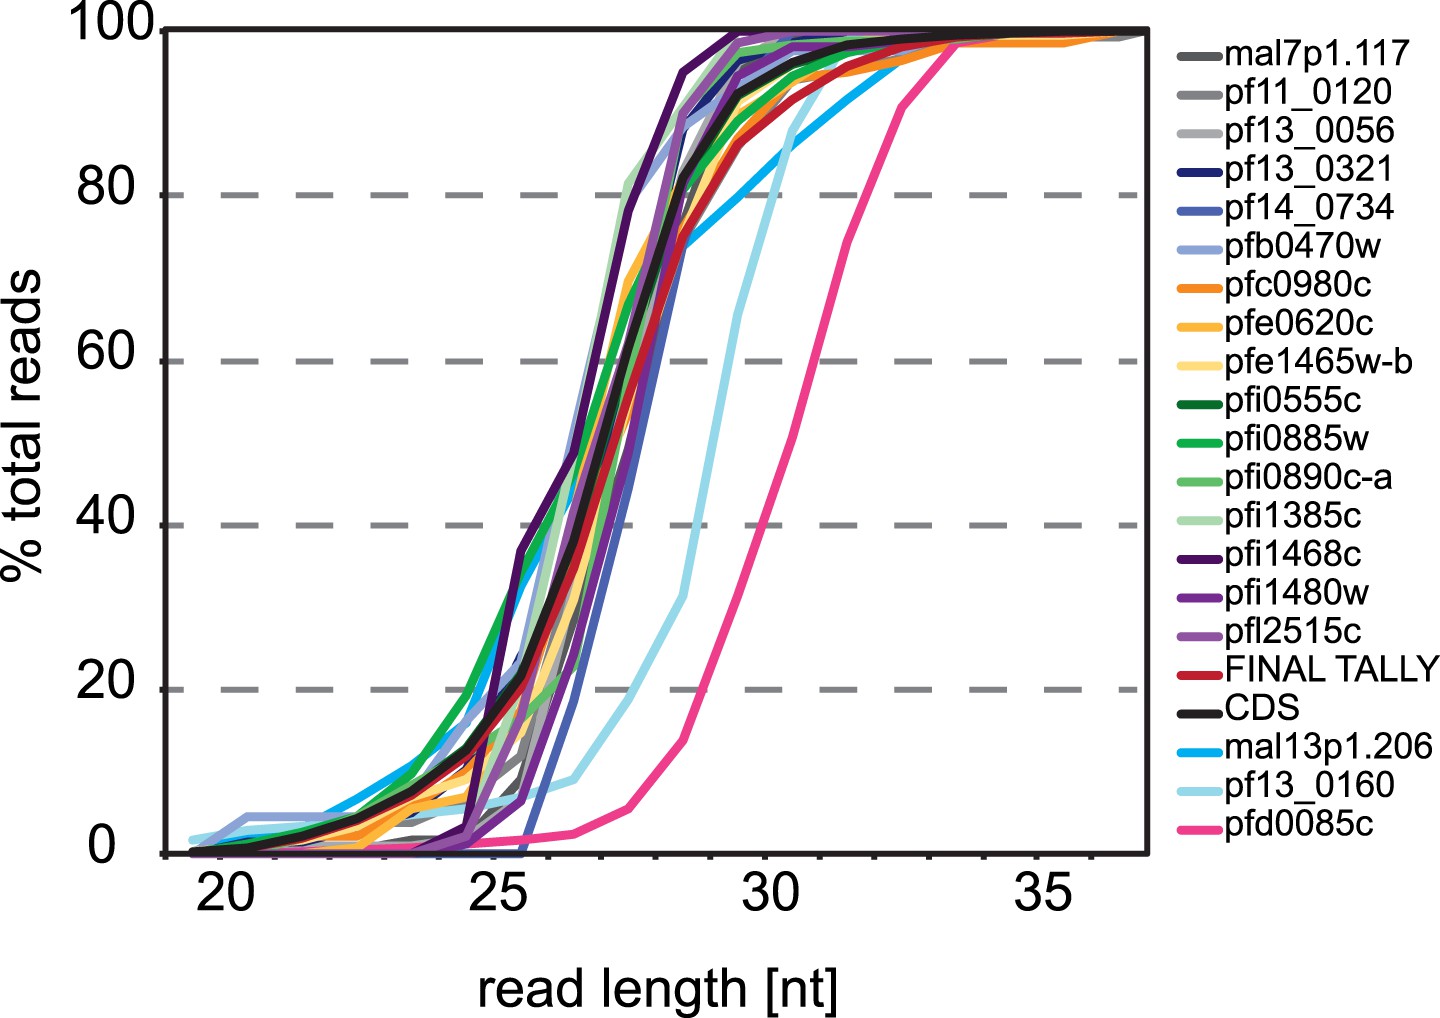
3′ UTR ribosome footprint size distribution.
Cummulative read length distributions of all reads mapping to the 3′ UTR of the 19 genes with 3′ ribosome density identified compared to the read length distributions of reads mapping to all CDSs in the late trophozoite stage (black line). Footprint length distributions for MAL13P1.206, PF13_0160, and PFD0085c are least similar to the ribosome footprints that map to the CDS.
Figure 10 with 1 supplement
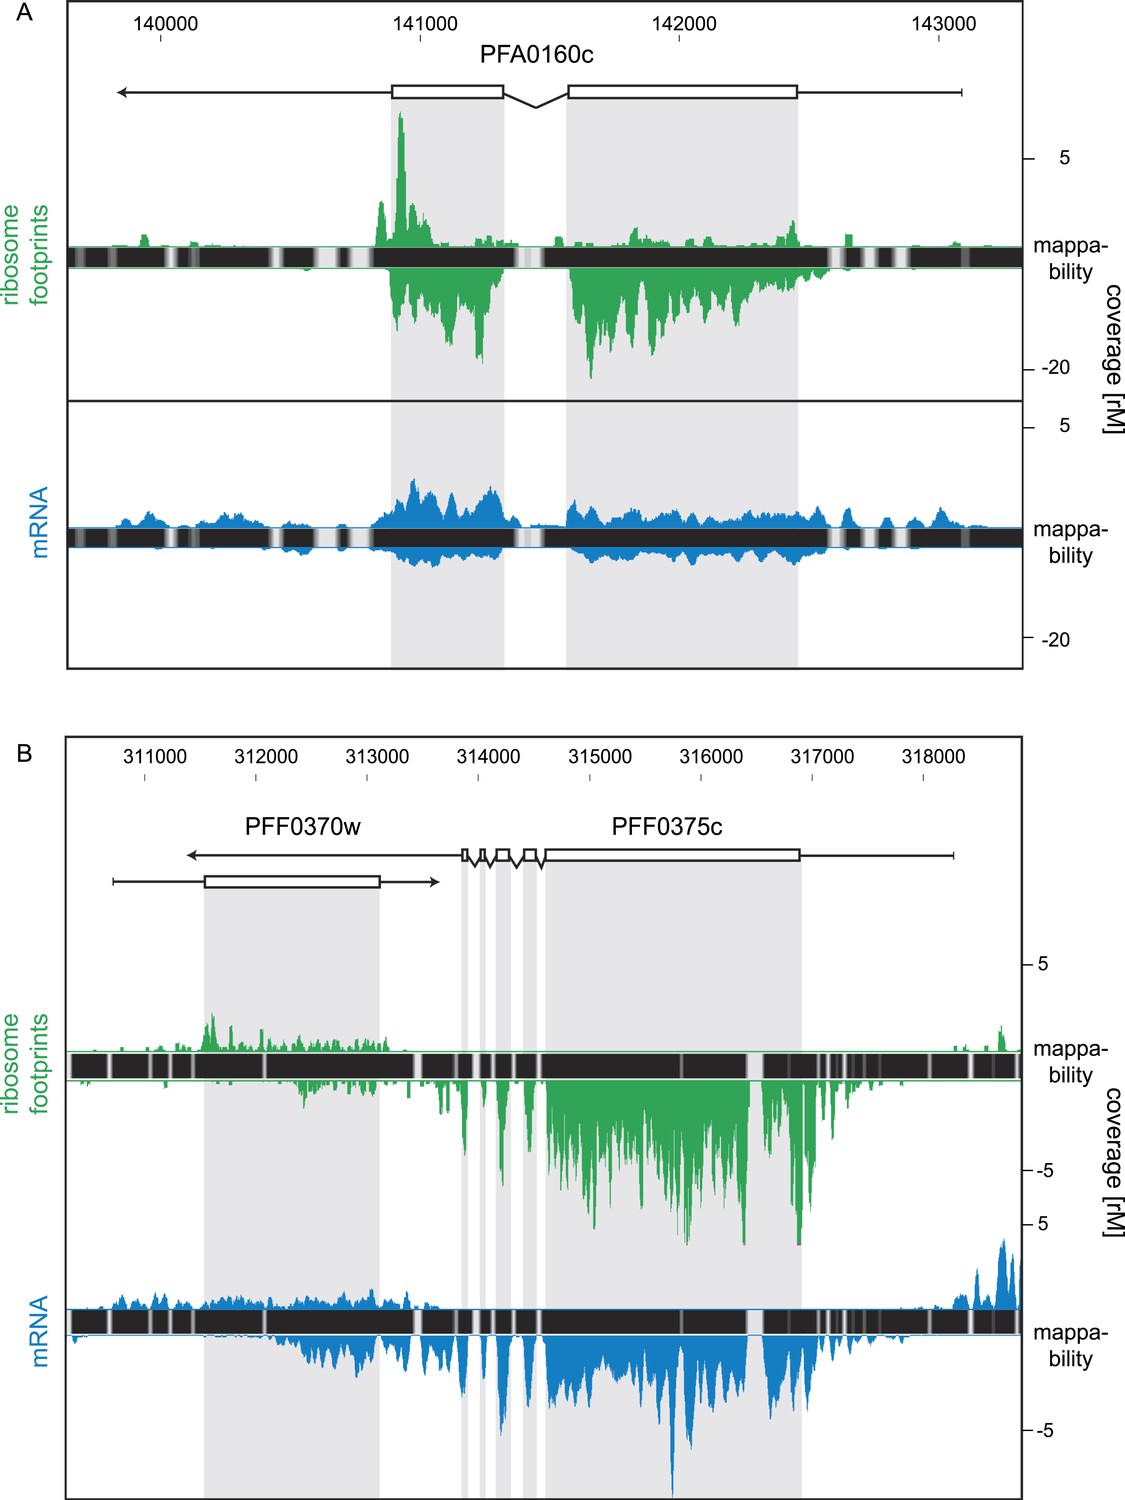
Strand-specific libraries can distinguish antisense from sense gene transcription.
(A) Schizont stage mRNA (blue) and ribosome footprint (green) profiles of the nucleoside transporter pfNT4 (PFA0160c). The antisense transcript covers the full extent of the sense transcript and displays ribosome density. (B) An example of antisense reads originating from a neighboring UTR in the schizont stage. The antisense reads in the para-hydroxybenzoate polyprenyltransferase (PFF0370w) stem from the 3′ UTR of the neighboring conserved plasmodium protein (PFF0375c).
-
Figure 10—source data 1
Antisense transcripts.
- https://doi.org/10.7554/eLife.04106.031
Figure 10—figure supplement 1
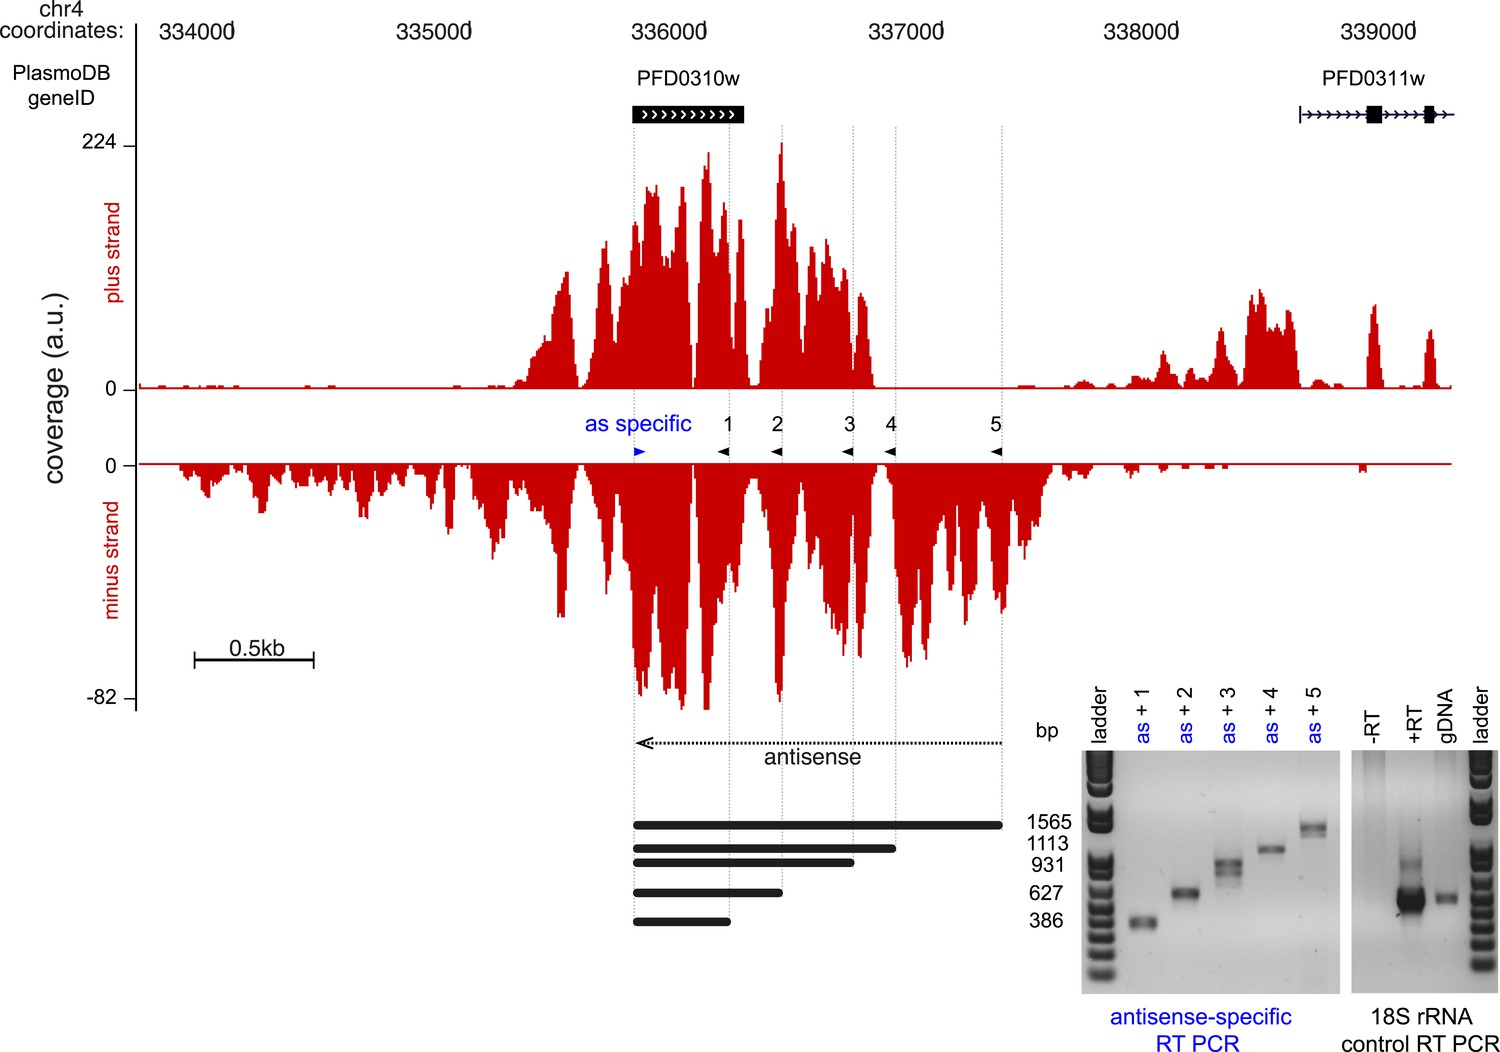
Strand-specific RT-PCR detection of the antisense to Pfs16.
Read coverage on the plus and minus strand of the stage-specific protein precursor Pfs16 (PFD0310w) locus. The gene is encoded on the plus strand and the antisense transcript covers and extends beyond the sense transcript ∼3.7 kb. The strand-specific primer was used for both reversetranscription and as forward primer for the PCR (blue arrowhead). The 5 PCR primers (black arrowhead) and the expected amplicon sizes are shown next to the strand-specific RT-PCR results. 18S rRNA primers were used in the control reactions. a.u. = arbitrary units.
Author response image 1

Author response image 2
Additional files
-
Supplementary file 1
MochiView genome browser data tracks.
- https://doi.org/10.7554/eLife.04106.033
-
Supplementary file 2
RESA2 mapping reads.
- https://doi.org/10.7554/eLife.04106.034
-
Supplementary file 3
Strand-specific RT-PCR primers.
- https://doi.org/10.7554/eLife.04106.035
Download links
A two-part list of links to download the article, or parts of the article, in various formats.
Downloads (link to download the article as PDF)
Open citations (links to open the citations from this article in various online reference manager services)
Cite this article (links to download the citations from this article in formats compatible with various reference manager tools)
Genome-wide regulatory dynamics of translation in the Plasmodium falciparum asexual blood stages
eLife 3:e04106.
https://doi.org/10.7554/eLife.04106


