Decoding odor quality and intensity in the Drosophila brain
- Max Planck Institute for Chemical Ecology, Germany
- Free University Berlin, Neuroinformatics and Theoretical Neuroscience, Germany
Figures
Figure 1 with 2 supplements
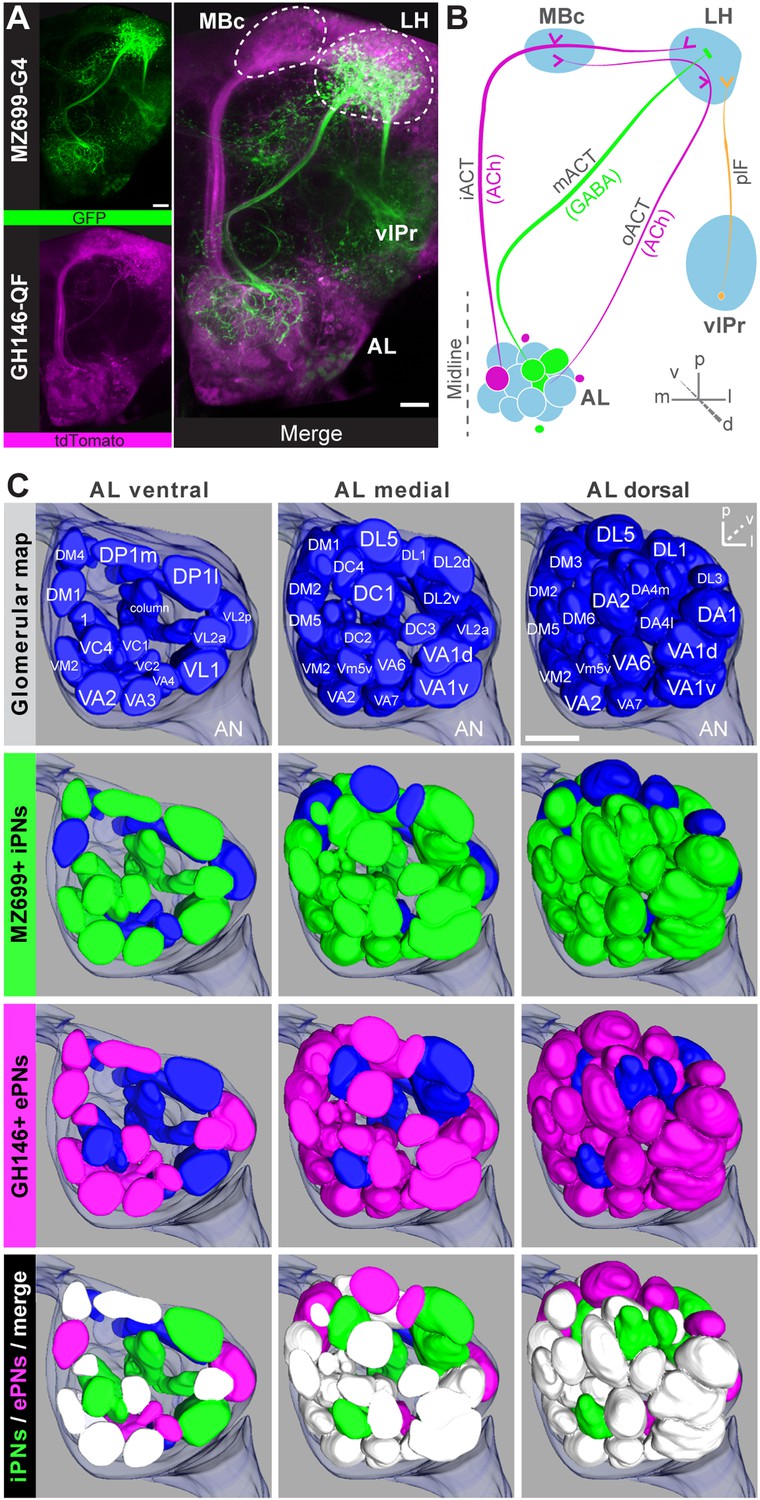
Detailed glomerular innervations of excitatory and inhibitory projection neurons in the AL.
(A) Simultaneous labeling of inhibitory projections neurons (iPNs, labeled by MZ699-GAL4;G-CaMP) and excitatory projection neurons (ePNs, labeled by GH146-QF;tdTomato) in vivo reveals distinct projections to the lateral horn (LH). All iPNs bypass the mushroom body calyx (MBc) and innervate the LH exclusively. The MZ699 line labels a few ventrolateral protocerebral neurons (vlPr neurons) projecting via the posterior lateral fascicle (plF) from the ventrolateral protocerebrum (vlPr) to the LH. (B) Schematic of the PN connectivity relay from the antennal lobe (AL) to higher brain centers (ePNs in magenta, iPNs in green, and vlPr neurons in orange). (C) Above, complete glomerular assignment of the AL neuropil (right AL), labeled with elav-n-synaptobrevin:DsRed (END1-2). Below, glomerular innervations of both PN populations related to in vivo images in Figure 1—figure supplement 2. Depicted are the ventral level (∼−40 µm), the medial level (∼−20 µm) and the dorsal view onto the AL. Color annotation: blue glomeruli are not innervated by any of the used GAL4-lines; green glomeruli are innervated by MZ699+ iPNs and magenta by GH146+ ePNs; white glomeruli are innervated by both enhancer trap lines. Scale bar, 20 µm.
Figure 1—figure supplement 1
Characterization of excitatory and inhibitory projection neurons.
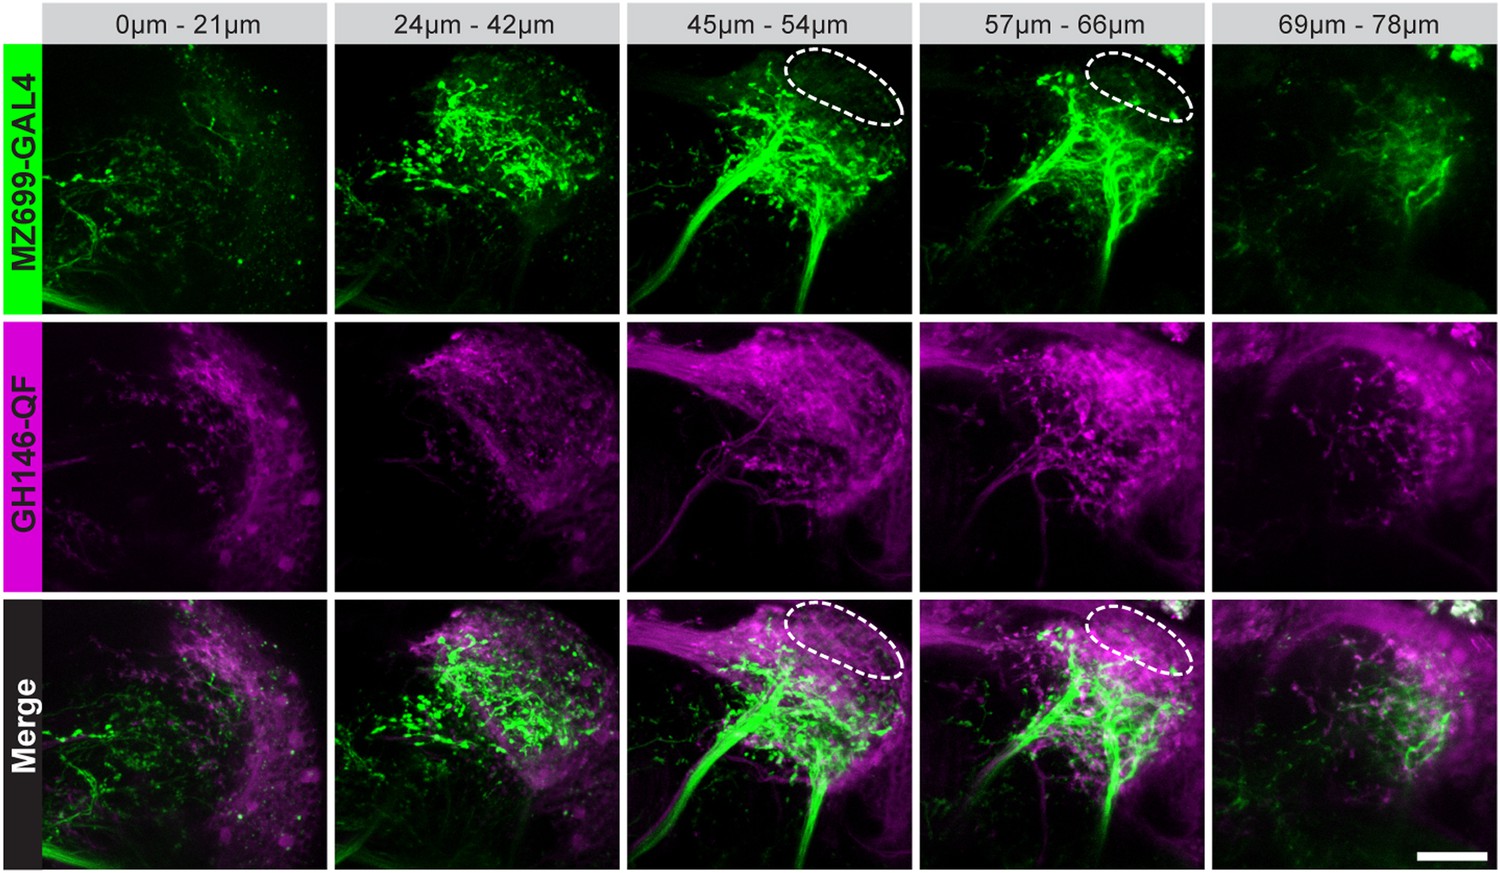
Overlap of ePNs (QUAS-tdTomato) and iPNs (UAS-GCaMP3.0) in the LH area. The circle indicates the posterior lateral region, which is sparsely innervated by iPNs and dominated by ePN axonal terminal fields. Scale bar, 20 µm.
Figure 1—figure supplement 2
Glomerular innervations of ePNs and iPNs.
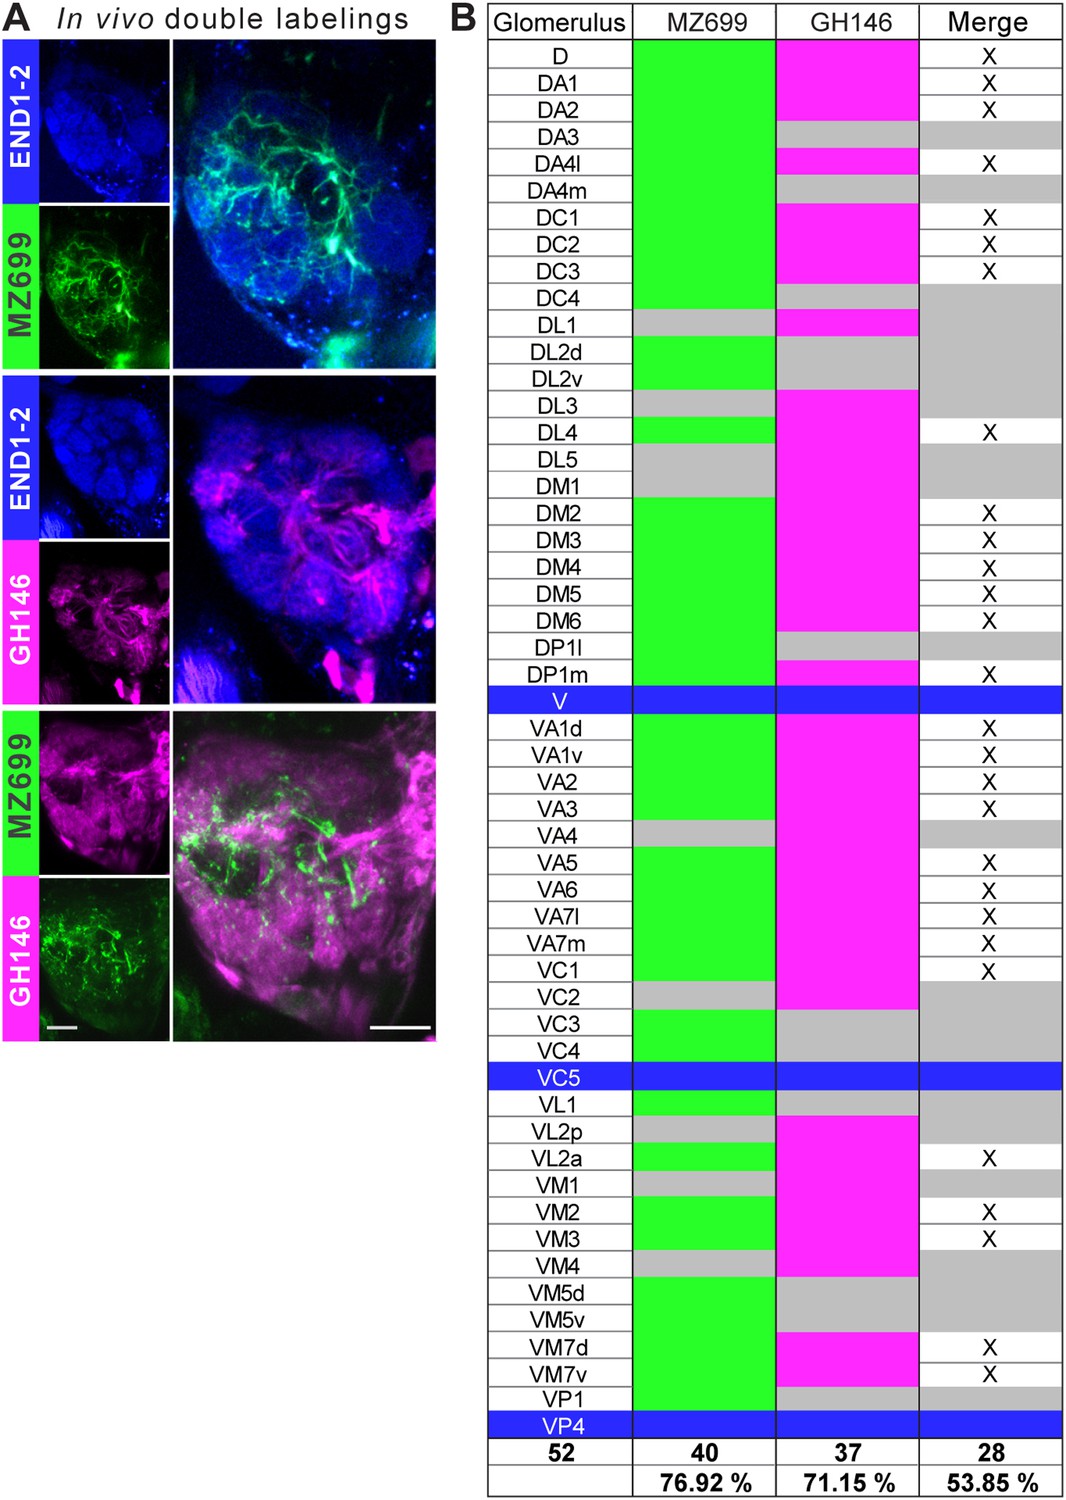
(A) Representative in vivo images of glomerular innervations. MZ699- and GH146-GAL4 lines have been reconstructed with the END1-2 background staining (two upper planes) and dual labeling via the Q-system and the GAL4-UAS expression system (lowest plane). Scale bar, 20 µm. (B) Detailed glomerular AL innervation. Green filled cells indicate innervation by MZ699-GAL4, magenta GH146-GAL4 innervation, respectively and grey, no innervation by the indicated line. Bottom rows, total number of innervated glomeruli with percentage share indicated below. Merge column: white filled with ‘x’ indicates glomeruli innervated by both lines, grey only one line. Blue filled rows are glomeruli labeled by none of the enhancer trap lines.
Figure 2 with 3 supplements
Odors evoke specific and stereotypic calcium responses in the LH subdivided into three distinct odor response domains.
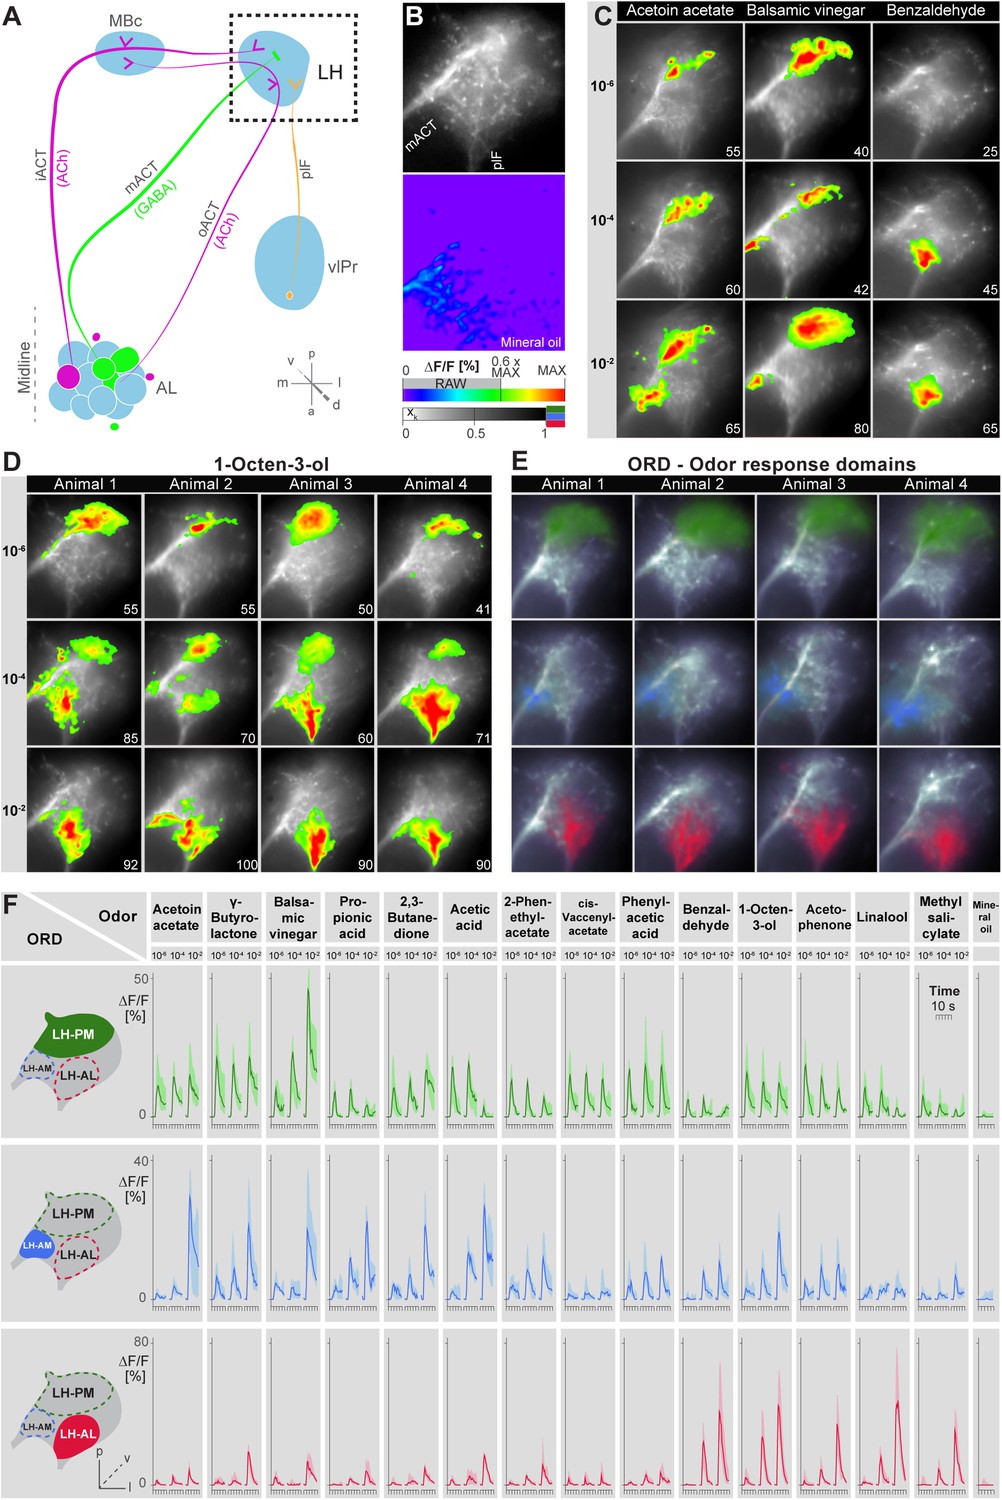
(A) Schematic of the olfactory circuit with the investigated area highlighted. (B) RAW image of the LH (top picture) depicting the recorded area of figures (C–E) and the false color image (bottom picture) during the solvent application. The ΔF/F scale bar applies for all false color-coded pictures; the alpha-bar for the pixel participation xk of the indicated colors applies for (E–F). (C) Representative LH Ca2+ responses (ΔF/F%) of acetoin acetate, balsamic vinegar and benzaldehyde at three concentrations. Numbers in the lower right corner indicate individual maxima. (D) Odor-evoked Ca2+ responses (ΔF/F%) are exemplarily depicted for 1-octen-3ol- at three concentrations in four animals. (E) NNMF-extracted LH odor response domains (ORD) of four representative animals: three LH ORDs were fully reproducible after being extracted from all measured animals. Domains classified as identical are similarly color-coded: the green ORD is located in the posterior-medial region of the LH (LH-PM); blue, in the anterior-medial (LH-AM), and red in the anterior-lateral LH area (LH-AL). The alpha-bar for green, blue and red shades is placed in (B). (F) Left, schematic outlines of the LH with indicated ORDs. Right, median activity traces of all odors at three concentrations are depicted for each colored ORD. Shadows represent lower and upper quartiles (n = 6–7).
Figure 2—figure supplement 1
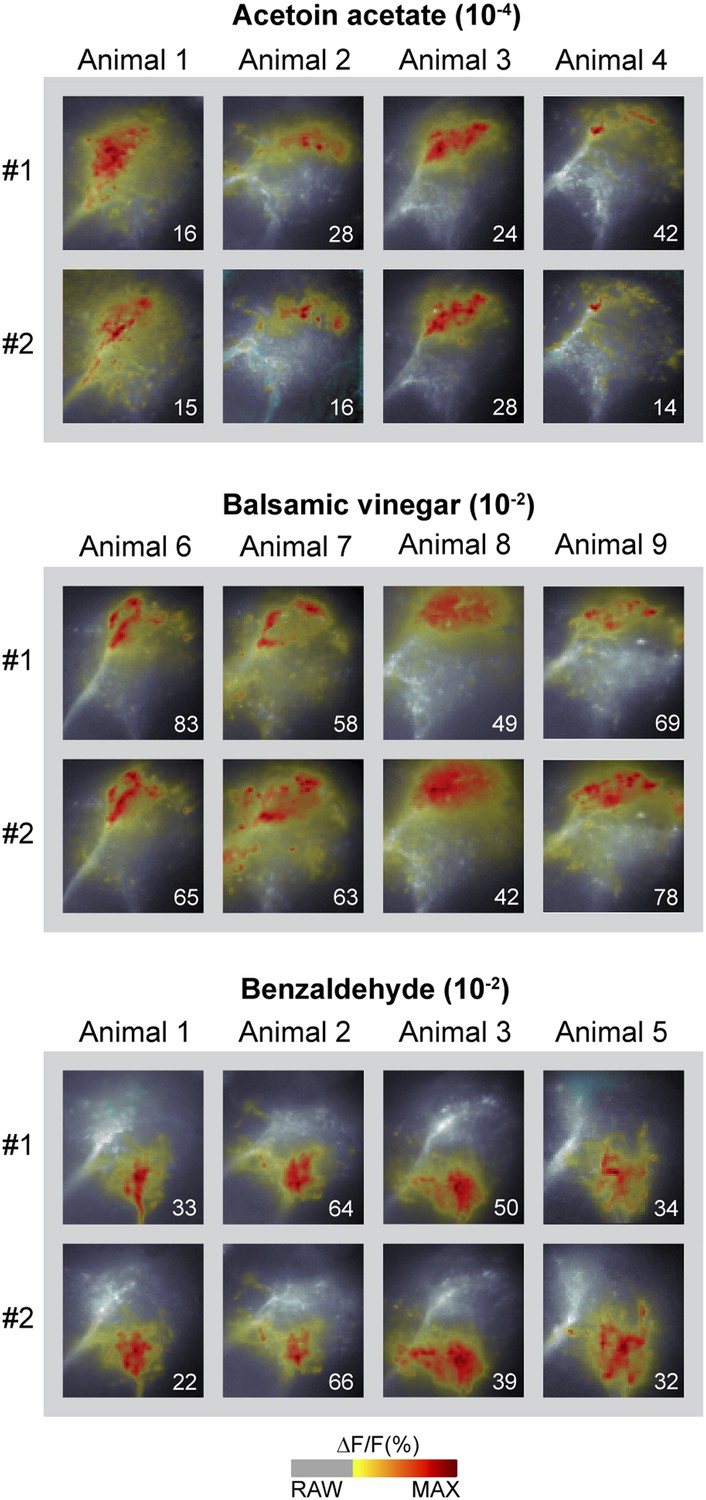
Odor-evoked activity patterns in the LH are reproducible and stereotypic.
Odor-evoked Ca2+ responses (ΔF/F%) in the LH for the three odors acetoin acetate, balsamic vinegar and benzaldehyde in four animals are shown as false-color coded images. Two measurements in each animal are given to reveal that the activity patterns are highly reproducible within one animal. Comparison between the patterns among individuals shows that the activity regions are stereotypic. Numbers in the lower right corner indicate individual maxima. The ΔF/F scale bar is shown at the bottom.
Figure 2—figure supplement 2
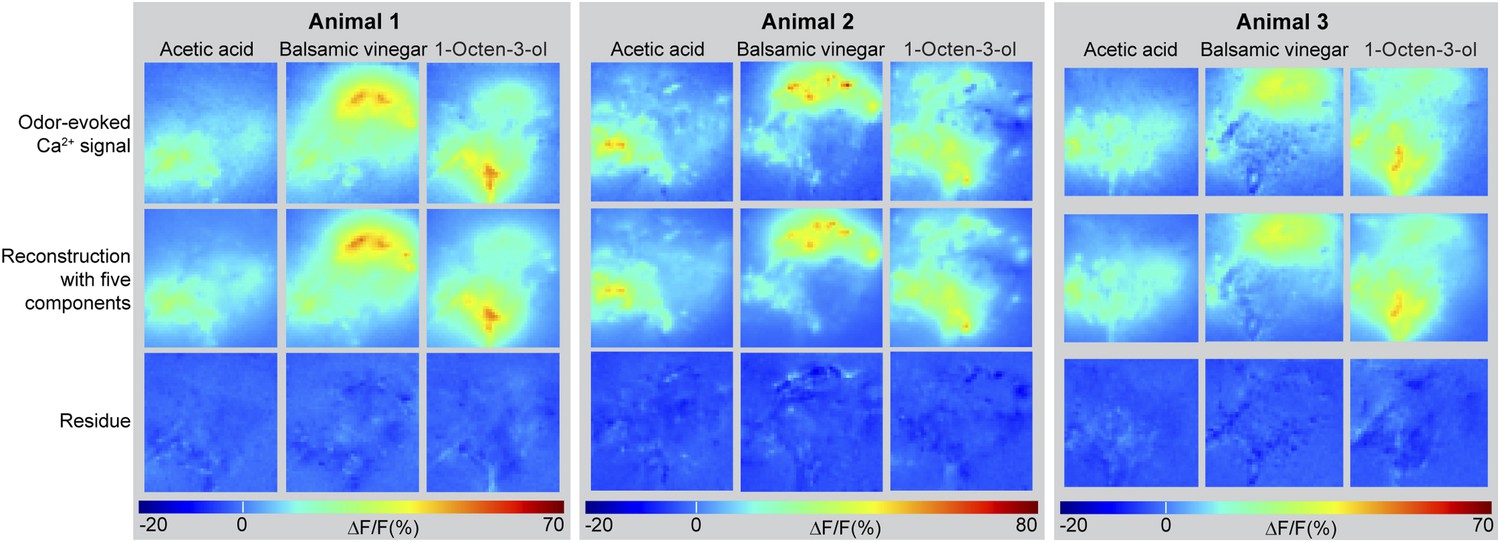
Odor-evoked activity patterns in the LH can be reconstructed with five components.
Above, Odor-evoked Ca2+ responses (ΔF/F%) in the LH for the three odors acetic acid, balsamic vinegar and 1-octen-3-ol in three animals are shown as false-color coded images. The ΔF/F scale bar is shown at the bottom. Middle, activity patterns were reconstructed using NNMF with five components. Below, residue of the pattern reconstructions with five components (as shown in the middle panel) revealing that no stimulus related activity remained.
Figure 2—figure supplement 3
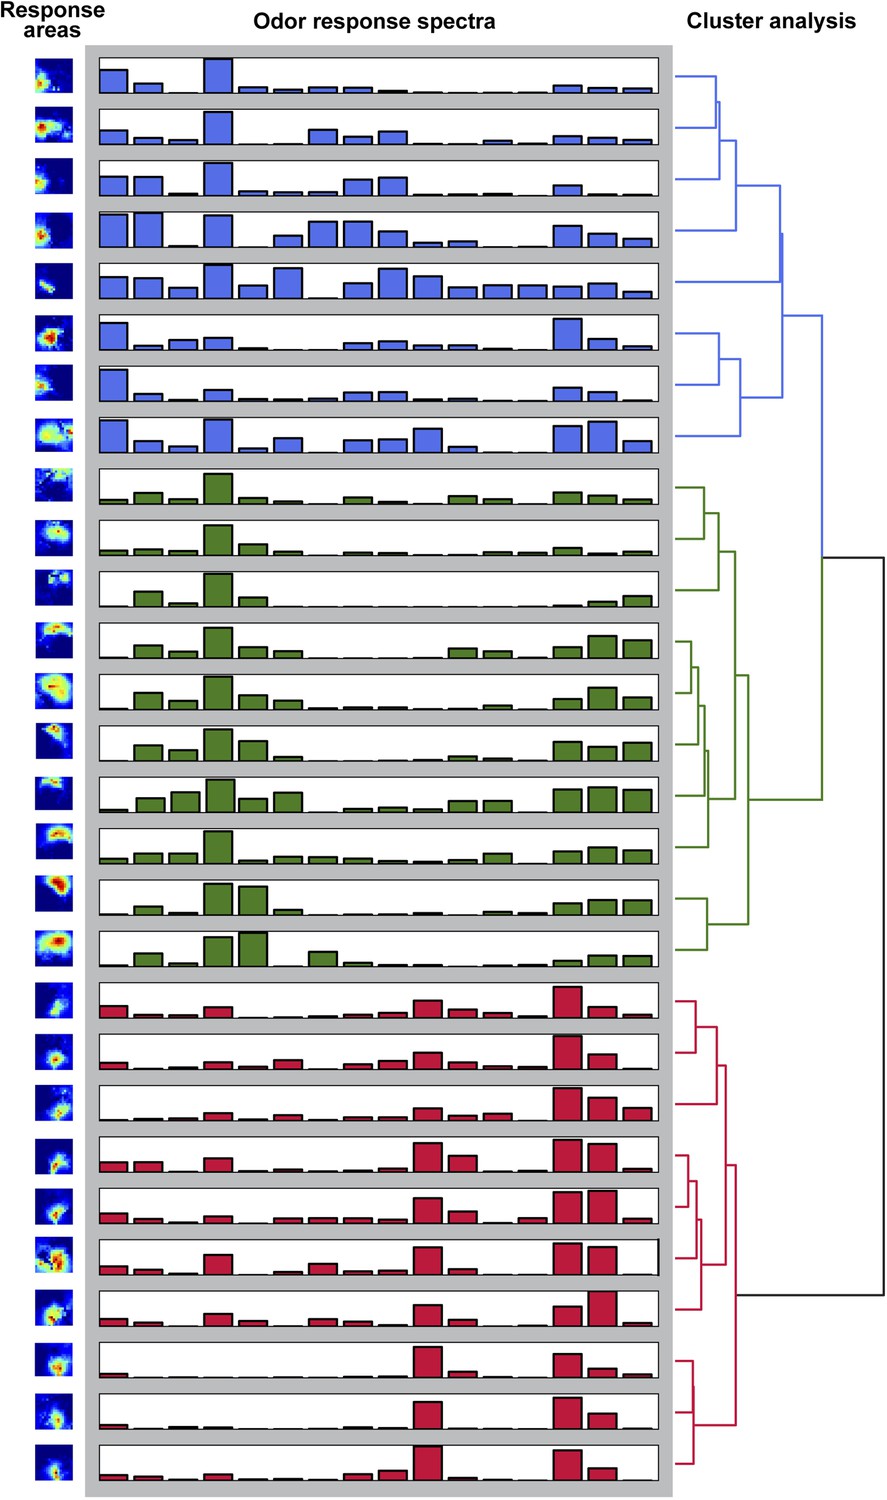
Odor-evoked activity patterns in the LH cluster into three components.
Hierachichal clustering (UMPGA) of the odor response spectra of the NNMF components with a reliable stimulus response (trial-to-trial correlation >0.7, that is, 28 out of 35 components in seven animals). The response spectra segregate into three distinct clusters according to their stimulus response spectra. The corresponding response areas (left pictures) are located in similar regions of the LH.
Figure 3 with 2 supplements
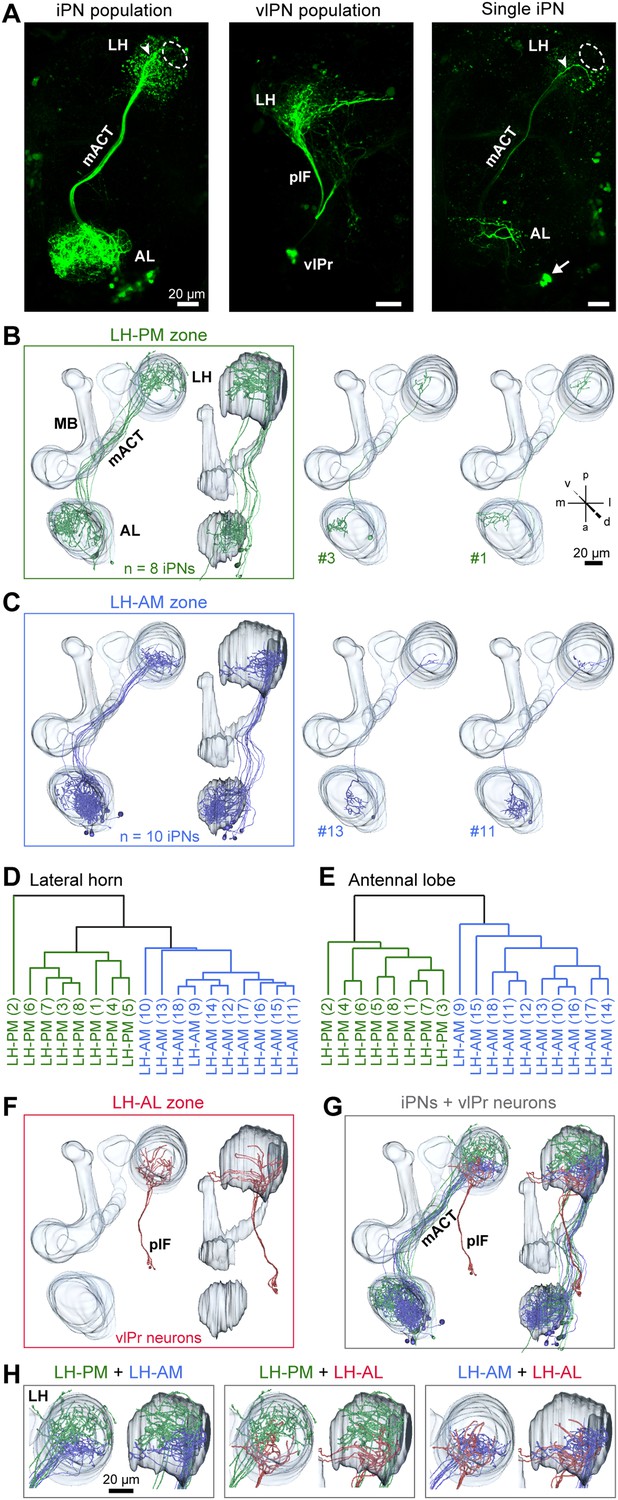
iPNs can be classified according to their projection pattern in three distinct LH zones.
(A) Complete population of MZ699+ iPNs labeled using PA-GFP (left image), the posterior-lateral LH region is encircled, arrowhead indicates the final common projection point of iPN axons. Middle image: photoactivation of all vlPr neurons of the MZ699-GAL4 line that project from the LH to the vlPr via the plF. Right image: exemplary single iPN, labeled by photoconverting PA-GFP in a single soma (arrow). Scale bar, 20 µm. (B) Framed images: neuronal reconstructions of all iPNs projecting to the LH-PM zone (n = 8) with outlined olfactory neuropils. View from dorsal (left) and lateral (right). Right part represents two exemplary registered individual iPNs. (C) Neuronal reconstructions of all iPNs projecting into the LH-AM zone (n = 10), images are arranged as in (B). (D and E) Cluster analyses based on the target areas of all terminals of each iPN in the LH (D) or based on the innervated glomeruli in the AL (E). The dendrograms are split into colored subclusters. Below each dendrogram, each individual iPN is specified according to the labels in Figure 3—figure supplement 2. Note, that iPNs can be morphologically clustered according to their target or input regions. (F) Neuronal reconstruction of vlPr neurons projecting through the plF to the LH-AL zone. (G) Combination of all registered neurons. (H) Dual combinations of all registered neurons with their projections in the LH.
Figure 3—figure supplement 1
iPNs can be morphologically segregated according to their target and input region.
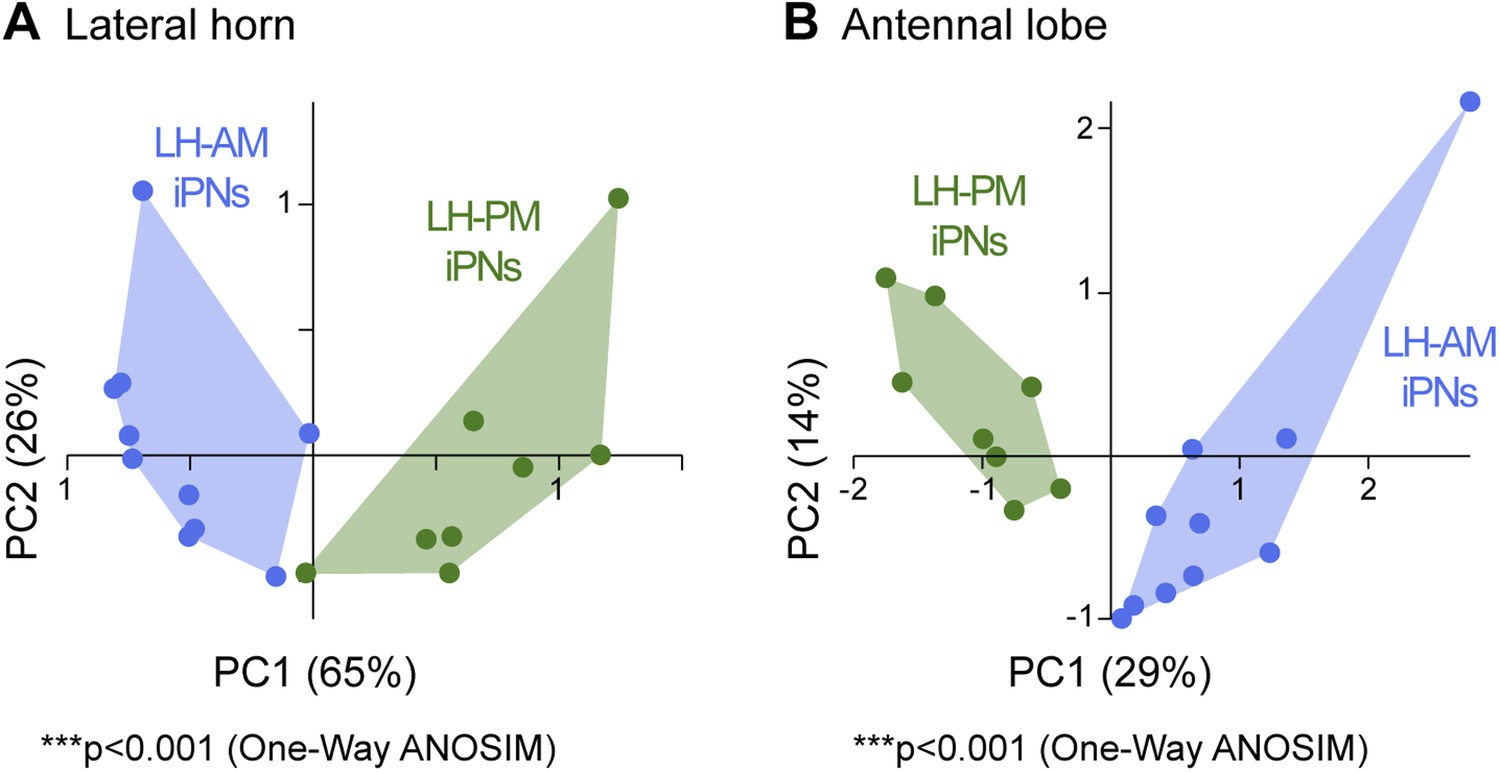
(A) Principal component analysis based on the distances of the similarity scores of all terminal points of each individual iPN in the LH (for details see ‘Materials and methods’). LH-AM iPNs (blue) and LH-PM iPNs (green) form significantly distinct clusters (***p < 0.001, One-Way ANOSIM, Bray–Curtis). (B) Principal component analysis based on the glomerular innervations of each individual iPN in the AL. Again, LH-AM iPNs (blue) and LH-PM iPNs (green) form significantly distinct clusters (***p < 0.001, One-Way ANOSIM, Bray–Curtis).
Figure 3—figure supplement 2
Glomerular innervations of individual iPNs.
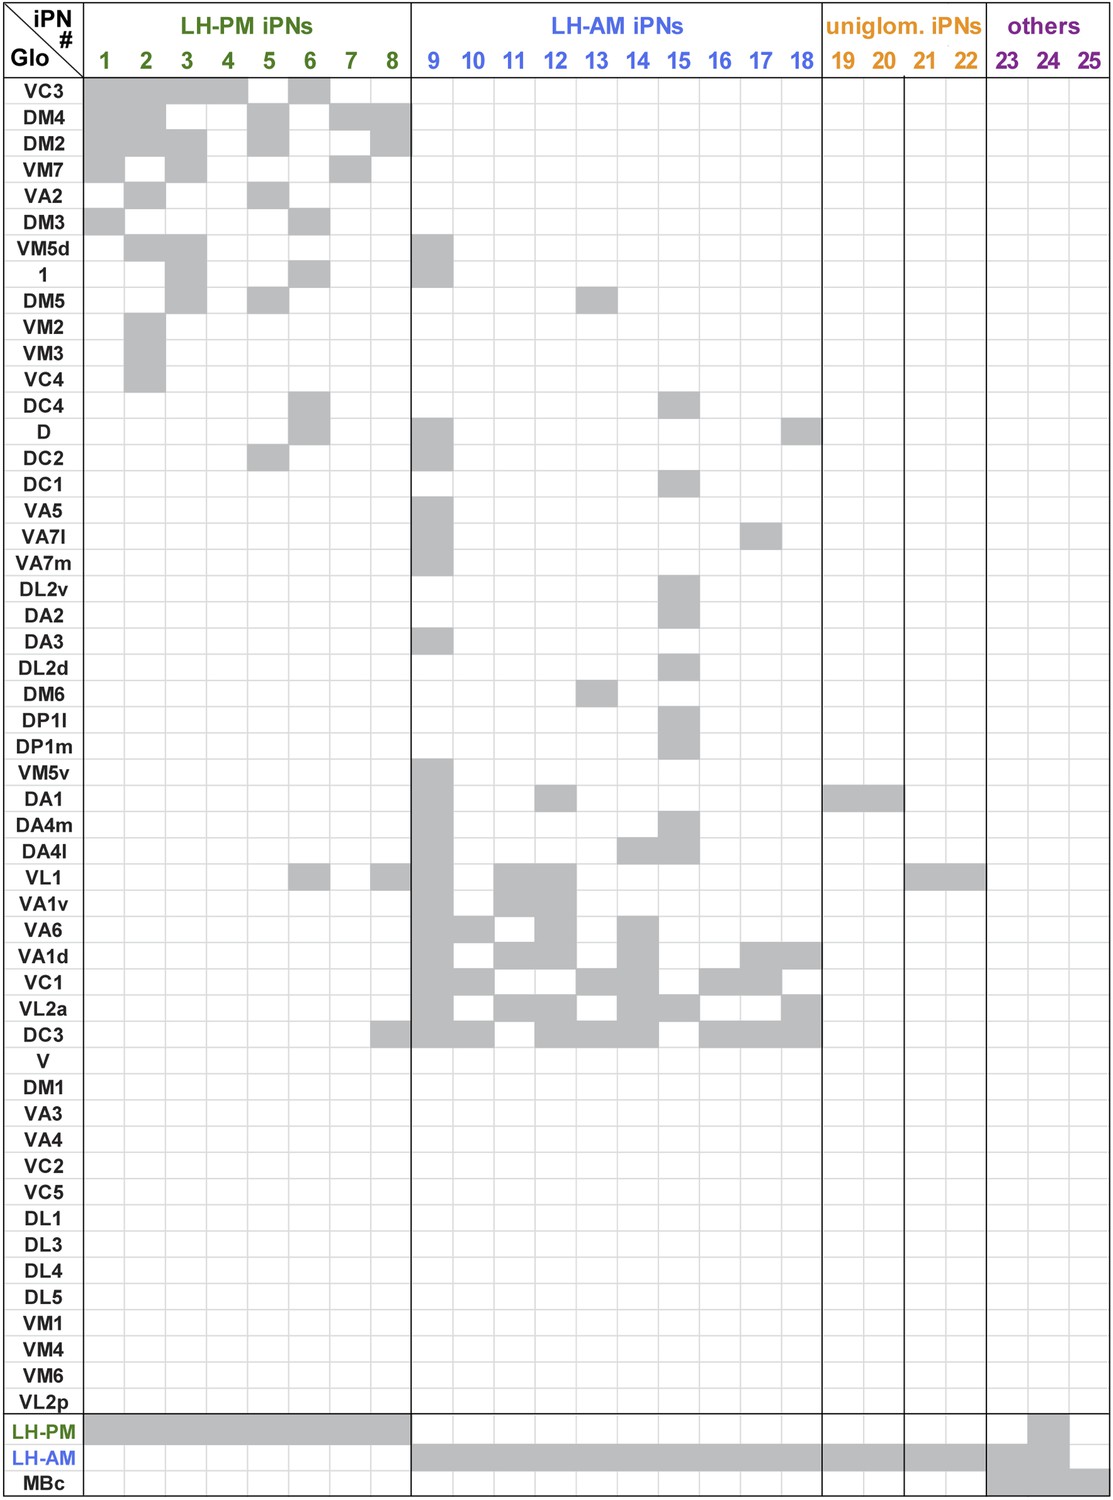
Binary innervation patterns of 25 individually labeled MZ699+ iPNs using PA-GFP. Columns represent innervation patterns of individual neurons which have been grouped according to their innervation properties; rows represent 51 glomeruli in the AL along with the innervation in the specific odor response domains in the LH (LH-PM, LH-AM) and/or the mushroom body calyx (MBc). Glomeruli have been sorted according to their iPN innervation. Grey, innervated; white, not innervated.
Figure 4
Distinct odor response domains in the LH constitute neuronal activity of iPNs and vlPr neurons.
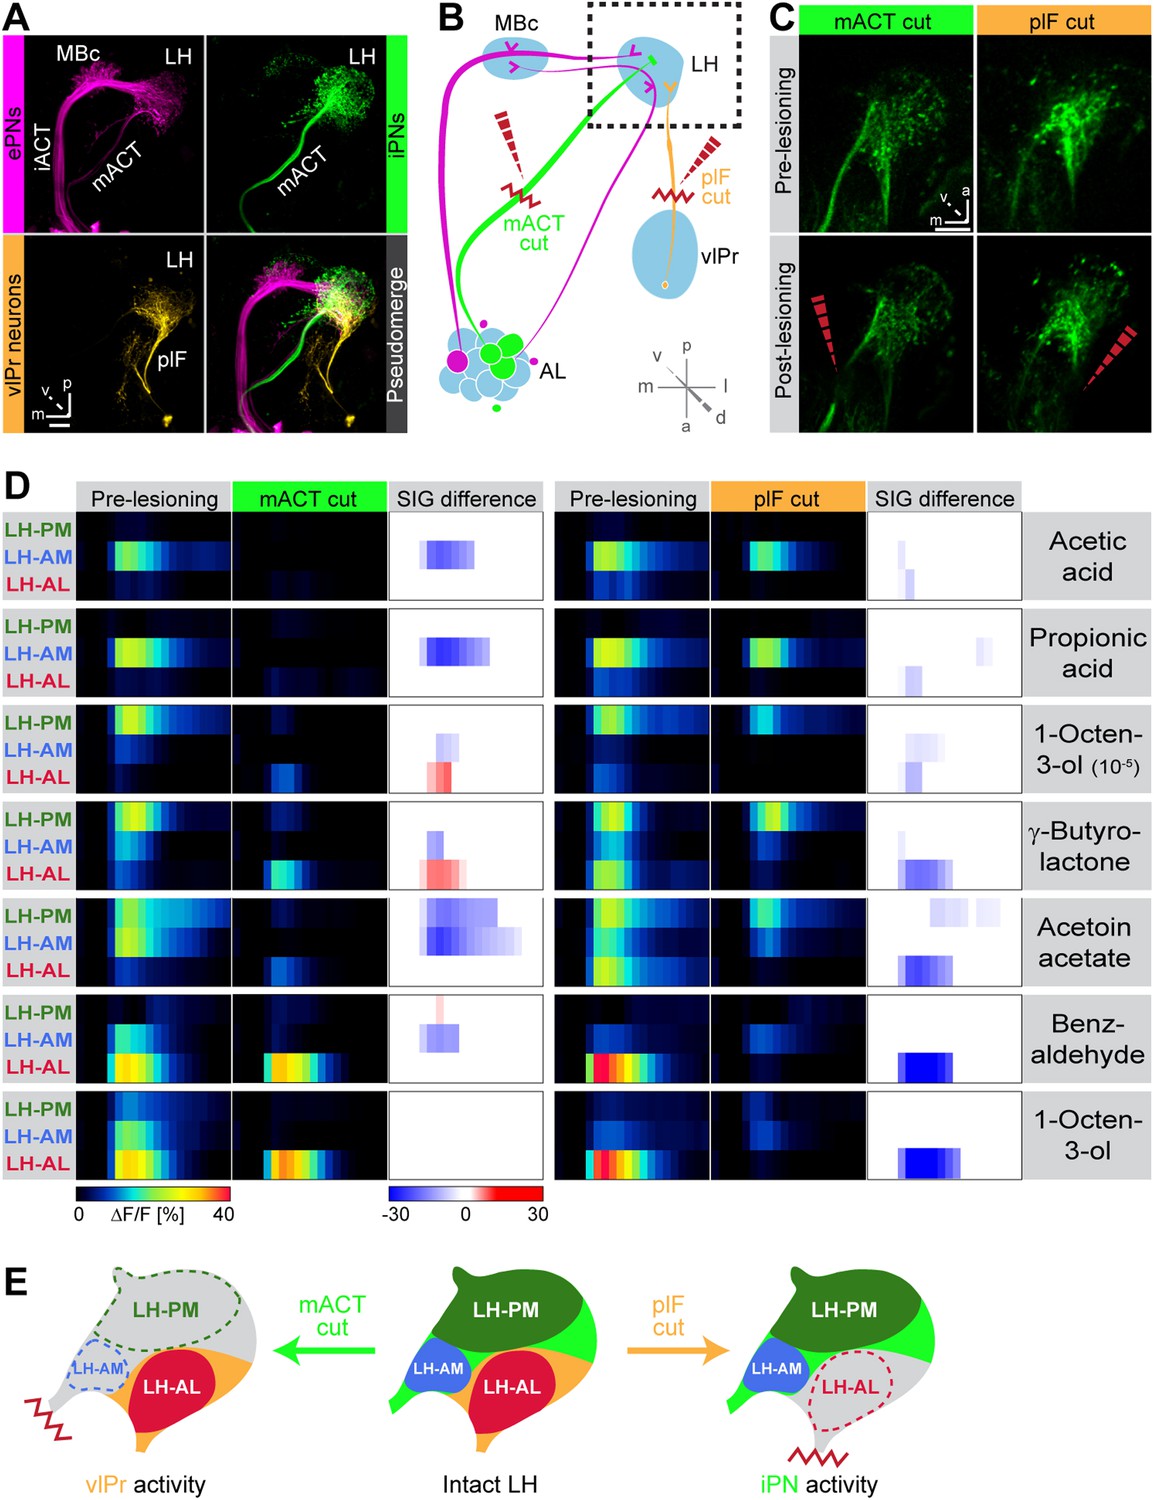
(A) Representation of all ePNs (magenta) and iPNs (green) labeled by GH146-GAL4 and MZ699-GAL4 using PA-GFP, respectively. Photoactivation of vlPr neurons (orange, MZ699-GAL4) connecting the LH and the vlPr via the plF. The overlay image depicts a pseudo-merge image of the different GAL4-driver lines. (B) Schematic of the olfactory circuit with integrated layout of the transection experiment. After simultaneous Ca2+ imaging of bilateral LHs, the ipsilateral plF and contralateral mACT was transected (red zigzag line) with an infrared laser (dashed red arrow). (C) Projection images of a 7 µm stack of the LH area prior and post transection. Left images, mACT transected; right image, plF transected. The ablated region is indicated by the dashed red arrow. Scale bar, 20 µm. (D) Median time traces displaying percental change of ΔF/F values for indicated ORDs prior to post transection of the mACT (green, left) and the plF (orange, right) for different odorants. Significant changes of odor-evoked Ca2+ signals due to transection are shown in the column SIG difference. Differences were tested with a two-tailed paired Student's t test (p < 0.05). Color codes are indicated by the corresponding scale bar below, n = 4–5. Transecting the mACT eliminates Ca2+ signals in the LH-PM and LH-AM domain, while lesioning the plF significantly abolishes LH-AL responses. Notably, the LH-AL domain is significantly stronger activated after mACT transection following application of 1-octen-3-ol and γ-butyrolactone. (E) Summarized cartoon of the neuron populations contributing to ORD activity prior and post transection of axons of iPNs or vlPr neurons.
Figure 5
iPN GABA release in the LH mediates odor attraction behavior.
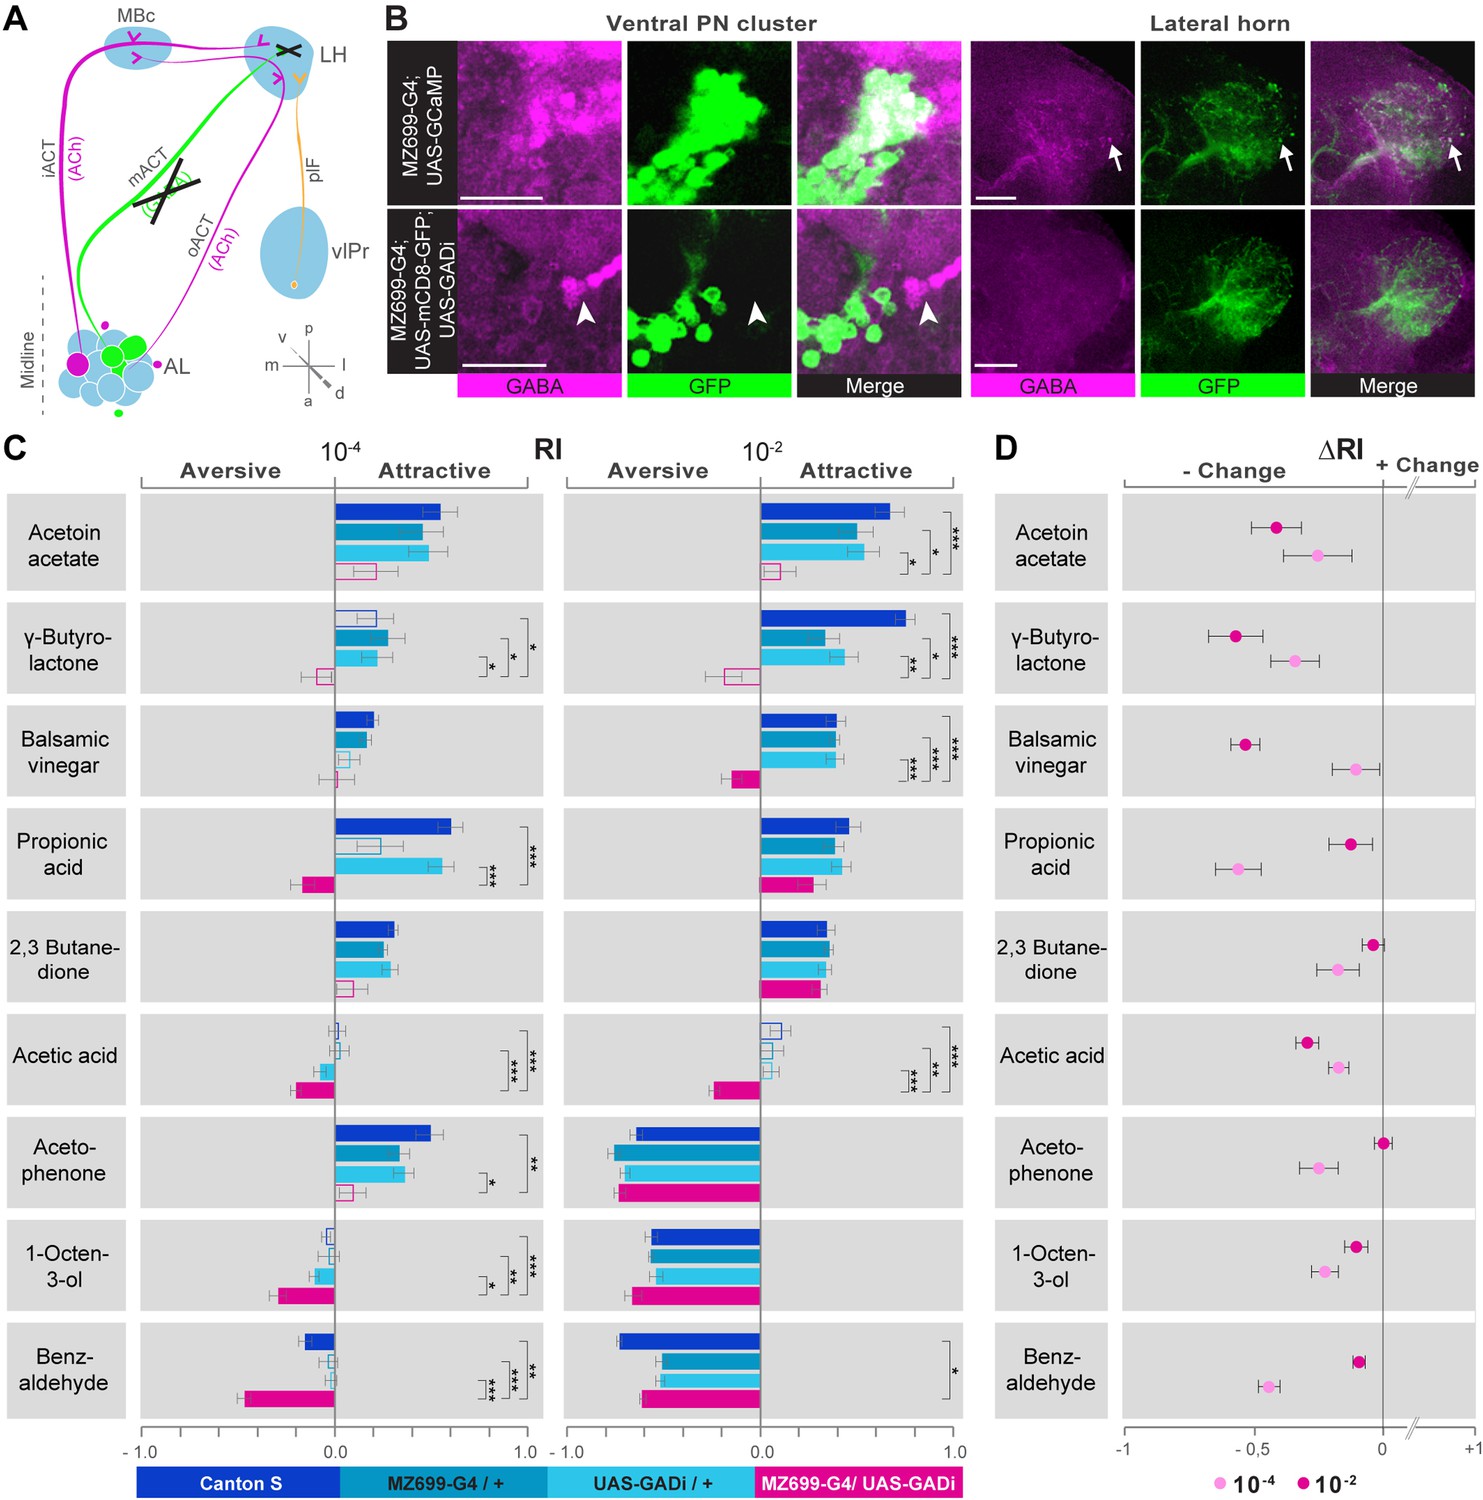
(A) Experimental layout: iPN GABA production was selectively silenced via GADi expression in MZ699+ iPNs; ePN and vlPr neuron activity remained unaffected. (B) Immunostaining against GABA and GFP within AL somata (left) and LH neurites (right) of iPNs with intact (top) and silenced GABA production (bottom). GADi flies show GABA signals in somata of iPNs labeled by GH146-GAL4 only (arrowhead). The arrow head points to an exemplary GABA-positive bouton in the LH. Scale bar, 20 µm. (C) Averaged behavioral response indices (RIs) determined with a T-maze assay for wild-type flies (dark blue), parental controls (light blue) and experimental animals (magenta) for nine odorants at two concentrations. Empty boxes display no response (Wilcoxon signed-rank test). Dunn's Multiple Comparison Test was used for global differences in the dataset followed by a posthoc test for selected pairs (p* < 0.05; **p < 0.01; ***p < 0.001). Error bars represent SEM. (D) RI differences between GADi flies and averaged parental controls. RI differences are negative for all but one odor indicating that GADi expression shifts odor-guided behavior towards aversion. Error bars indicate SEM.
Figure 6 with 3 supplements
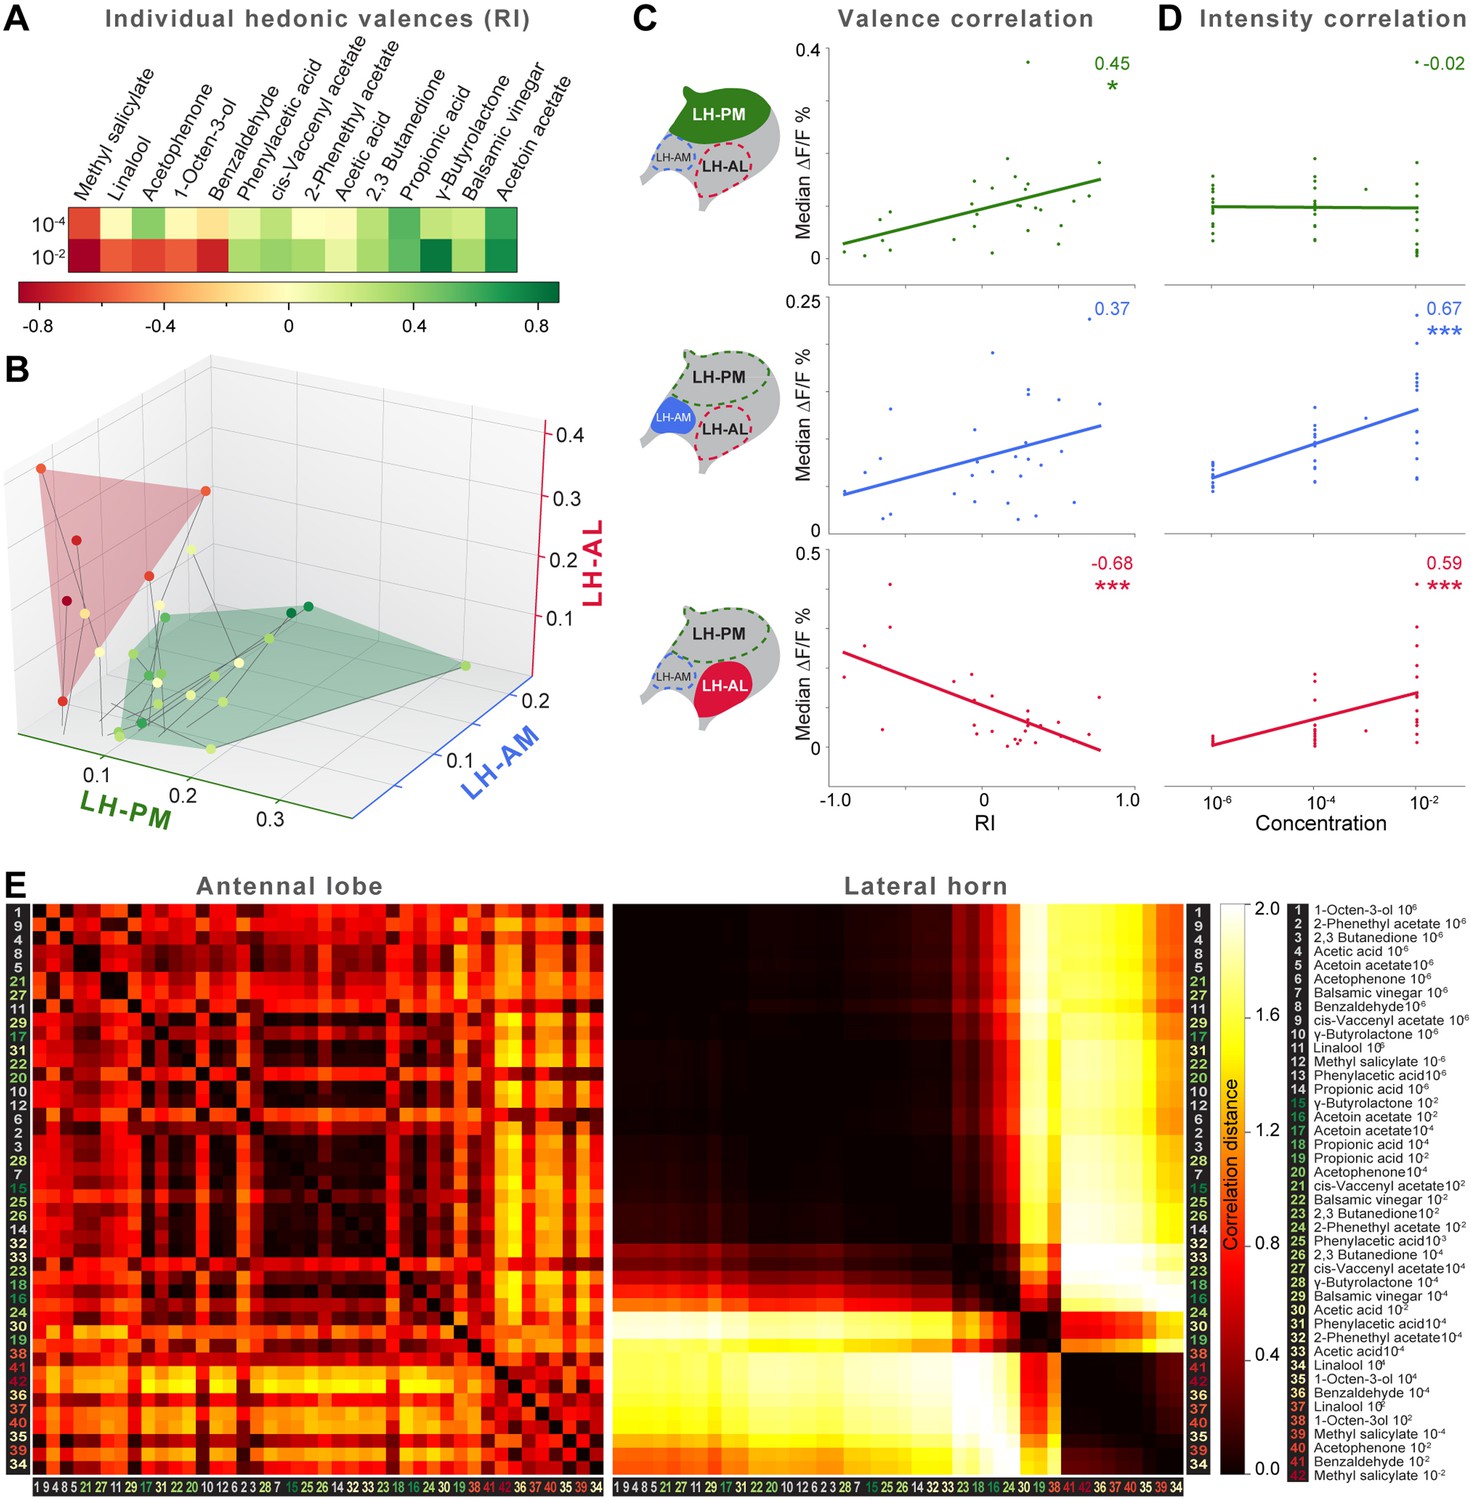
Integration of hedonic valence and odor concentration into ORDs.
(A) Response indices of wild type flies for all odors at median and high concentrations. Odors are sorted from highly aversive (−1, red) to highly attractive (+1, green). (B) 3D-scatter plot of median Ca2+ responses of all odors based on the three ORDs. Odor-dots are labeled due to their RI shown in (A). Same odors at different concentrations are connected with a line: the dot at the end depicts 10−2, the centered dot 10−4, and the end of the line 10−6. Attractive and aversive odor representations form separate clusters. (C and D) Left, schematic LH outlines with colored ORDs corresponding to data on the right. Correlation score r (upper right corner) between median activity and measured RI in T-maze experiments or odor concentration, respectively, with significance denoted below. Student's t test, *p < 0.05, ***p < 0.001. (E) Complete correlation matrices for Ca2+ response patterns of OSNs in the AL (left) and iPNs in the LH (right). The odors are arranged according to single linkage clustering of the LH activity patterns. Heatmap color-code refers to the correlation distance scale bar on the right. Correlation distance is defined as 1 − r, where r is the Pearson correlation coefficient between the response patterns of two odorants. Odor letters are color-coded according to hedonic valence; 10−6 RI values are labeled in grey (complete list right hand).
Figure 6—figure supplement 1
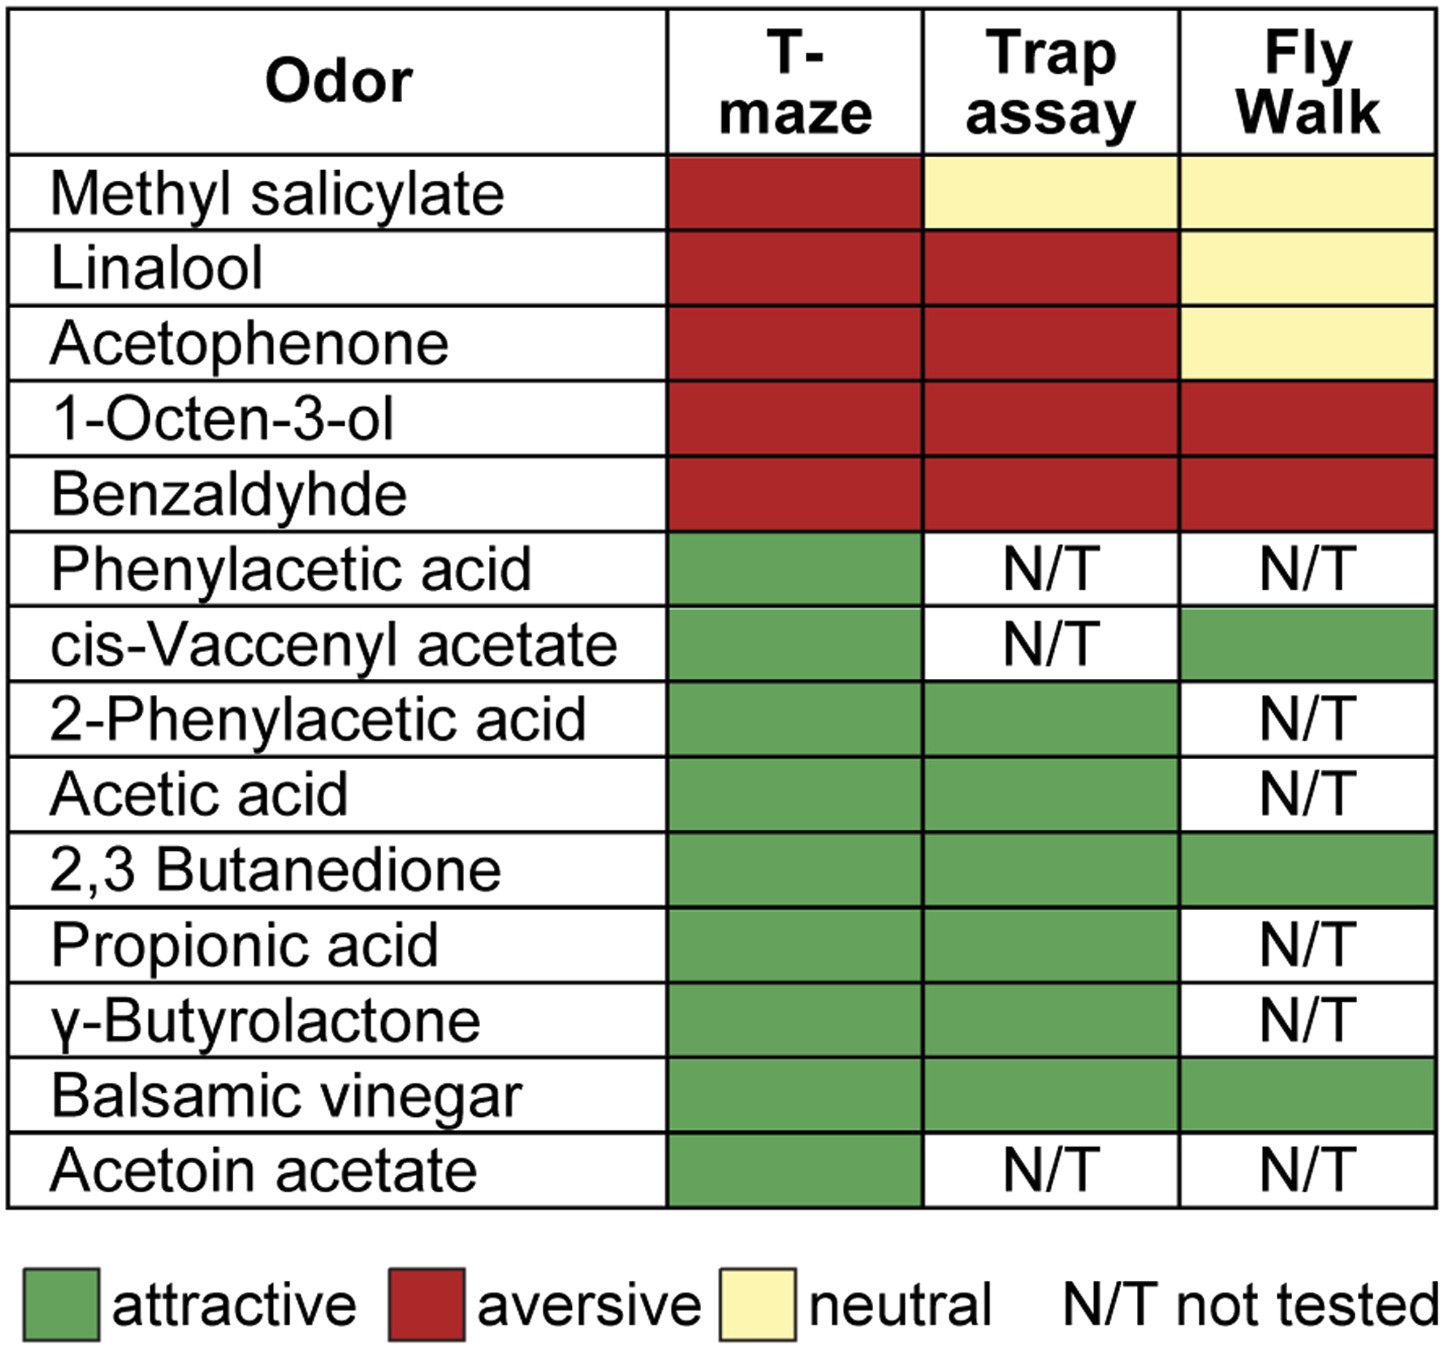
Odor valences determined with three different behavioral assays.
Odor-evoked behavioral responses of wild type flies for the 14 odors used in this study determined by T-maze assay, trap assay and the FlyWalk. The color denotes an attractive (green), aversive (red) or a neutral (light yellow) behavioral response. N/T, not tested. The majority of odors yielded similar results independent of the behavioral assay used. In a few cases an attractive odor evoked a neutral response (i.e., no response), but never induced an aversive response in another assay.
Figure 6—figure supplement 2

Calcium responses of OSNs.
(A) Representative glomerular Ca2+-responses of OSNs in the AL for a subset of odorants at three concentrations. Scale bar to the right. Control (mineral oil) recordings are shown additionally as full false-color coded images. (B) Glomerular AL atlas used for glomerular identification. (C) Median Ca2+-activity traces of all glomeruli for all odorants at the three indicated concentrations. Scale bar and control measurement in the center. Odor application is indicated by the grey bar below the heatmaps (n = 6–7).
Figure 6—figure supplement 3
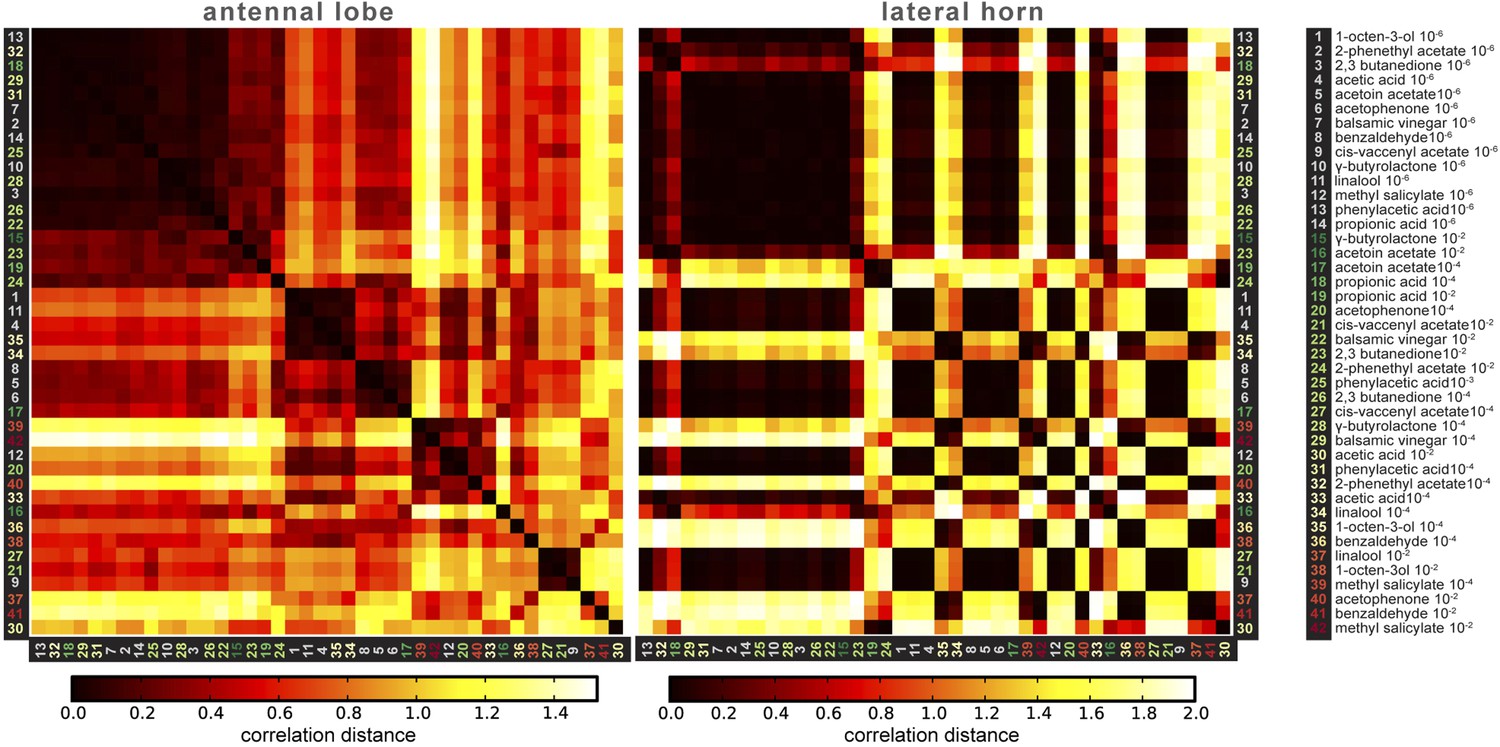
Correlation matrices for odor-evoked responses in the AL and LH.
Complete correlation matrices for calcium activity patterns of OSNs in the AL (left) and iPNs in the LH (right). The odors are arranged according to single linkage clustering of the AL activity patterns. Heatmap color-code refers to the correlation distance scale bar below each matrix. Odor letters are color-coded according to hedonic valence; 10−6 RI values are labeled in grey (complete list right hand).
Download links
A two-part list of links to download the article, or parts of the article, in various formats.
Downloads (link to download the article as PDF)
Open citations (links to open the citations from this article in various online reference manager services)
Cite this article (links to download the citations from this article in formats compatible with various reference manager tools)
Decoding odor quality and intensity in the Drosophila brain
eLife 3:e04147.
https://doi.org/10.7554/eLife.04147


