Active torque generation by the actomyosin cell cortex drives left–right symmetry breaking
- Technical University Dresden, Germany
- Max Planck Institute for the Physics of Complex Systems, Germany
- Max Planck Institute of Molecular Cell Biology and Genetics, Germany
Figures
Figure 1 with 1 supplement
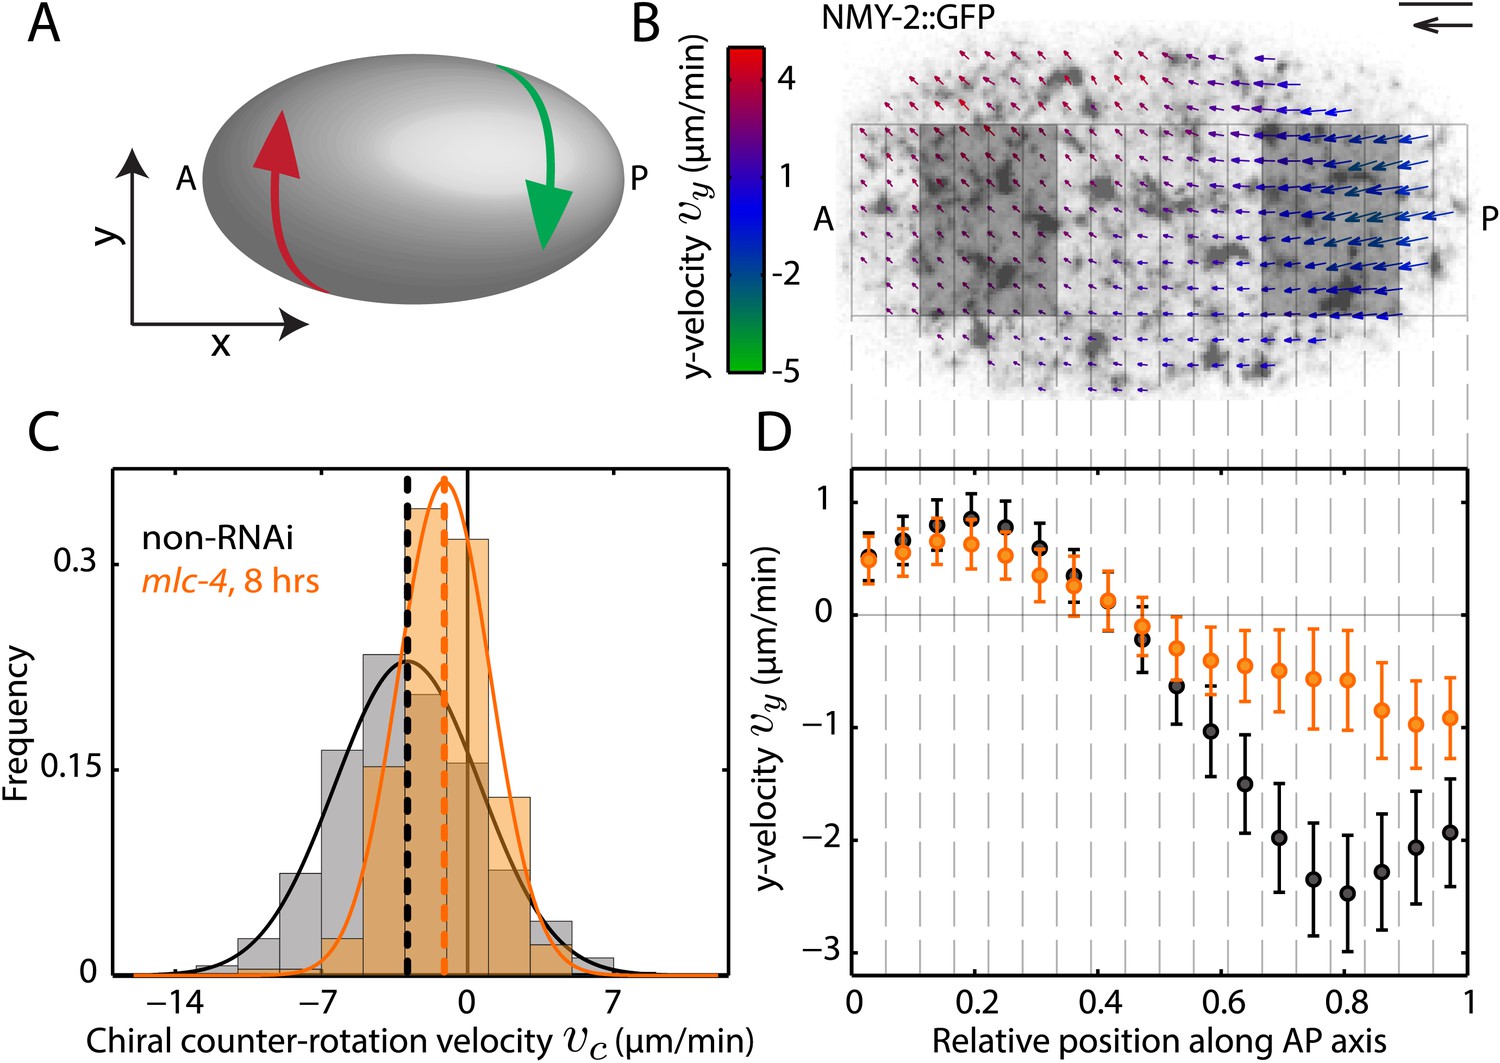
Chiral flow depends on myosin activity.
(A) Sketch of a C. elegans embryo. Curved arrows illustrate chiral counter-rotating flow in the anterior (A, red) and posterior (P, green) half of the embryo, respectively. (B) Time-averaged cortical flow field (arrows) at the bottom surface of a representative C. elegans embryo viewed from the outside of the embryo in this and all other images. Arrow colors indicate y-velocity. Scale bar, 5 μm. Velocity scale arrow, 20 μm/min. (C) Histogram of instantaneous chiral counter-rotation velocity , where is the average of the y-component of the velocity v over the left (right) shaded area in (B), for non-RNAi (858 frames from 25 embryos; gray) and mlc-4 (RNAi) (8 hrs; 223 frames from 7 embryos; beige). Dashed vertical lines indicate mean vc. (D) y-velocity vy along the AP axis averaged over 18 vertical stripes as indicated, for non-RNAi (black, averaged over 25 embryos) and mlc-4 (RNAi) (beige, averaged over 7 embryos). Error bars, SEM.
Figure 1—figure supplement 1
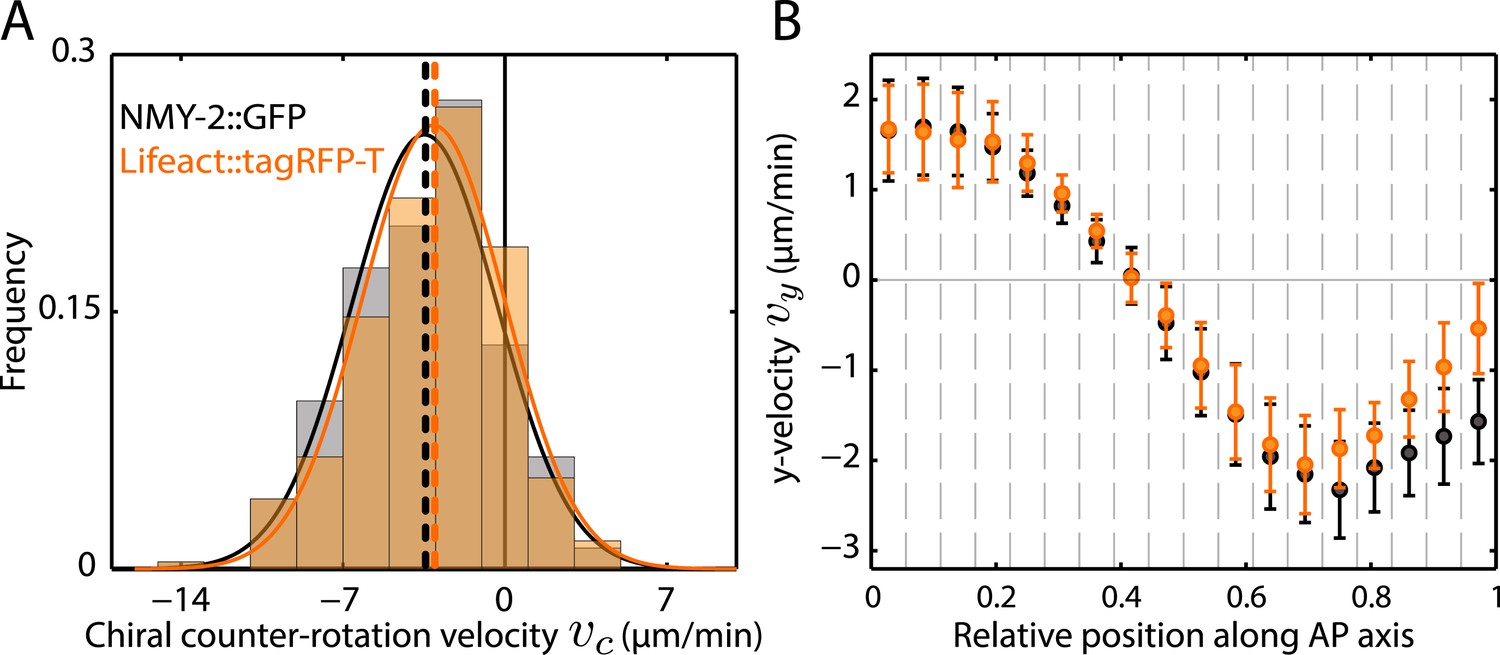
Similar flow fields were obtained when imaging actin as compared to imaging myosin Video 8.
Quantification of chiral flow for myosin and actin using a dual-colored transgenic line (SWG003). (A) Histogram of instantaneous chiral counter-rotation velocity , where is the average of the y-component of the velocity v over the left (right) shaded area in Figure 1B, for NMY-2::GFP (245 frames from 6 embryos; gray) and Lifeact::tagRFP-T (245 frames from 6 embryos; beige). Dashed vertical lines indicate mean vc. (B) y-velocity vy along the AP axis averaged over 18 vertical stripes, as indicated in Figure 1B, for NMY-2::GFP (black, averaged over 6 embryos) and Lifeact::tagRFP-T (beige, averaged over 6 embryos). Error bars, SEM.
Figure 2 with 1 supplement
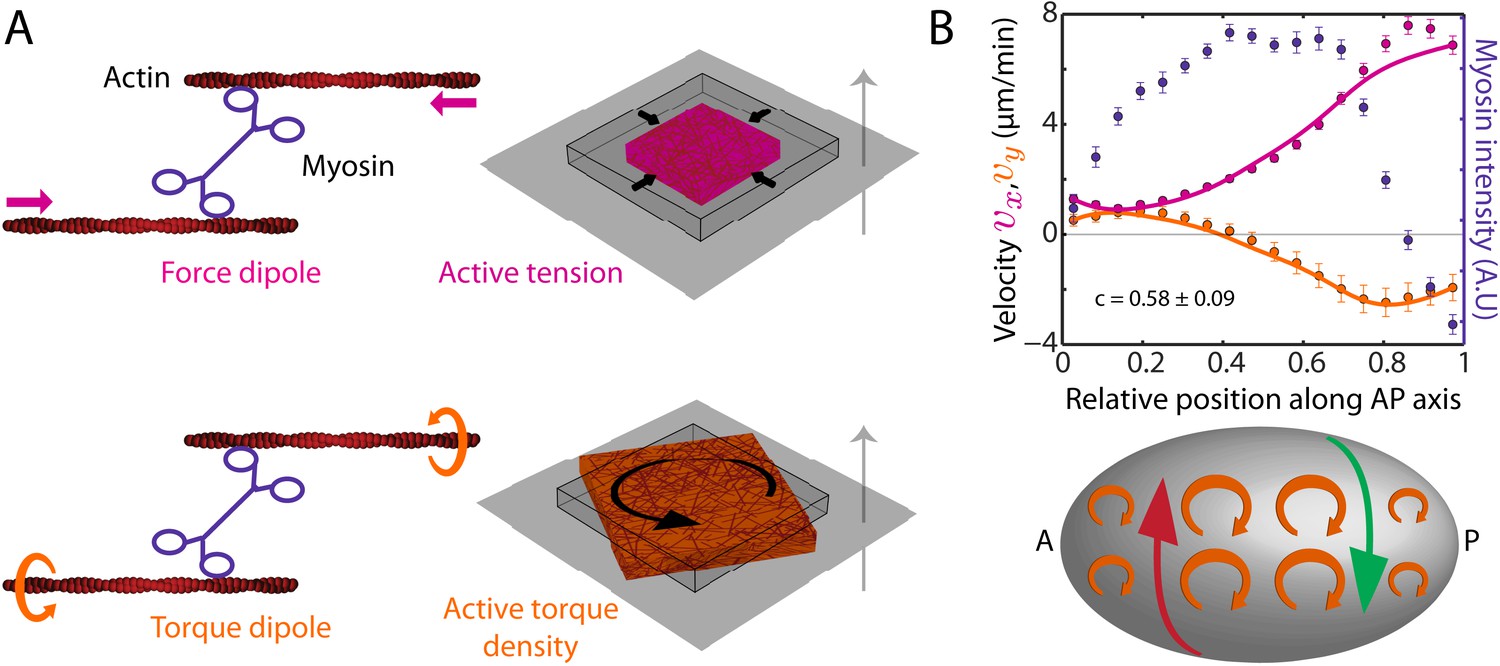
The cortex actively generates torques.
(A) Left, myosin heads consume ATP to pull (Kron and Spudich, 1986) and twist (Sase et al., 1997; Beausang et al., 2008) actin filaments, leading to the generation of a force dipole (top, magenta) and a torque dipole (bottom, beige). Right, these can generate an active tension and an active torque density at larger scales, causing an isolated piece of cortex to contract (top) and rotate (bottom). Gray surface, membrane; cube with wire frames, non-contracted (non-rotated) piece of cortex; magenta (beige) cubes, contracted (rotated) piece of cortex. The gray arrow points from the outside to the inside of the cell and the rotation is clockwise when viewed from the outside. (B) Top, myosin intensity (blue markers) and velocity profiles (magenta markers, AP flow velocity vx; beige markers, y-velocity vy) along the AP axis (Figure 1B,D) for the non-RNAi condition (averaged over 25 embryos). Error bars, SEM. Magenta and beige curves, respective theoretical velocity profiles (c = 0.58 ± 0.09). Bottom, sketch of a C. elegans embryo with clockwise active torques in beige (as viewed from the outside of the embryo). A gradient in myosin concentration along the AP axis (see plot above) leads to a gradient in active torques (shown here with varying sizes of the clockwise torques), resulting in a chiral flow (red and green arrows) orthogonal to the gradient.
Figure 2—figure supplement 1
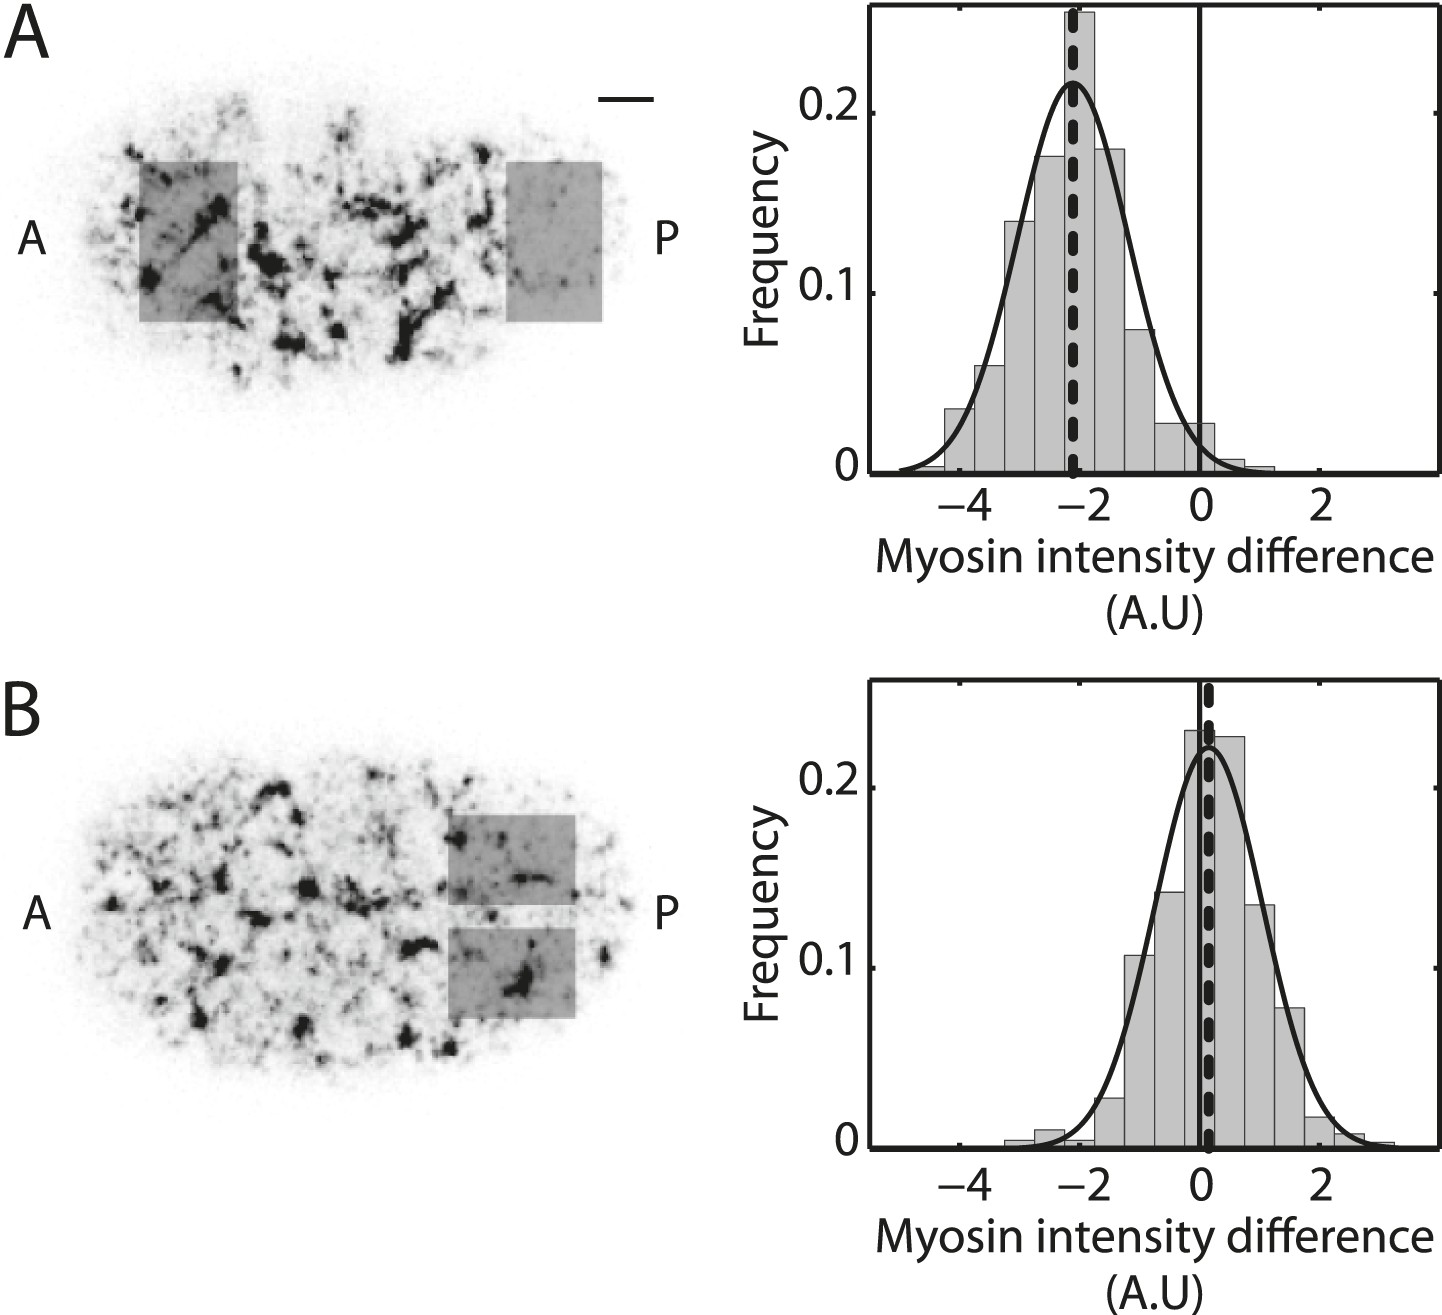
Myosin distribution is azimuthally symmetric.
(A) Left, representative image of the actomyosin cortex labeled with GFP-tagged NMY-2 (gray, myosin) at 30% cortical retraction. Scale bar, 5 μm. Right, histogram of the difference in spatially averaged myosin fluorescence intensity between the posterior and anterior halves of the embryo, quantified from the respective shaded regions for non-RNAi embryos (N = 250 frames from 25 embryos; gray). Dashed line, mean of the difference in myosin intensity. Only the last 50 s of cortical flow was utilized from each video for generating this histogram. (B) Left, representative image of the actomyosin cortex labeled with GFP-tagged NMY-2 (gray, myosin). Right, histogram of the difference in spatially averaged myosin fluorescence intensity between the top and bottom halves of the embryo in the posterior from the respective shaded regions for non-RNAi embryos (N = 858 frames from 25 embryos; gray). Dashed line, mean of the difference in myosin intensity. The entire cortical flow period was utilized from each video for generating this histogram.
Figure 3 with 4 supplements
Ratio of active torque to active tension is modulated by Rho.
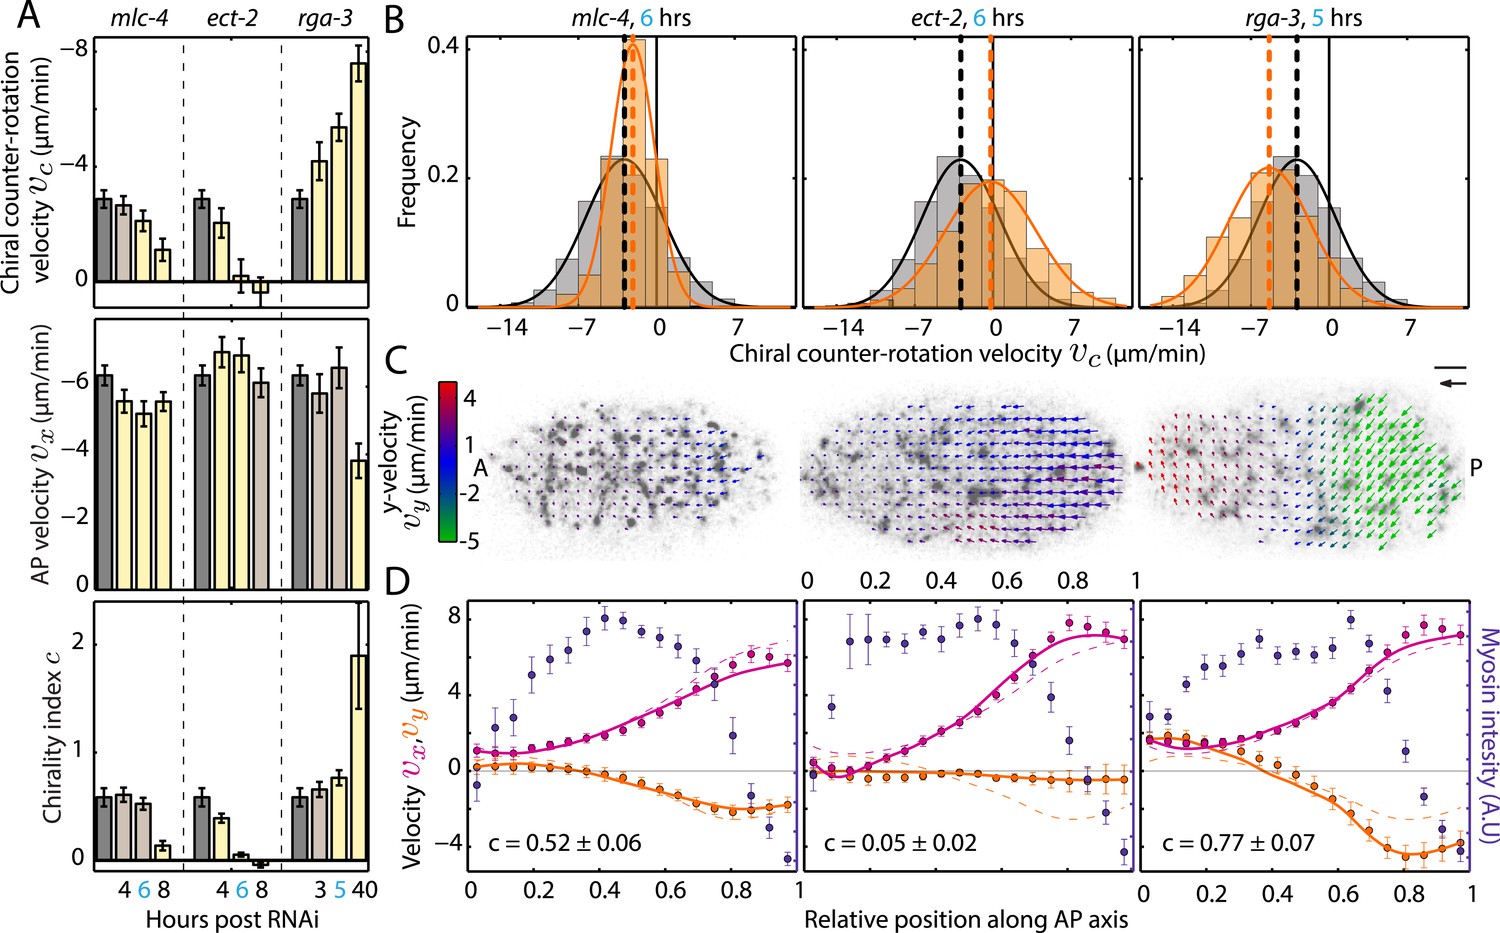
(A) Chiral counter-rotation velocity vc (top), AP velocity vx (middle), and chirality index c (bottom) for non-RNAi (gray), mlc-4 (4, 6, 8 hrs RNAi), ect-2 (4, 6, 8 hrs RNAi), and rga-3 (3, 5, 40 hrs RNAi). Error bars, error of the mean with 99% confidence. Yellow bars, significant difference to non-RNAi condition; brown bars, no significant difference. (B) Histogram of instantaneous chiral counter-rotation velocity vc for mlc-4 (left; 6 hrs; 235 frames from 7 embryos), ect-2 (middle; 6 hrs; 338 frames from 9 embryos), and rga-3 (right; 5 hrs; 402 frames from 10 embryos) RNAi. Gray histograms, non-RNAi condition. Dashed lines, mean vc. (C) Respective time-averaged cortical flow field (arrows) of representative embryos (gray, myosin). Arrow colors indicate y-velocity vy. Scale bar, 5 μm. Velocity scale arrow, 20 μm/min. (D) Respective average myosin intensity (blue markers) and velocity profiles (magenta markers, AP flow velocity vx; beige markers, y-velocity vy) along the AP axis for each RNAi condition. Error bars, SEM. Magenta and beige curves, respective theoretical velocity profiles. Dashed lines, non-RNAi theoretical velocity profiles.
Figure 3—figure supplement 1
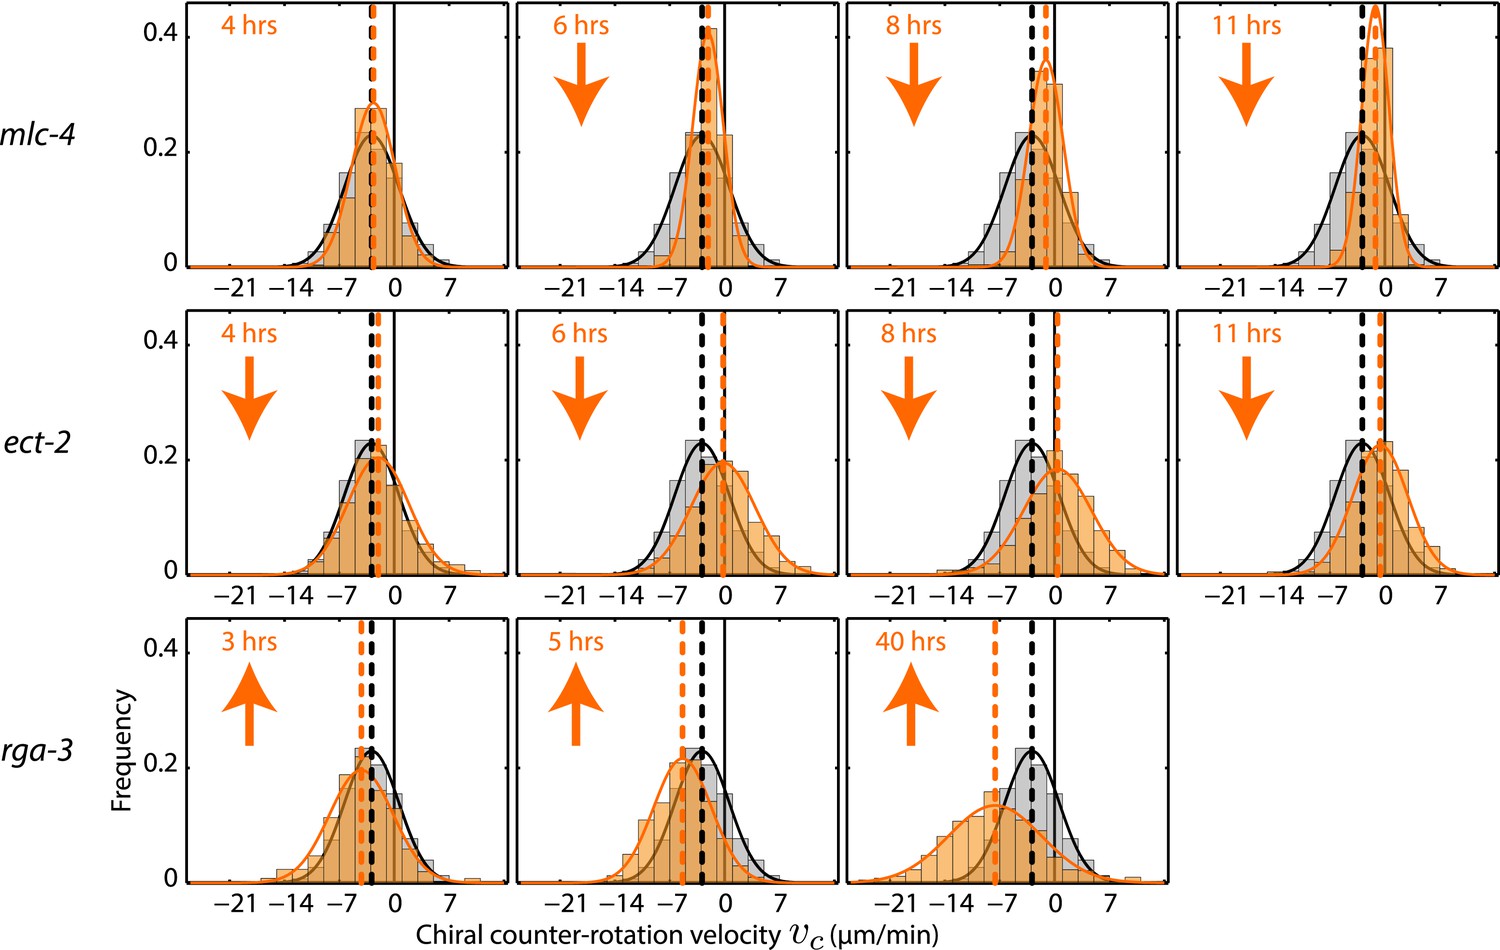
Chiral counter-rotation velocity vc for mlc-4, ect-2, and rga-3 RNAi.
Each graph presents the instantaneous chiral counter-rotation velocity vc histogram for the RNAi condition specified (beige). The histogram from the non-RNAi condition is shown in gray. Downward arrows indicate a significant decrease and upward arrows indicate a significant increase in vc compared to the non-RNAi condition (Wilcoxon rank sum test with 99% confidence). The number of hours of RNAi is as indicated.
Figure 3—figure supplement 2
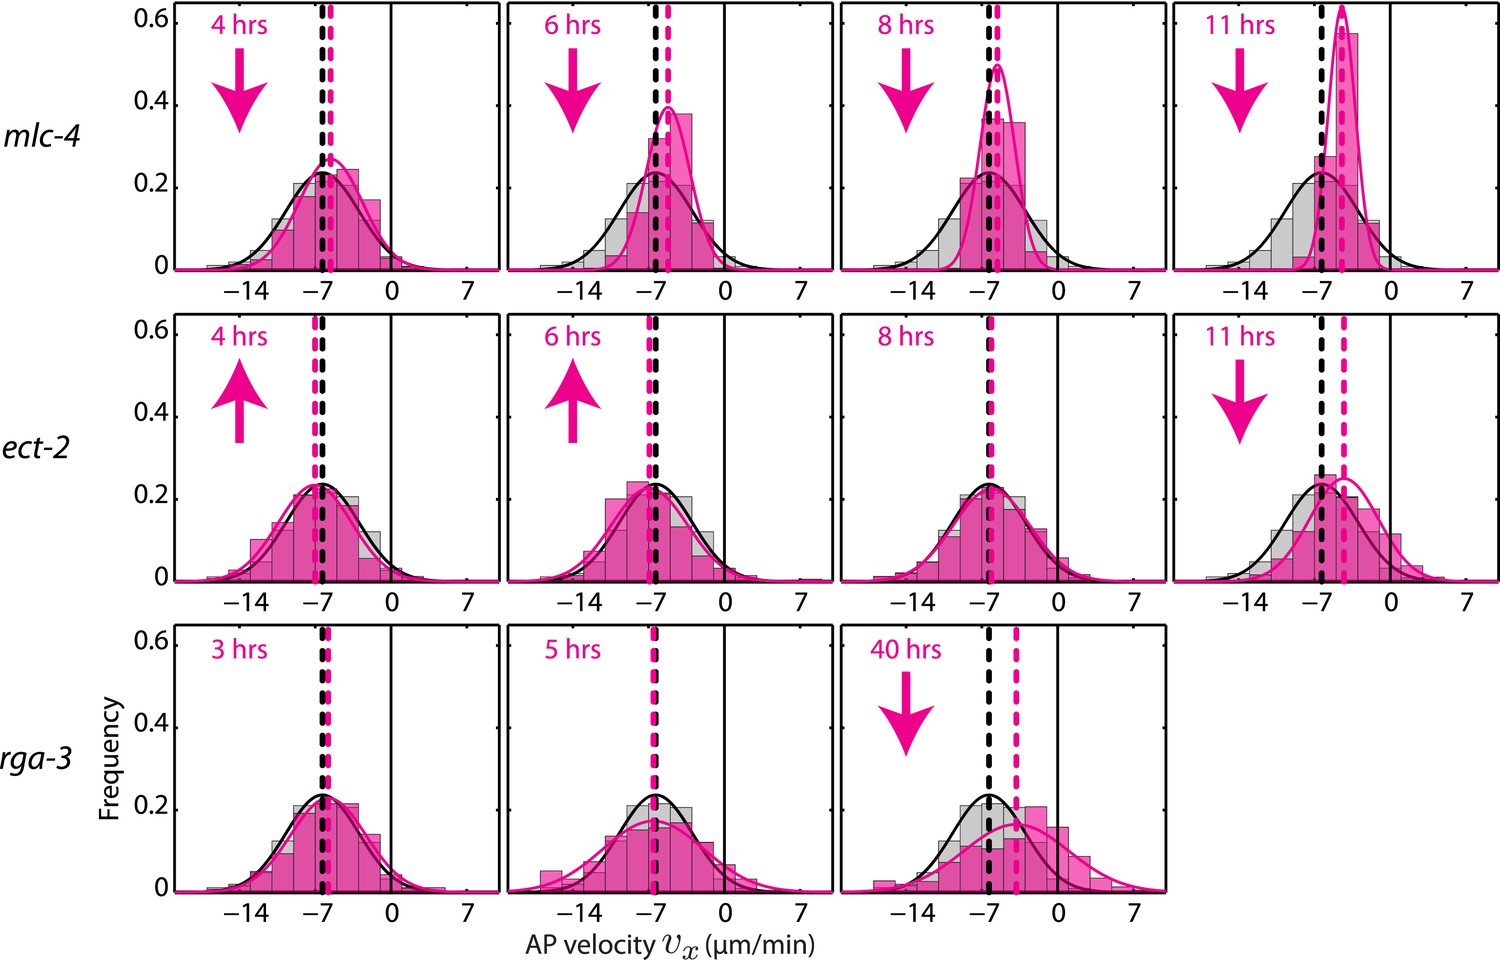
AP velocity vx for mlc-4, ect-2, and rga-3 RNAi.
Each graph presents the instantaneous AP velocity vx histogram for the RNAi condition specified (magenta). The histogram from the non-RNAi condition is shown in gray. Downward arrows indicate a significant decrease and upward arrows indicate a significant increase in vx compared to the non-RNAi condition (Wilcoxon rank sum test with 99% confidence). The number of hours of RNAi is as indicated.
Figure 3—figure supplement 3
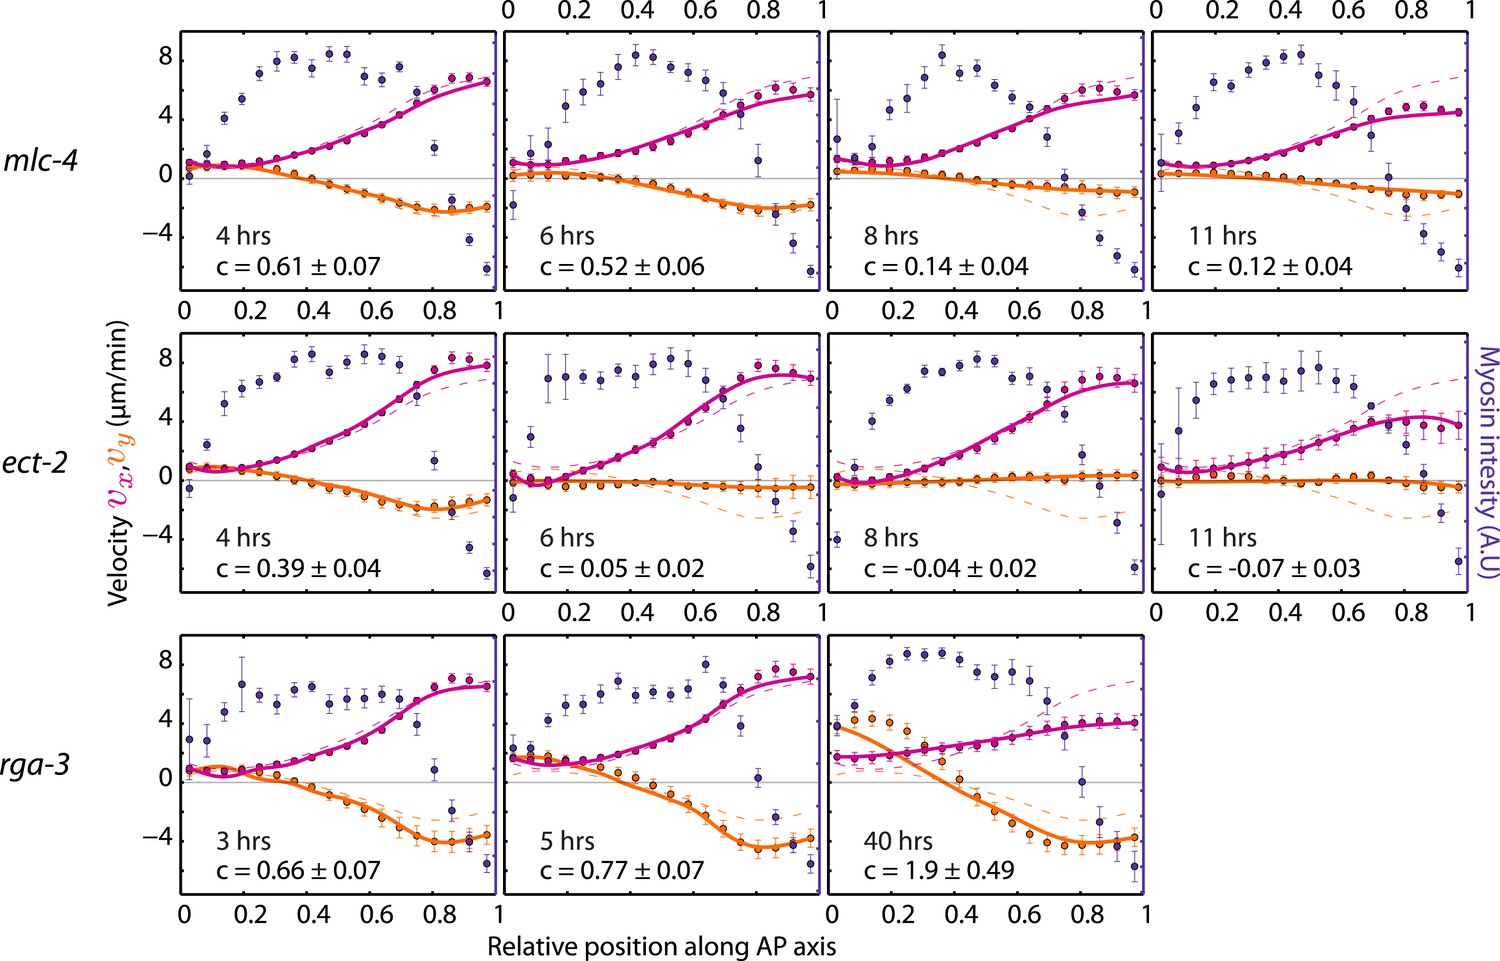
Theoretical velocity profiles for mlc-4, ect-2 ,and rga-3 RNAi.
Each graph presents the respective average myosin intensity (blue markers) and velocity profiles (magenta markers, AP flow velocity vx; beige markers, y-velocity vy) along the AP axis for each RNAi condition specified. Error bars, SEM. Magenta and beige curves, respective theoretical velocity profiles. Dashed lines, non-RNAi theoretical velocity profiles. The number of hours of RNAi is as indicated. See respective Videos 2–5.
Figure 3—figure supplement 4
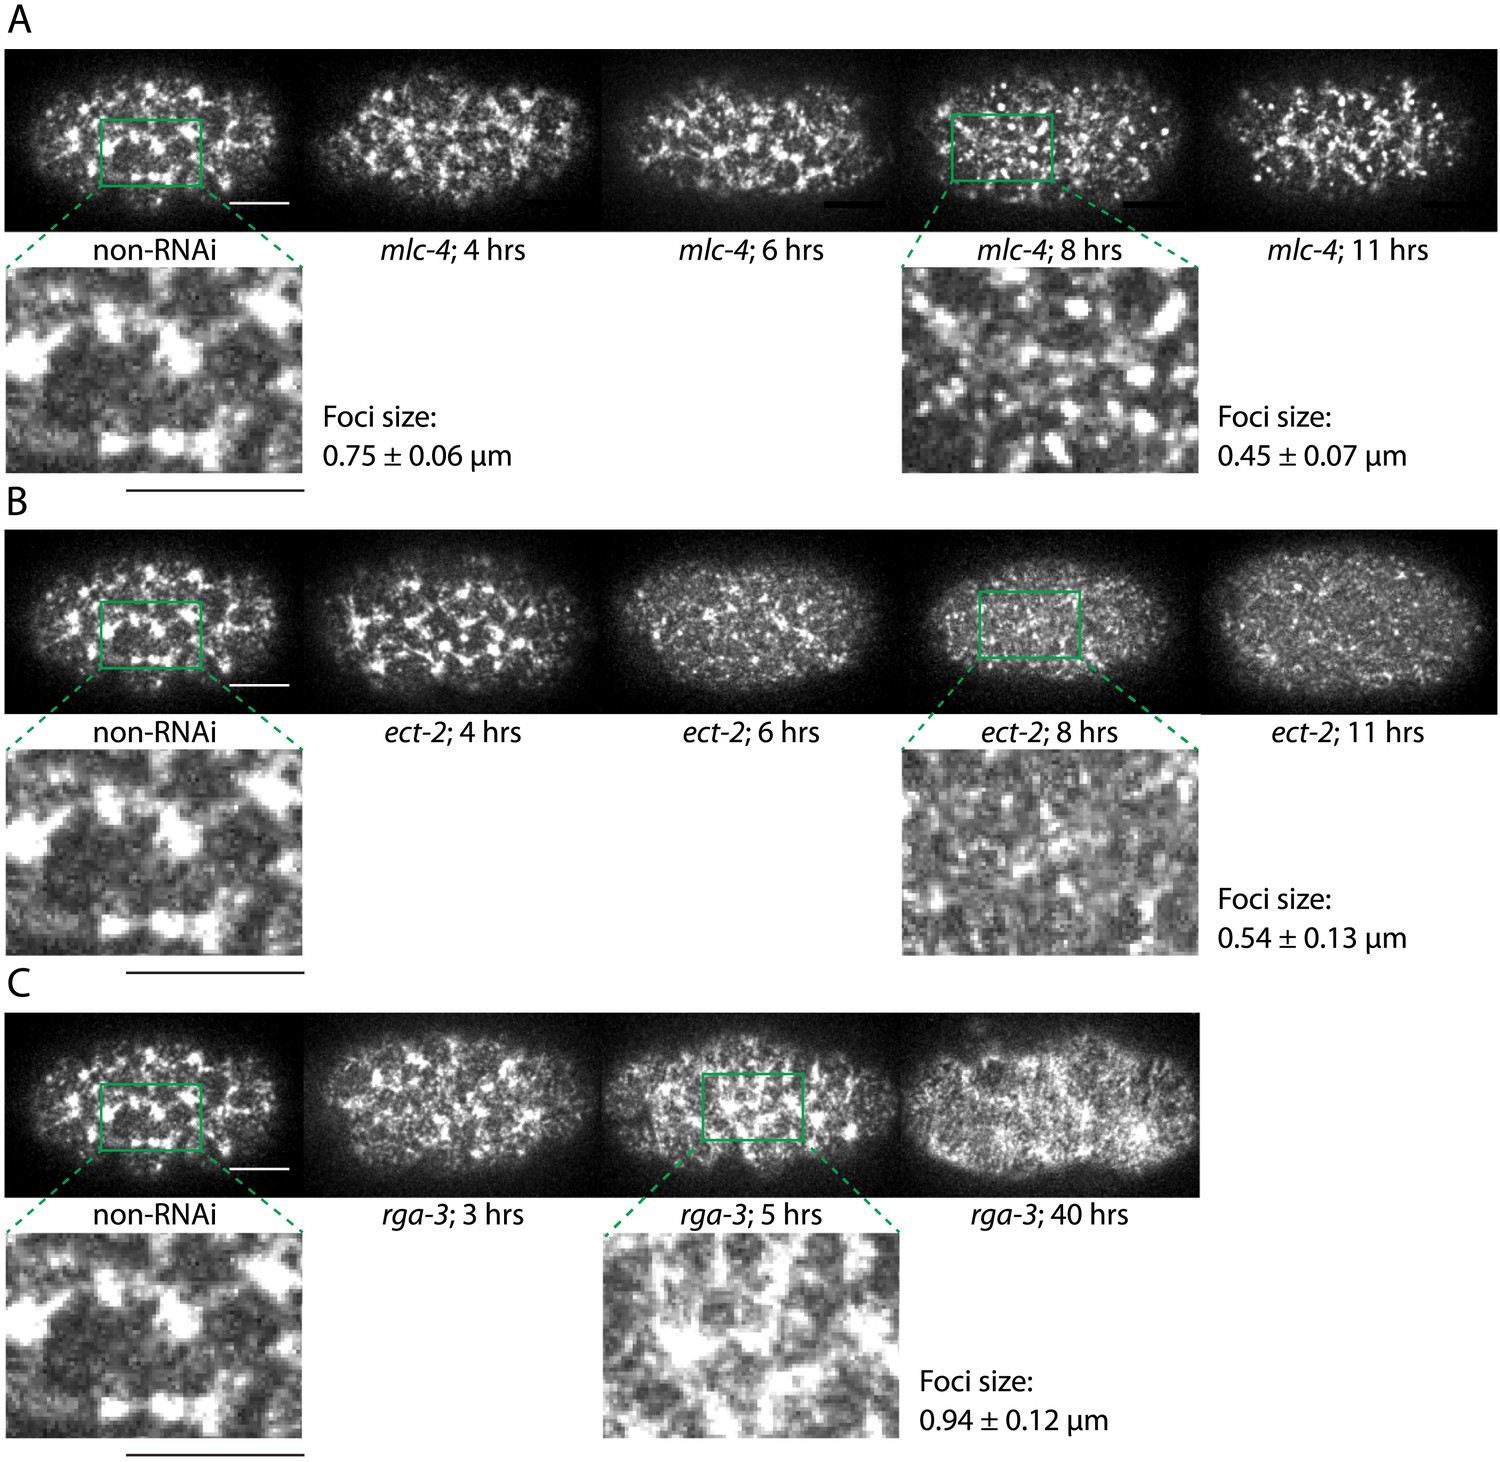
Comparison of cortical structure through imaging GFP-tagged NMY-2.
(A) Representative images for non-RNAi, 4, 6, 8, and 11 hrs of mlc-4 (RNAi) are shown. Cortical structure is disrupted by 8 hrs of mlc-4 (RNAi) (magnified view with characteristic foci size obtained from spatial myosin fluorescence intensity–intensity correlation, compare to non-RNAi). (B) Representative images for non-RNAi, 4, 6, 8, and 11 hrs of ect-2 (RNAi). Cortical structure is disrupted by 8 hrs of ect-2 (RNAi) (magnified view with characteristic foci size, compare to non-RNAi). (C) Representative images for non-RNAi, 3, 5, and 40 hrs of rga-3 (RNAi). Cortical structure is disrupted by 5 hrs of rga-3 (RNAi) (magnified view with characteristic foci size, compare to non-RNAi). Scale bars, 10 μm. Error bars, error of the mean with 99% confidence.
Figure 4 with 5 supplements
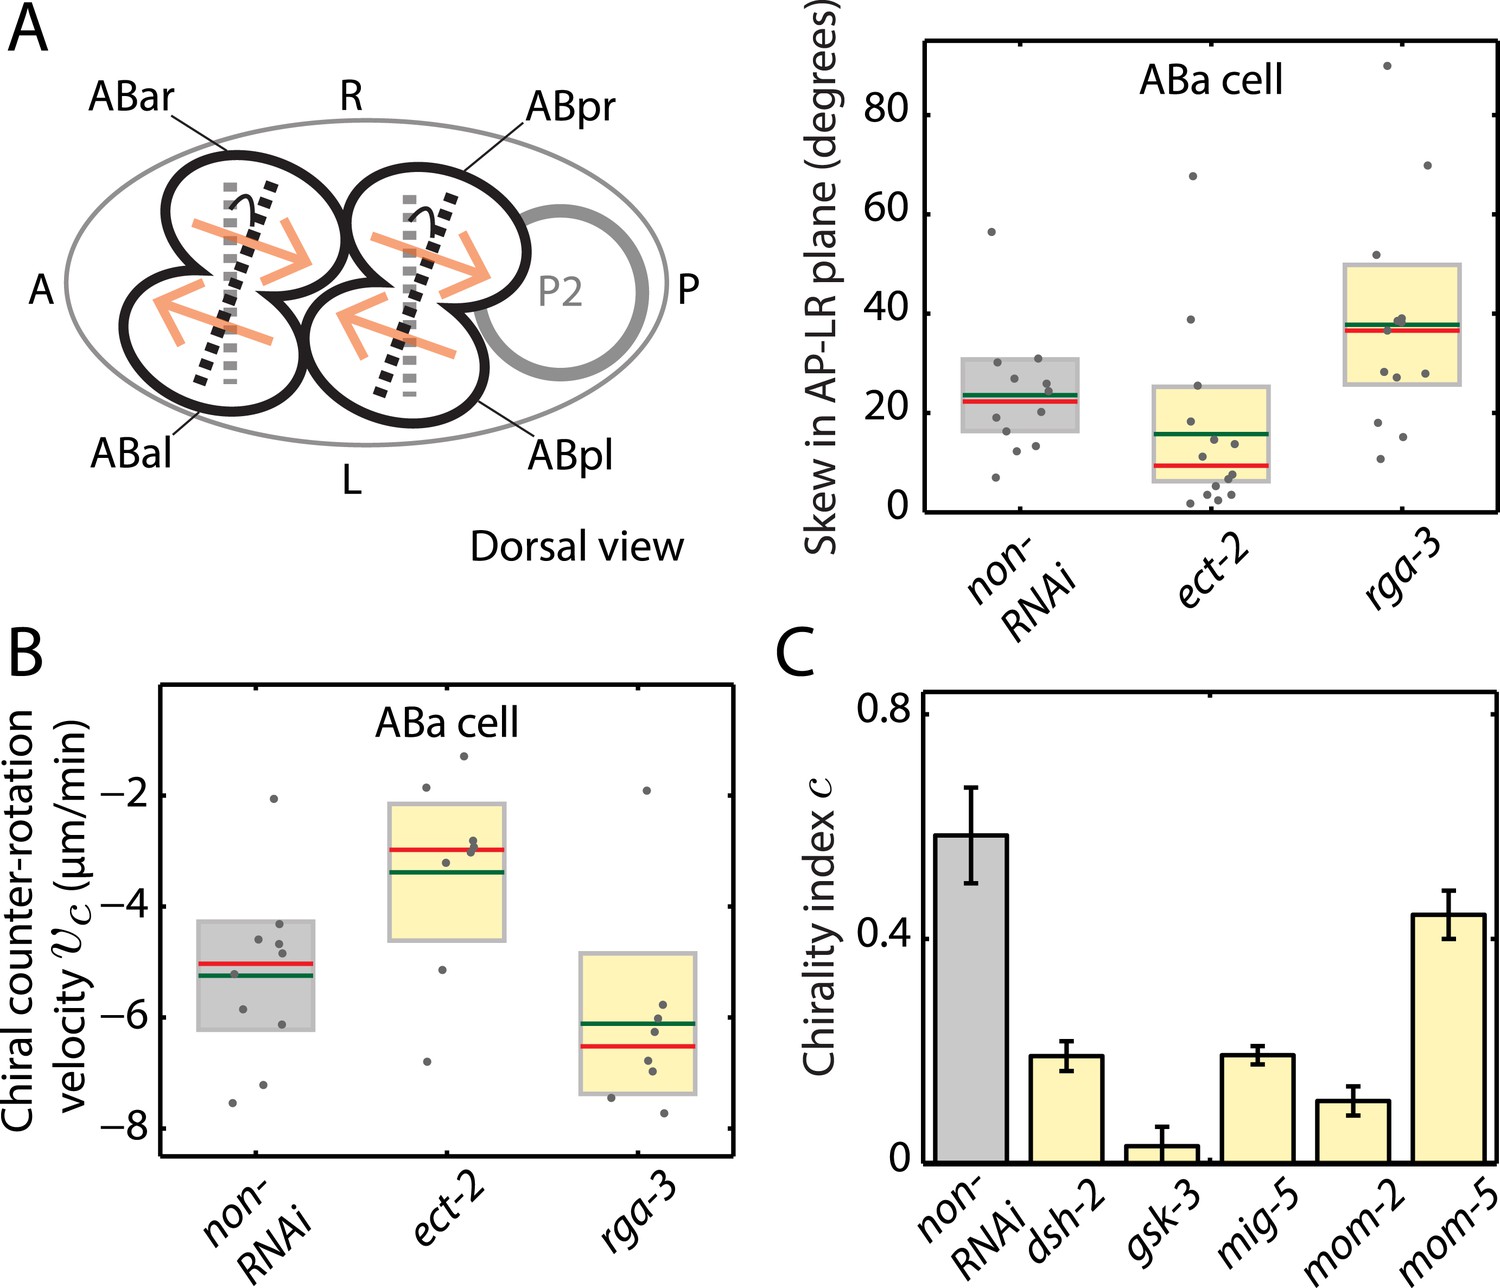
Active torques participate in L/R body axis establishment.
(A) A schematic of the skew angle measurement in the AP–LR plane. Gray dashed line, initial nuclei position; black dashed line, skewed nuclei position; beige arrows, direction of cortical flow on the dorsal surface (Video 6). To the right are the chiral skew angles of ABa for non-RNAi (gray), ect-2 (RNAi) (4.5 hrs) and rga-3 (RNAi) (4.5 hrs) in the AP–LR plane. Gray circles, skew angle in individual videos; shaded areas, SEM; green horizontal lines, mean skew angle; red horizontal lines, median skew angle; yellow shaded areas, knockdown conditions with a significant difference (95% confidence with the Wilcoxon rank sum test) from the non-RNAi condition. (B) Chiral counter-rotation velocity vc for non-RNAi (gray), ect-2 (RNAi) (4.5 hrs) and rga-3 (RNAi) (4.5 hrs) quantified at the 4-cell stage during ABa cytokinesis. Note that one outlier was removed for computing mean vc for rga-3 (RNAi). The expected flow profiles from our theoretical description, given a stripe of high myosin activity (corresponding to the cleavage plane), is shown in Figure 4—figure supplement 5. (C) Overall chirality index c, for non-RNAi (gray) and for Wnt signaling genes (40 hrs RNAi) that impact the establishment of the L/R body axis. Interestingly, gsk-3 not only results in a reduced chiral counter-rotation velocity but also in an increased AP velocity (Figure 4—figure supplements 2–4). Error bars, error of the mean with 99% confidence. Yellow bars, significant difference to non-RNAi condition; brown bars, no significant difference.
Figure 4—figure supplement 1
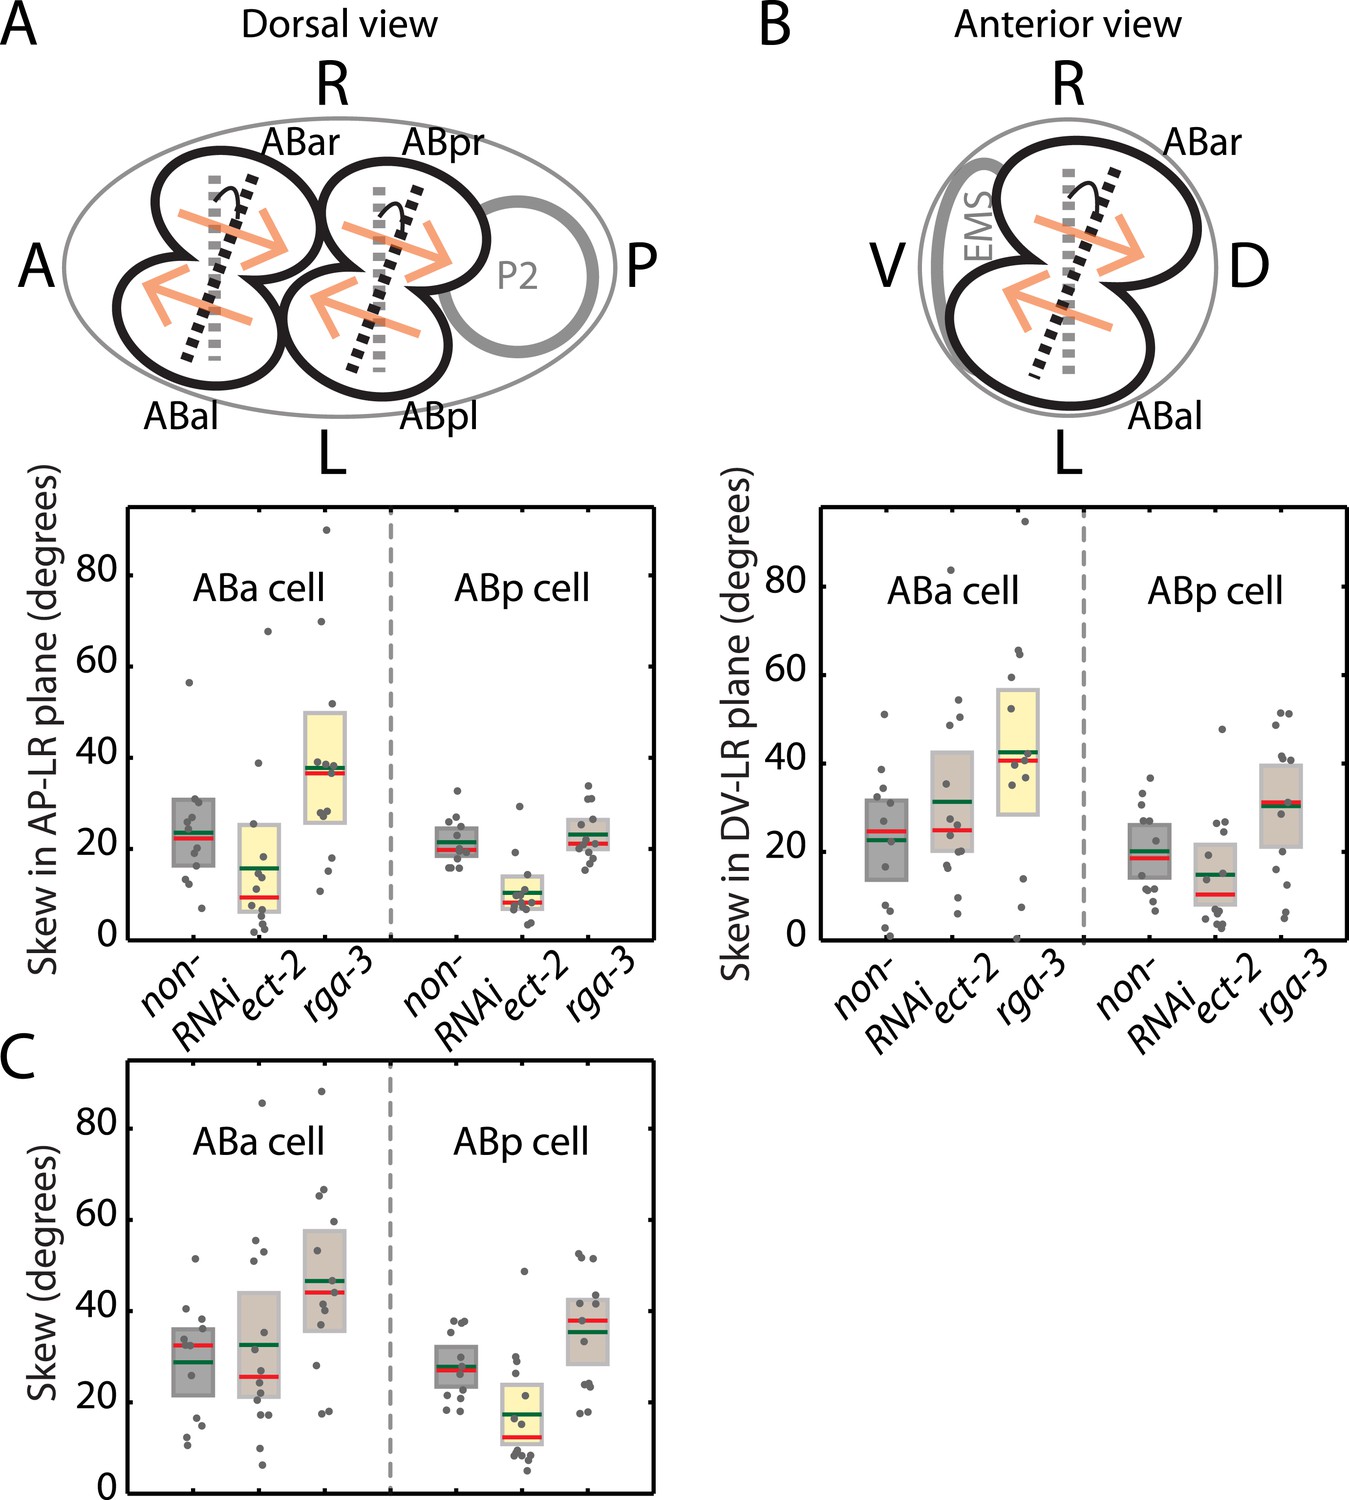
Chiral skew quantifications during bilateral symmetry breaking of the organism.
(A) A schematic of the skew angle measurement in the AP–LR plane. Gray dashed line, initial nuclei position; black dashed line, skewed nuclei position; beige arrows, direction of cortical flow on the dorsal surface (ABa counter-rotating flow shown in Video 6). Below, skew angles of ABa and ABp for non-RNAi (gray), ect-2 (RNAi) (4.5 hrs) and rga-3 (RNAi) (4.5 hrs) in the AP–LR plane. Gray circles, skew angle in individual videos; shaded areas, SEM; green horizontal lines, mean skew angle; red horizontal lines, median skew angle; yellow shaded areas, knockdown conditions with a significant difference (95% confidence with the Wilcoxon rank sum test) from the non-RNAi condition. (B) Same as (A) with the skew determined in the DV–LR plane. (C) Skew calculated without projections on to a particular plane.
Figure 4—figure supplement 2
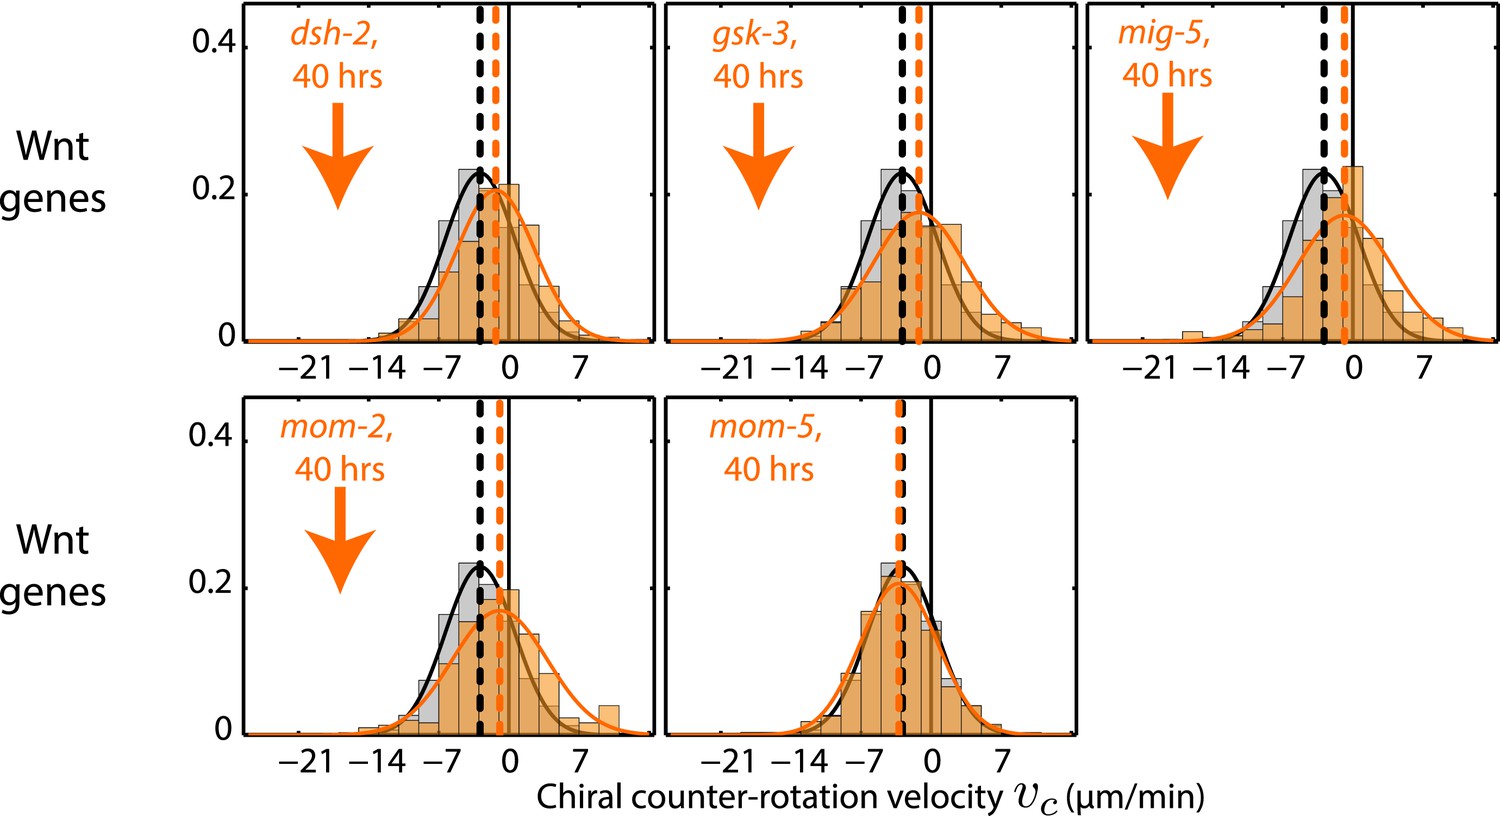
Chiral counter-rotation velocity vc for RNAi of Wnt signaling genes.
Each graph presents the instantaneous chiral counter-rotation velocity vc histogram for the RNAi condition specified (beige). The histogram from the non-RNAi condition is shown in gray. Downward arrows indicate a significant decrease and upward arrows indicate a significant increase in vc compared to the non-RNAi condition (Wilcoxon rank sum test with 99% confidence). The number of hours of RNAi is as indicated.
Figure 4—figure supplement 3
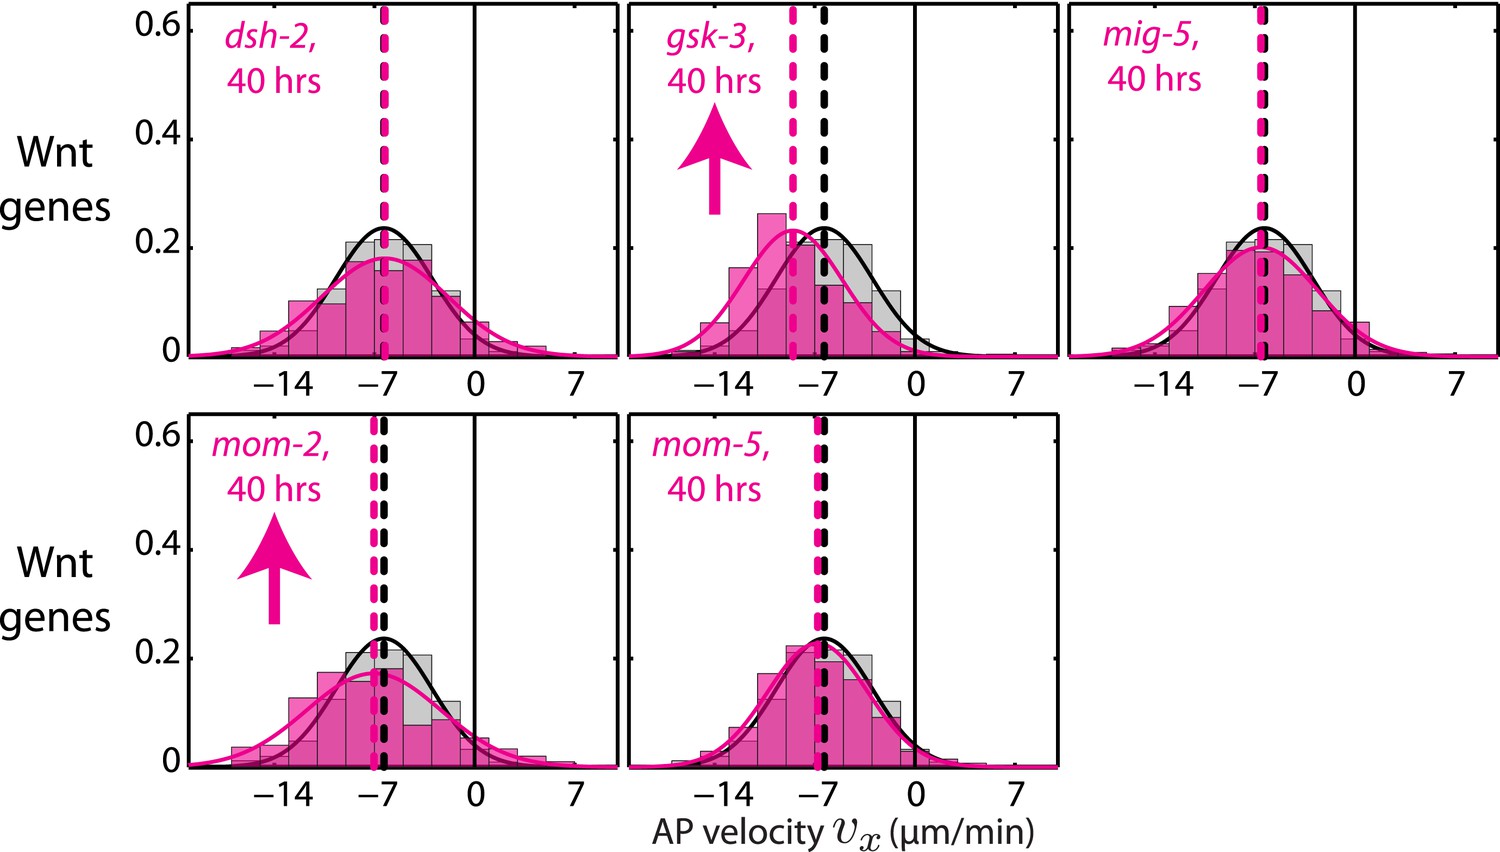
AP velocity vx for RNAi of Wnt signaling genes.
Each graph presents the instantaneous AP velocity vx histogram for the RNAi condition specified (magenta). The histogram from the non-RNAi condition is shown in gray. Downward arrows indicate a significant decrease and upward arrows indicate a significant increase in vx compared to the non-RNAi condition (Wilcoxon rank sum test with 99% confidence). The number of hours of RNAi is as indicated.
Figure 4—figure supplement 4
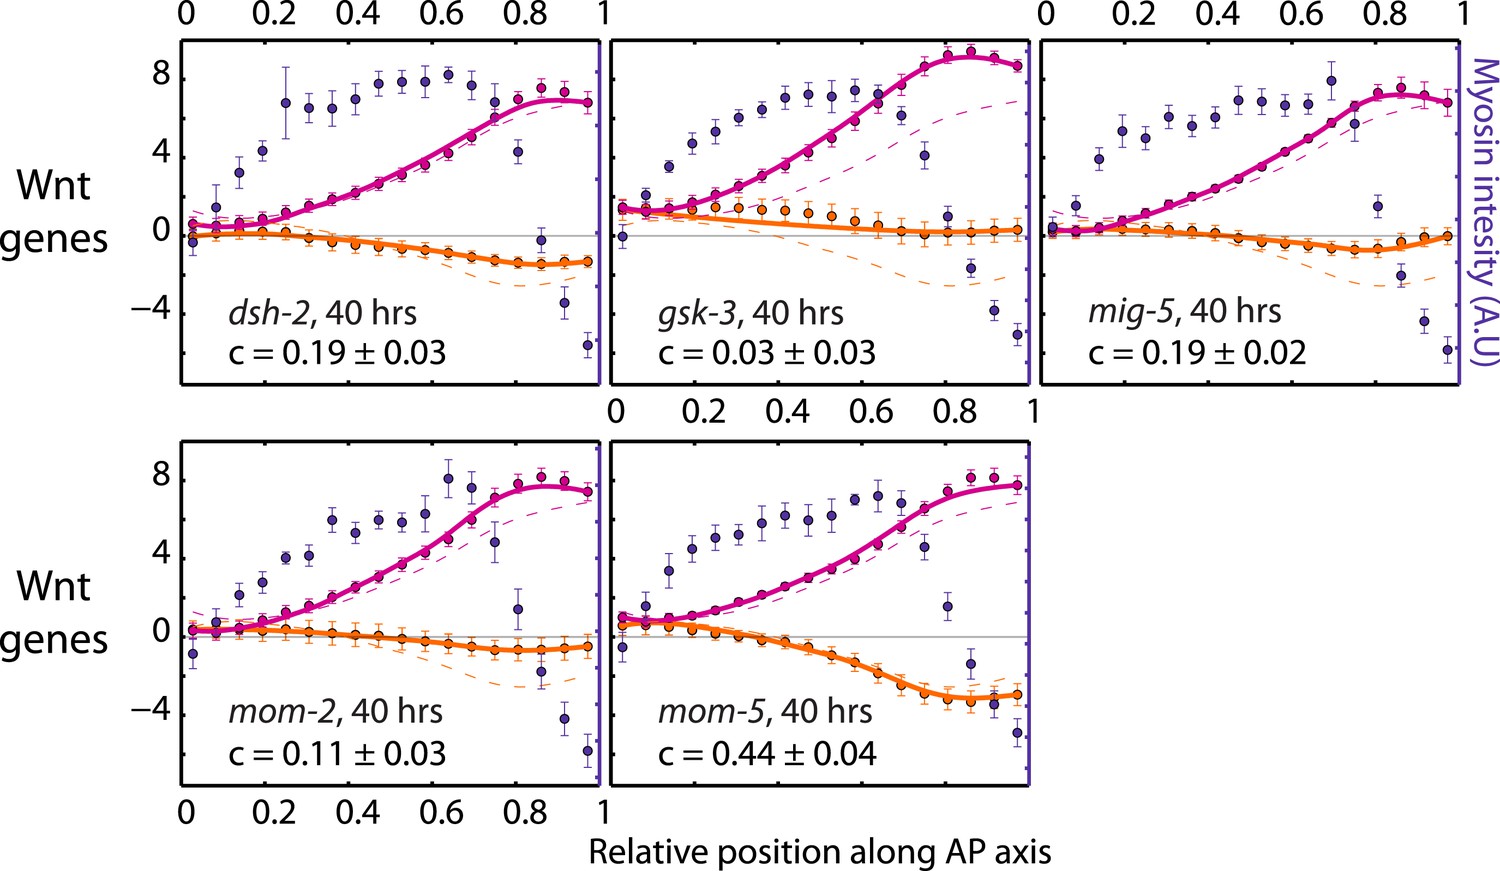
Theoretical velocity profiles for RNAi of Wnt signaling genes.
Each graph presents the respective average myosin intensity (blue markers) and velocity profiles (magenta markers, AP flow velocity vx; beige markers, y-velocity vy) along the AP axis for each RNAi condition specified. Error bars, SEM. Magenta and beige curves, respective theoretical velocity profiles. Dashed lines, non-RNAi theoretical velocity profiles. The number of hours of RNAi is as indicated. See Video 7.
Figure 4—figure supplement 5
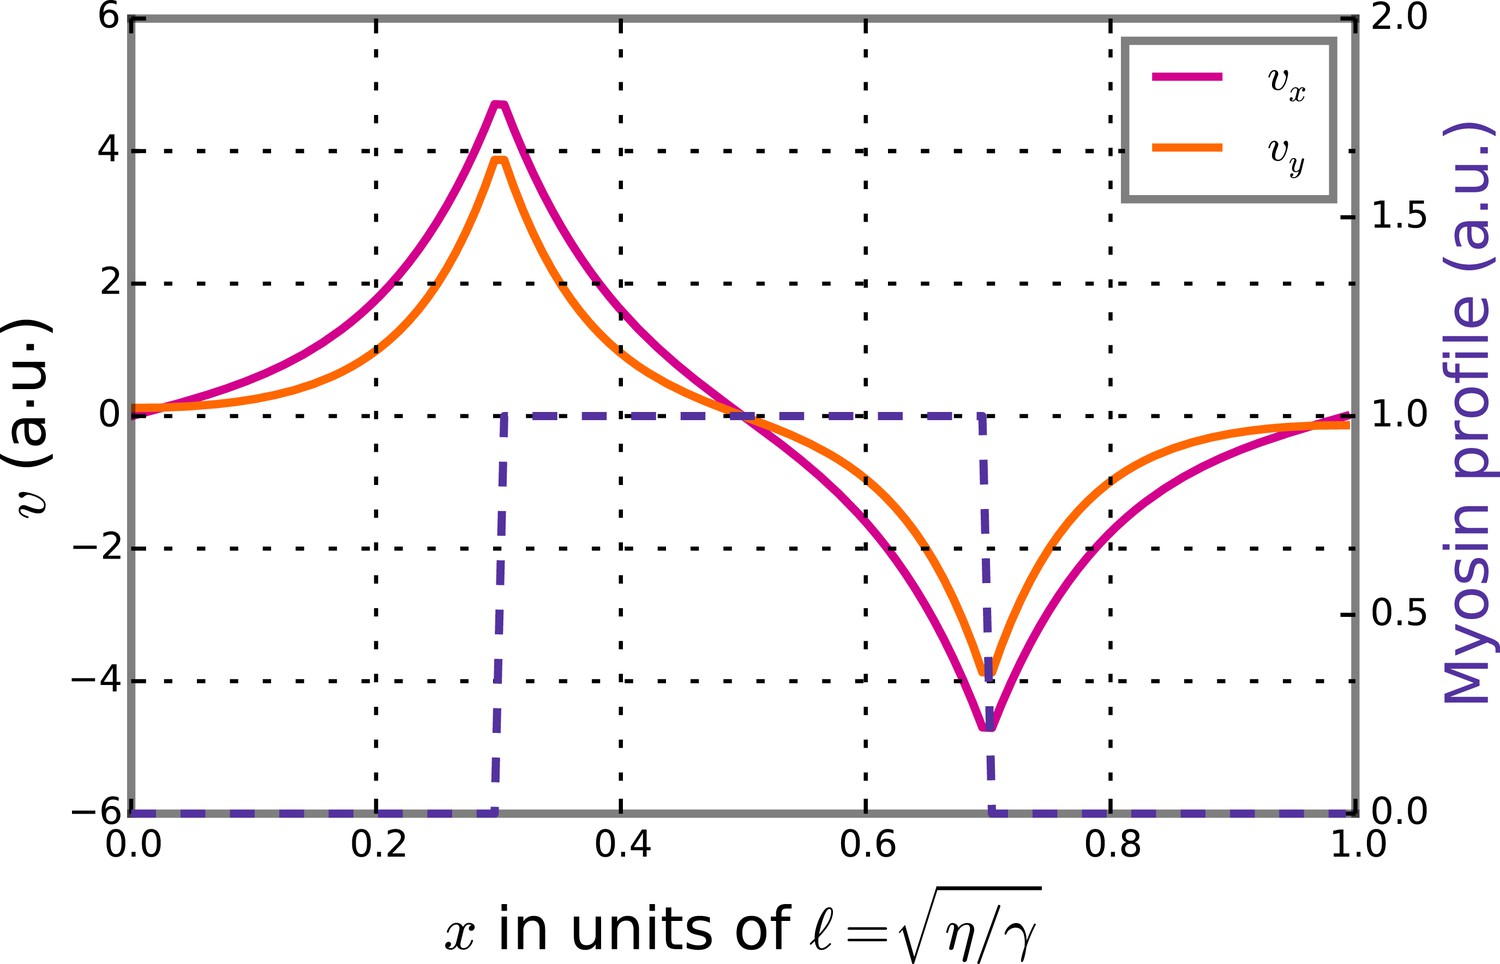
Theoretical velocity profiles for a stripe of high myosin activity.
The graph presents theoretical axial velocity vx (magenta) and chiral velocity vy (beige) profiles given a stripe of high myosin activity (blue). The gradient in myosin activity will then lead to axial flows along the gradient and directed towards the stripe as well as chiral flows orthogonal to the gradient leading to counter-rotations.
Videos
Video 1
Cortical flow breaks chiral symmetry.
Cortical flow during AP polarization of the C. elegans zygote exhibits chiral behaviors with the posterior and the anterior halves of the cortex counter-rotating relative to each other.
Video 2
Chiral flow depends on myosin activity.
8 hrs of mlc-4 (RNAi) leads to a substantial reduction of both AP and chiral flow.
Video 3
Chirality of the cortex is unaffected under weak perturbation of myosin activity.
4 and 6 hrs of mlc-4 (RNAi) leads to a proportional change of AP and chiral flow, with the chirality index remaining unchanged under these conditions.
Video 4
Chiral flow decreases with decreasing Rho activity.
ect-2 (RNAi) leads to a substantial reduction in chiral flow with a minimal change in AP flow.
Video 5
Chiral flow increases with increasing Rho activity.
rga-3 (RNAi) leads to a substantial increase in chiral flow with a minimal change in AP flow.
Video 6
Chiral flow accompanies the LR symmetry breaking skew event at the 4-cell stage.
Dorsal view of a representative 4-cell stage embryo, with ABa and ABp cells exhibiting counter-rotating cortical flow during cytokinesis, for 4.5 hrs of ect-2 (RNAi), non-RNAi and 4.5 hrs of rga-3 (RNAi). Anterior view of these Videos is shown at the bottom for visualizing counter-rotation in ABa cell. Flashing cyan arrows indicate the direction of counter-rotating cortical flow. Note that counter-rotation of AB cells is significantly reduced in ect-2 (RNAi) and significantly increased in rga-3 (RNAi) compared to the non-RNAi condition. Quantification of chiral flow velocities (Figure 4B) was performed in the ABa cell (marked in red).
Video 7
Wnt signaling genes regulate chiral flow.
RNAi of Wnt signaling genes leads to a substantial reduction in chiral flow.
Video 8
Chiral flow observed with an actin probe.
Cortical flow visualized through Lifeact::tagRFP-T exhibits similar chiral behaviors.
Download links
A two-part list of links to download the article, or parts of the article, in various formats.
Downloads (link to download the article as PDF)
Open citations (links to open the citations from this article in various online reference manager services)
Cite this article (links to download the citations from this article in formats compatible with various reference manager tools)
Active torque generation by the actomyosin cell cortex drives left–right symmetry breaking
eLife 3:e04165.
https://doi.org/10.7554/eLife.04165


