Phosphatidic acid modulation of Kv channel voltage sensor function
- Howard Hughes Medical Institute, Rockefeller University, United States
Figures
Figure 1 with 1 supplement

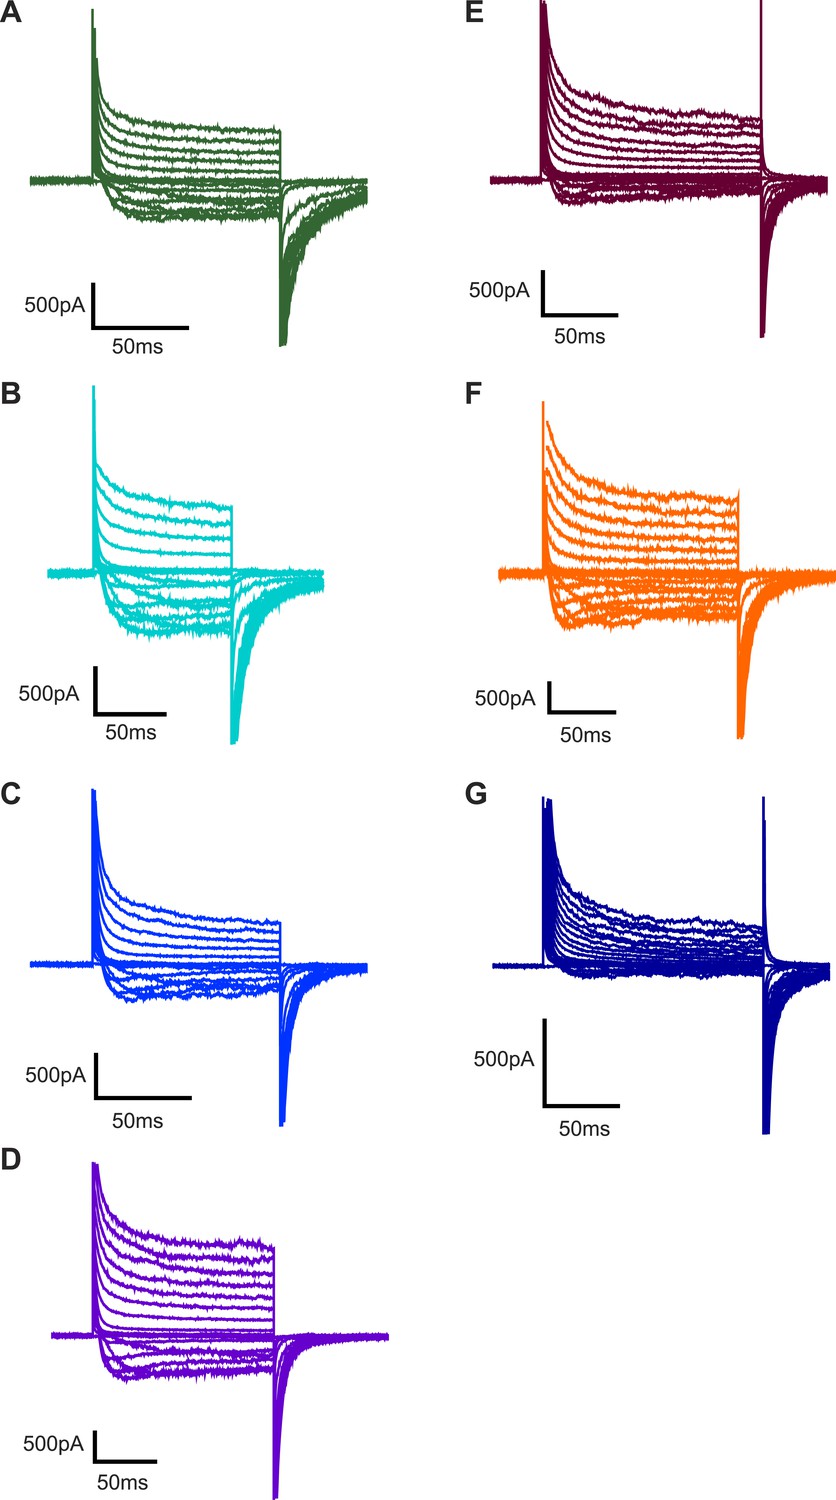
POPA modifies Kv channel gating.
(A) Representative family of currents recorded from Kv channels in DPhPC bilayers. Voltage is stepped from a holding voltage of −110 mV to increasingly more positive depolarization voltages (−110 mV to +80 mV; ΔV = 10 mV) and then returned to the holding voltage of −110 mV. (B) Normalized tail currents (mean ± SEM) from current families recorded from Kv channels in DPhPC bilayers are fit with a Boltzmann function with half activation voltage Vmid = −71 ± 1 mV, Z = 4.2, N = 8. (C) Representative family of currents recorded from Kv channels in DPhPC:POPA (3:1) bilayers from a holding voltage of −80 mV to increasingly more positive depolarization voltages (−80 mV to +40 mV; ΔV = 10 mV) and then returned to the holding voltage of −80 mV. (D) Normalized tail currents (mean ± SEM) from current families recorded from Kv channels in different lipid mixtures are fit with Boltzmann functions (DPhPC:POPA (3:1) Vmid = −40 ± 2 mV, Z = 2.6, N = 7; DPhPC:POPC (3:1) Vmid = −66 ± 1 mV, Z = 4.0, N = 6; DPhPC:POPE (3:1) Vmid = −64 ± 1 mV, Z = 3.0, N = 7; DPhPC:POPG (3:1) Vmid = −62 ± 1 mV, Z = 2.9, N = 9; DPhPC:POPS (3:1) Vmid = −59 ± 1 mV, Z = 3.8, N = 6; DPhPC:PI (3:1) Vmid = −63 ± 1 mV, Z = 2.6, N = 7; DPhPC:Sphingomyelin (3:1) Vmid = −66 ± 1 mV, Z = 3.9, N = 6; DPhPC:Cardiolipin (3:1) Vmid = −60 ± 1 mV, Z = 3.4, N = 6; DPhPC Vmid = −71 ± 1 mV, Z = 4.2, N = 8).
Figure 1—figure supplement 1
Representative families of currents recorded from Kv channels.
Representative families of currents recorded from Kv channels in (A) DPhPC:POPC (3:1) bilayers, (B) DPhPC:POPE (3:1) bilayers, (C) DPhPC:POPG (3:1) bilayers, (D) DPhPC:POPS (3:1) bilayers, (E) DPhPC:PI (3:1) bilayers, (F) DPhPC:Sphingomyelin (3:1) bilayers, and (G) DPhPC:Cardiolipin (3:1) bilayers. Voltage is stepped from a holding voltage of −110 mV to increasingly more positive voltages (−110 mV to +80 mV; ΔV = 10 mV) and then returned to the holding voltage of −110 mV for A–D, F or −90 mV for E and G.
Figure 2 with 1 supplement

Concentration dependence of Kv channel activation by POPA.
(A) Normalized tail currents (mean ± SEM) from current families recorded from Kv channels in DPhPC:POPA mixtures are fit with Boltzmann functions (DPhPC Vmid = −71 ± 1 mV, Z = 4.2, N = 8; DPhPC:POPA (19:1) Vmid = −60 ± 1 mV, Z = 3.7, N = 8; DPhPC:POPA (9:1) Vmid = −43 ± 2 mV, Z = 2.7, N = 5; DPhPC:POPA (3:1) Vmid = −40 ± 2 mV, Z = 2.6, N = 7; DPhPC:POPA (1:1) Vmid = −33 ± 1 mV, Z = 3.5, N = 6; POPA Vmid = −31 ± 2 mV, Z = 2.7, N = 6). (B) Plot of Vmid determined from fit of tail currents to the Boltzmann equation vs mole fraction of POPA for Kv channels in bilayers containing DPhPC:POPA (red) or POPE:POPA (green) mixtures.
Figure 2—figure supplement 1
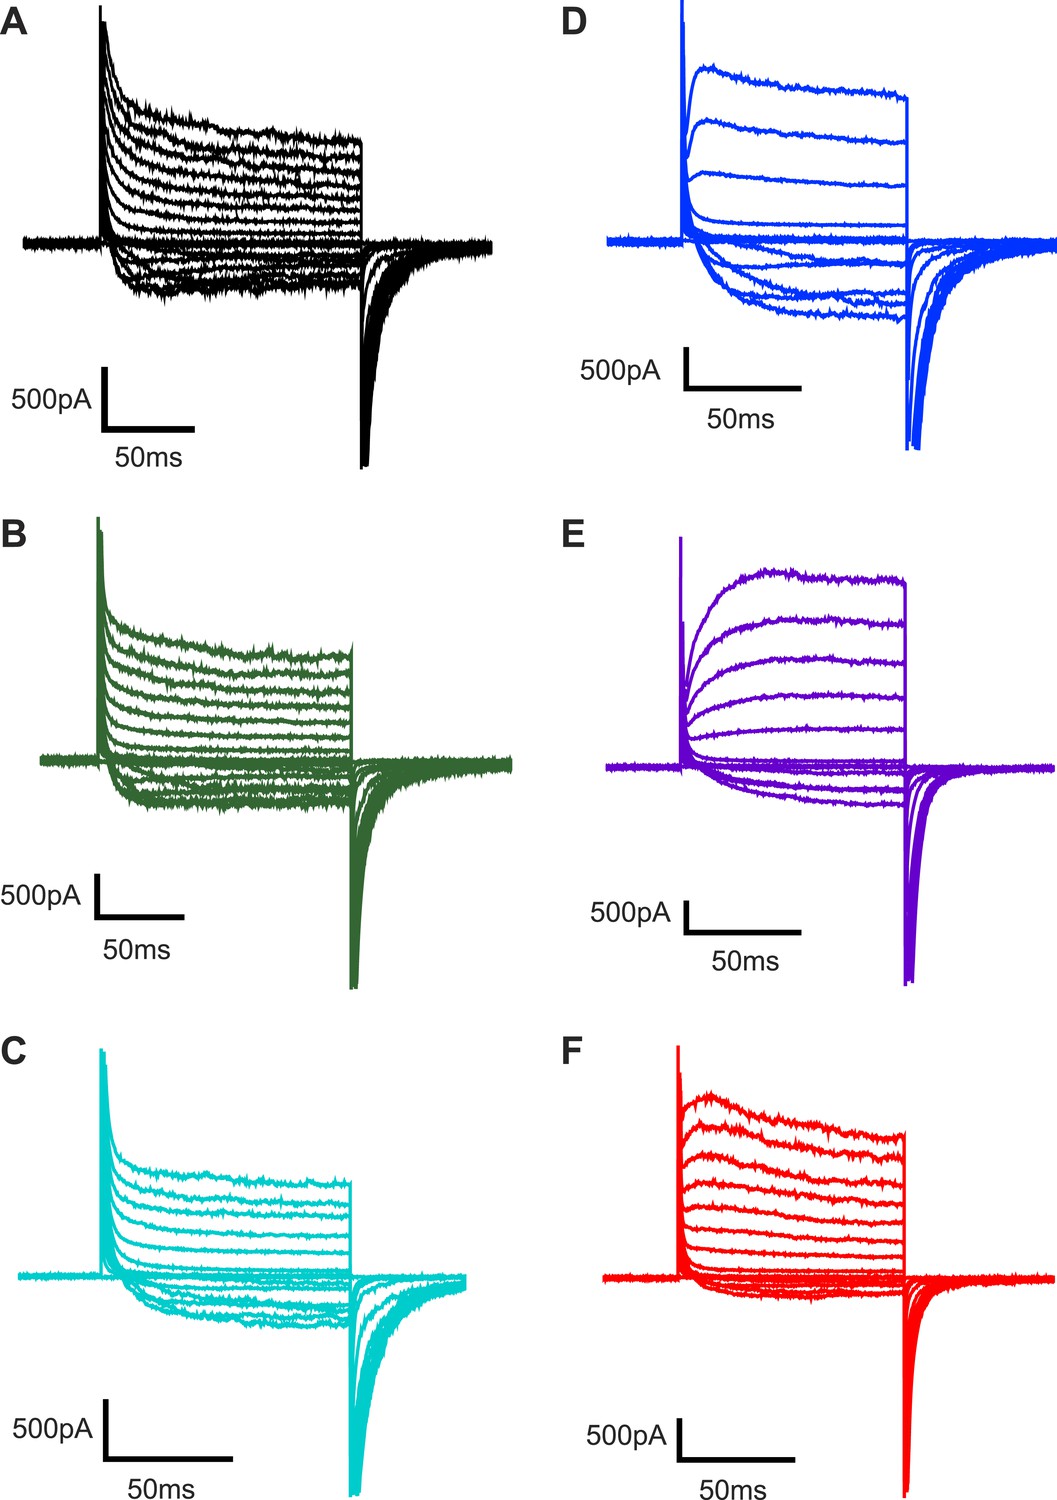
Representative families of currents recorded from Kv channels.
Representative families of currents recorded from Kv channels in (A) DPhPC bilayers, (B) DPhPC:POPA (19:1) bilayers, (C) DPhPC:POPA (9:1) bilayers, (D) DPhPC:POPA (3:1) bilayers, (E) DPhPC:POPA (1:1) bilayers and (F) POPA bilayers. For A–C, voltage is stepped from a holding voltage of −110 mV to increasingly more positive voltages (−110 mV to +80 mV; ΔV = 10 mV) and then returned to a holding voltage of −110 mV. For D–F, voltage is stepped from a holding voltage of −90 mV to increasingly more positive voltages (−90 mV to +70 mV; ΔV = 10 mV) and then returned to the holding voltage of −90 mV.
Figure 3 with 1 supplement
Concentration dependence of Kv channel activation by phospholipids.
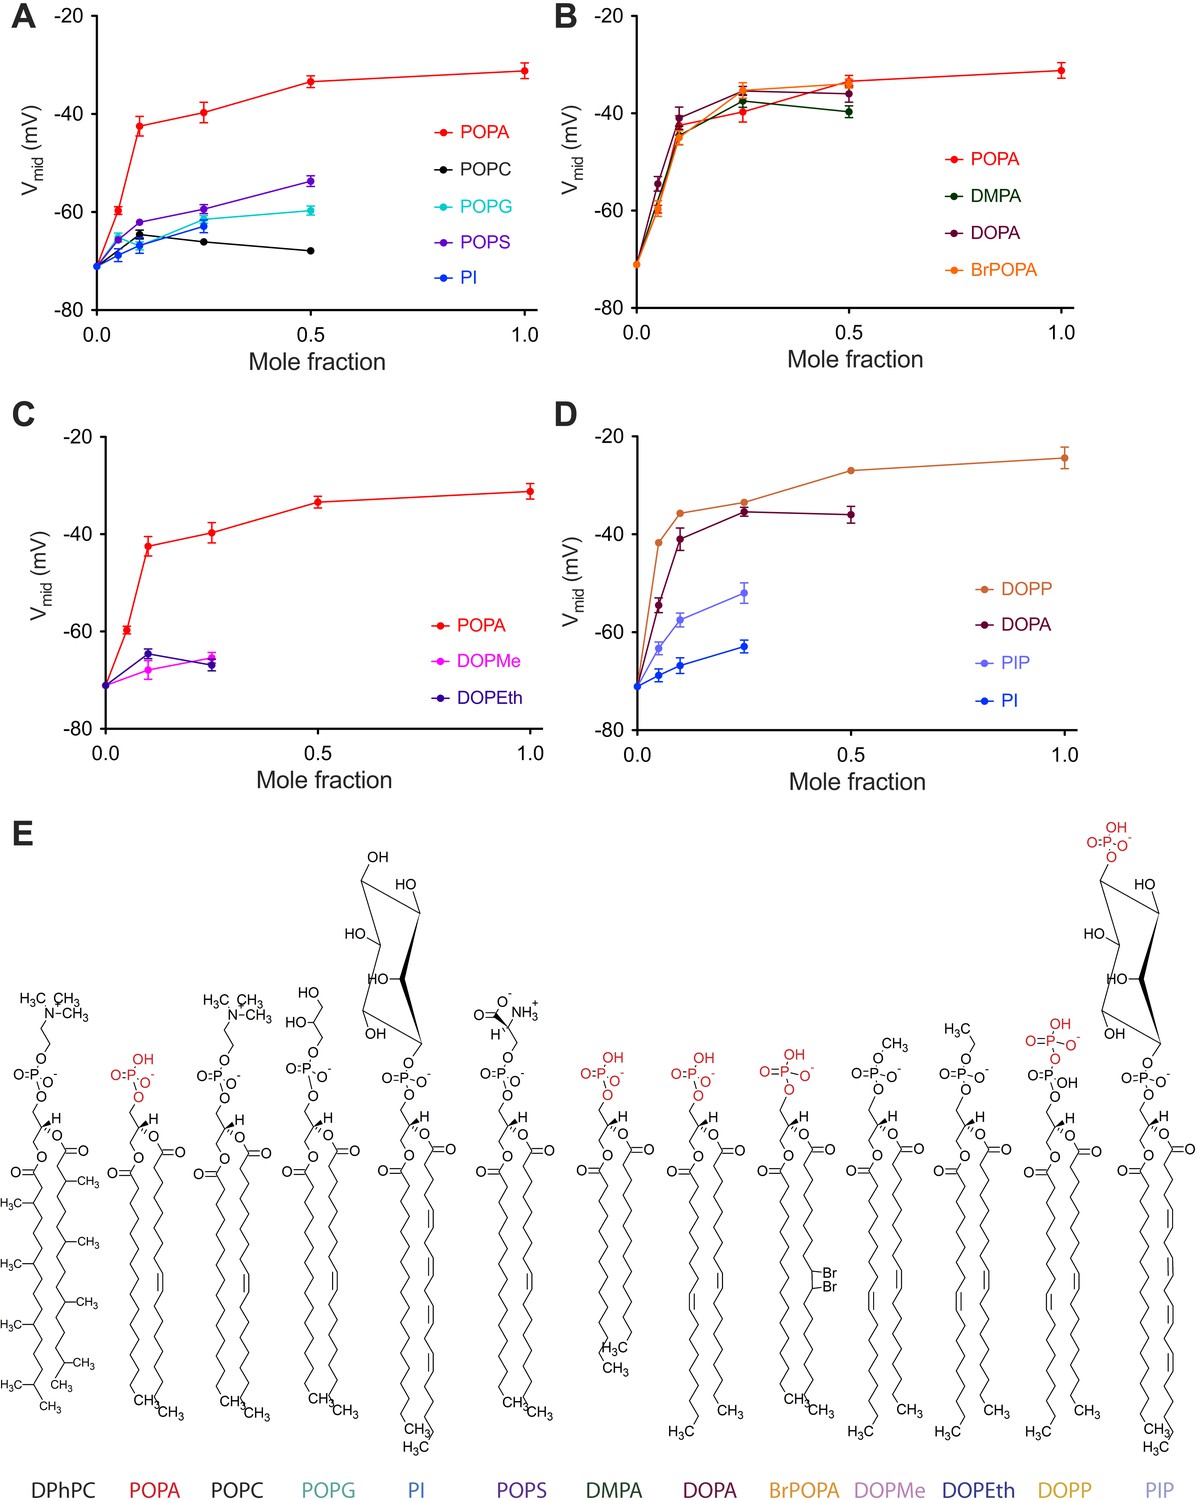
(A) Plot of Vmid determined from a fit of tail currents to the Boltzmann equation vs phospholipid mole fraction for Kv channels in bilayers containing DPhPC:POPA (red), DPhPC:POPC (black), DPhPC:POPG (teal), DPhPC:POPS (purple) and DPhPC:PI (blue) mixtures. (B) Plot of Vmid determined from a fit of tail currents to the Boltzmann equation vs phospholipid mole fraction for Kv channels in bilayers containing DPhPC:POPA (red), DPhPC:DMPA (green), DPhPC:DOPA (burgundy) and DPhPC:BrPOPA (orange) mixtures. (C) Plot of Vmid determined from a fit of tail currents to the Boltzmann equation vs phospholipid mole fraction for Kv channels in bilayers containing DPhPC:POPA (red), DPhPC:DOPMe (pink) and DPhPC:DOPEth (blue) mixtures. (D) Plot of Vmid determined from a fit of tail currents to the Boltzmann equation vs phospholipid mole fraction for Kv channels in bilayers containing DPhPC:DOPP (orange), DPhPC:DOPA (burgundy), DPhPC:PIP (violet) and DPhPC:PI (blue) mixtures. (E) Molecular structures of phospholipids analyzed in A–D with primary phosphates highlighted in red.
Figure 3—figure supplement 1
Representative families of currents recorded from Kv channels.
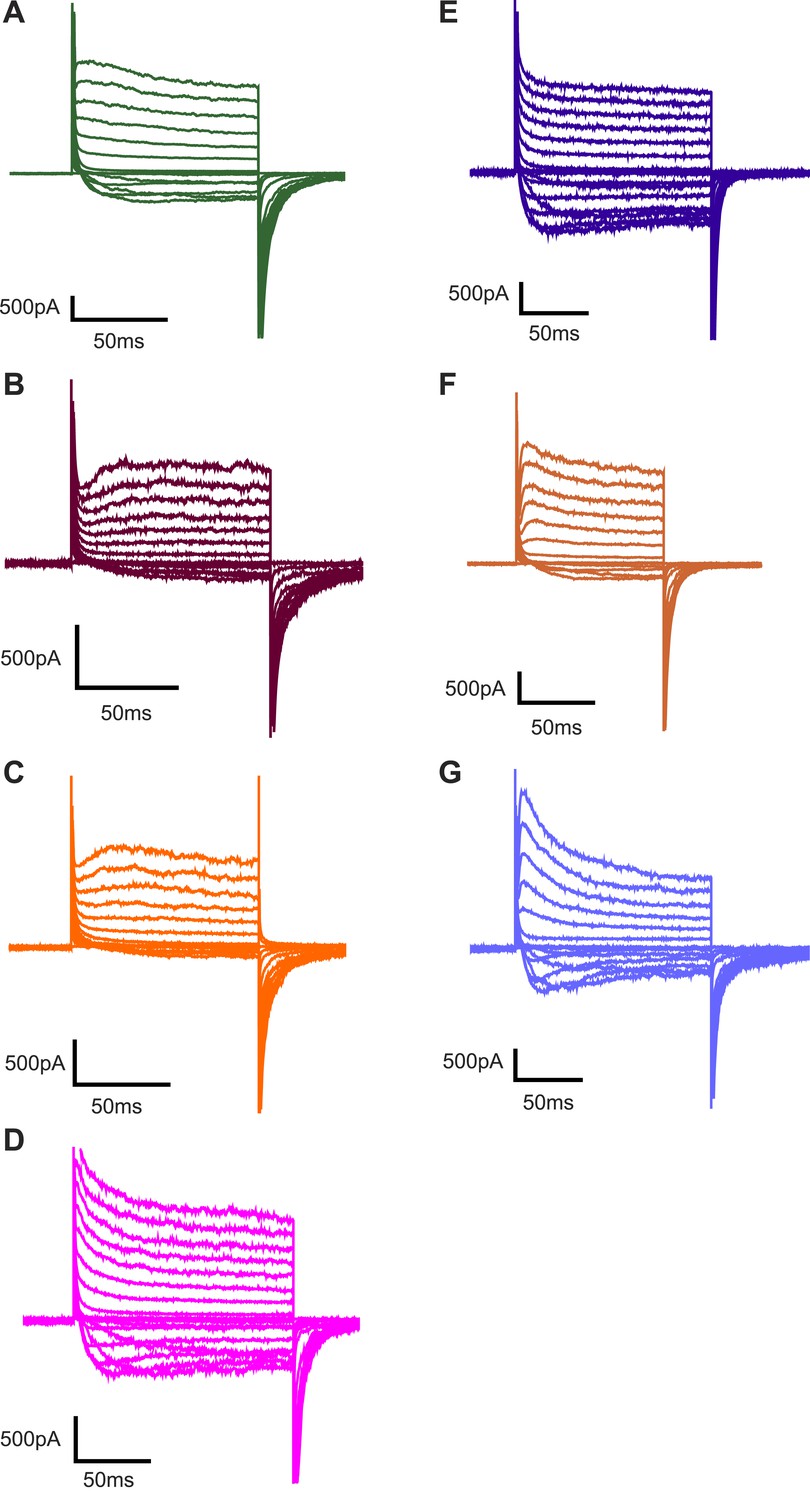
Representative families of currents recorded from Kv channels in (A) DPhPC:DMPA (3:1) bilayers, (B) DPhPC:DOPA (3:1) bilayers, (C) DPhPC:BrPOPA (3:1) bilayers, (D) DPhPC:DOPMe (3:1) bilayers, (E) DPhPC:DOPEth (3:1) bilayers (F) DPhPC:DOPP bilayers and (G) DPhPC:PIP bilayers. For A, B and F, voltage is stepped from a holding voltage of −90 mV to increasingly more positive voltages (−90 mV to +80 mV; ΔV = 10 mV) and then returned to the holding voltage of −90 mV. For C, voltage is stepped from a holding voltage of −90 mV to increasingly more positive voltages (−90 mV to +80 mV; ΔV = 10 mV) and then returned to −70 mV. For D, E and G, voltage is stepped from a holding voltage of −110 mV to increasingly more positive voltages (−110 mV to +70 mV; ΔV = 10 mV) and then returned to the holding voltage of −110 mV.
Figure 4 with 1 supplement
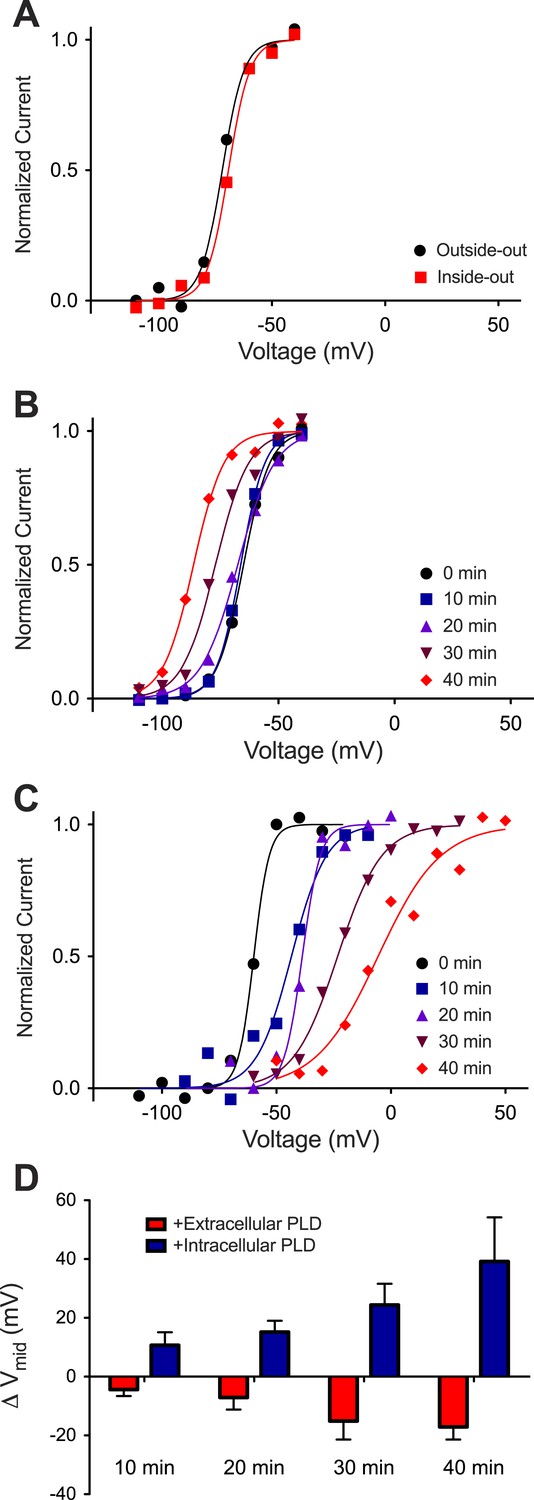
Kv activation in Phospholipase D1-treated DPhPC bilayers.
(A) Normalized tail currents from representative current families recorded from Kv channels in a DPhPC bilayer (black–outside-out facing channels, Vmid = −72 mV; red–inside-out facing channels, Vmid = −69 mV) are fit to the Boltzmann equation. (B) Normalized tail currents from representative current families recorded from Kv channels in a DPhPC bilayer following addition of 50 units/ml S. chromofuscus phospholipase D1 to the extracellular membrane are fit to the Boltzmann equation (black 0 min, Vmid = −65 mV; blue 10 min, Vmid = −66 mV; purple 20 min, Vmid = −68 mV; burgundy 30 min Vmid = −77 mV; red 40 min, Vmid = −87 mV). (C) Normalized tail currents from representative current families recorded from Kv channels in a DPhPC bilayer following addition of 50 units/ml S. chromofuscus phospholipase D1 to the intracellular side of the membrane are fit to the Boltzmann equation (black 0 min, Vmid = −60 mV; blue 10 min, Vmid = −43 mV; purple 20 min, Vmid = −38 mV; burgundy 30 min, Vmid = −23 mV; red 40 min, Vmid = −6 mV). (D) Average change in Vmid following addition of 50 units/ml S. chromofuscus phospholipase D1 to the intracellular or extracellular side of the membrane (ΔVmid = Vmid (t)–Vmid (t = 0); 10 min intracellular ΔVmid = 11 mV, extracellular ΔVmid = −4 mV, N = 5; 20 min intracellular ΔVmid = 15 mV, extracellular ΔVmid = −7 mV, N = 5; 30 min intracellular ΔVmid = 24 mV, extracellular ΔVmid = −15 mV, N = 4; 40 min intracellular ΔVmid = 39 mV, extracellular ΔVmid = −17 mV, N = 2).
Figure 4—figure supplement 1
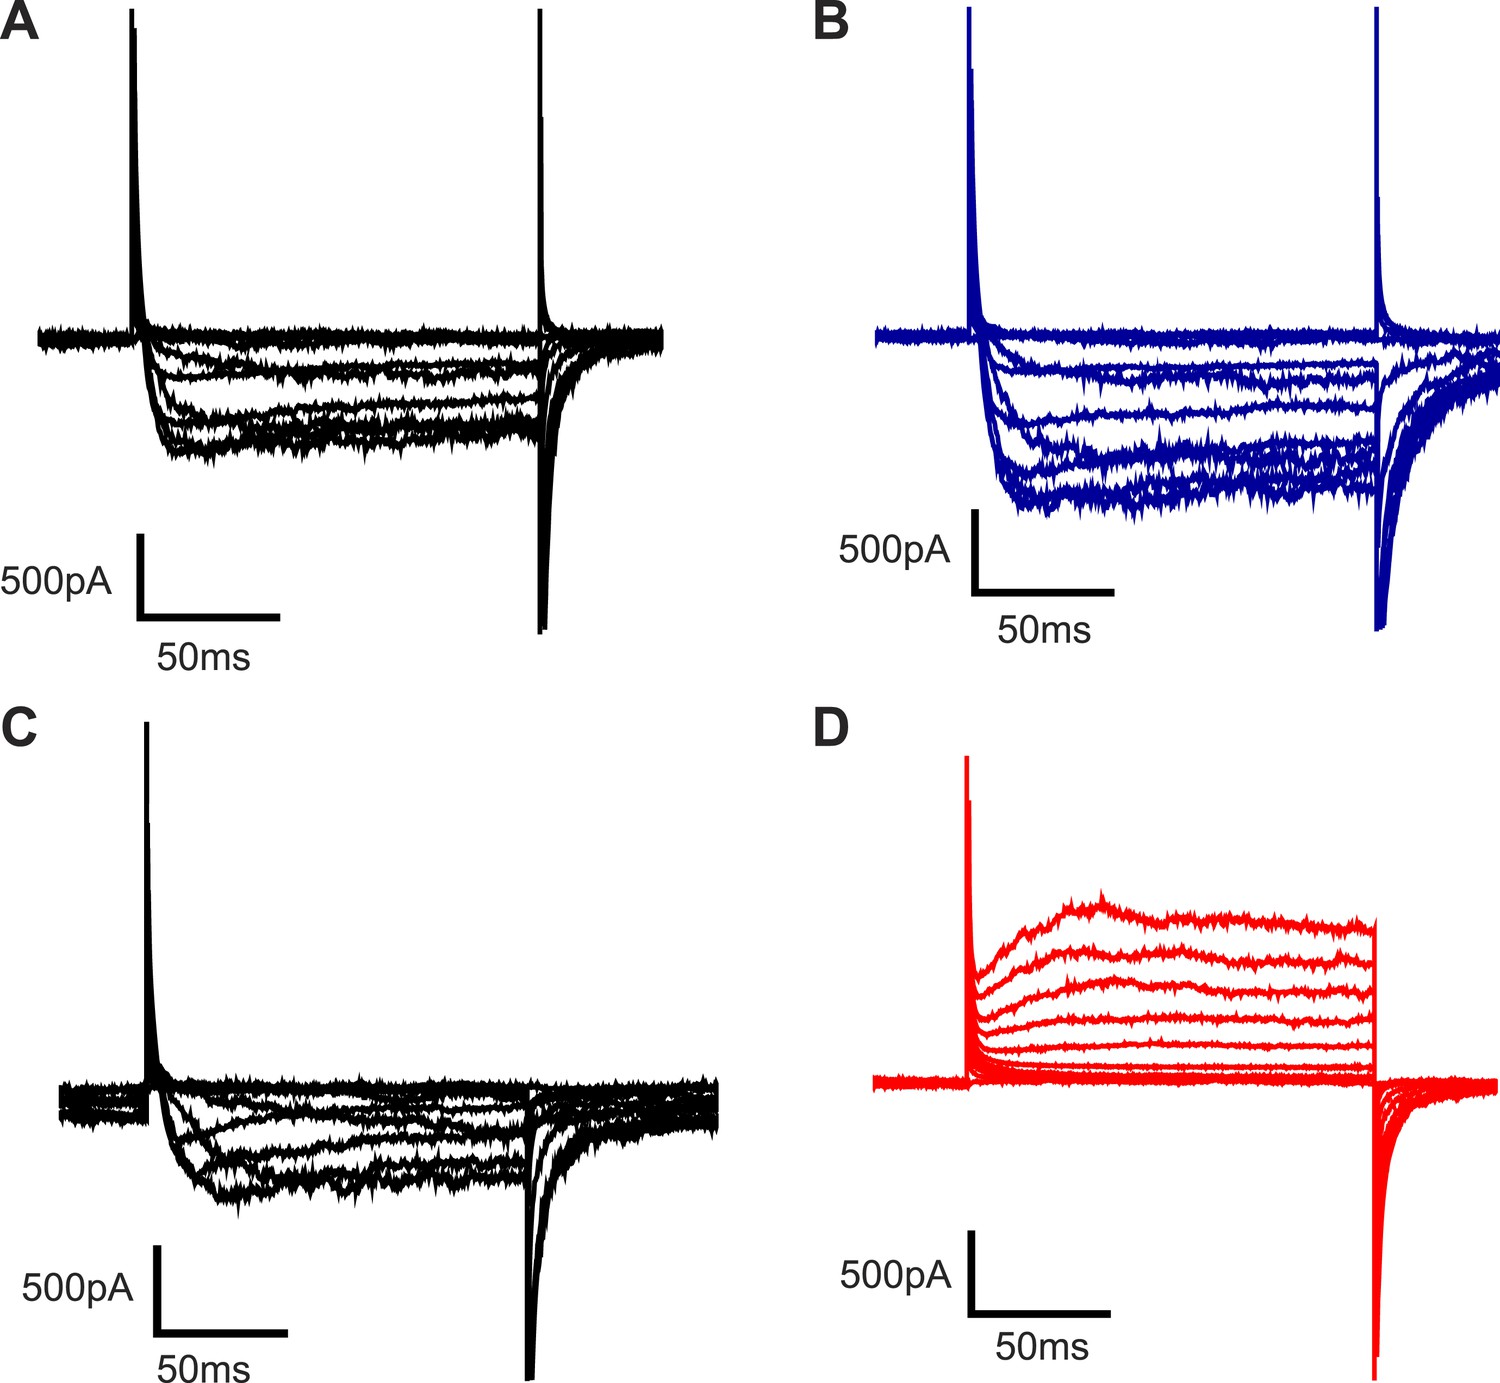
Representative families of currents recorded from Kv channels in Phospholipase D1-treated DPhPC bilayers.
Representative families of currents recorded from Kv channels in DPhPC bilayers (A) 0 and (B) 40 min after addition of 50 units/ml S. chromofuscus phospholipase D1 to the extracellular side of the membrane. Representative families of currents recorded from Kv channels in DPhPC bilayers (C) 0 and (D) 40 min after addition of 50 units/ml S. chromofuscus phospholipase D1 to the intracellular side of the membrane. For A, voltage is stepped from a holding voltage of −110 mV to increasingly more positive voltages (−110 mV–0 mV; ΔV = 10 mV) then returned to the holding voltage of −110 mV. For B, voltage is stepped from a holding voltage of −130 mV to increasingly more positive voltages (−130 mV–0 mV; ΔV = 10 mV) then returned to the holding voltage of −130 mV. For C, voltage is stepped from a holding voltage of +110 mV to increasingly more negative voltages (+110 mV–0 mV; ΔV = −10 mV) then returned to the holding voltage of +110 mV. For D, voltage is stepped from a holding voltage of +80 mV to increasingly more negative voltages (+80 mV to −50 mV; ΔV = −10 mV) then returned to the holding voltage of +80 mV.
Figure 5
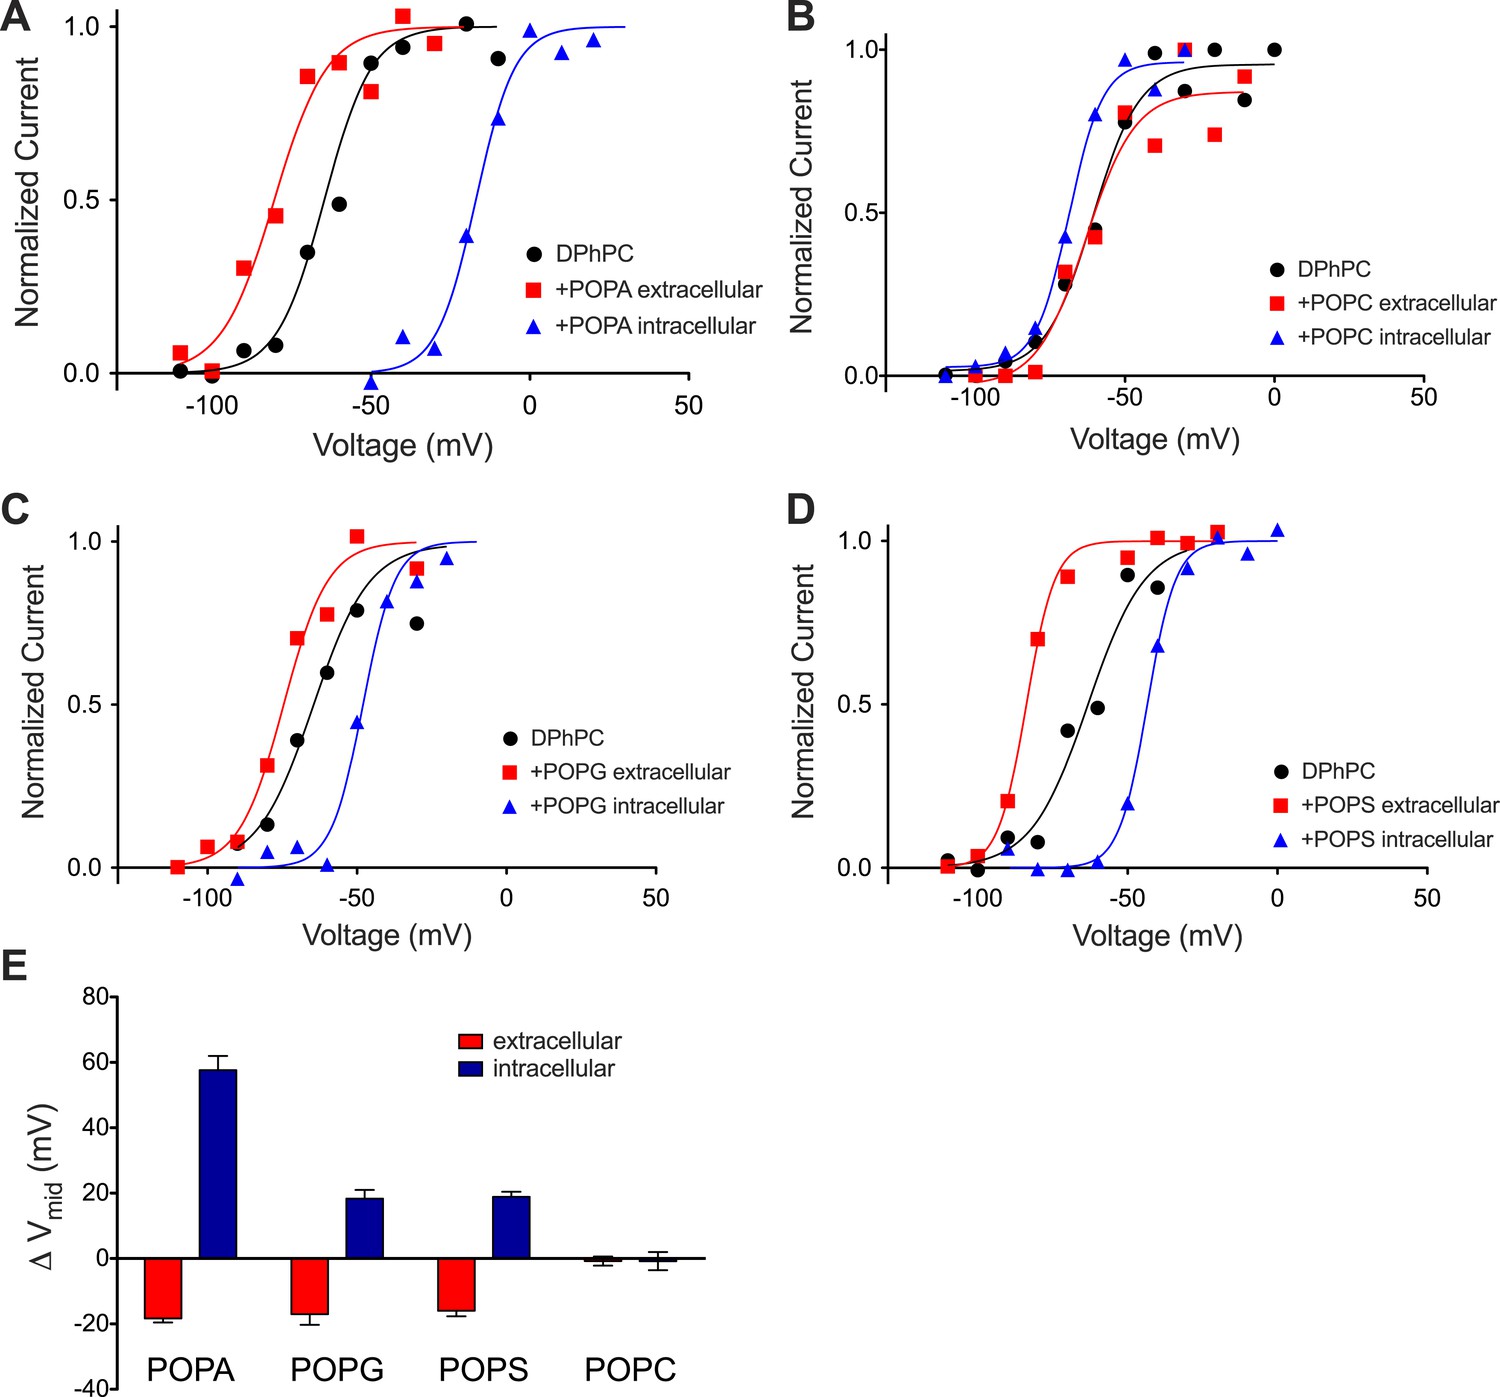
Kv activation in DPhPC bilayers fused with phospholipid vesicles.
(A) Normalized tail currents from representative current families recorded from Kv channels in a DPhPC bilayer before (black, Vmid = −65 mV) and after fusion of POPA vesicles to the extracellular (red, Vmid = −80 mV) or intracellular (blue, Vmid = −17 mV) surface of the bilayer are fit to the Boltzmann equation. (B) Normalized tail currents from representative current families recorded from Kv channels in a DPhPC bilayer before (black, Vmid = −61 mV) and following fusion of POPC vesicles to the extracellular (red, Vmid = −63 mV) or intracellular (blue, Vmid = −69 mV) surface of the bilayer are fit to the Boltzmann equation. (C) Normalized tail currents from representative current families recorded from Kv channels in a DPhPC bilayer before (black, Vmid = −65 mV) and following fusion of POPG vesicles to the extracellular (red, Vmid = −76 mV) or intracellular (blue, Vmid = −48 mV) surface of the bilayer are fit to the Boltzmann equation. (D) Normalized tail currents from representative current families recorded from Kv channels in a DPhPC bilayer before (black, Vmid = −63 mV) and following fusion of POPS vesicles to the extracellular (red, Vmid = −83 mV) or intracellular (blue, Vmid = −43 mV) surface of the bilayer are fit to the Boltzmann equation. (E) Average change in Vmid following addition of phospholipid vesicles to the intracellular or extracellular side of the membrane (ΔVmid = Vmid (vesicle fusion)–Vmid (no fusion); POPA extracellular ΔVmid = −18 mV, intracellular ΔVmid = 58 mV, N = 4; POPG extracellular ΔVmid = −17 mV, intracellular ΔVmid = −18 mV, N = 4; POPS extracellular ΔVmid = −16 mV, intracellular ΔVmid = 19 mV, N = 4; POPC extracellular ΔVmid = −1 mV, intracellular ΔVmid = −1 mV, N = 3).
Figure 6
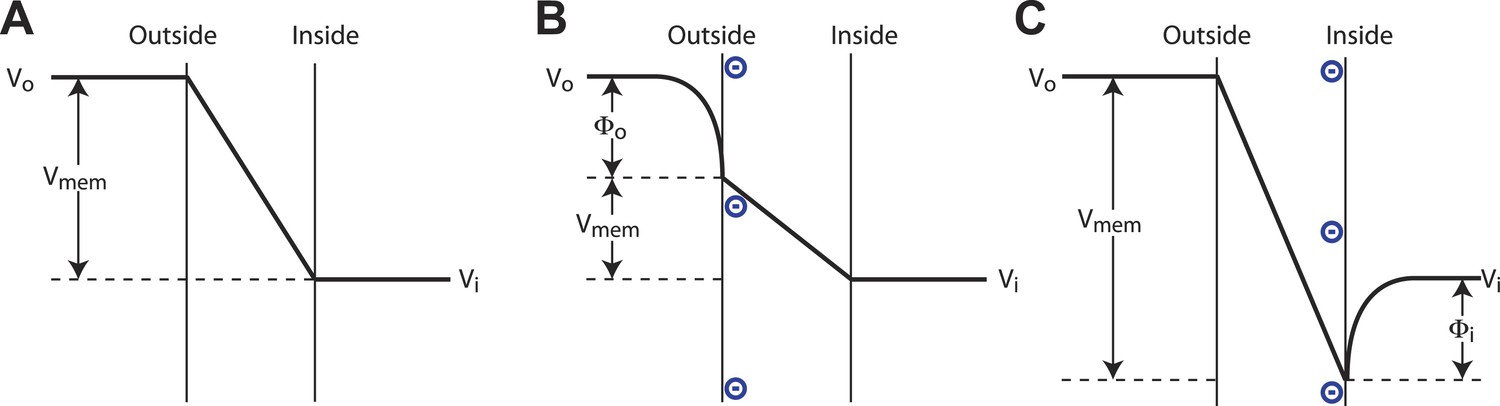
Surface charge voltage offset in phospholipid membranes.
(A) In symmetric membranes lacking charged phospholipids, Vmem, the voltage to which channels respond, is equal to the command voltage, Vi − Vo, set on the amplifier. (B) In asymmetric membranes containing anionic lipids exclusively in the outer leaflet of the membrane, Vmem is equal to the command voltage, Vi − Vo, minus the surface potential of the outer membrane, Φo. (C) In asymmetric membranes containing anionic lipids exclusively in the inner leaflet of the membrane, Vmem is equal to the command voltage, Vi − Vo, plus the surface potential of the inner membrane, Φi.
Figure 7 with 1 supplement
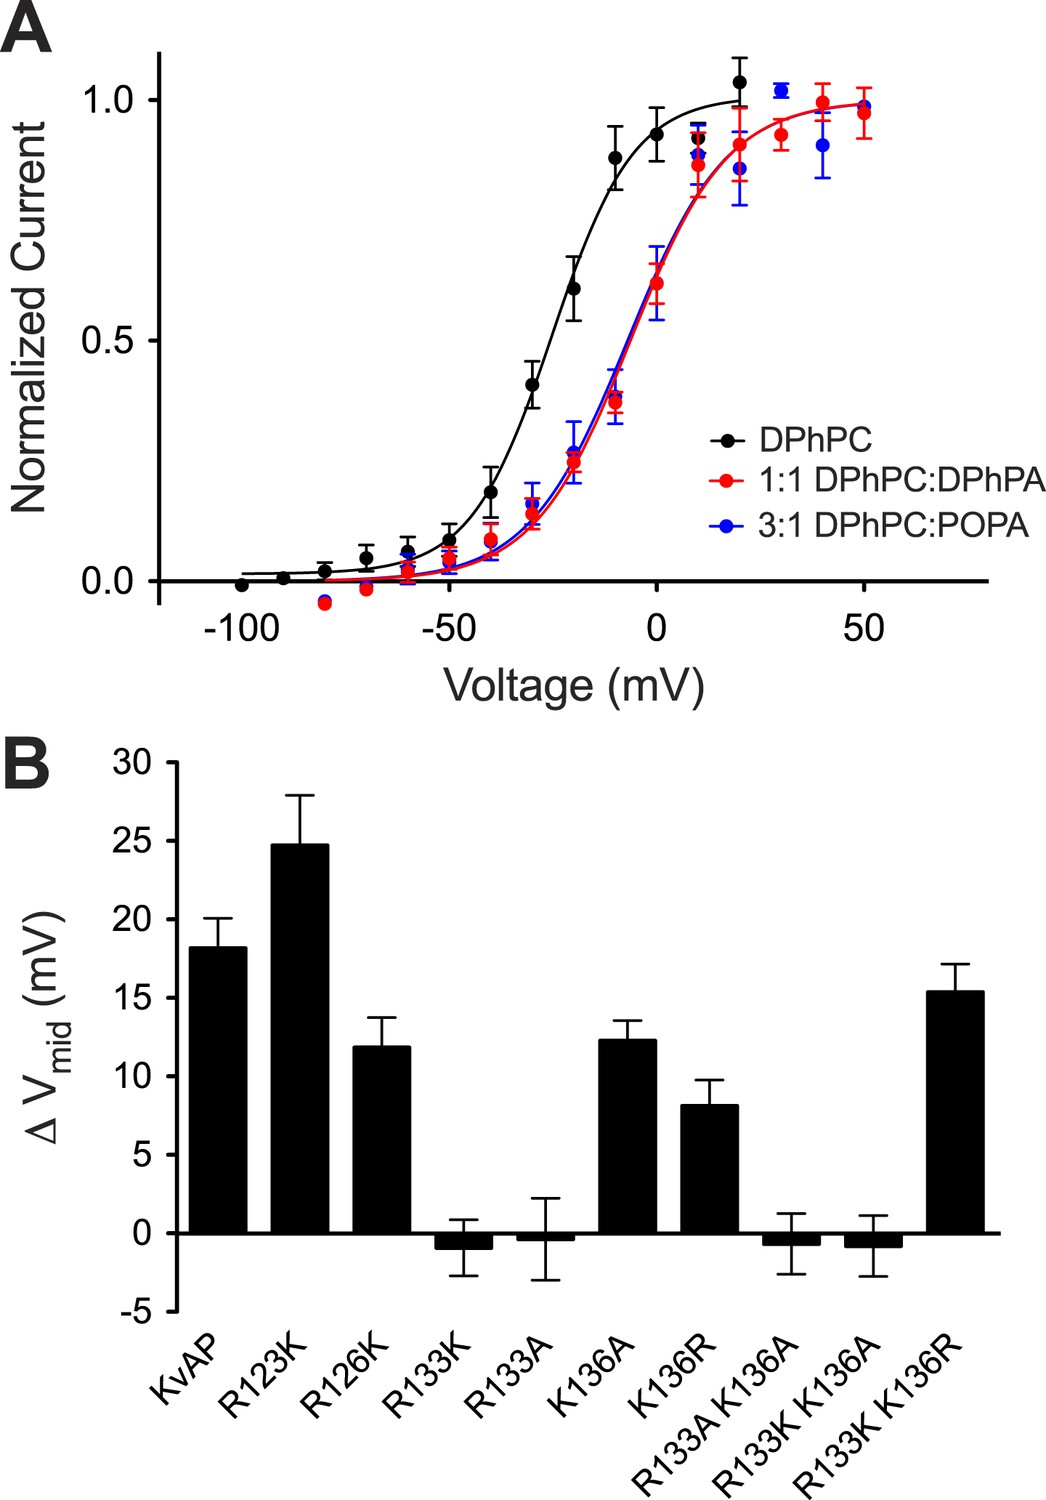
Phosphatidic acid modifies KvAP activation.
(A) Normalized tail currents (mean ± SEM) from current families recorded from KvAP in DPhPC bilayers (black, Vmid = −25 ± 1 mV, Z = 2.6, N = 8), DPhPC:DPhPA (1:1) bilayers (red, Vmid = −6 ± 1 mV, Z = 2.2, N = 6) and DPhPC:POPA (3:1) bilayers (blue, Vmid = −7 ± 2 mV, Z = 2.2, N = 5) are fit to the Boltzmann equation. (B) Average difference in Vmid between DPhPC and DPhPC:DPhPA (1:1) membranes for KvAP and KvAP mutant channels (ΔVmid = Vmid (DPhPC:DPhPA 1:1)–Vmid (DPhPC)). The bar heights correspond to KvAP 18 mV, N = 5; R123K 24 mV, N = 5; R126K 12 mV, N = 5; R133K −1 mV, N = 6; R133A 0 mV, N = 5; K136A 12 mV, N = 5; K136R 8 mV, N = 5; R133A K136A −1 mV, N = 6; R133K K136A −1 mV, N = 5; R133K K136R 15 mV, N = 5.
Figure 7—figure supplement 1
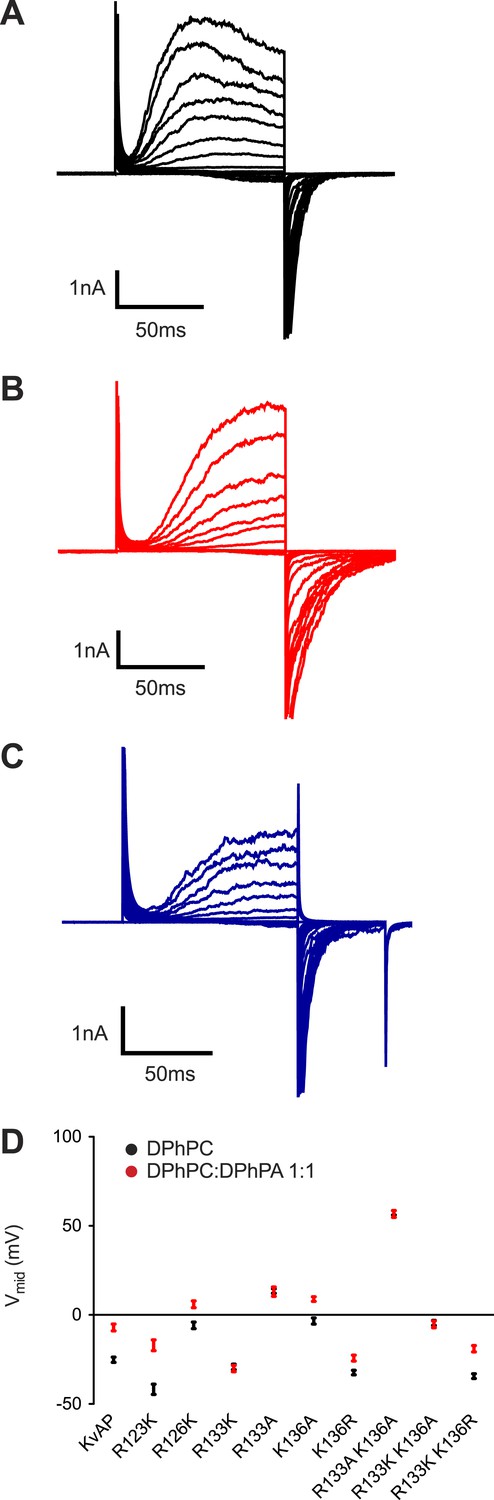
Representative families of currents recorded from KvAP channels.
Representative families of currents recorded from Kv channels in (A) DPhPC bilayers, (B) DPhPC:DPhPA (1:1) bilayers, (C) DPhPC:POPA (3:1) bilayers. Voltage is stepped from a holding voltage of −100 mV to increasingly more positive voltages (−100 mV to +80 mV; ΔV = 10 mV) returned to the holding voltage of −100 mV for A and B and −80 for C. (D) Vmid determined from fits to the Boltzmann equation for KvAP and KvAP mutant channels (KvAP: DPhPC Vmid = −25 ± 1 mV, Z = 2.6, N = 8; DPhPC:DPhPA (1:1) Vmid = −6 ± 1 mV, Z = 2.2, N = 5; R123K: DPhPC Vmid = −42 ± 3 mV, Z = 2.6, N = 6; DPhPC:DPhPA (1:1) Vmid = −17 ± 3 mV, Z = 2.1, N = 5; R126K: DPhPC Vmid = −6 ± 2 mV, Z = 3.1, N = 5; DPhPC:DPhPA (1:1) Vmid = 6 mV, Z = 2.5, N = 6; R133K: DPhPC Vmid = −29 ± 2 mV, Z = 3.1, N = 6; DPhPC:DPhPA (1:1) Vmid = −30 ± 2 mV, Z = 3.6, N = 7; R133A: DPhPC Vmid = 13 ± 1 mV, Z = 2.8, N = 5; DPhPC:DPhPA (1:1) Vmid = 13 ± 3 mV, Z = 1.9, N = 6; K136A: DPhPC Vmid = −3 ± 2 mV, Z = 3.4, N = 5; DPhPC:DPhPA (1:1) Vmid = 9 ± 1 mV, Z = 2.6, N = 6; K136R: DPhPC Vmid = −32 ± 1 mV, Z = 2.8, N = 5; DPhPC:DPhPA (1:1) Vmid = −24 ± 2 mV, Z = 2.3, N = 6; R133A K136A: DPhPC Vmid = 57 ± 1 mV, Z = 3.6, N = 6; DPhPC:DPhPA (1:1) Vmid = 57 ± 2 mV, Z = 2.9, N = 6; R133K K136A: DPhPC Vmid = −5 ± 1 mV, Z = 3.7, N = 5; DPhPC:DPhPA (1:1) Vmid = −5 ± 2 mV, Z = 2.7, N = 6; R133K K136R: DPhPC Vmid = −34 ± 1 mV, Z = 2.8, N = 8; DPhPC:DPhPA (1:1) Vmid = −19 ± 2 mV, Z = 2.3, N = 5).
Figure 8
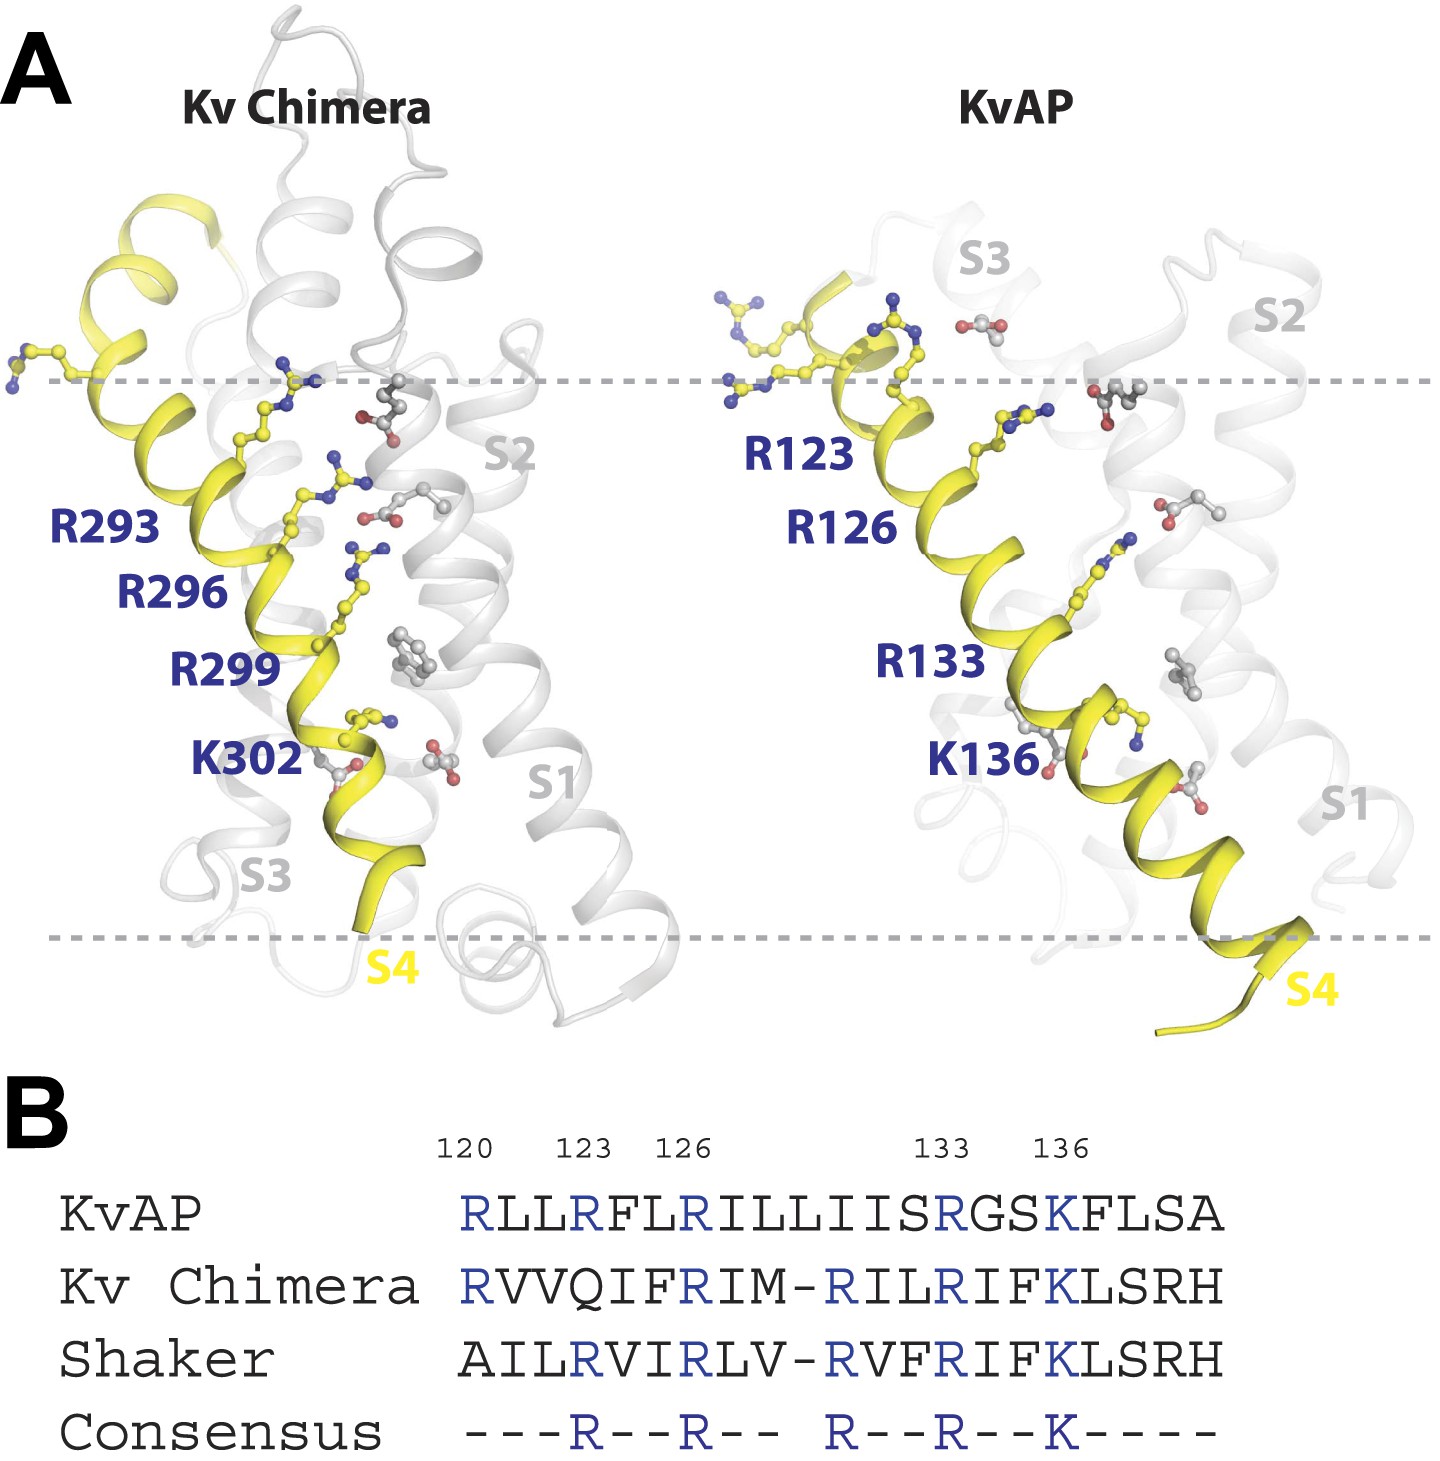
Structure and sequence alignment of Kv voltage sensor domains.
(A) View from the membrane plane of the voltage sensor domains of rat Kv1.2–2.1 paddle chimera and KvAP. The S4 transmembrane helices and their positively charged residues are highlighted in yellow. The dashed grey line marks the approximate positions of the phospholipid head groups. (B) Sequence alignment of the S4 transmembrane helices from rat Kv1.2–2.1 paddle chimera, KvAP and D. melanogaster Shaker K+ channel. Numbering is according to KvAP sequence.
Download links
A two-part list of links to download the article, or parts of the article, in various formats.
Downloads (link to download the article as PDF)
Open citations (links to open the citations from this article in various online reference manager services)
Cite this article (links to download the citations from this article in formats compatible with various reference manager tools)
Phosphatidic acid modulation of Kv channel voltage sensor function
eLife 3:e04366.
https://doi.org/10.7554/eLife.04366


