Homeostasis in C. elegans sleep is characterized by two behaviorally and genetically distinct mechanisms
- University of Chicago, United States
- Harvard University, United States
Figures
Figure 1 with 3 supplements
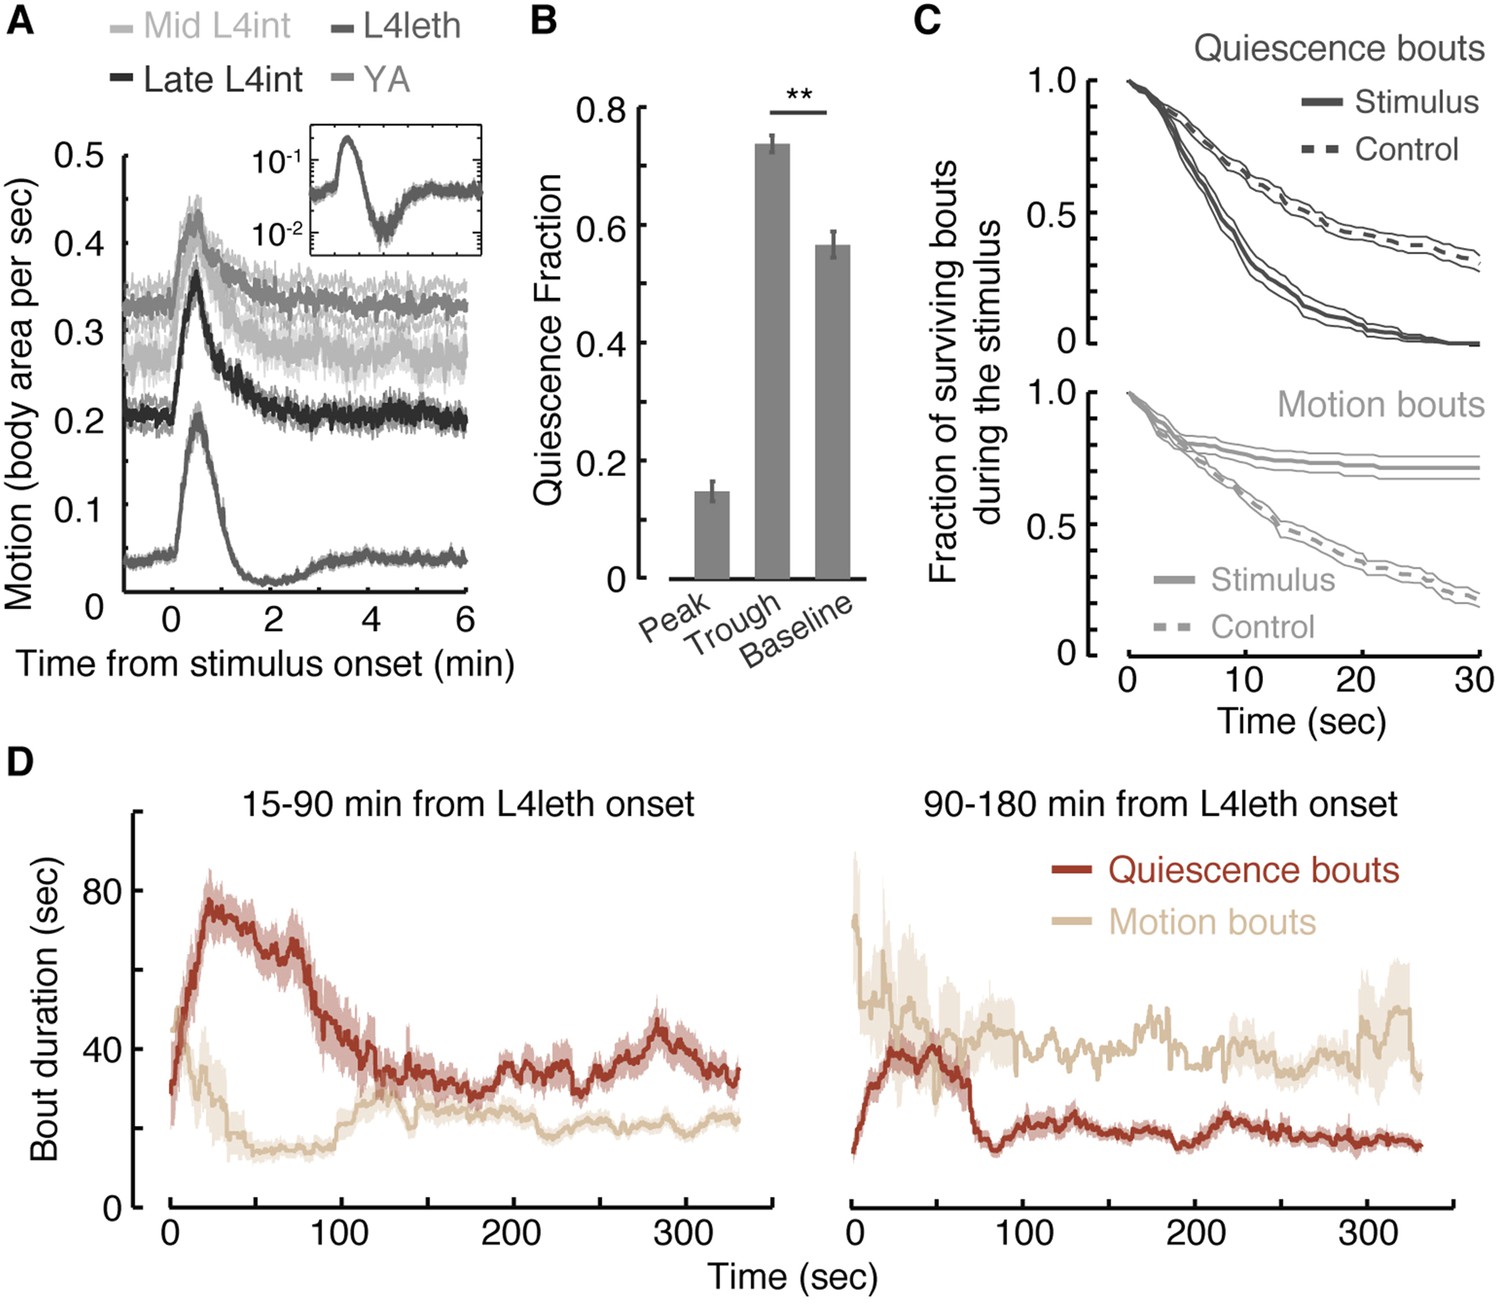
Motion plays a causal role in determining the duration of subsequent quiescence during lethargus.
(A) Wild-type animals at the mid L4int, late L4int, L4leth, and YA stages were exposed to 30 s light stimuli at an intensity of 20 mW/cm2. All stimuli were initiated at t = 0. Outside lethargus, locomotion monotonically decayed to baseline levels in 2 min. During lethargus, the peak in locomotion was followed by a trough prior to returning to baseline. Insets: the responses during lethargus shown on a semi-log scale. (B) The fractions of quiescence were calculated for 1 min intervals centered at the times of the peak and trough of the L4leth responses, as well as for their respective pre-stimulus baselines. Plots and bars depict mean ± s.e.m obtained from datasets of N = 40–50 animals per condition. Asterisks indicate p < 0.001. (C) Survival curves of quiescence and motion bouts of wild-type animals exposed to a 30 s, 20 mW/cm2, blue light stimulus during the first hour of L4leth. Bouts were identified using the frame subtraction method and control data were obtained from the same animals, but 8 min after the stimulus (non-stimulated control animals were also assayed, analyzed the same way, and found to be indistinguishable from this control group). Mean ± s.e.m, N > 200 bouts for each condition. (D) The dynamics of bouts obtained from a posture-based analysis following a 15 s, 20 mW/cm2, blue light stimulus. Left and right panels correspond to the first and second halves of L4leth, respectively. See also Figure 1—figure supplements 1–3. Plots depict mean ± s.e.m, smoothed using a 30 s running window average. N = 40 animals.
Figure 1—figure supplement 1
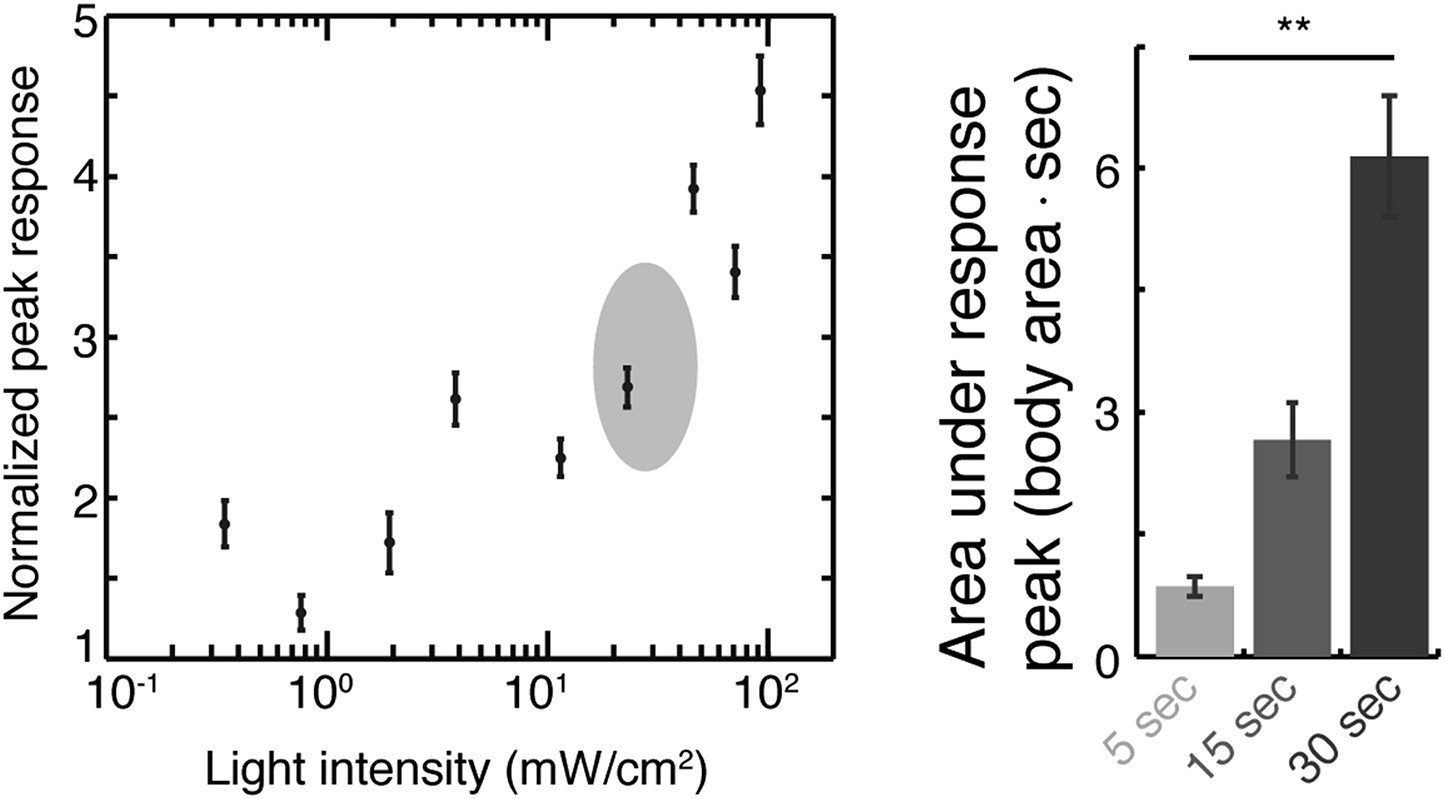
Calibration of weak blue light stimuli.
Responses to blue light stimuli were defined as the peak value of overall motion, as measured using the frame subtraction method, normalized by the baseline average motion during a 1-min period prior to the stimulus. Left: L4int larvae were exposed to 15 s pulses of blue light at different intensities. Locomotion responses increased as a function of the light intensity in the 2–100 mW/cm2 range. The plot depicts mean ± s.e.m responses, N = 20–30 animals. Shaded area emphasizes the range of stimuli used throughout the rest of the manuscript. Right: the total amount of motion induced by the stimulus was defined as the area under the response peak. Three durations of a 20 mW/cm2 light stimulus were assayed (N > 200 trials per condition, error bars depict s.e.m, p < 0.001).
Figure 1—figure supplement 2
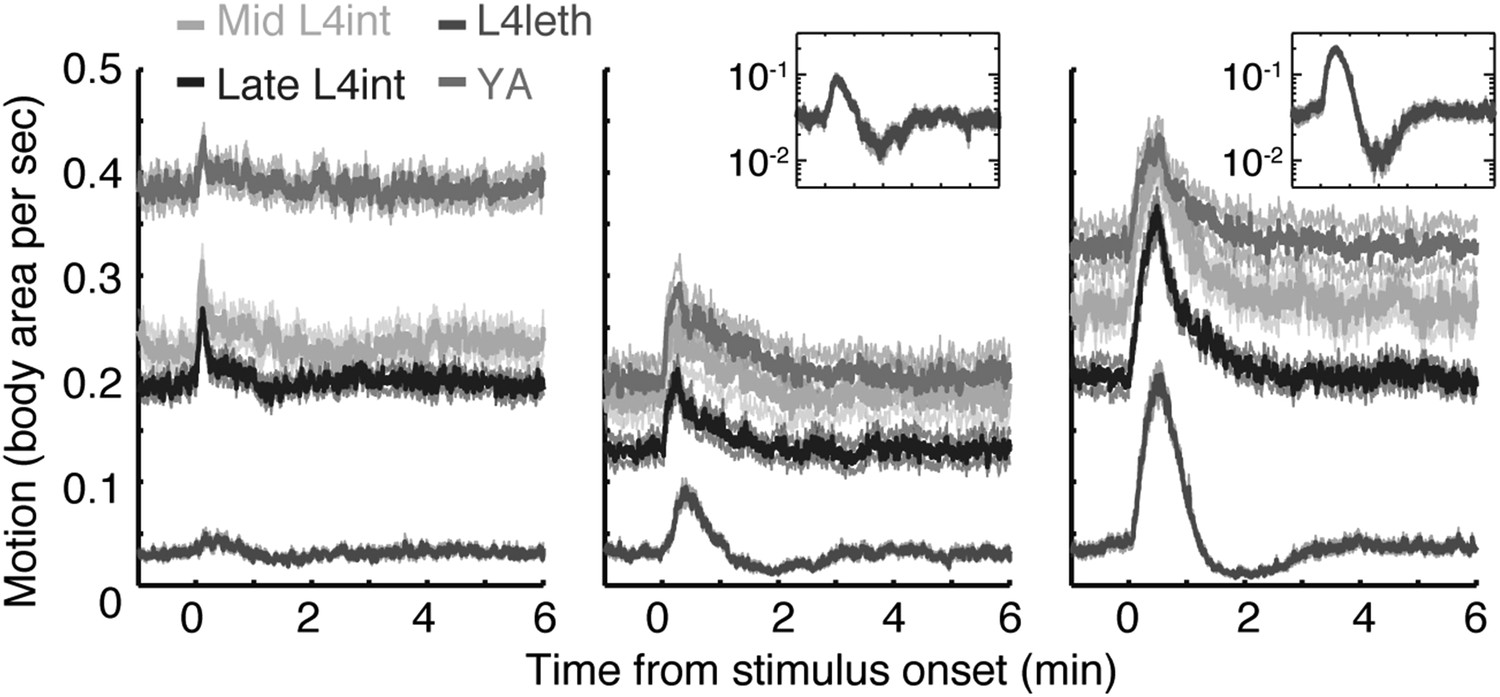
Responses to weak light stimuli.
Wild-type animals at the mid L4int, late L4int, L4leth, and YA stages were exposed to 5 (left), 15 (middle), and 30 s (right) light stimuli at an intensity of 20 mW/cm2. All stimuli were initiated at t = 0. A sharp peak in locomotion in response to a 5 s stimulus was observed outside lethargus, but not during lethargus. Both 15 s and 30 s stimuli evoked a transient increase in locomotion. Outside lethargus, locomotion monotonically decayed to baseline levels in 2 min. In contrast, during lethargus the peak in locomotion was followed by a trough prior to returning to baseline. Insets: the responses during lethargus shown on a semi-log scale.
Figure 1—figure supplement 3
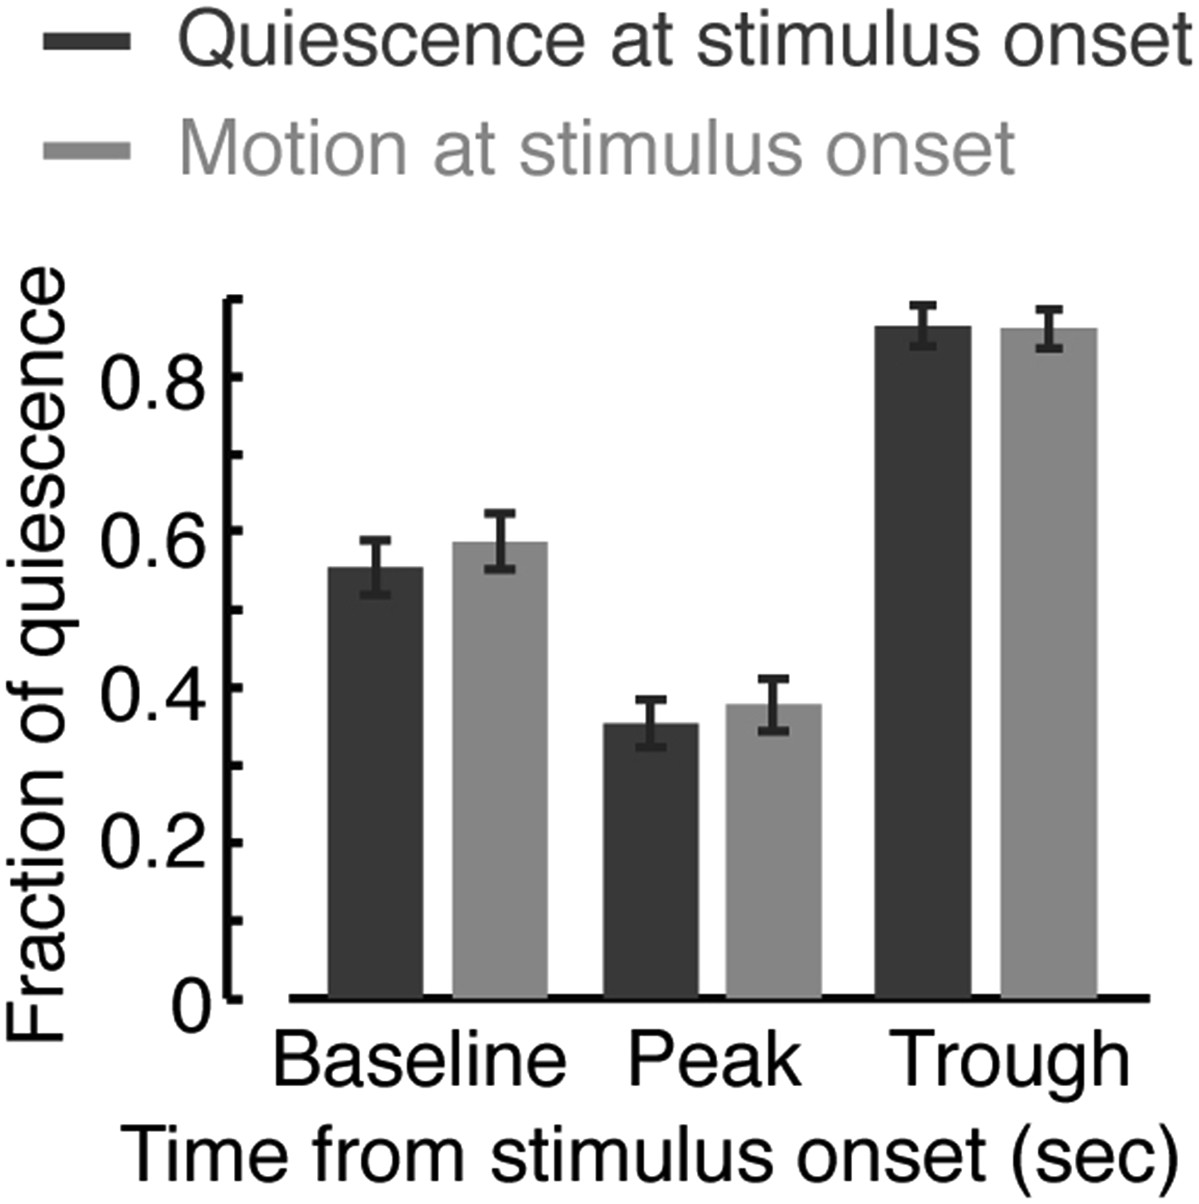
Responses during quiescence and motion.
The fraction of quiescence during 1 min intervals centered at a time point prior to the onset of the stimulus (baseline), at the peak of the locomotion response, and at the trough of the response. Dark or light bars correspond to data obtained from instances when the animals were quiescent or motile, respectively, at the time of the stimulus onset. Responses assayed using the frame subtraction method appeared indistinguishable based on the type of bout at the time of stimulus onset. Error bars depict s.e.m. Plots and bars in all panels depict mean ± s.e.m obtained from datasets of N = 40–50 animals per condition. Asterisks indicate p < 0.001.
Figure 2
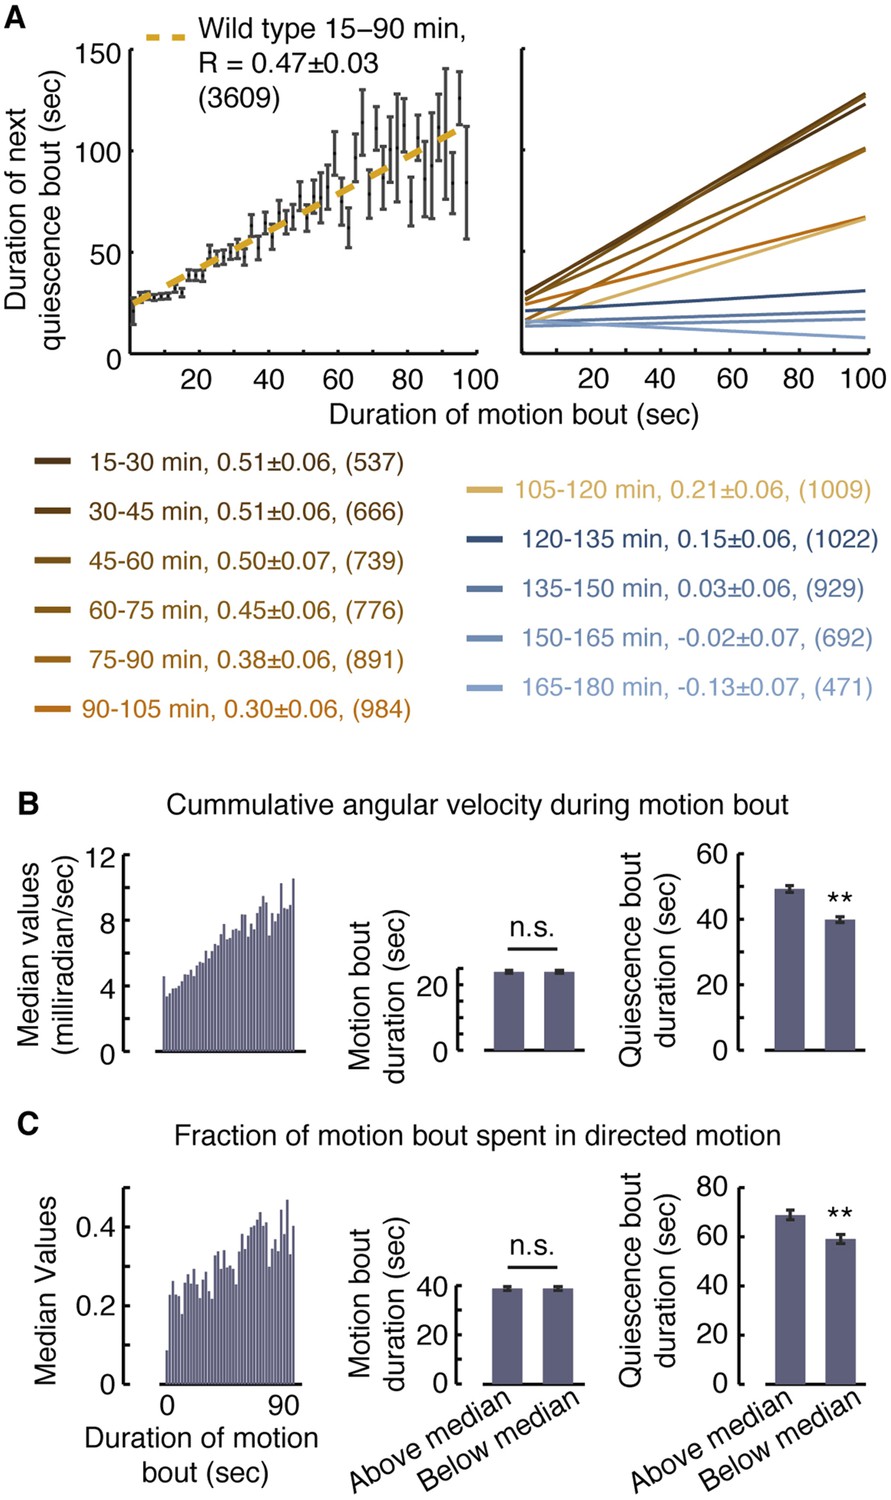
Vigorous or directed motion extends the duration of subsequent quiescence during lethargus.
(A) Posture-based analysis improved the measurement of pairwise correlations between the durations of motion bouts and those of subsequent quiescence bouts in undisturbed wild-type animals (R = 0.47 ± 0.03, N = 3609 bouts from 40 animals, p < 0.05). As a guide to the eye, motion bouts were grouped according to their durations in 2 s wide bins. The mean ± s.e.m duration of the subsequent quiescence bouts for each bin was plotted and these mean values were fitted to a line. In addition, pairwise correlation coefficients were calculated for each 15 min interval of L4leth separately. As a guide to the eye, linear fits to the binned data are depicted. In all cases, the errors were defined as the 95% confidence intervals and the number of bouts is given in parentheses. (B–C) The overall levels of motion (B) and the fraction of directed motion (C) during a motion bout have a significant effect on subsequent quiescence. Overall motion was defined as the mean time derivative of the absolute values of 18 angles along the body and directed motion was defined as either forward or backward locomotion, as opposed to dwelling (Nagy et al., 2014). Left: the median values of the overall vigor of motion (B) and the fraction of directed motion (C) as a function of the duration of the motion bouts (binned in 2 s bins). Middle (right): the durations of motion (quiescence) bouts calculated separately for the group of bouts that was above or below the median of its respective bin. The durations of quiescence bouts differed significantly between the two groups. N = 40 animals, error bars depict s.e.m, p < 0.01.
Figure 3 with 1 supplement

A posture-based analysis of locomotion responses to weak light stimuli.
(A) A diagram describing the repeated stimulus assay, in which a generic brief stimulus (vertical lines) was repeatedly delivered at 15 min intervals (long horizontal arrows). Each assay started at the mid L4int stage, continuously progressed through L4leth (shaded area), and ended at the mid YA stage. For the purpose of illustration, the blue and red lines symbolize tentative probabilities of forward locomotion and quiescence, respectively. Baseline behavior was measured during the 5-min period starting 10 min after a stimulus, or equivalently, 5 min prior to the subsequent stimulus. The beginning of the first baseline period is depicted by a dashed vertical line. (B) The fraction of forward locomotion, backward locomotion, dwelling, and quiescence before, during, and after a weak (15 s, 20 mW/cm2 blue light) stimulus provided at the L4int (left), L4leth (middle), and YA (right) stages. A compensatory post-stimulus enhancement of quiescence, as well as enhanced reversals during the stimulus, and a rising propensity for forward locomotion after the stimulus was turned off were uniquely observed during lethargus. Insets: the fraction of forward locomotion before and after the offset of the stimulus (top) and the fraction of backward locomotion before and after the onset of the stimulus. Shading denotes the presence of the light stimulus. All fractions were calculated from the 7.5-s period (half of the duration of the stimulus), the scale bars represent a fraction of 0.5, and asterisks denote p < 0.05. (C) The data from the middle panel of (B) plotted separately for the first, second, and third hours of L4leth. Enhanced quiescence was observed in all three cases, although it was less prominent during the third hour. Plots in panels (B, C) depict mean ± s.e.m and the number of stimuli assayed is noted in parentheses for each condition.
Figure 3—figure supplement 1
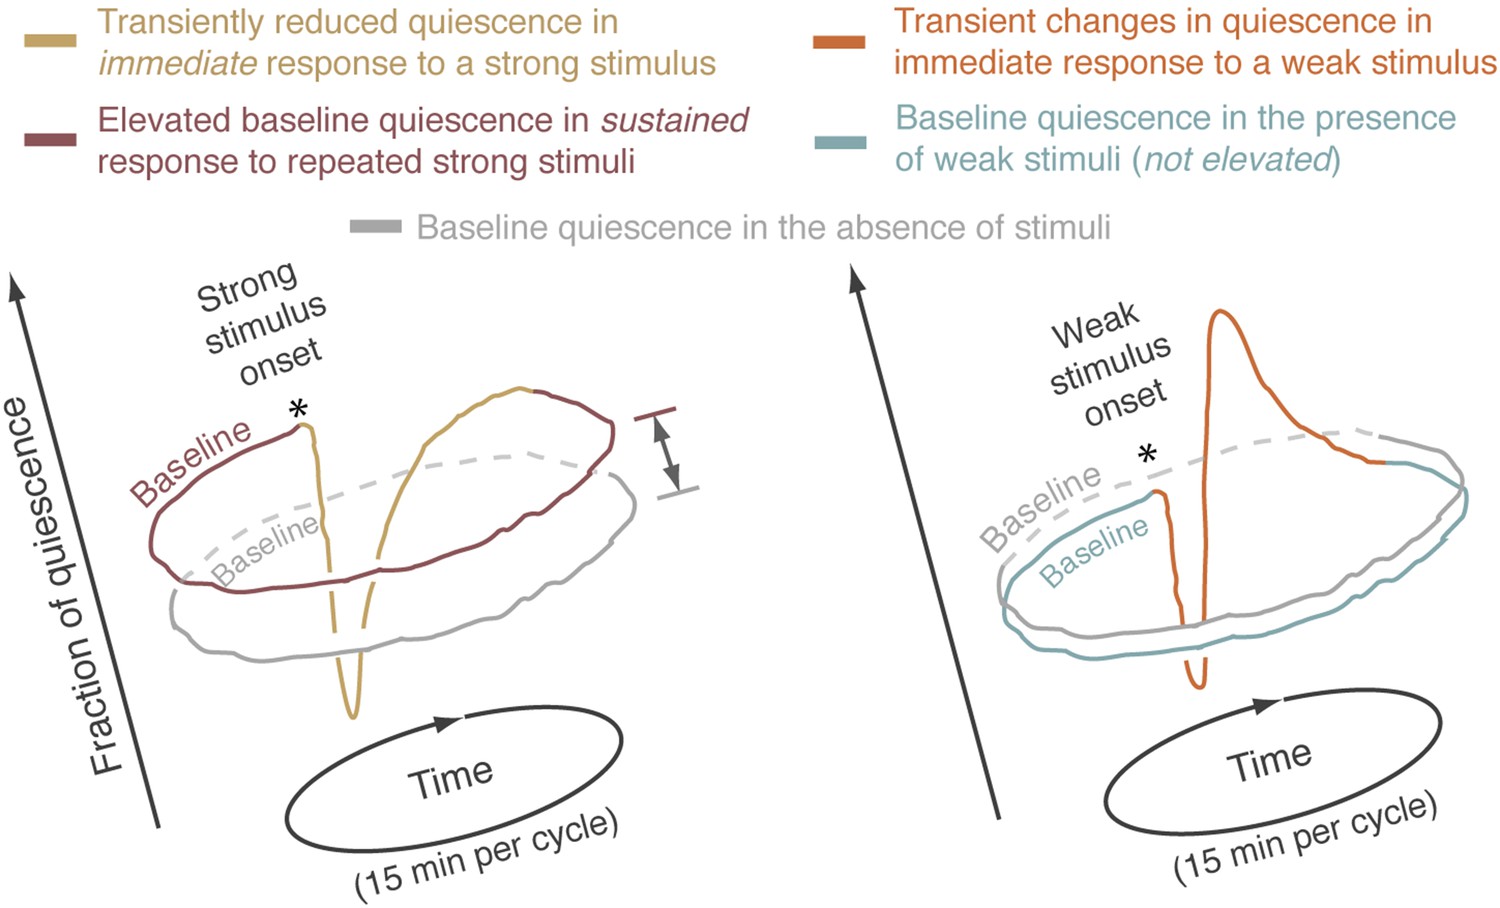
The averaged behavior data have periodic boundaries.
Each sketched closed curve represents the average fraction of quiescence as a function of time for a particular set of experimental conditions. Since repeated 15-min cycles were aligned and averaged, the mean behavioral dynamics have periodic boundaries. Graphically, this can be represented by plotting the data on a circular time axis, where the onset of the stimulus is denoted by an asterisk. During lethargus, the immediate response to a stimulus lasted no more than 3 min. After this short-term response was complete, the fraction of quiescence returned to a steady state that was characteristic of the conditions of the experiment. The fraction of time spent is quiescence during this steady state was defined as the baseline level of quiescence for the relevant experimental conditions. In this framework, baselines were compared between different conditions. Left: responses to strong stimuli. The immediate response to a strong stimulus is depicted by the yellow curve and the baselines for periodically stimulated and undisturbed animals are depicted by brown and grey curves, respectively. Elevation of the steady state quiescence—as compared to the mean quiescence of undisturbed animals—constituted the sustained response to the presence of repeated strong stimuli. This elevation is emphasized by a double-headed arrow. Right: responses to weak stimuli. The immediate response to a weak stimulus is depicted by the orange curve and the baselines for periodically stimulated and undisturbed animals are depicted by blue and grey curves, respectively.
Figure 4

A posture-based analysis of locomotion responses to weak and strong mechanical stimuli.
(A) A weak mechanical stimulus (0.4 s of 1 kHz vibrations) produced a reversal followed by a small elevation of forward locomotion in L4int larvae (left) and a brief reversal followed by enhanced quiescence during L4leth (right). Inset: the first quiescence bout after the stimulus was longer than subsequent bouts (p < 0.05). (B) A strong mechanical stimulus (15 s of 1 kHz vibrations) produced reversals followed by a prolonged (10 min) elevation of forward locomotion in L4int larvae (left) and a brief reversal followed by elevated levels of directed motion for 4–5 min during L4leth (right). Notably, quiescence returned to its baseline value without transiently exceeding it. (C) Mean baseline fraction of quiescence was measured during the baseline period (see Figure 3A). The baseline fraction of quiescence was significantly higher in strongly stimulated animals as compared to unstimulated and weakly stimulated animals. Weak light I and II labels refer to stimulus strengths of 20 and 40 mW/cm2 blue light, respectively. Plots in panels (A, B) depict mean ± s.e.m and the error bars in panel (C) depict ±s.e.m and asterisks denote p < 0.05. The number of stimuli assayed is noted in parentheses for each condition.
Figure 5

NPR-1 is required for micro-homeostasis but not for homeostatic responses to strong stimuli.
(A) Undisturbed behavior of npr-1 mutants. Left: the fraction of quiescence of wild-type animals and npr-1(ad609) mutants during L4leth (shaded area). The fraction of quiescence of npr-1 mutants was recently published (Nagy et al., 2014) and plotted here for comparison. Plots depict mean ± s.e.m, the numbers of animals assayed are denoted in parentheses. Middle and right: pairwise bout correlations and plots of binned bouts (see Figure 2A for details). Pairwise correlations were significantly reduced in npr-1 mutants (p < 0.05). All correlations are given with 95% confidence intervals and error bars depict ±s.e.m. The number of bouts in each case is denoted in parentheses. (B) L4int, late L4int, L4leth, and YA npr-1 mutants were exposed to weak (15 s, 20 mW/cm2 light) stimuli. All stimuli were initiated at t = 0. In npr-1 mutants assayed using frame subtraction, a trough did not follow the transient increase in locomotion before returning to baseline. Insets: the responses during lethargus shown on a semi-log scale. For each strain, the quiescence fraction was calculated during 1 min intervals centered at the times of the peak and trough of the L4leth responses, as well as for their respective pre-stimulus baselines. Quiescence was not enhanced following the peak in locomotion in npr-1 mutants. Plots and bars depict mean ± s.e.m obtained from datasets of N = 50–60 animals per condition. Asterisks and double asterisks denote p < 0.05 and p < 0.01, respectively. (C) A posture-based analysis of behavior of L4leth npr-1 mutants: the fraction of forward locomotion, backward locomotion, dwelling, and quiescence before, during, and after a weak (15 s, 20 mW/cm2, blue light) stimulus. The data were aligned by the time of the onset of the stimulus and then averaged. Plots depict mean ± s.e.m. In agreement with the frame subtraction measurements, the compensatory enhancement of quiescence fraction shortly after the stimulus was nearly abolished in npr-1 mutants. N = 14 and 13 animals (ky13 and ad609). (D) A posture-based analysis of bout dynamics of npr-1 mutants following a weak stimulus. N = 14 and 13 animals, plots depict mean ± s.e.m, smoothed using a 30 s running window. (E) The mean baseline fractions of quiescence during the 5 min intervals prior to each stimulus tested. Similar to wild-type, baseline quiescence fraction was significantly higher in strongly stimulated animals as compared to non-stimulated and weakly stimulated npr-1 mutants. See also Figure 1—figure supplements 1–3. Error bars depict ±s.e.m and asterisks denote p < 0.05. The number of stimuli assayed is noted in parentheses for each condition.
Figure 6 with 2 supplements
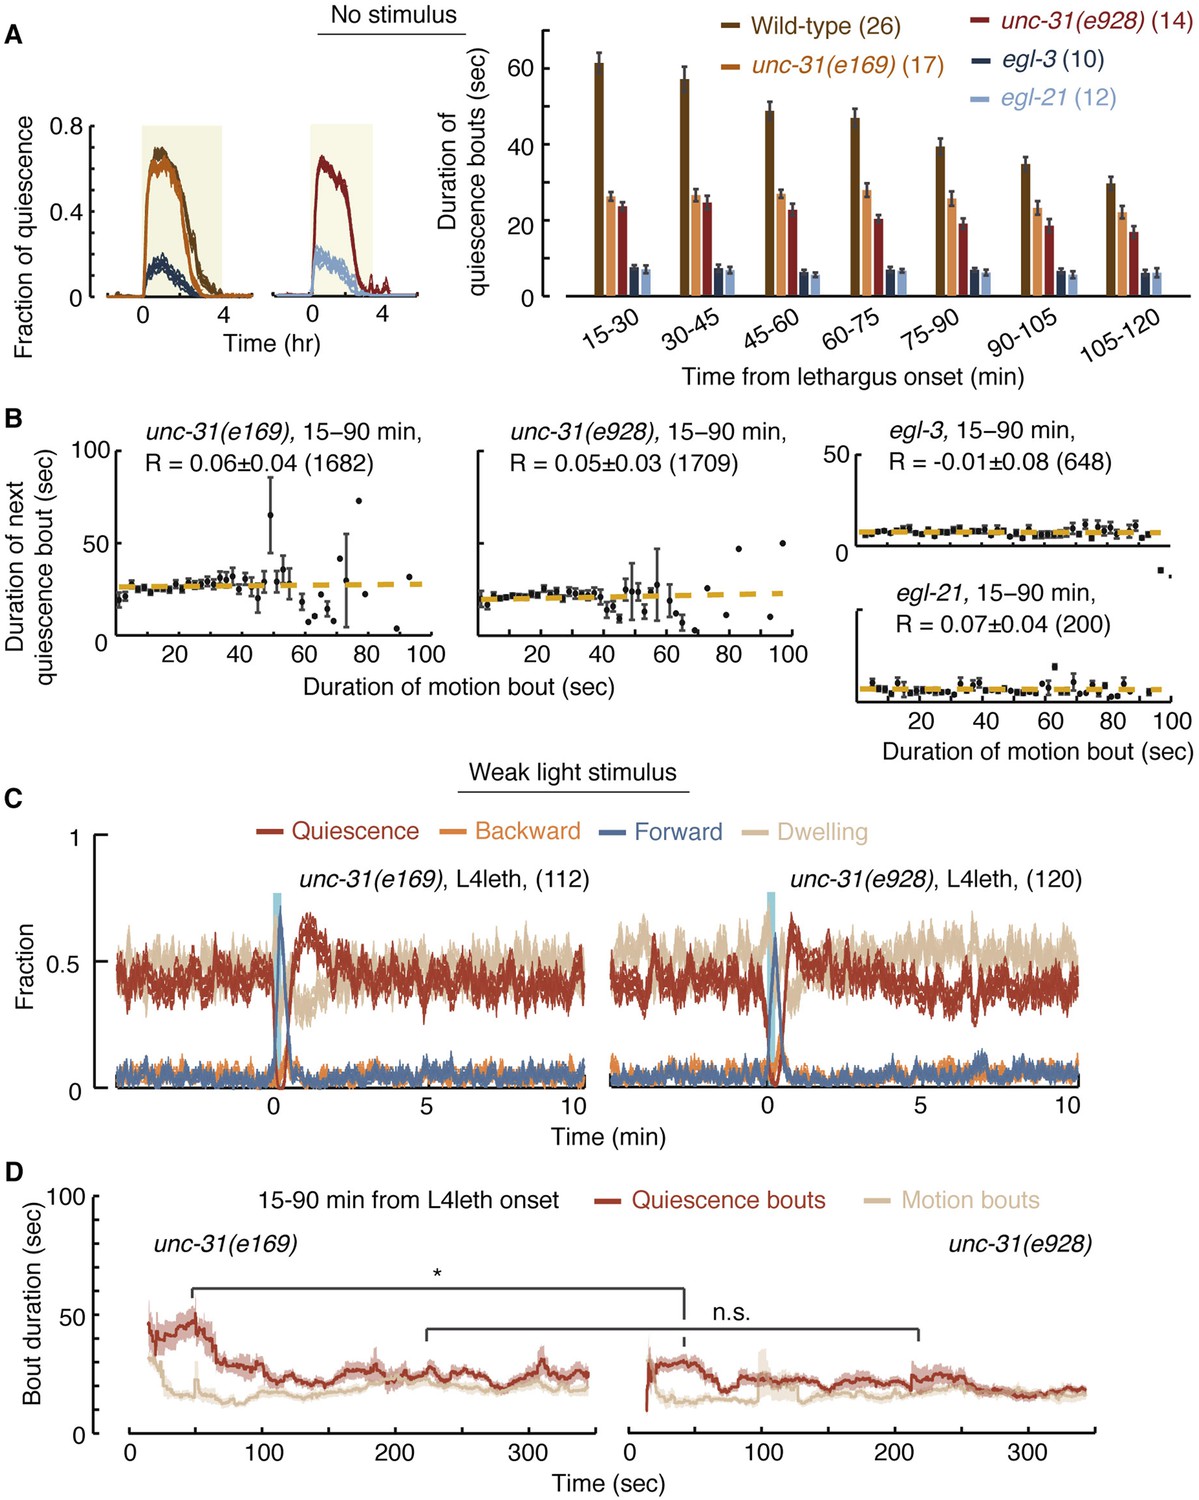
UNC-31/CAPS is not required for establishing a high fraction of quiescence during lethargus but is required for micro-homeostasis.
(A) Left: the fraction of quiescence of wild-type animals and unc-31, egl-3, and egl-21 mutants during L4leth (shaded area). Quiescence was strongly reduced by the loss of function of EGL-3 or EGL-21, but not UNC-31. Right: the mean durations of bouts of quiescence of the same wild-type and mutant animals during the 15-min period of L4leth. Plots and bars depict mean ± s.e.m, the numbers of animals assayed are denoted in parentheses. (B) Pairwise bout correlations and plots of binned bouts in undisturbed animals (see Figure 2A for details). Pairwise correlations were abolished in unc-31, egl-3, and egl-21 mutants. All correlations are given with 95% confidence intervals (p < 0.05) and error bars depict ±s.e.m. The number of bouts in each case is denoted in parentheses. (C) A posture-based analysis of behavior of L4leth unc-31 mutants: the fraction of forward locomotion, backward locomotion, dwelling, and quiescence before, during, and after a weak (15 s, 20 mW/cm2, blue light) stimulus. See also Figure 6—figure supplements 1,2. (D) A posture-based analysis of bout dynamics of unc-31 mutants following a weak stimulus. The duration of the motion induced by the weak stimulus was shorter than that of wild-type animals, and the compensatory enhancement of quiescence was weaker. N = 11 and 12 animals (e169 and e928), plots depict mean ± s.e.m, smoothed using a 30 s running window.
Figure 6—figure supplement 1
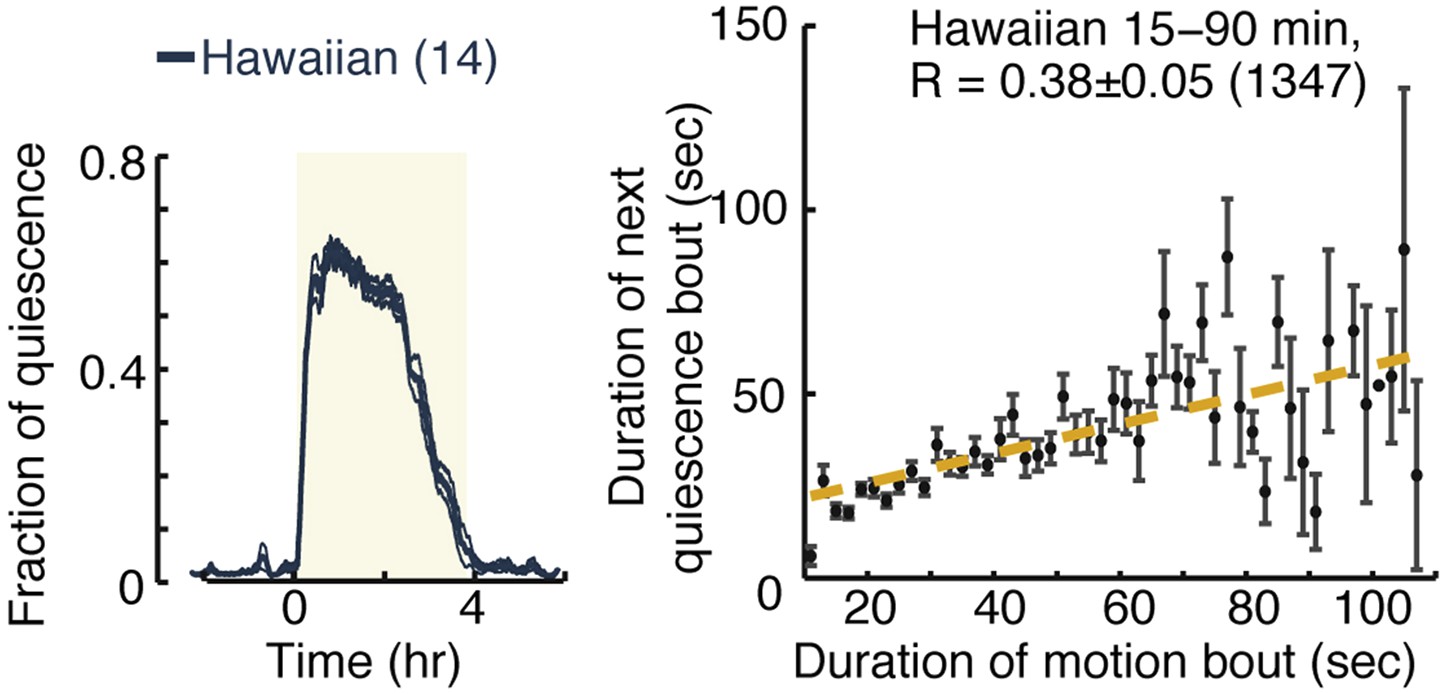
Micro-homeostasis in undisturbed Hawaiian wild-isolates.
Hawaiian animals display overall quiescence similar to those of unc-31 mutants. However, while pairwise correlations between consecutive bouts are abolished in unc-31 mutants, this is not the case in Hawaiian animals (see Figure 7A–B for details).
Figure 6—figure supplement 2
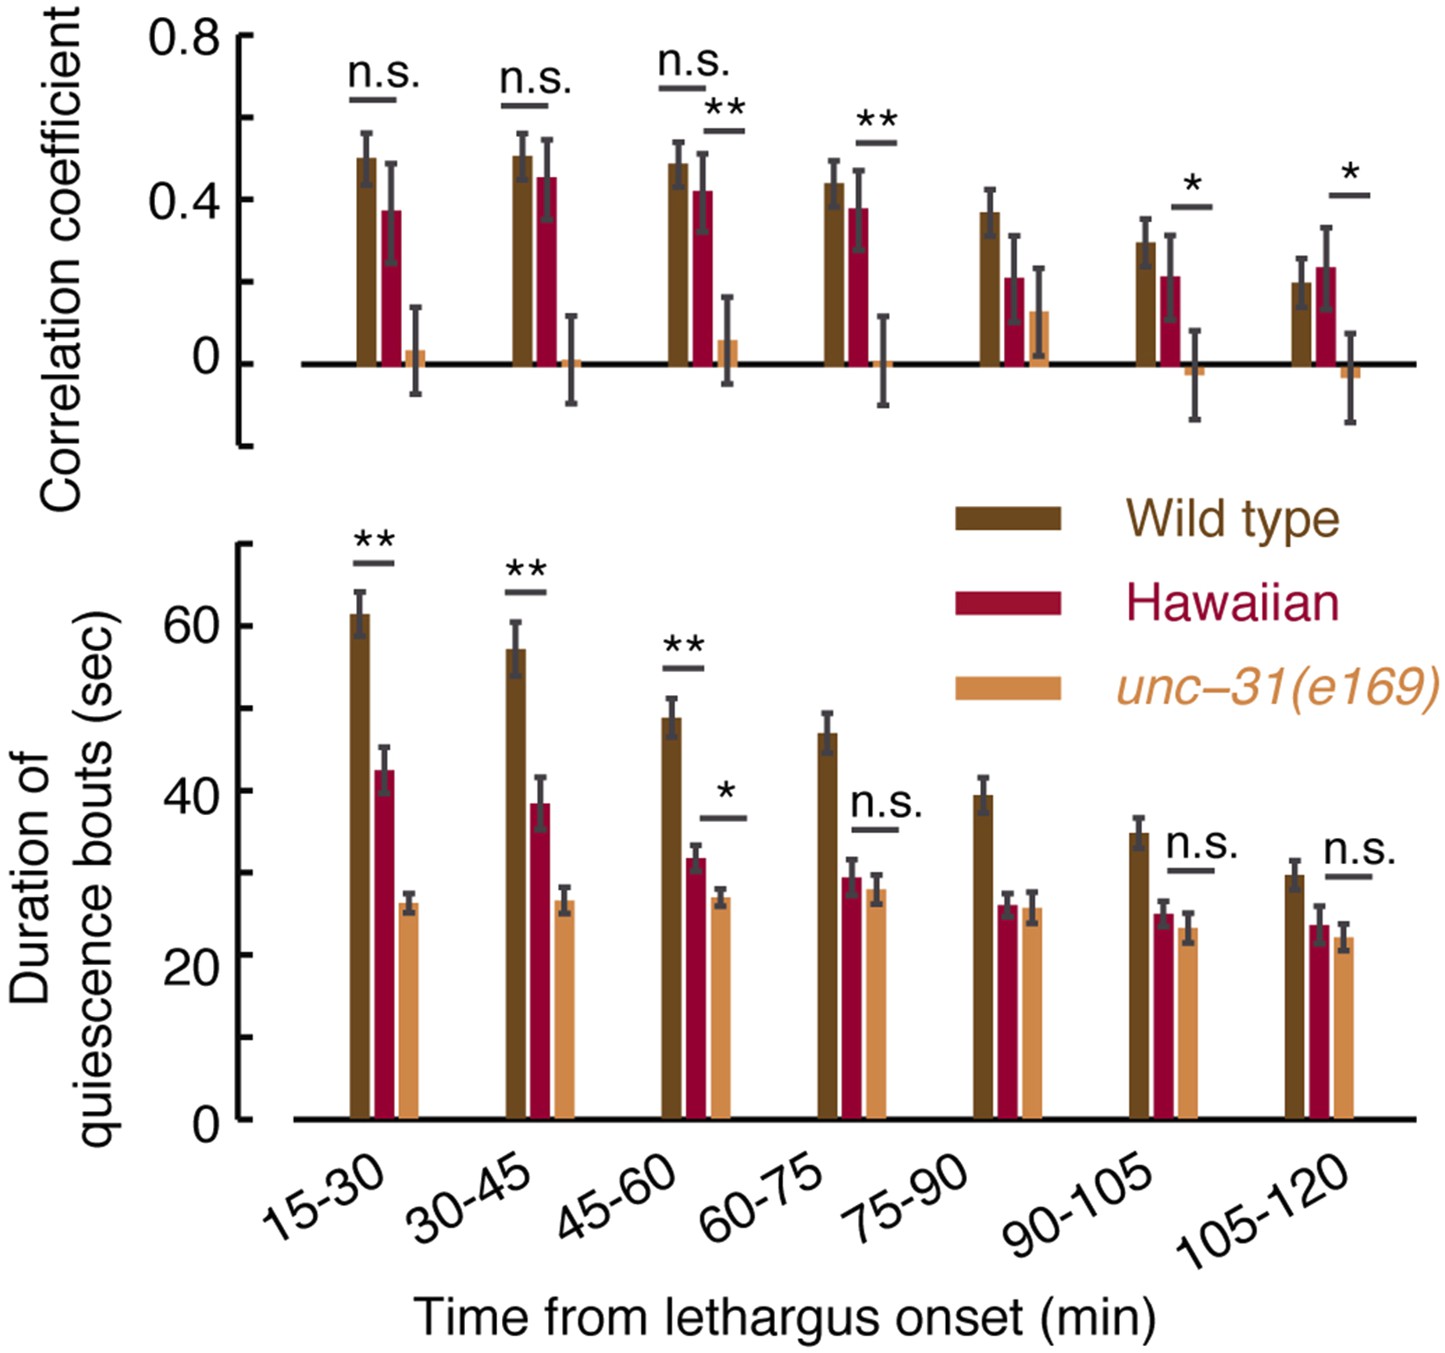
Micro-homeostasis in undisturbed Hawaiian wild-isolates.
The durations of bouts of quiescence, as well as pairwise correlations, were measured for Hawaiian animals and unc-31 mutants as a function of time during L4 lethargus. The detailed comparison reveals that the duration of bouts cannot in and of themselves account for the strength of the pairwise correlations (see Figure 7A for details).
Figure 7 with 2 supplements

FLP-18 plays a role in modulating bout durations in the presence of weak disturbances.
(A) Posture analysis of undisturbed flp-18(gk3063) mutants revealed wild-type-like overall quiescence but reduced correlations between subsequent bouts. R = 0.33 ± 0.06, N = 12 animals. These correlations were significantly different (p < 0.05) from those of wild-type and npr-1 mutants shown in Figures 2A and 5A, respectively. (B) Frame subtraction analysis of flp-18 mutants during L4leth in the presence of weak blue light stimuli (15 s, 20 mW/cm2). All stimuli were initiated at t = 0. The dynamics of locomotion revealed defects in the ability of flp-18 mutants to compensate for the motion induced by the stimulus with enhanced quiescence. Left: the locomotion responses during lethargus of each of the two alleles tested and its wild-type control group shown on a semi-log scale. Shaded area denotes mean ± s.e.m. Asterisks denote that during the trough in locomotion, the fraction of quiescence of the mutant allele was significantly lower than that of its respective wild-type control (p < 0.01). Right: for each strain, the quiescence fraction was calculated during 1 min intervals centered at the times of the peak and trough of the L4leth responses, as well as for their respective pre-stimulus baselines. Plots and bars depict mean ± s.e.m obtained from datasets of N = 40–50 animals per condition. Asterisks and double asterisks denote p < 0.05 and p < 0.01, respectively.
Figure 7—figure supplement 1
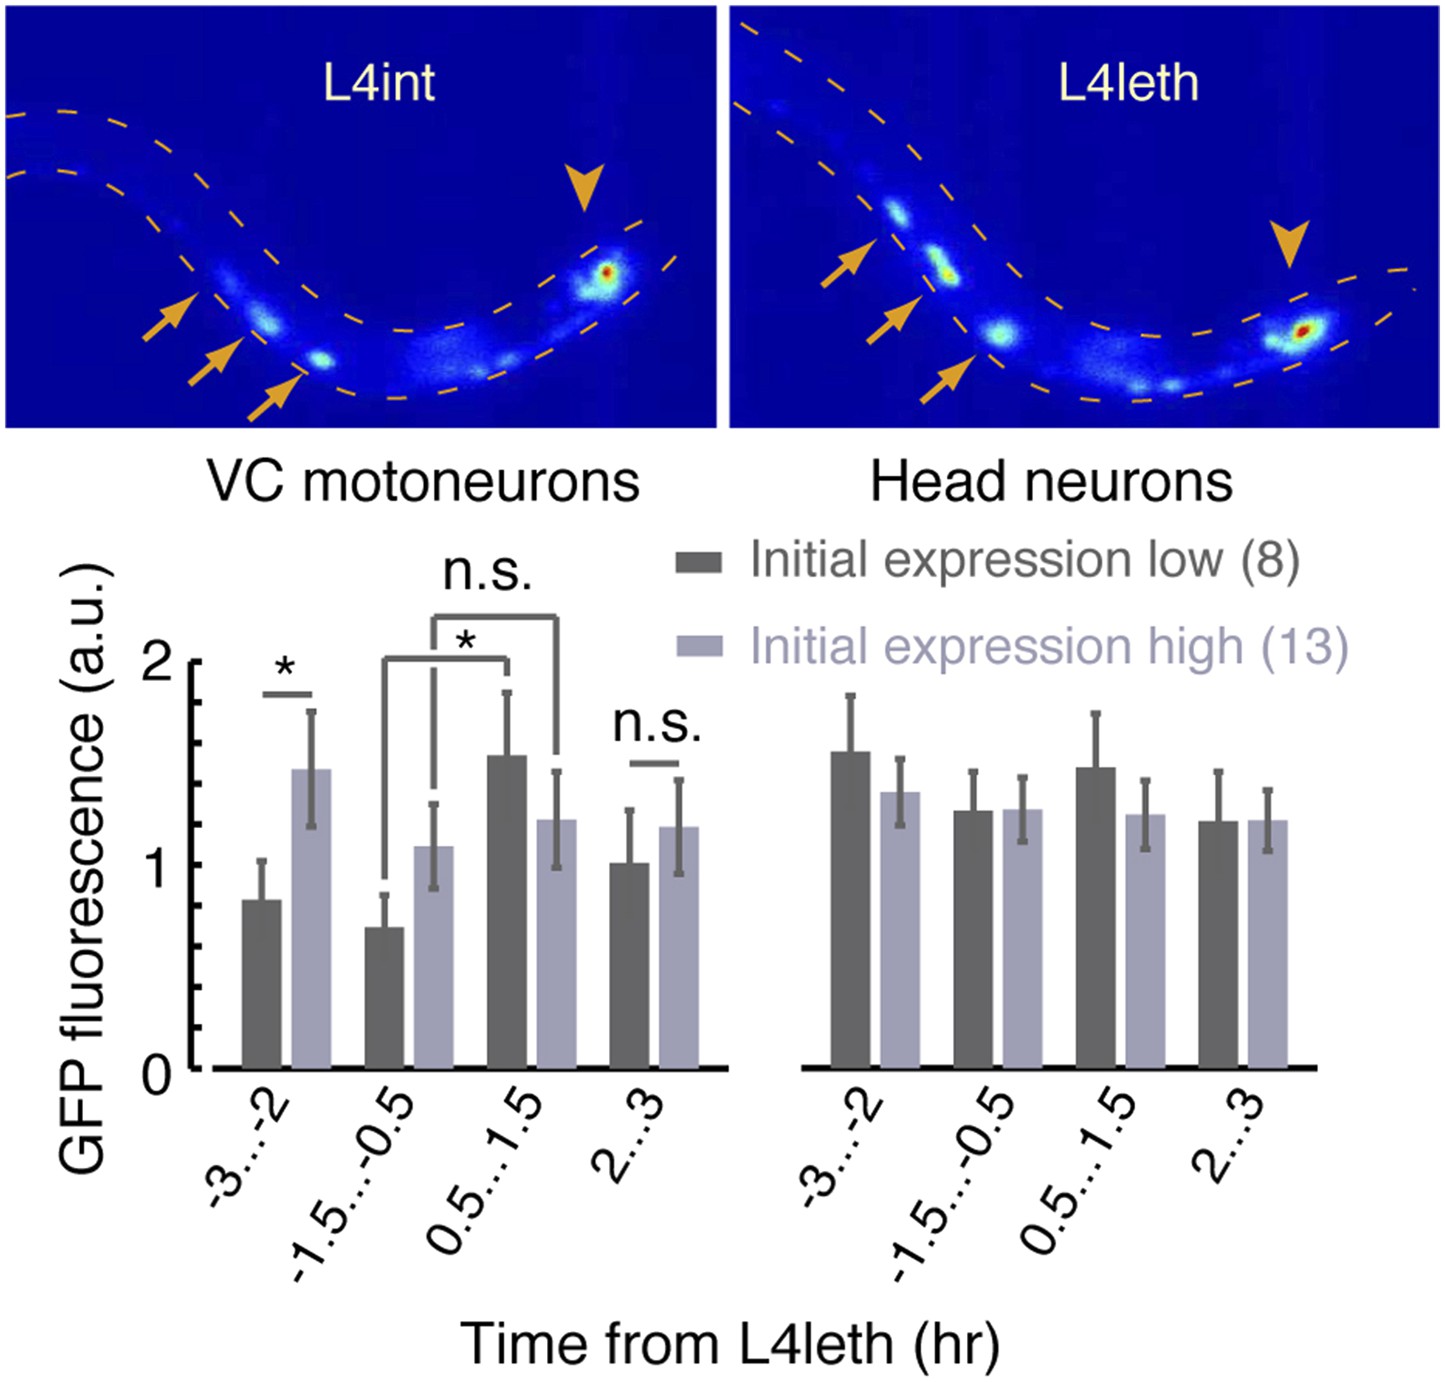
A fluorescent reporter of FLP-18 in VC motor neurons and head neurons.
Top: sample images of the same animal during the late L4int stage (left) and the first half of L4leth (right). Arrows point to VC motoneurons in which expression of the Pflp-18::flp-18::SL2::gfp reporter was visibly upregulated. Arrowheads point to head neurons in which changes in expression were not detected. Bottom: the mean fluorescence, before and during lethargus, from reporter expressed in VC motoneurons (left) and head neurons (right). When VC neurons fluorescence prior to lethargus was low (dark grey), it increased more than twofold during the first half of lethargus (p < 0.05). When VC neurons fluorescence prior to lethargus was high (light grey), it did not change significantly afterward. The number of animals assayed is denoted in parentheses, error bars depict ±s.e.m, and asterisks denote p < 0.05.
Figure 7—figure supplement 2
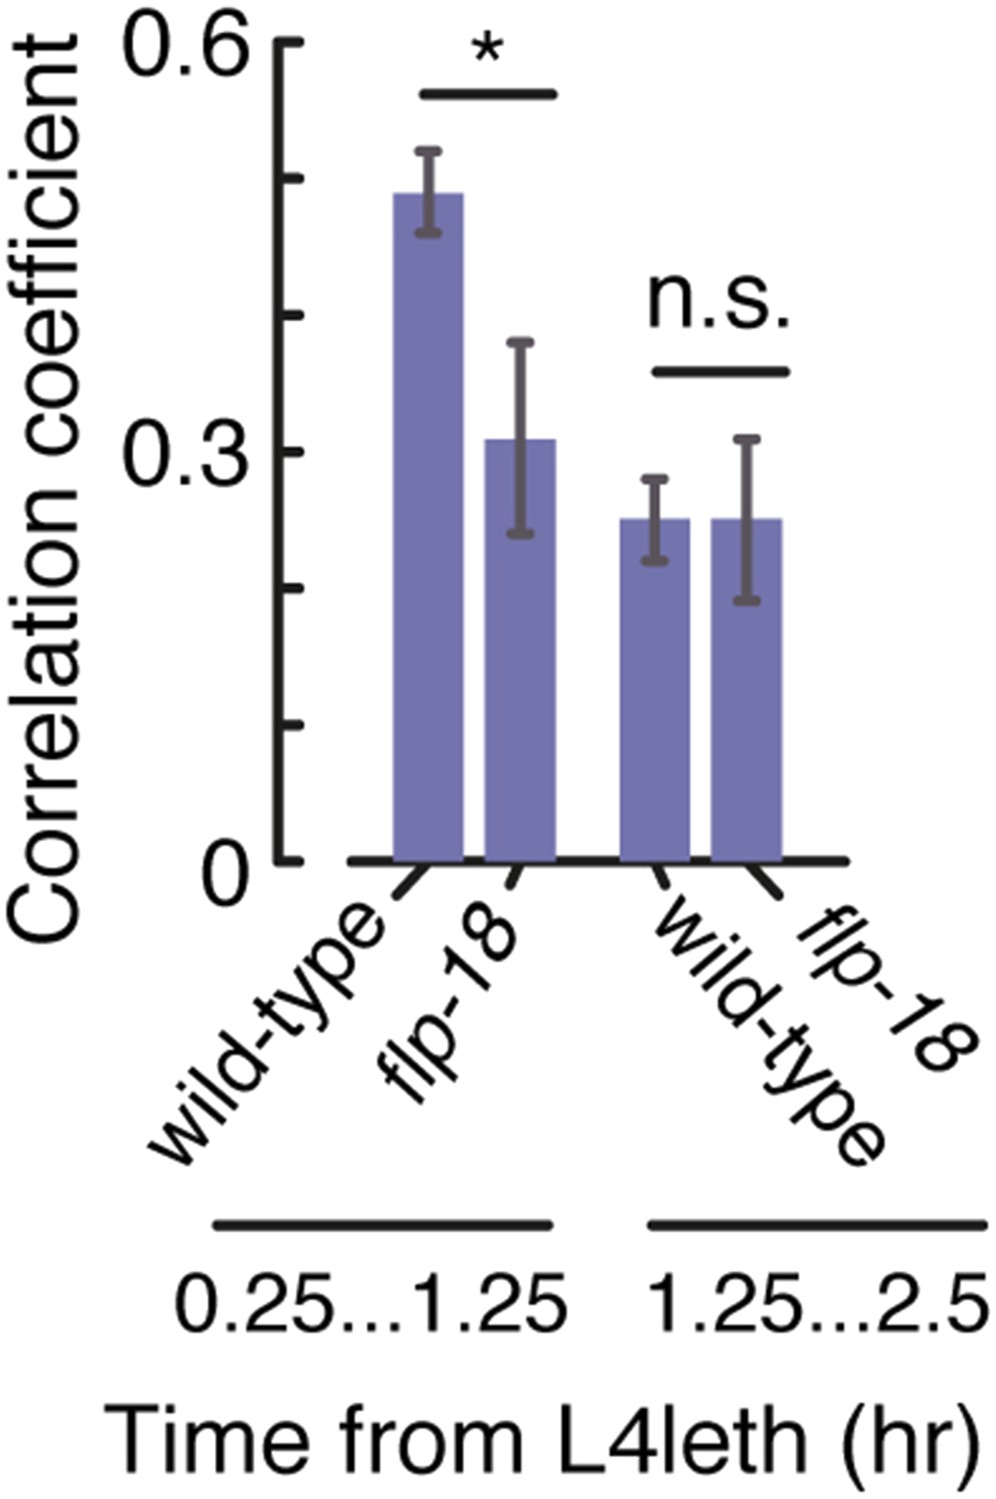
Bout correlations in undisturbed flp-18 mutants.
Pairwise bout correlations in wild-type animals and flp-18 mutants during the first and second halves of L4leth. The behavior of the mutants differed from wild-type only during the first half of L4leth, corresponding to the period of upregulation of the expression reporter. Error bars depict 95% confidence intervals and asterisks denote p < 0.05.
Figure 8
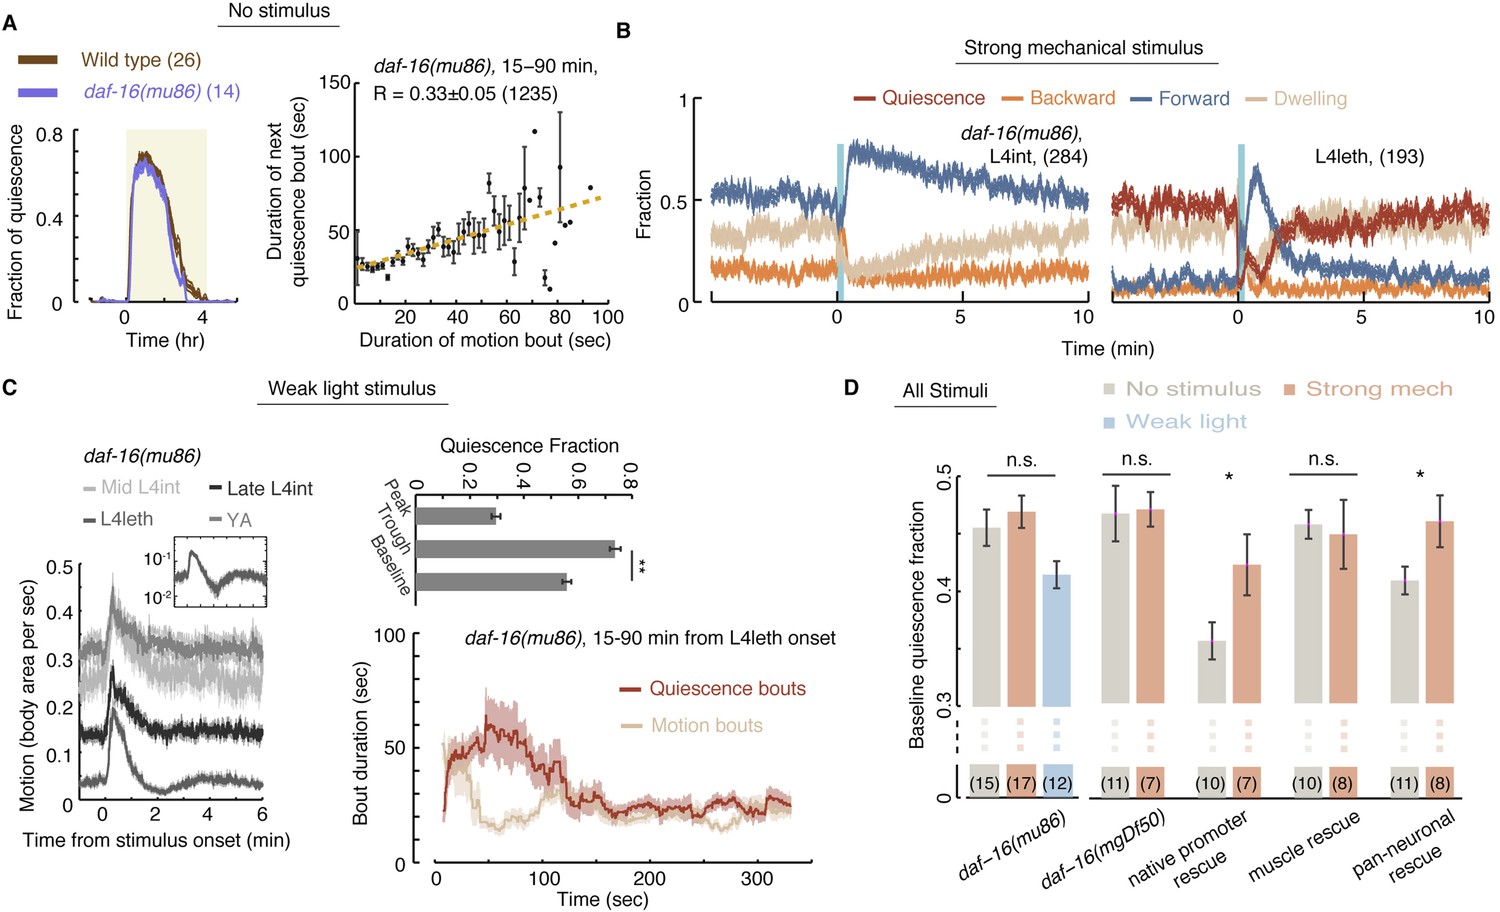
Homeostatic responses to strong stimuli, but not micro-homeostasis, require DAF-16.
(A) Left: the fraction of quiescence of wild-type animals and daf-16 mutants during L4leth (shaded area). Plots depict mean ± s.e.m, the numbers of animals assayed are denoted in parentheses. Right: pairwise bout correlations shown with a plot of binned bouts (see Figure 2A for details). Pairwise correlations were reduced in the mutant, although less so than in npr-1 mutants (p < 0.05). All correlations are given with 95% confidence intervals and error bars depict ±s.e.m. The number of bouts in each case is denoted in parentheses. (B) A posture-based analysis of responses of L4int and L4leth daf-16 mutants to strong stimuli (15 s, 1 kHz vibrations): the fraction of forward locomotion, backward locomotion, dwelling, and quiescence before, during, and after the stimulus. (C) Left: frame subtraction based analyses of responses of L4leth daf-16 mutants to weak stimuli (15 s, 20 mW/cm2, blue light). Inset: the response of daf-16 mutants during L4leth on a semi-log scale. Middle: the fraction of quiescence during 1 min intervals centered at the times of the peak and trough of the L4leth responses, as well as for their respective pre-stimulus baselines. All stimuli were initiated at t = 0. N = 50–60 animals. Plots and bars depict mean ± s.e.m, asterisks denote p < 0.001. Right: a posture-based analysis of bout dynamics of daf-16 mutants following a weak stimulus. Plots depict mean ± s.e.m, smoothed using a 30 s running window average. N = 12 animals. The compensatory enhancement of quiescence bouts shortly after the stimulus, as assayed by both methods, was similar to wild-type. (D) The mean baseline fractions of quiescence of daf-16 mutants in undisturbed animals and in the presence of weak and strong stimuli. In contrast to wild-type, baseline quiescence fraction was indistinguishable between the different conditions. Expression of daf-16 in neurons, but not in body-wall muscles, restored the homeostatic response of daf-16 mutants to strong mechanical stimuli. Error bar depicts ±s.e.m. The number of stimuli assayed is noted in parentheses for each condition.
Download links
A two-part list of links to download the article, or parts of the article, in various formats.
Downloads (link to download the article as PDF)
Open citations (links to open the citations from this article in various online reference manager services)
Cite this article (links to download the citations from this article in formats compatible with various reference manager tools)
Homeostasis in C. elegans sleep is characterized by two behaviorally and genetically distinct mechanisms
eLife 3:e04380.
https://doi.org/10.7554/eLife.04380


