Causal manipulation of functional connectivity in a specific neural pathway during behaviour and at rest
- Oxford University, United Kingdom
- National Institutes of Health, United States
- Uniformed Services University of Health Sciences, United States
- Radboud University Nijmegen, Netherlands
Figures
Figure 1
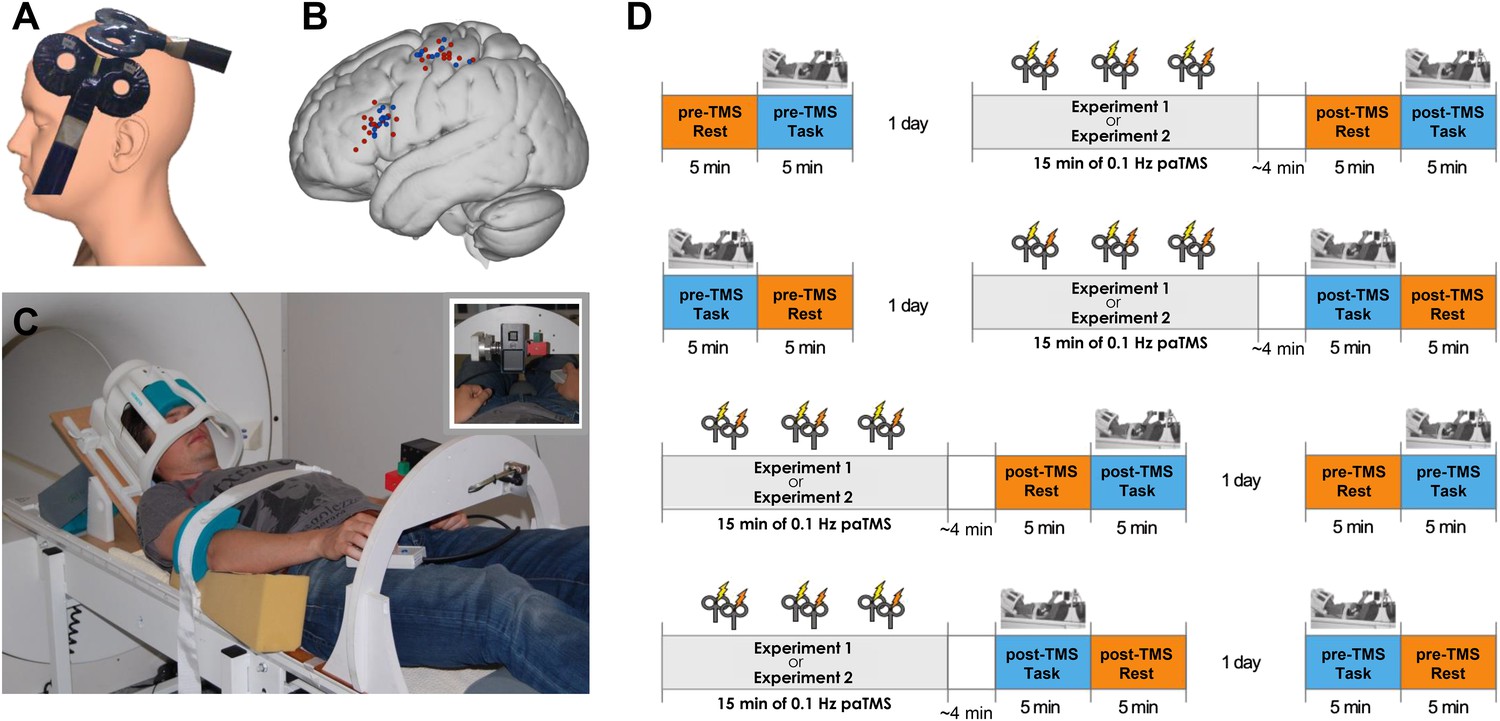
Experimental procedure.
(A) 90 paired pulses were applied over ventral frontal cortex near PMv and M1 (mean MNI coordinates [−56 19 19] and [−40 −18 59] respectively) at 0.1 Hz for 15 min. (B) Individual stimulation locations for 8 ms IPI (red) and 500 ms IPI (blue). (C) Participants performed visually guided grasping movements towards one of two objects (small or large; see inset) while lying supine in the MR scanner. The head coil was tilted forward by 30° to allow for direct line of sight of the objects to be grasped. A response button box was positioned on the upper leg. (D) Experimental design and setup for all experiments (for both 8 ms IPI and 500 ms IPI experiment). The order of resting-state and grasping task fMRI as well as of pre-TMS (baseline) and post-TMS sessions was counterbalanced.
Figure 2 with 1 supplement
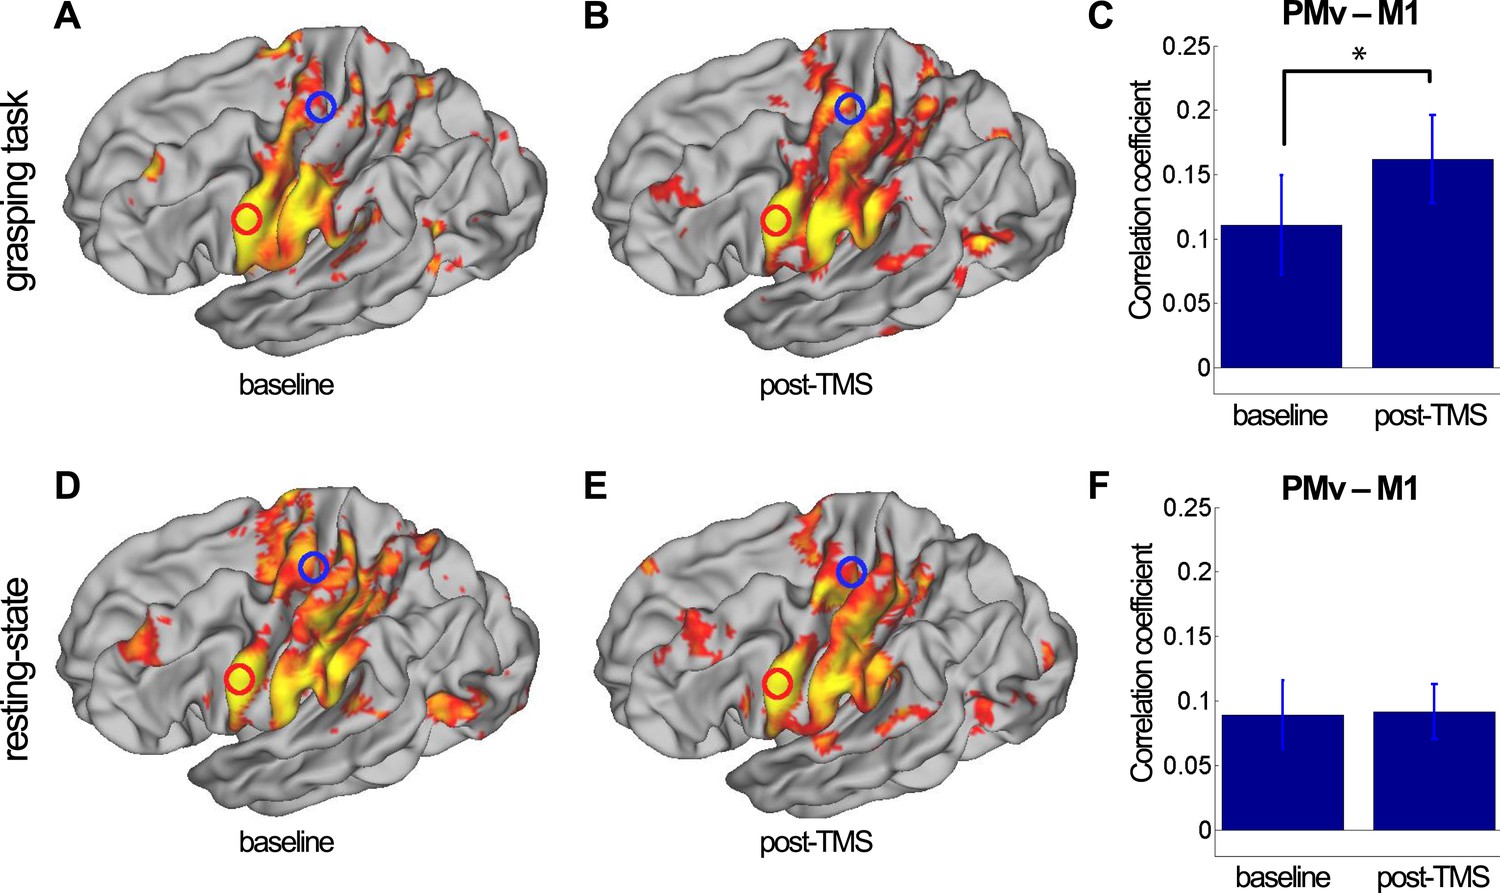
8 ms IPI repeated paired TMS (Experiment 1).
Group correlation maps seeded from PMv (red circle) during the grasping task (N = 14) (A, B) and in the resting state (N = 15) (D, E) in the baseline (A, D) and post-TMS sessions (B, E) with a spatial extent threshold of Z > 2.3 and a significance threshold of p < 0.05. There was an increase in PMv-M1 coupling during grasping (C), but not in the resting state (F). The blue circle covers the M1 ROI from which correlation coefficients were extracted. Error bars represent 1 s.e.m.
Figure 2—figure supplement 1

8 ms IPI repeated paired TMS (Experiment 1).
Mean group regression coefficients for PMv-M1 connectivity during the grasping task at baseline and post-TMS (N = 14). There was an increase in PMv-M1 coupling during grasping (A). There was no change in PMv-M1 functional connectivity during rest as shown by mean group regression coefficients for PMv-M1 connectivity at rest (N = 15) (B). Error bars represent 1 s.e.m.
Figure 3 with 1 supplement
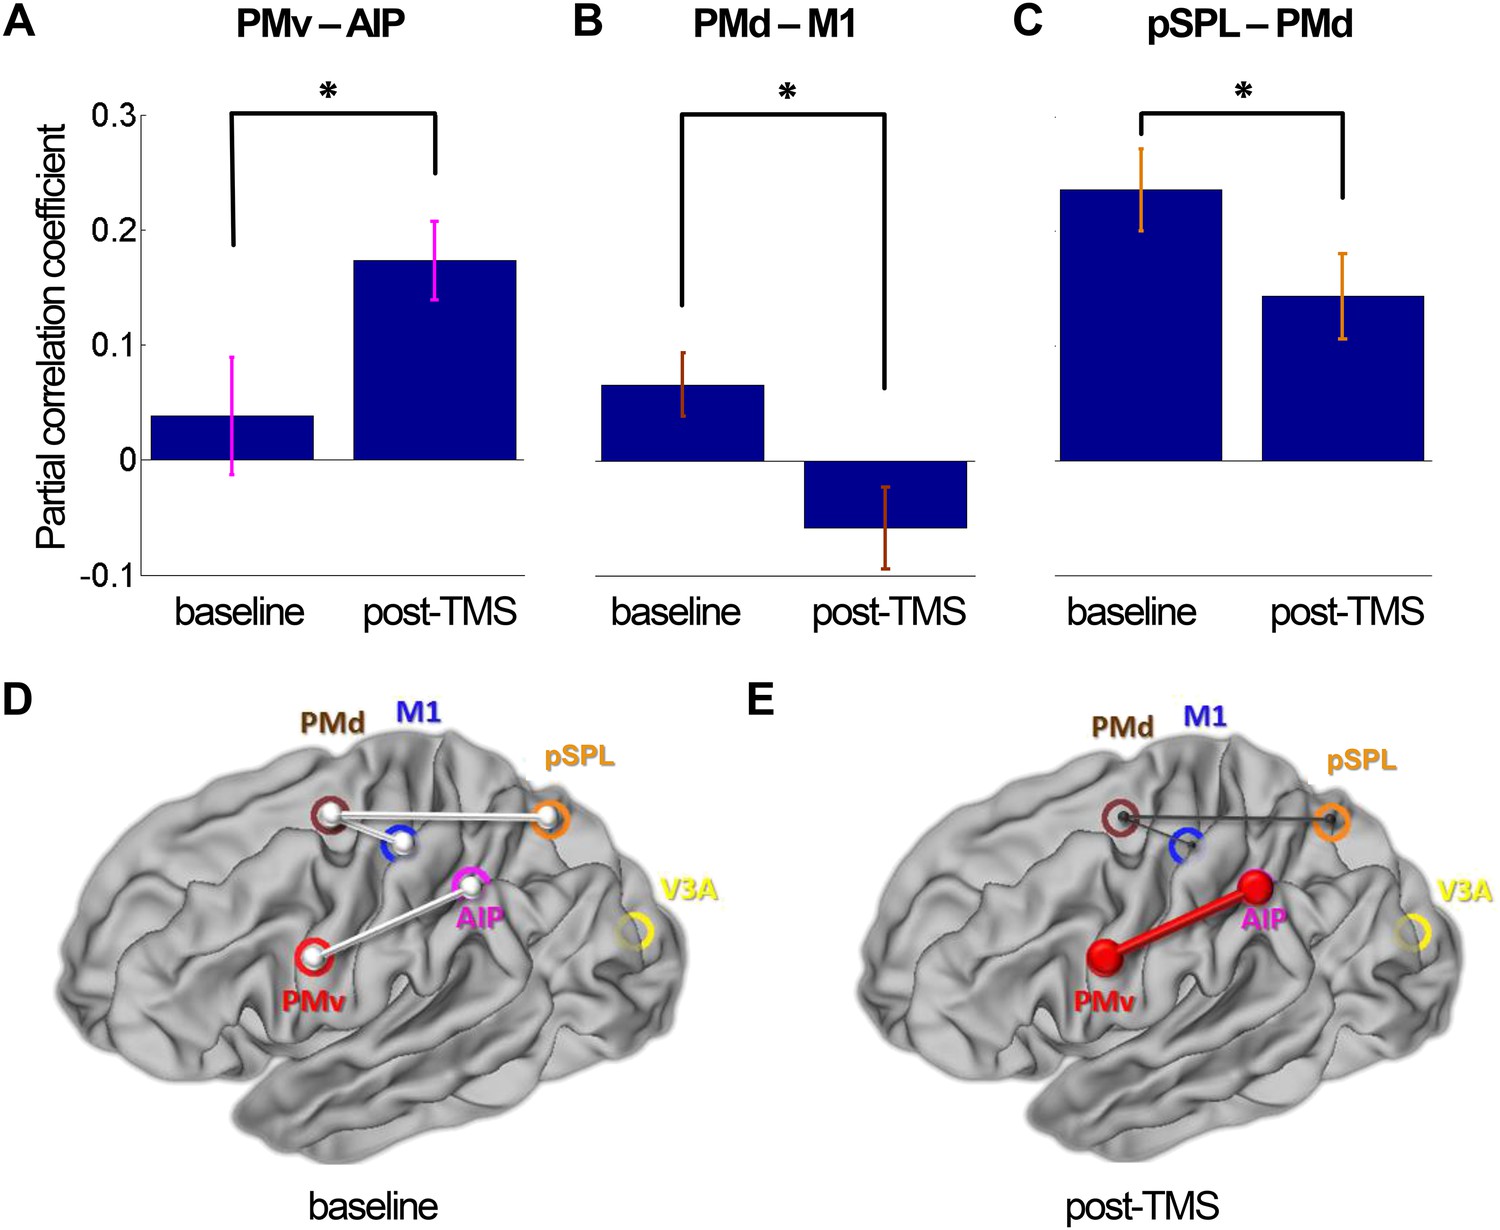
8 ms IPI repeated paired TMS (Experiment 1).
Partial correlation analysis of resting-state fMRI. There was a significant increase in coupling between other nodes (PMv-AIP) within the dorsolateral sensorimotor network that are linked to PMv and M1 over which repeated paired stimulation was applied (A). At the same time, there were significant decreases in functional connectivity within the dorsomedial sensorimotor network; between PMd and M1 (B) and PMd and pSPL (C). Error bars represent 1 s.e.m. (D and E) Schematic representation of mean group connectivity weights (grey lines) in baseline and post-TMS sessions. (D) All weights are standardised to the baseline partial connectivity of each connection. (E) Significant increments in PMv-AIP connectivity (red line) and decrements in PMd-M1 and PMd-pSPL connectivity (black lines) in the post-TMS session (N = 15).
Figure 3—figure supplement 1
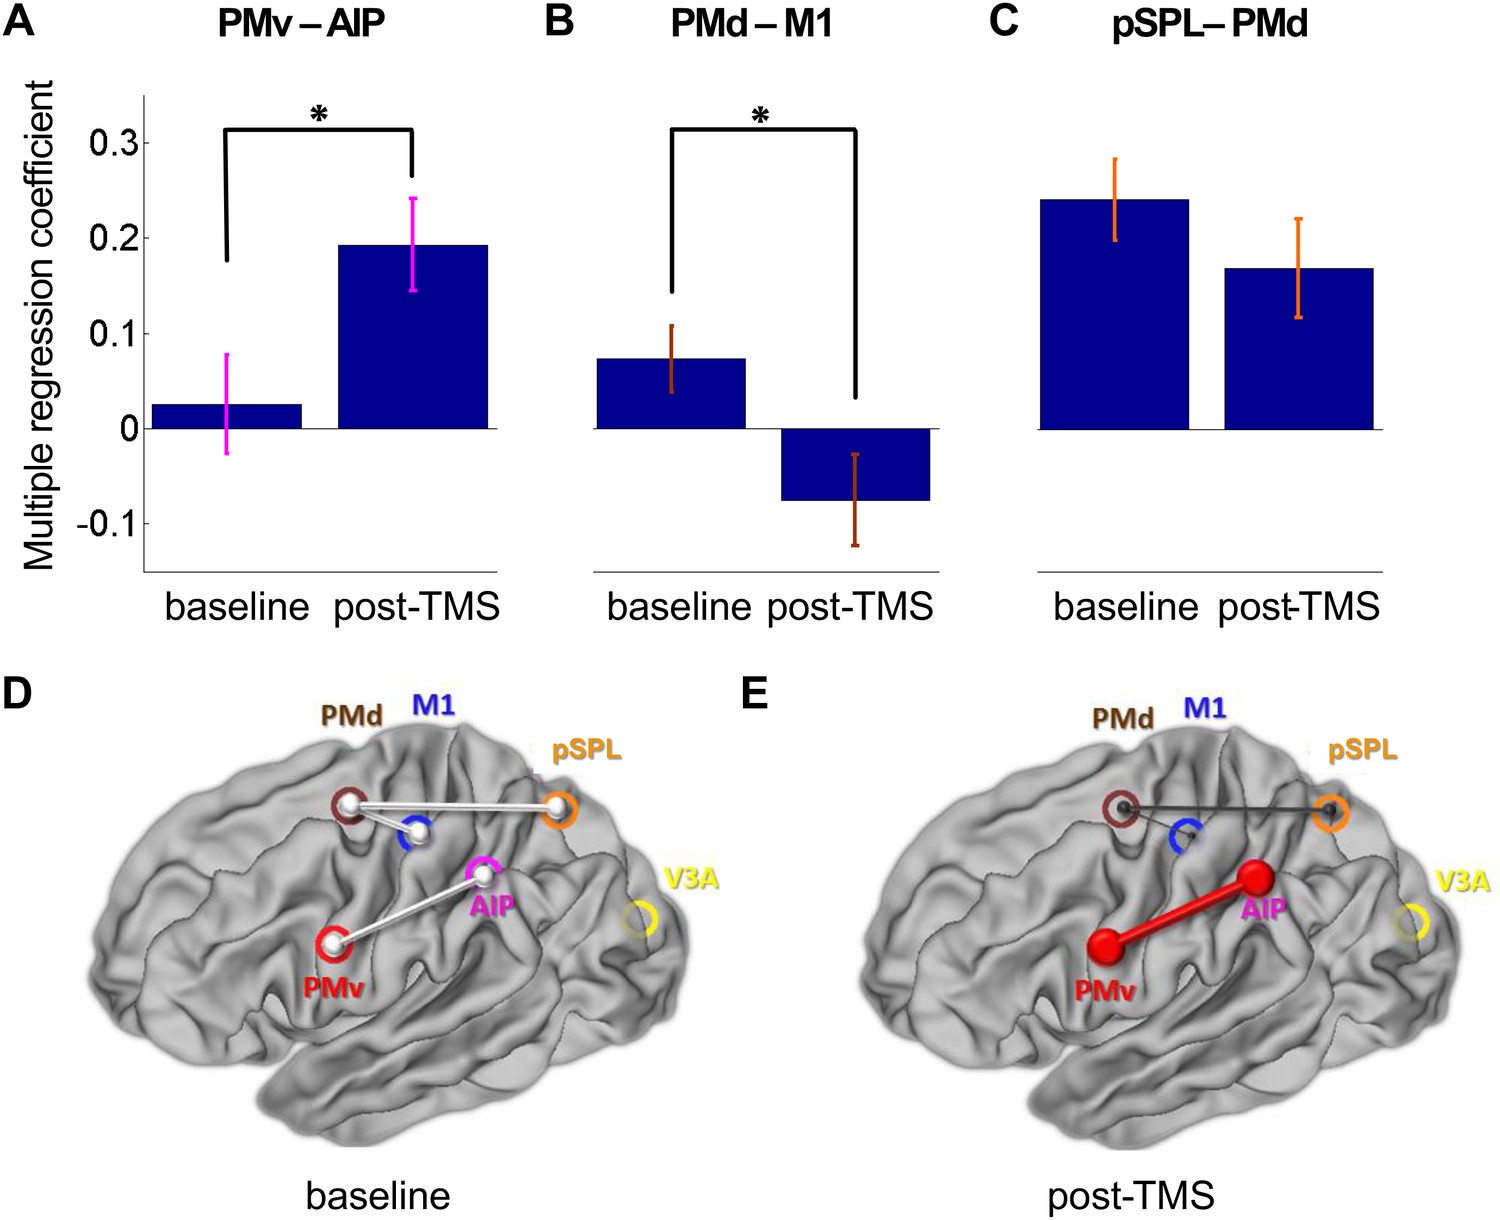
8 ms IPI repeated paired TMS (Experiment 1).
Multiple regression analysis (psychophysiological interaction analysis) of resting-state fMRI before and after TMS intervention (N = 15). There was a significant increase in coupling between nodes PMv-AIP within the dorsolateral visuomotor circuit, of which PMv was stimulated during repeated paired PMv-M1 stimulation (A). At the same time there was a significant decrease in functional connectivity between PMd-M1, a connection which is part of the dorsomedial sensorimotor circuit (B). For the other nodes of the dorsomedial stream, pSPL-PMd, there was tendency for a decrease in connectivity (C). Error bars represent 1 s.e.m. (D) All weights are standardised to the baseline partial connectivity of each connection (grey lines). (E) Significant increments in PMv-AIP connectivity (red line) and decrements in PMd-M1 connectivity (black line) - and a tendency for a decrease in PMd-pSPL connectivity (black line) - in the post-TMS session (N = 15).
Figure 4 with 1 supplement
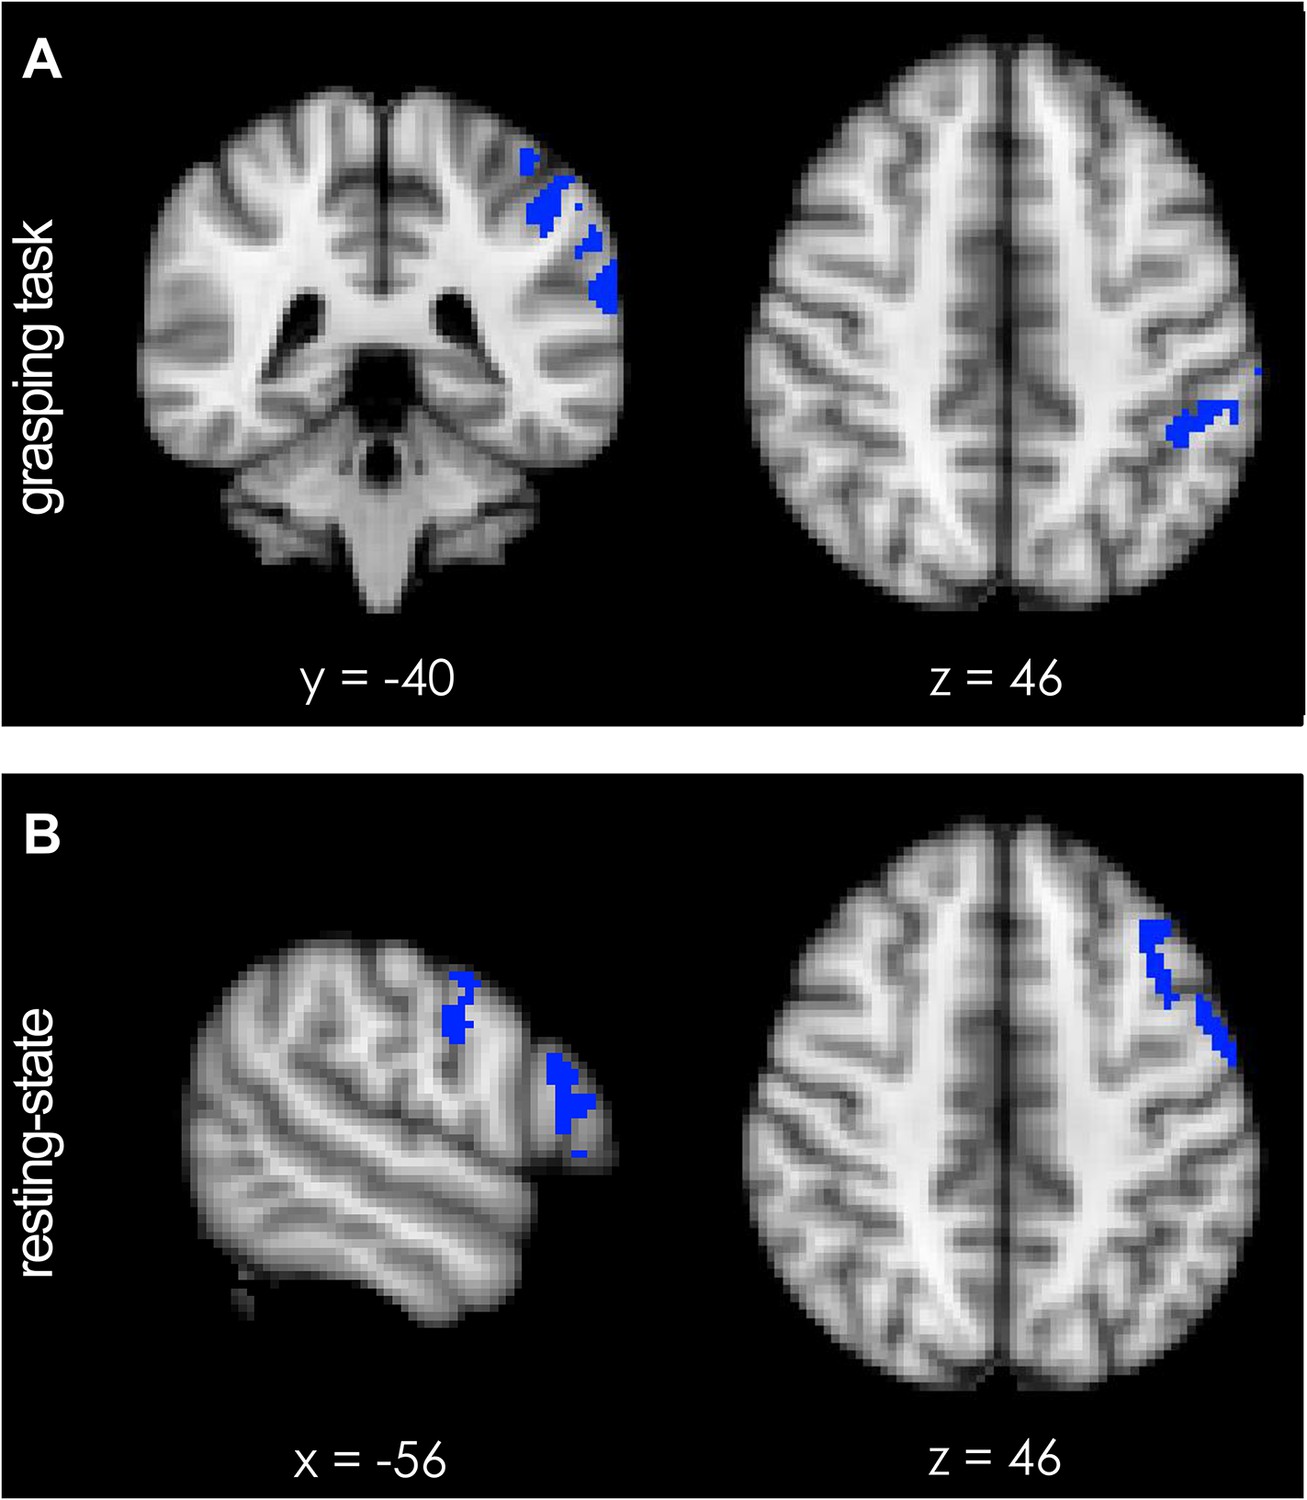
Short-term potentiation of PMv-M1 connectivity led to increased activation of left AIP [−44 −40 46] (blue indicates areas of increased coupling) during grasping.
(A) AIP activity became significantly more coupled with the sensorimotor network (see Figure 4—figure supplement 1A). (B) At rest, pathway potentiation evoked coactivation of PMv [−56 −4 30] and a prefrontal region close to the site of stimulation (inferior frontal junction (IFJ) [−56 20 22]). These areas (blue) became specifically more coupled with a left-lateralised frontoparietal network (see Figure 4—figure supplement 1B). All effects (p < 0.05; N = 15).
Figure 4—figure supplement 1
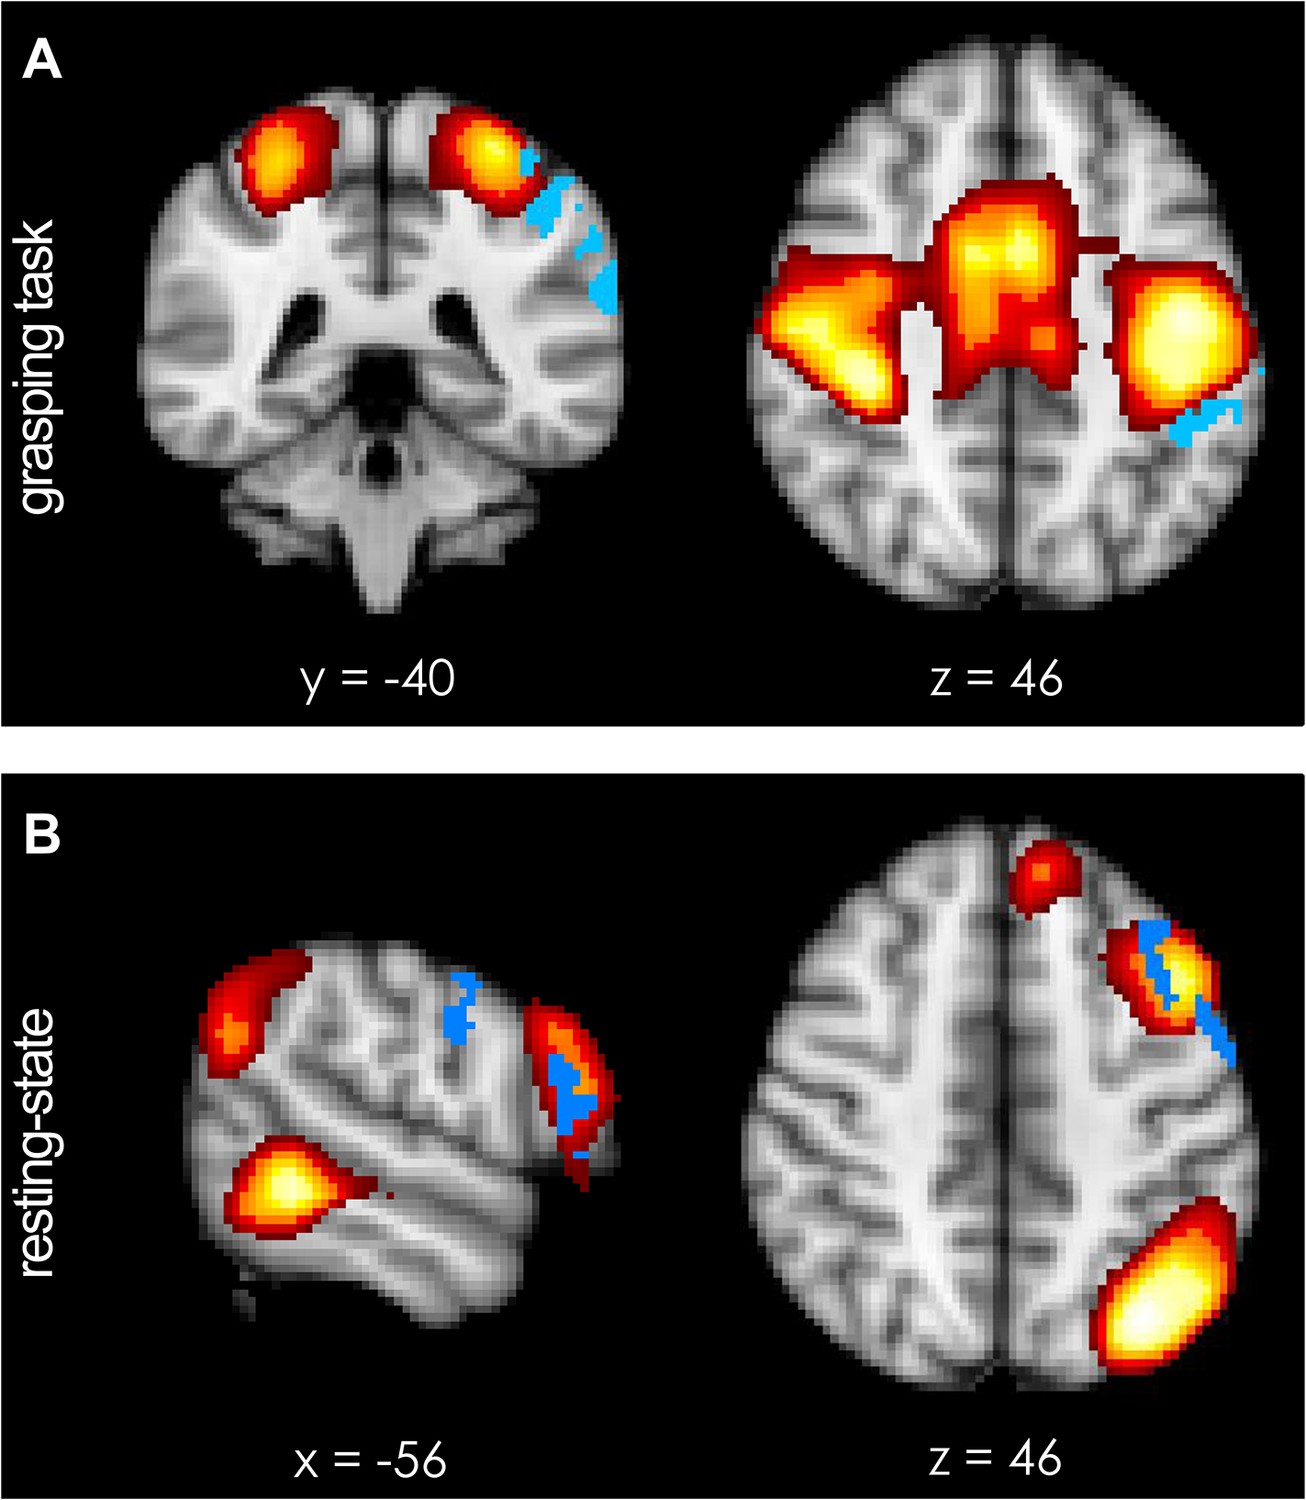
Functional spatial networks (red-to-yellow, z-statistical map thresholded at z = 5.0) as defined by synchronous fluctuations in BOLD activity during performance of the prehension task (A) and during rest (B).
(A) Short-term potentiation of PMv-M1 connectivity led to increased coupling of the sensorimotor network (bilateral somatosensory, motor, and premotor areas; red-to-yellow) with left AIP [−44 −40 46] (blue) during grasping as demonstrated by a dual-regression analysis. (B) At rest, after TMS intervention, PMv [−56 −4 30] and a prefrontal region just anterior to it and close to the site of stimulation (inferior frontal junction (IFJ) [−56 20 22]) became more coupled with each other and a left-lateralised frontoparietal network (blue indicates areas of increased coupling, p < 0.05; N = 15).
Figure 5

Experiment 3: correlation of PMv-M1 connectivity measures before and after 8 ms IPI paired TMS (N = 10).
When subjects were making grasping movements, there was a significant correlation between functional connectivity (derived from partial-correlation analysis of fMRI) in the baseline (A) and post-TMS session (B) and the baseline effective connectivity measure derived from the paired pulse TMS MEP ratio at baseline. There was a significant negative correlation between functional connectivity in the post-TMS session and the baseline effective connectivity measure derived from the paired-pulse TMS MEP ratio at baseline (D). The correlation did not reach significance when the functional connectivity measure as well as the effective connectivity measure was taken from the baseline session (C).
Tables
Table 1
Regions of interest from which BOLD time series were extracted
| ROIs in MNI standard space | x | y | z |
|---|---|---|---|
| Left M1 | −36 | −24 | 62 |
| Left PMv | −58 | 4 | 30 |
| Left PMd | −22 | −4 | 58 |
| Left AIP | −44 | −42 | 46 |
| Left pSPL | −22 | −64 | 54 |
| Left V3A | −26 | −86 | 18 |
-
6 mm diameter masks were created in Montreal Neurological Institute (MNI) space. Coordinates refer to MNI152_standard brain as provided by FSL. The ROI mask for M1 was based upon the meta-analysis of functional brain imaging data of motor control (Mayka et al., 2006). The PMv ROI location was then identified by finding the region in which BOLD activity was significantly correlated with activity in M1 at the group level, both during rest and during the grasping task. The peak resulting MNI coordinate [−58 4 30] was located in what is defined as PMv by Mayka et al. (2006) which had a centre-of-mass at [−52 4 24]; more specifically, it lies in the 6v/F5c subdivision of PMv identified by Neubert et al. (2014). The ROI masks for AIP, PMd, pSPL, and V3A were the same size, but were centred on the group peak activation average coordinates of an fMRI study that employed a similar visually guided grasping task and the same apparatus (Grol et al., 2007). Masks were registered to individual EPI space in a two-step process: the mask was transformed into individual, high-resolution structural space via non-linear registration (FSL FNIRT) and then into individual functional space via affine registration (FSL FLIRT; Jenkinson et al., 2002).
Table 2
Summary of results from hypothesis-driven analyses conducted on 8 ms-IPI Experiment 1 and control Experiment 2 (IPI of 500 ms)
| Expt 1 (IPI 8 ms) | Expt 2 (IPI 500 ms) | Expt 1 vs Expt 2 | |||||||||||
|---|---|---|---|---|---|---|---|---|---|---|---|---|---|
| PMv-M1 | AIP-PMv | pSPL-PMd | PMd-M1 | PMv-M1 | AIP-PMv | pSPL-PMd | PMd-M1 | PMv-M1 | AIP-PMv | pSPL-PMd | PMd-M1 | ||
| Functional connectivity (fc) | grasp | t(13) = −2.59; p = 0.023* | t(13) = 0.94; p = 0.36 | F(1,26) = 4.64; p = 0.041* | |||||||||
| rest | t(14) = −0.07; p = 0.94 | t(14) = 0.07; p = 0.95 | n.a. | ||||||||||
| partial correlation fc | grasp | t(13) = −3.72; p = 0.003* | n.s. | n.s. | n.s. | t(13) = 1.00; p = 0.34 | n.s. | n.s. | n.s. | F(1,26) = 7.76; p = 0.011* | n.s. | n.s. | n.s. |
| rest | t(14) = −0.07; p = 0.95 | t(14) = −2.50; p = 0.025* | t(14) = 2.22; p = 0.04* | t(14) = 2.84; p = 0.013* | t(14) = −0.39; p = 0.70 | t(14) = 1.08; p = 0.30 | t(14) = −1.24; p = 0.24 | t(14) = 0.47; p = 0.65 | n.a. | F(1,28) = 7.15; p = 0.012* | F(1,28) = 5.29; p = 0.029* | F(1,28) = 5.92; p = 0.08 | |
| Psycho-physiological interaction (PPI) | grasp | t(13) = −4.78; p = 0.0004* | t(13) = 0.98; p = 0.35 | F(1,26) = 6.92; p = 0.014* | |||||||||
| rest | t(14) = 0.08; p = 0.93 | t(14) = 0.20; p = 0.85 | n.a. | ||||||||||
| multiple regression PPI | grasp | t(13) = −2.53; p = 0.0064* | n.s. | n.s. | n.s. | t(13) = 1.18; p = 0.26 | n.s. | n.s. | n.s. | F(1,26) = 7.47; p = 0.011* | n.s. | n.s. | n.s. |
| rest | n.a. | t(14) = −2.55; p = 0.023* | t(14) = 1.78; p = 0.097 | t(14) = 2.84; p = 0.013* | n.a. | t(14) = 0.41; p = 0.96 | t(14) = −1.18; p = 0.26 | t(14) = 0.01; p = 0.99 | n.a. | F(1,28) = 5.74; p = 0.024* | F(1,28) = 3.66; p = 0.066 | F(1,28) = 4.44; p = 0.044* | |
-
Analyses were conducted on rest and task data. Moreover in order to show that specific effects relate to plasticity induction (8 ms IPI) several higher-level analyses contrasting Experiment 1 and 2 are presented. T-tests were conducted as two-tailed paired t-tests (within subjects). Mixed-model ANOVAs were conducted between experiments (across subjects). Detailed information on all analyses is provided in the ‘Materials and methods’ section. Asterisks indicate significant results, p < 0.05. Abbreviations: n.s. = non-significant.
Download links
A two-part list of links to download the article, or parts of the article, in various formats.
Downloads (link to download the article as PDF)
Open citations (links to open the citations from this article in various online reference manager services)
Cite this article (links to download the citations from this article in formats compatible with various reference manager tools)
Causal manipulation of functional connectivity in a specific neural pathway during behaviour and at rest
eLife 4:e04585.
https://doi.org/10.7554/eLife.04585


