Normalisation of brain connectivity through compensatory behaviour, despite congenital hand absence
- Weizmann Institute of Science, Israel
- University of Oxford, United Kingdom
- Nuffield Orthopaedic Centre, United Kingdom
Figures
Figure 1
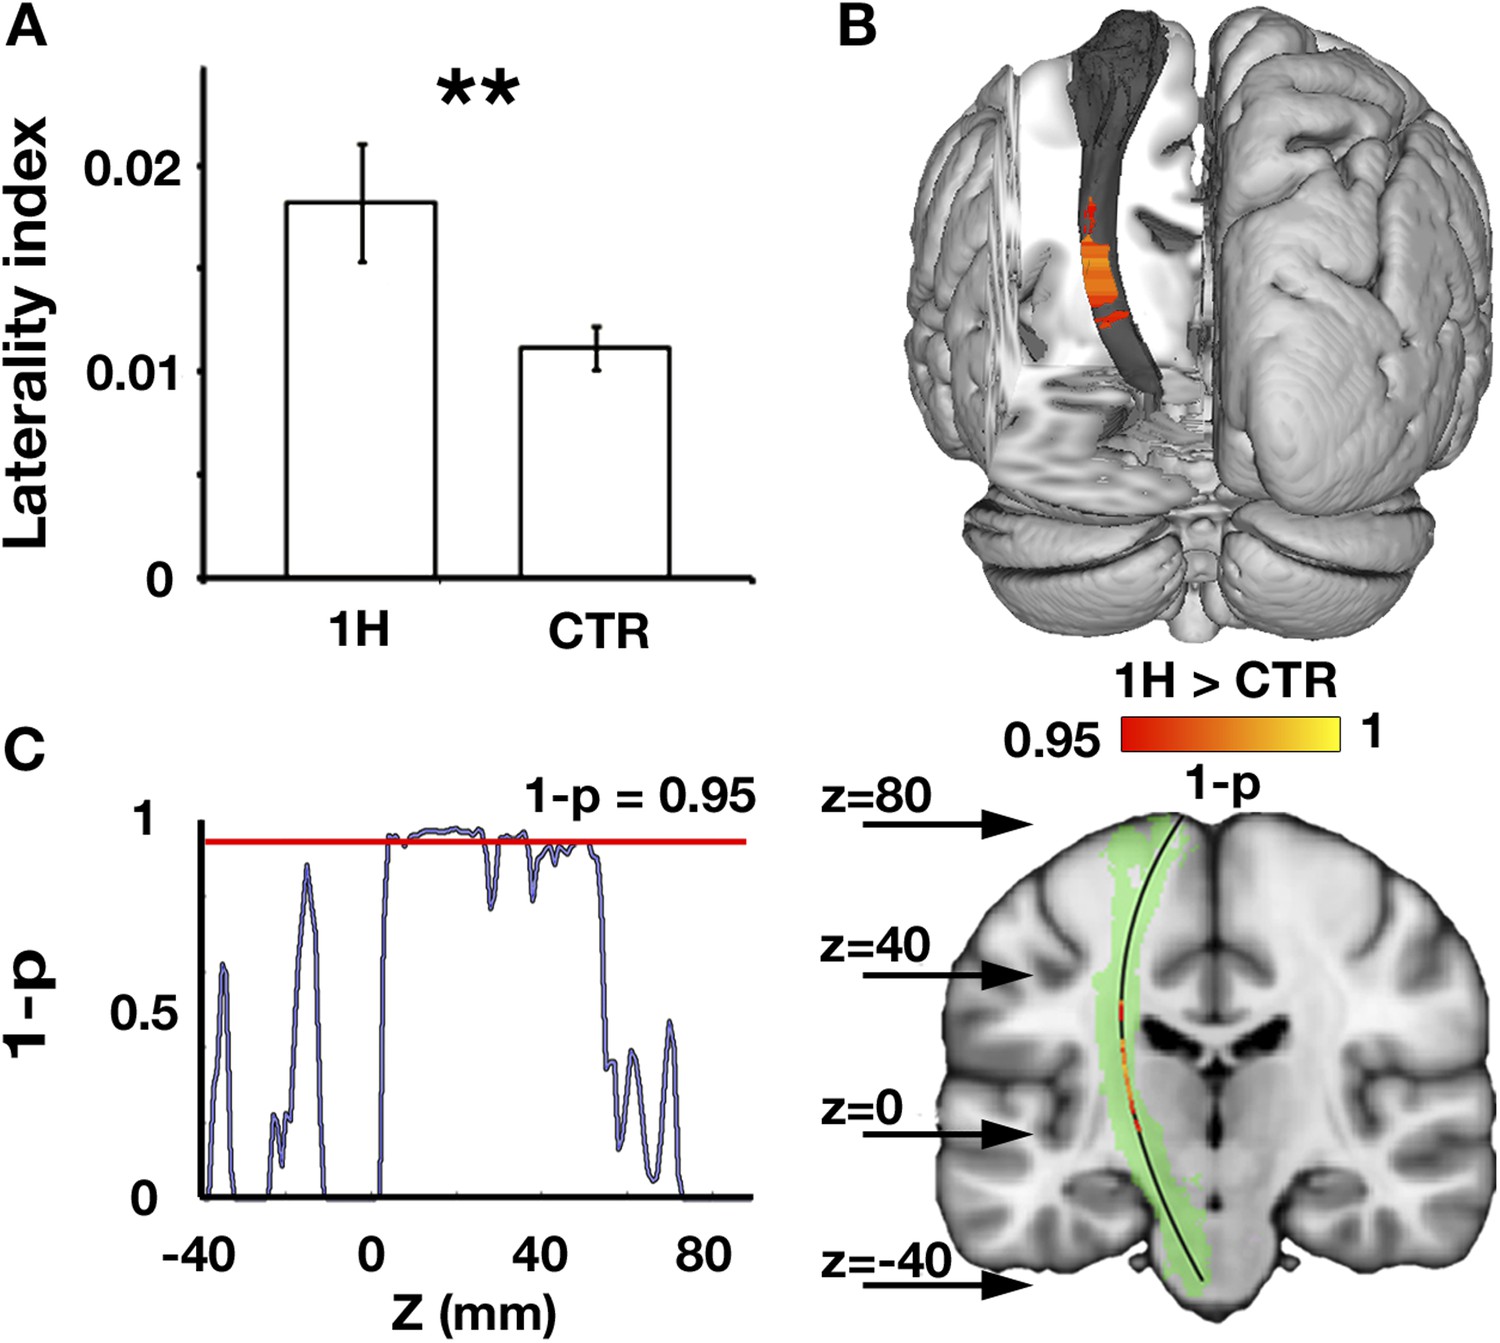
Increased structural asymmetry in one-handers.
(A) White matter values (mean fractional anisotropy ± s.e.m.) were extracted from the bilateral corticospinal tracts of each participant, and laterality indices were computed to determine the level of white matter asymmetry across hemispheres ([(intact − residual)/(intact + residual)] for one-handers, and [(dominant − nondominant)/(dominant + nondominant)] for controls). Laterality indices were significantly higher in one-handers compared to controls. (B) To spatially identify regions of increased white-matter laterality, laterality indices were computed for each slice along the superior–inferior axis of the corticospinal tracts, and a group comparison was conducted using permutation-based cluster statistics. Regions showing significant group differences along the corticospinal tracts were centred around the posterior limb of the internal capsule, reflecting higher laterality in one-handers compared to controls. Results are presented on the left corticospinal tract from a posterior view. (C) Right: Regions that show significantly higher laterality values in one-handers are presented on the left corticospinal tract (highlighted in green) along with their spatial locations along the z axis, as marked by arrows. Left: The lateralisation profile of white matter microstructure along the corticospinal tract is represented by p-values, derived from the comparison between one-handers and controls. Higher values indicate stronger statistical differences. The red line marks the significance threshold, corrected for multiple comparisons. 1H, one-handers; CTR, controls; asterisks denote significance at the level of **p < 0.01.
Figure 2
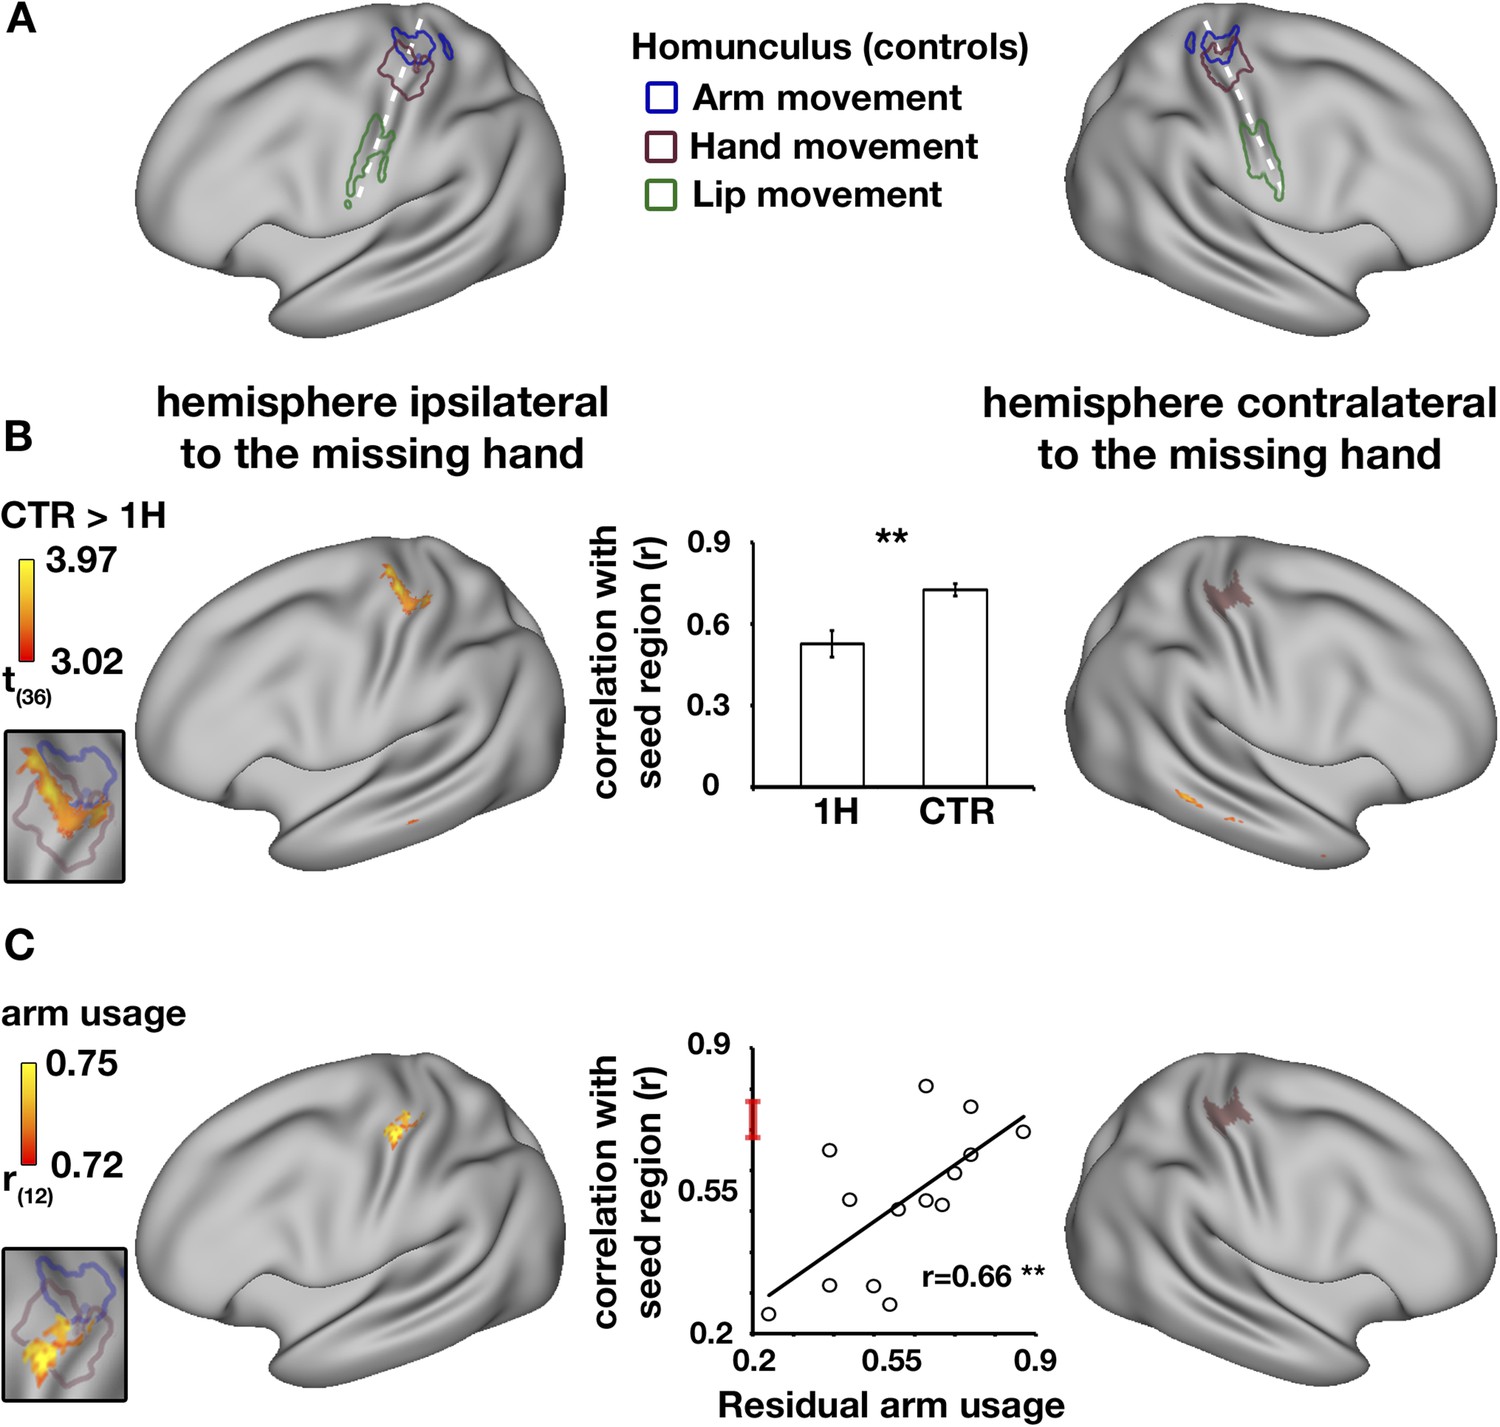
Decreased functional asymmetry in hand region functional connectivity during rest is associated with increased residual arm usage in daily tasks.
(A) An illustration of the human sensorimotor homunculus, projected on a cortical surface map. Coloured lines show brain areas activated during execution of movements of the arms (blue), hands (purple), and lips (green) in the control group, using task-evoked fMRI scans. (B) Whole-brain group comparison (controls > one-handers) of resting-state functional connectivity using the missing hand's cortical territory as the seed-region. The seed-region (the mirror projection of intact/dominant hand activity, averaged across groups) is shown in purple shading. The orange-yellow clusters show areas with lower levels of connectivity to the missing hand territory in one-handers (corrected, p < 0.05). The insert on the left shows that the main resulting cluster overlaps with the task-evoked hand region, as measured in controls in (A), suggesting lower levels of inter-hemispheric connectivity between the cortical hand regions in one-handers. The bar plot in the middle reflects group-wise mean (±s.e.m.) connectivity levels between the seed-region and the intact hand ROI (defined based on intact/dominant hand activity, averaged across groups). (C) Whole-brain correlations between connectivity levels with the missing hand's seed-region (purple shading) and level of one-handers residual arm usage in daily tasks (level of bimanual usage). Significant correlations were restricted to the anterior aspect of the intact hand knob of the central sulcus, as can be seen in the insert to the left. Scatter plot in the middle reflects connectivity levels between the seed-region and the intact hand region (y axis) versus residual arm use (x axis). The red line on the y axis shows the mean ± confidence interval of controls' hand region inter-hemispheric connectivity. The significant positive correlation (p < 0.005) reflects that one-handers using their residual arm more frequently to support bimanual tasks showed higher levels of hand region functional connectivity, similar to those of control participants. This suggests that increased residual arm usage to support bimanual tasks normalises the aberrantly reduced levels of inter-hemispheric connectivity in one-handers, shown in (B). 1H = one-handers; CTR = controls; Asterisks denote significance at the level of **p < 0.005.
Tables
Table 1
Demographic details of individuals with congenital limb absence
| Participant | Age | Level of limb deficiency | Affected limb |
|---|---|---|---|
| A01 | 33 | below elbow | Right |
| A02 | 26 | below elbow | Left |
| A03 | 37 | below elbow | Left |
| A04 | 33 | wrist | Left |
| A05 | 27 | below elbow | Left |
| A06 | 56 | below elbow | Left |
| A07 | 51 | wrist | Left |
| A08 | 24 | below elbow | Right |
| A09 | 51 | below elbow | Right |
| A10 | 20 | below elbow | Left |
| A11 | 48 | above elbow | Left |
| A12 | 24 | below elbow | Left |
| A13 | 35 | below elbow | Right |
| A14 | 48 | below elbow | Left |
Table 2
Cluster statistics for presented statistical maps
| Statistical parametric map | Voxels | Max value | X | Y | Z | Region |
|---|---|---|---|---|---|---|
| Hand-evoked activation (intact hand ROI) | 305 | 9.09 (Z) | −38 | −26 | 58 | Primary sensorimotor cortex, intact/dominant hemisphere |
| Hand-evoked activation | 166 | 9.84 (Z) | 22 | −50 | −24 | Intact cerebellum, lobule VI, intact/dominant hemisphere |
| Seed-based functional connectivity, between group t-test | 239 | 4.26 (t) | −38 | −24 | 60 | Primary sensorimotor cortex, intact/dominant hemisphere |
| Seed-based functional connectivity, between group t-test | 159 | 4.22 (t) | 6 | 38 | 40 | Dorsomedial prefrontal cortex, missing/nondominant hemisphere |
| Seed-based functional connectivity, between group t-test | 72 | 3.92 (t) | 70 | −36 | −2 | Middle temporal gyrus, missing/nondominant hemisphere |
| Seed-based functional connectivity, between group t-test | 7 | 3.21 (t) | −68 | −26 | −12 | Middle temporal gyrus, intact/dominant hemisphere |
| Correlations between voxel-wise functional connectivity values and behavioural scores | 225 | 0.81 (r) | −30 | −28 | 44 | Primary sensorimotor cortex, intact/dominant hemisphere |
-
Columns present the cluster size (no. of voxels), the value of the maximum ‘intensity’ within the cluster (Max value), the location of the maximum intensity voxel given as X/Y/Z values in MNI coordinates, and the functional region. Intact/dominant hemisphere relates to the hemisphere contralateral to the intact/dominant hand in one-handers/controls, respectively. Missing/nondominant hemisphere relates to the hemisphere contralateral to the missing/nondominant hand in one-handers/controls, respectively.
Download links
A two-part list of links to download the article, or parts of the article, in various formats.
Downloads (link to download the article as PDF)
Open citations (links to open the citations from this article in various online reference manager services)
Cite this article (links to download the citations from this article in formats compatible with various reference manager tools)
Normalisation of brain connectivity through compensatory behaviour, despite congenital hand absence
eLife 4:e04605.
https://doi.org/10.7554/eLife.04605


