Role of visual and non-visual cues in constructing a rotation-invariant representation of heading in parietal cortex
- Washington University in St. Louis, United States
- Baylor College of Medicine, United States
- University of Rochester, United States
Figures
Figure 1 with 1 supplement
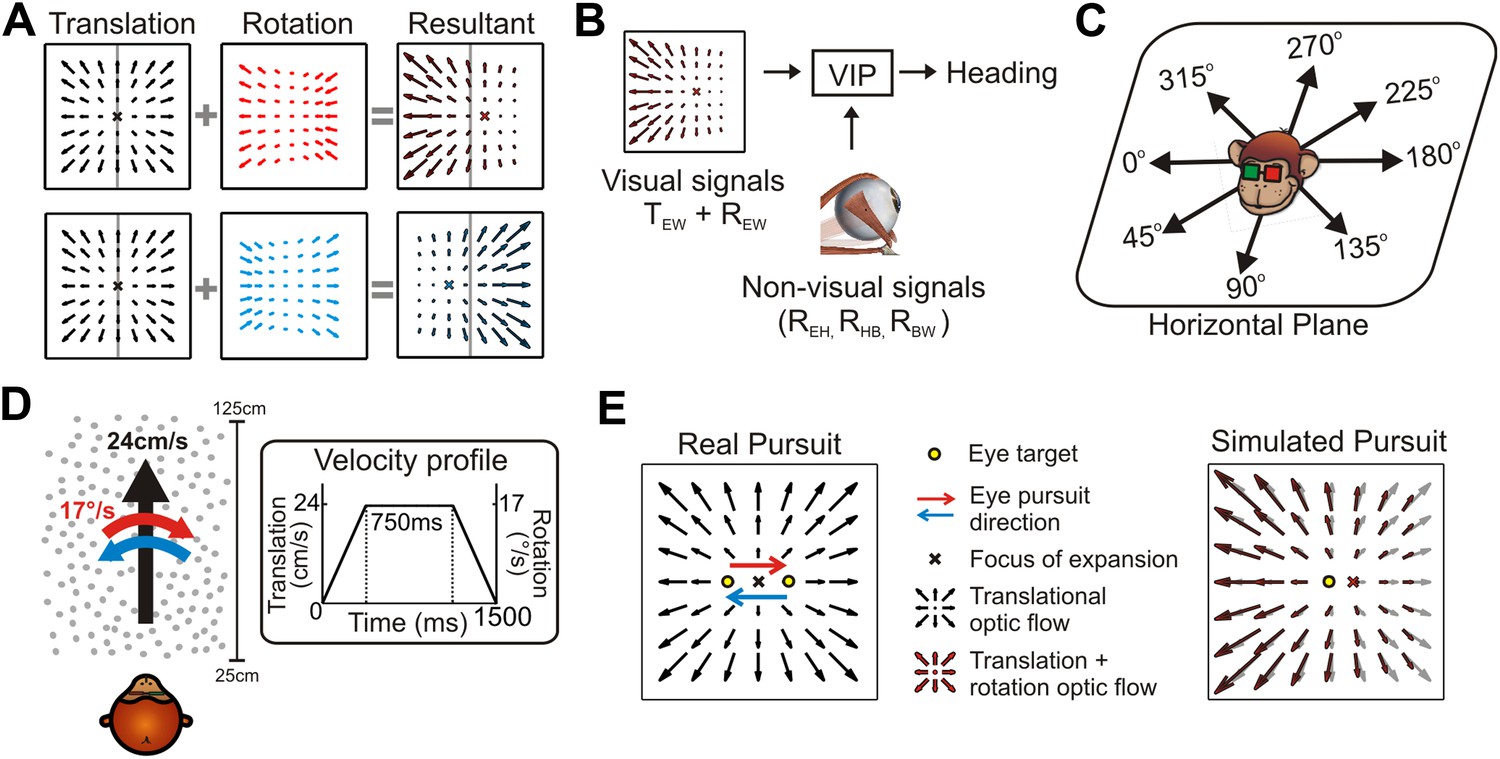
The problem of dissociating translations and rotations, and experimental approaches.
(A) Optic flow patterns during self-motion (shown as planar projections onto a flat image). Forward translations result in symmetric flow patterns (black vector fields) with a focus of expansion (FOE) indicating heading. When rotations are added to forward translations, the resultant optic flow pattern has an FOE shift in the direction of the added rotation (rightward rotation: red, leftward rotation: blue). (B) VIP receives both visual and non-visual signals that may be used to achieve rotation-invariant heading estimates. Visual optic flow signals contain information about translation and rotation of the eye in the world (TEW, REW) whereas non-visual signals (efference copies) may contain information about rotation of eye-in-head (REH), rotation of head-on-body (RHB), or rotation of body-in-world (RBW). (C) Visual stimuli simulating translations in eight directions spanning the entire horizontal plane were presented to the monkey. (D) Schematic showing the translation and rotation parameters in the simulated 3D cloud. Inset shows the trapezoidal velocity profile of translation and rotation during the course of a trial (1500 ms). (E) During the ‘Real pursuit (RP)’ condition, the optic flow stimulus on the screen simulated translation, while rotation was added by having the monkey smoothly pursue a visual target that moved leftward or rightward across the screen. During the ‘Simulated pursuit (SP)’ condition, the monkey fixated at the center of the display while optic flow simulated combinations of translation and eye rotation. During real and simulated pursuit, the optic flow patterns projected onto the monkey's retina were nearly identical.
Figure 1—figure supplement 1
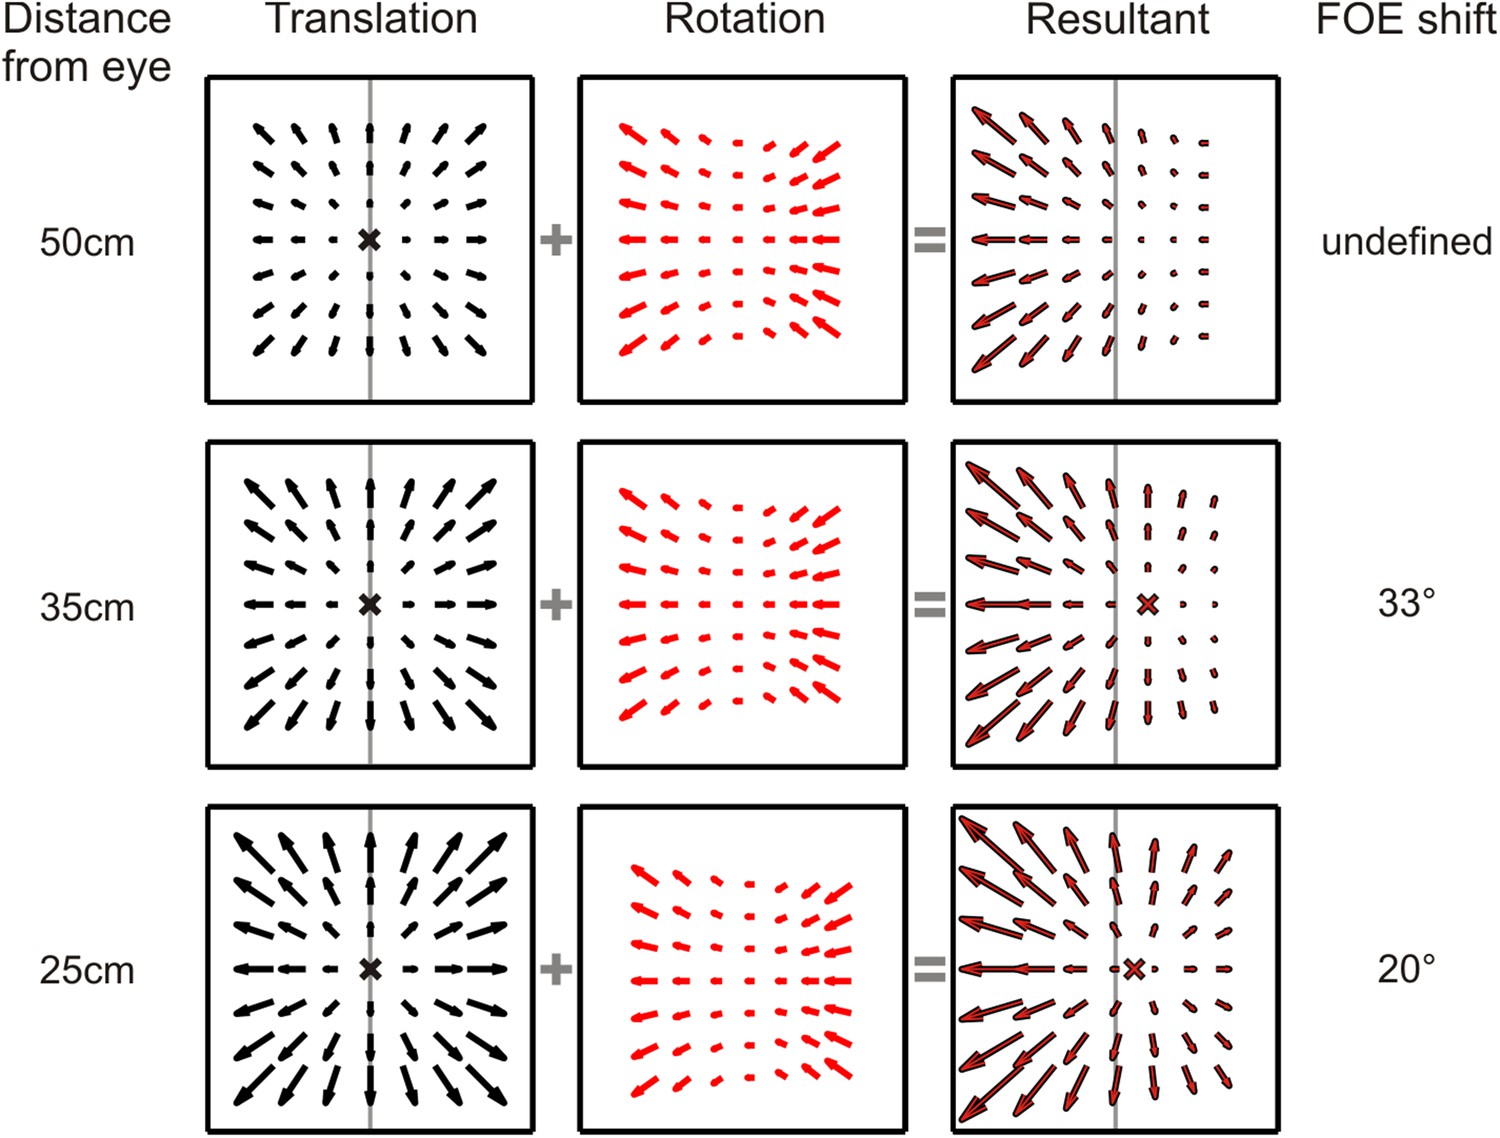
Dependence of translational and rotational optic flow properties on viewing distance.
Translational optic flow vectors (left column) decrease in magnitude as the distance of the plane being viewed increases. Rotational optic flow (middle column), however, remains constant irrespective of the viewing distance. When these translation and rotation flow fields are added, the resultant FOE shift consequently varies with distance to the plane (right column). Therefore, in a 3D environment where objects are present at varying distance from the observer, no single FOE exists. For the stimulus parameters used in this study, the nearest depth plane of the simulated 3D cloud (25 cm) results in a 20° shift in FOE; at the screen depth of 35 cm, the shift is 33° and for any plane beyond 45 cm (45–125 cm), the FOE is undefined as the optic flow is dominated by rotations.
Figure 2 with 1 supplement
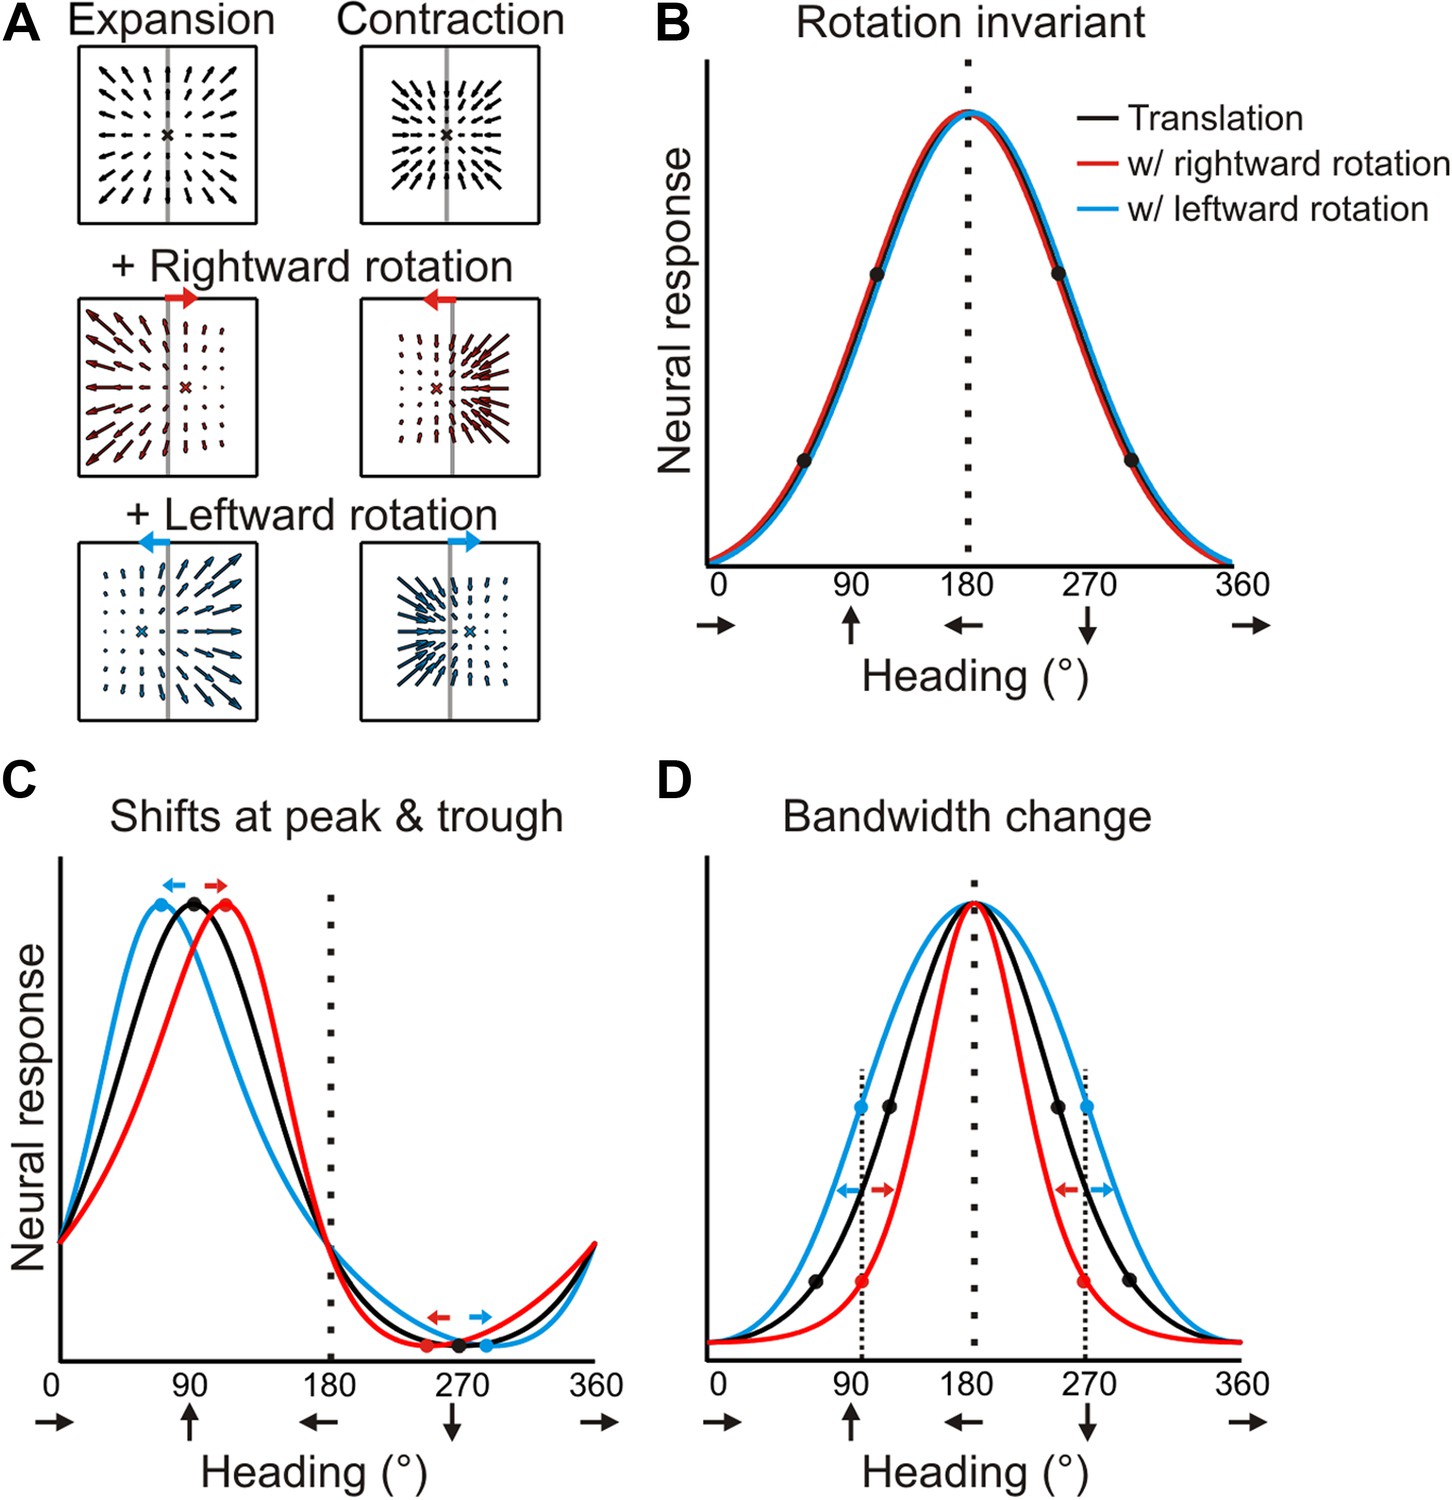
Predicted transformations of heading tuning curves due to rotations.
(A) Forward and backward translations result in expansion and contraction flow fields, respectively (row 1). Adding rotation causes the FOE to shift in opposite directions for forward and backward translations (rows 2, 3). (B, C, D) Hypothetical heading tuning curves showing the predicted transformations due to rotations (rightward, red; leftward, blue). (B) Schematic illustration of rotation-invariant heading tuning curves. (C) Schematic representing a cell that responds to resultant optic flow (no rotation tolerance) with a heading preference of straight ahead (90°). Rightward rotation causes a rightward shift of the tuning curve for forward headings (around 90°), and a leftward shift for backward headings (around 270°). The opposite pattern holds for leftward rotations. Here, the net result of rotation is a skewing of the tuning curve. (D) Schematic tuning of a cell with a leftward heading preference (180°) and no rotation tolerance. In this case, the tuning bandwidth increases for leftward rotations and decreases for rightward rotations. The opposite bandwidth changes would be observed for a cell with a 0° heading preference (see Figure 2—figure supplement 1).
Figure 2—figure supplement 1
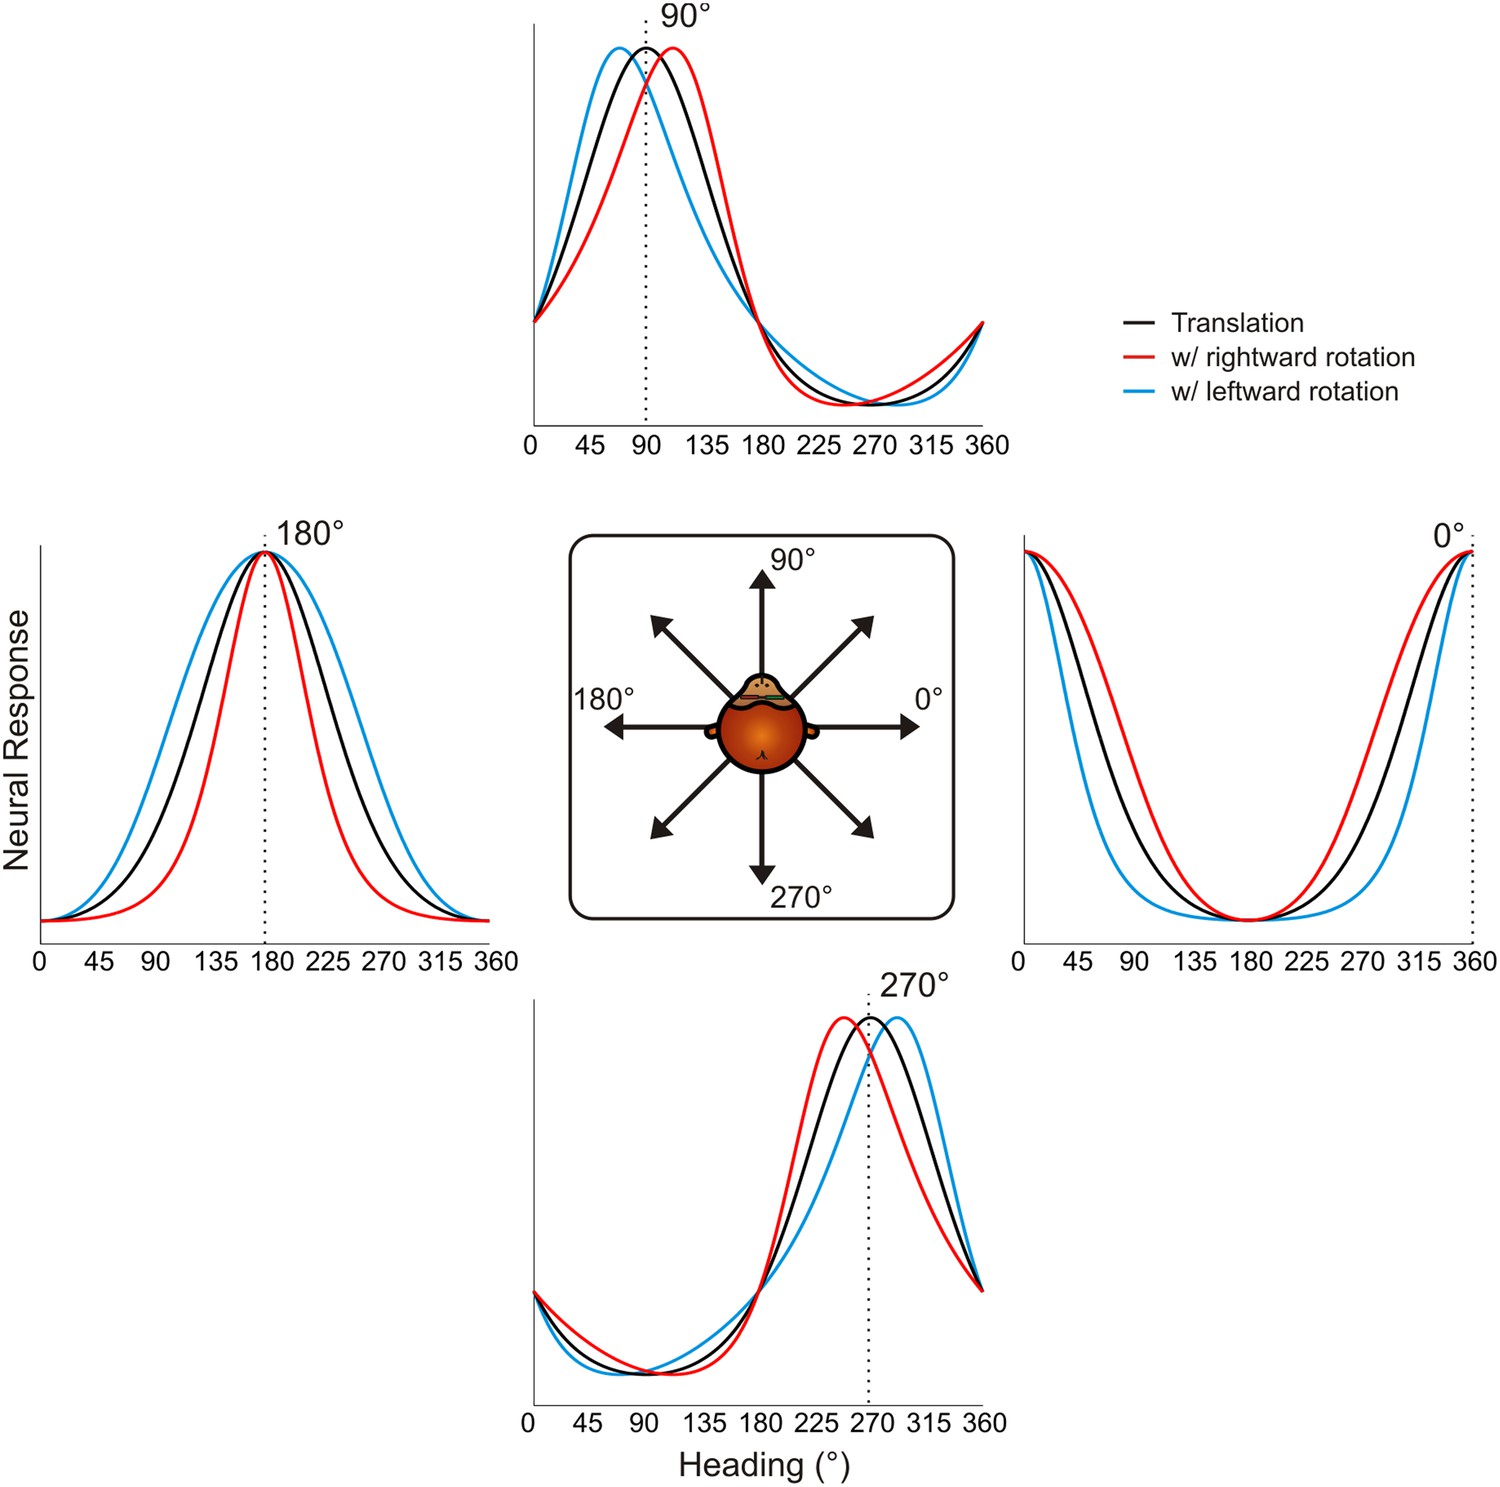
Schematic showing tuning curve transformations for hypothetical neurons with different heading preferences.
For cells that prefer lateral headings (0°, 180°), rotations (rightward: red, leftward: blue) cause changes in tuning bandwidth. The expected change in bandwidth is opposite for cells preferring 0° and 180°. For cells preferring forward or backward motion, rotations cause opposite directions of shifts in the peak and trough of the tuning curve, thus changing the shape of the tuning curve.
Figure 3 with 2 supplements
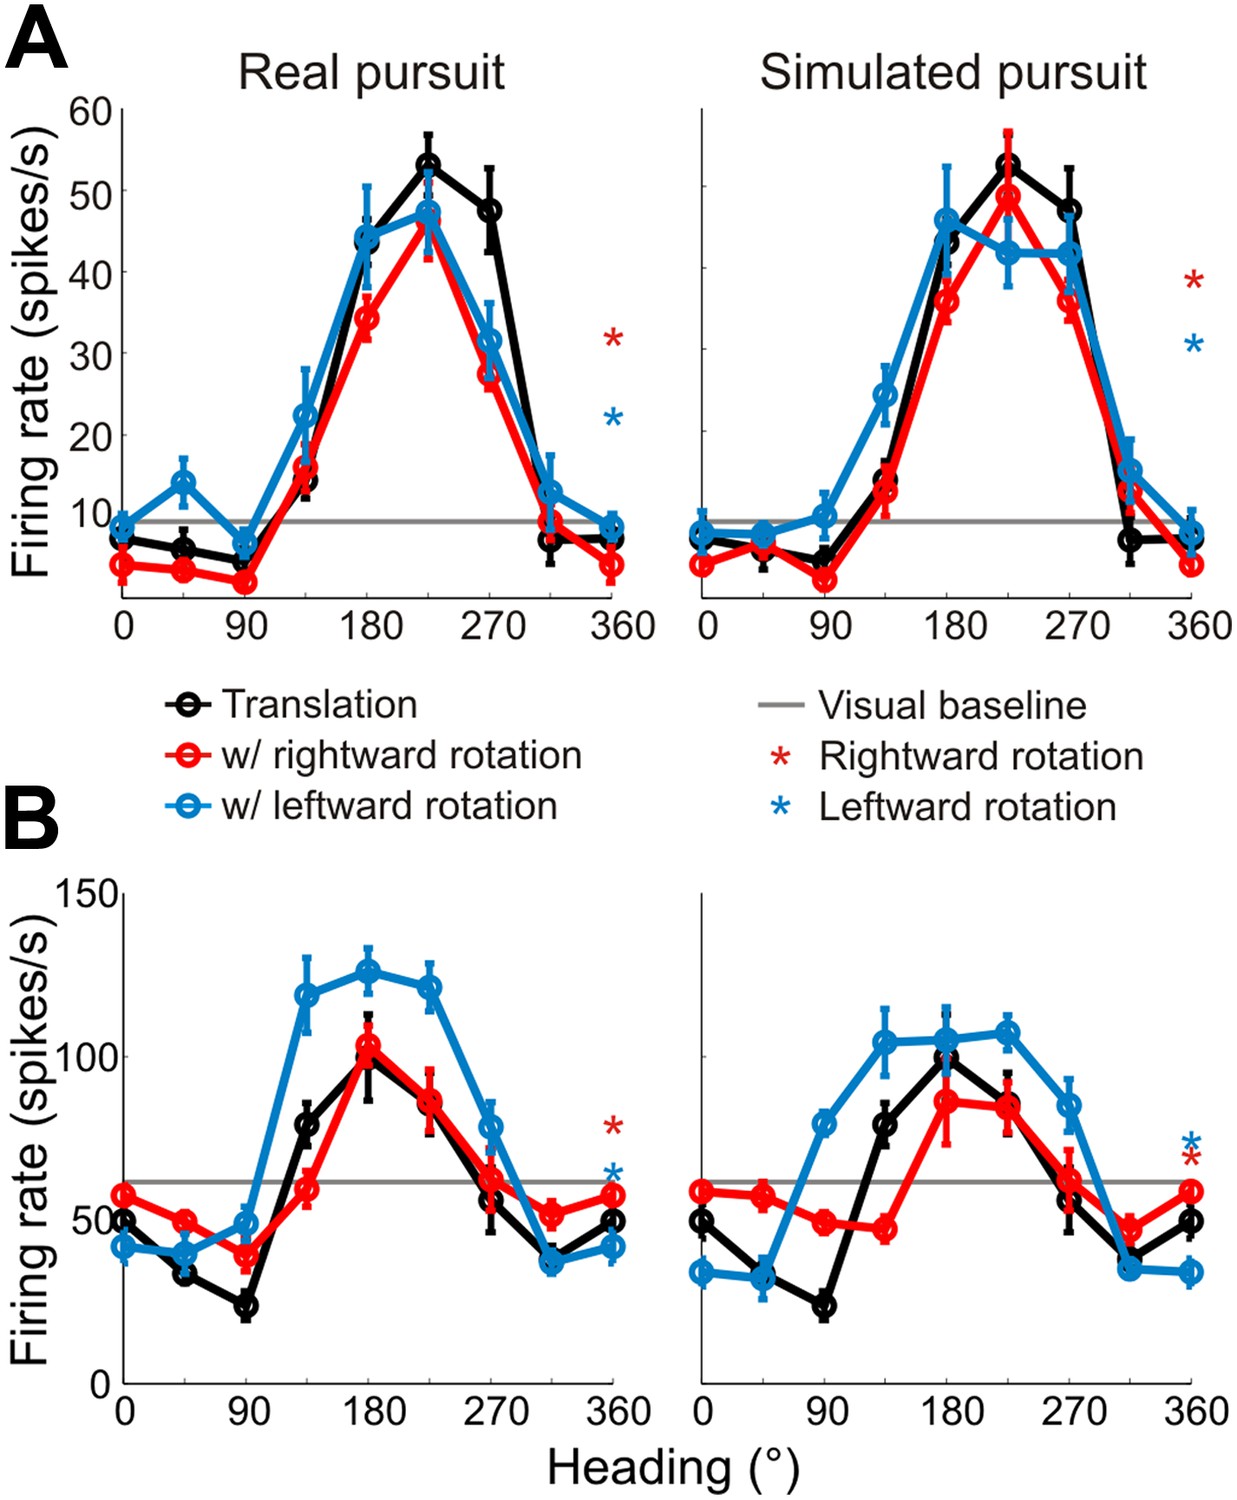
Heading tuning curves from two example VIP neurons.
Five tuning curves were obtained per cell: one pure translation curve (black), two real pursuit (RP, left column) curves, and two simulated pursuit (SP, right column) curves (rightward rotation: red, leftward rotation: blue). Black horizontal line indicates baseline activity. Red and blue stars in the left column (RP) indicate responses during pursuit in darkness, and in the right column (SP) indicate responses to simulated eye rotation. (A) This neuron has largely rotation-invariant tuning curves in both RP and SP conditions (shifts not significantly different from 0, CI from bootstrap), and has significant rotation responses during both pursuit in darkness and simulated rotation (compared to baseline; Wilcoxon signed rank test p < 0.05). (B) This example neuron shows significant bandwidth changes during SP (shifts >0°, CI from bootstrap), similar to the prediction of Figure 2D. Of the rotation-only conditions, the cell only responds significantly during rightward pursuit in darkness (Wilcoxon signed-rank test p = 0.01).
Figure 3—figure supplement 1

Bandwidth changes observed in data.
Bandwidths of linearly interpolated tuning curves were calculated as the full width at half height (FWHH). The difference in FWHH between the pure translation and rotation-added tuning curves (reds: rightward, blues: leftward rotation) are plotted for cells with lateral heading preferences (since the largest bandwidth changes would occur for cells preferring lateral motion). The bandwidth changes observed are in the directions predicted by Figure 2 and Figure 2—figure supplement 1. The change in bandwidths at 0° and 180° headings are significantly different for both RP (Wilcoxon rank sum test; leftward, rightward: p < 0.001) and SP (Wilcoxon rank sum test; leftward, rightward: p < 0.001) conditions.
Figure 3—figure supplement 2
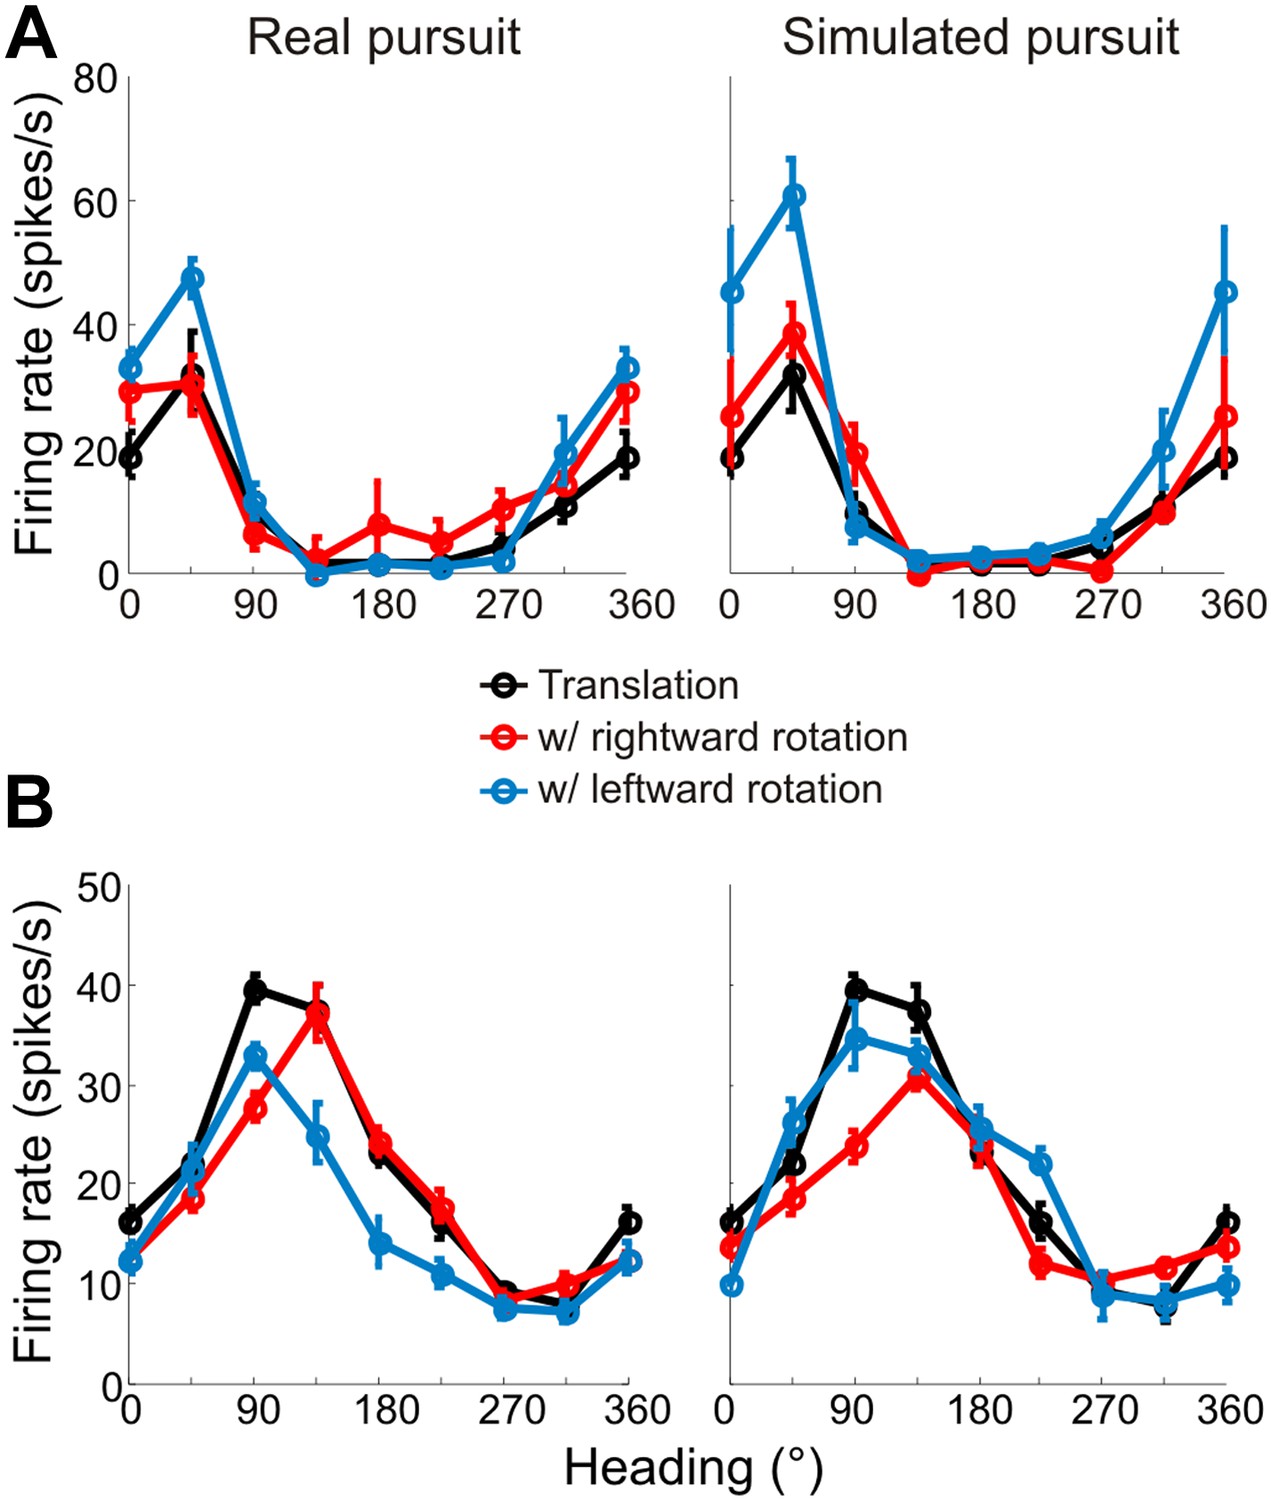
Heading tuning curves from two example VIP neurons that preferred forward headings.
Tuning curves are measured and represented as in Figure 3. (A) This neuron has tuning that is largely invariant to rotations during both real and simulated pursuit. (B) This example neuron shows significant shifts in the tuning peak during both RP and SP. Since this neuron prefers forward translations, the shifts observed are similar to the predictions made in Figure 2C.
Figure 4 with 2 supplements
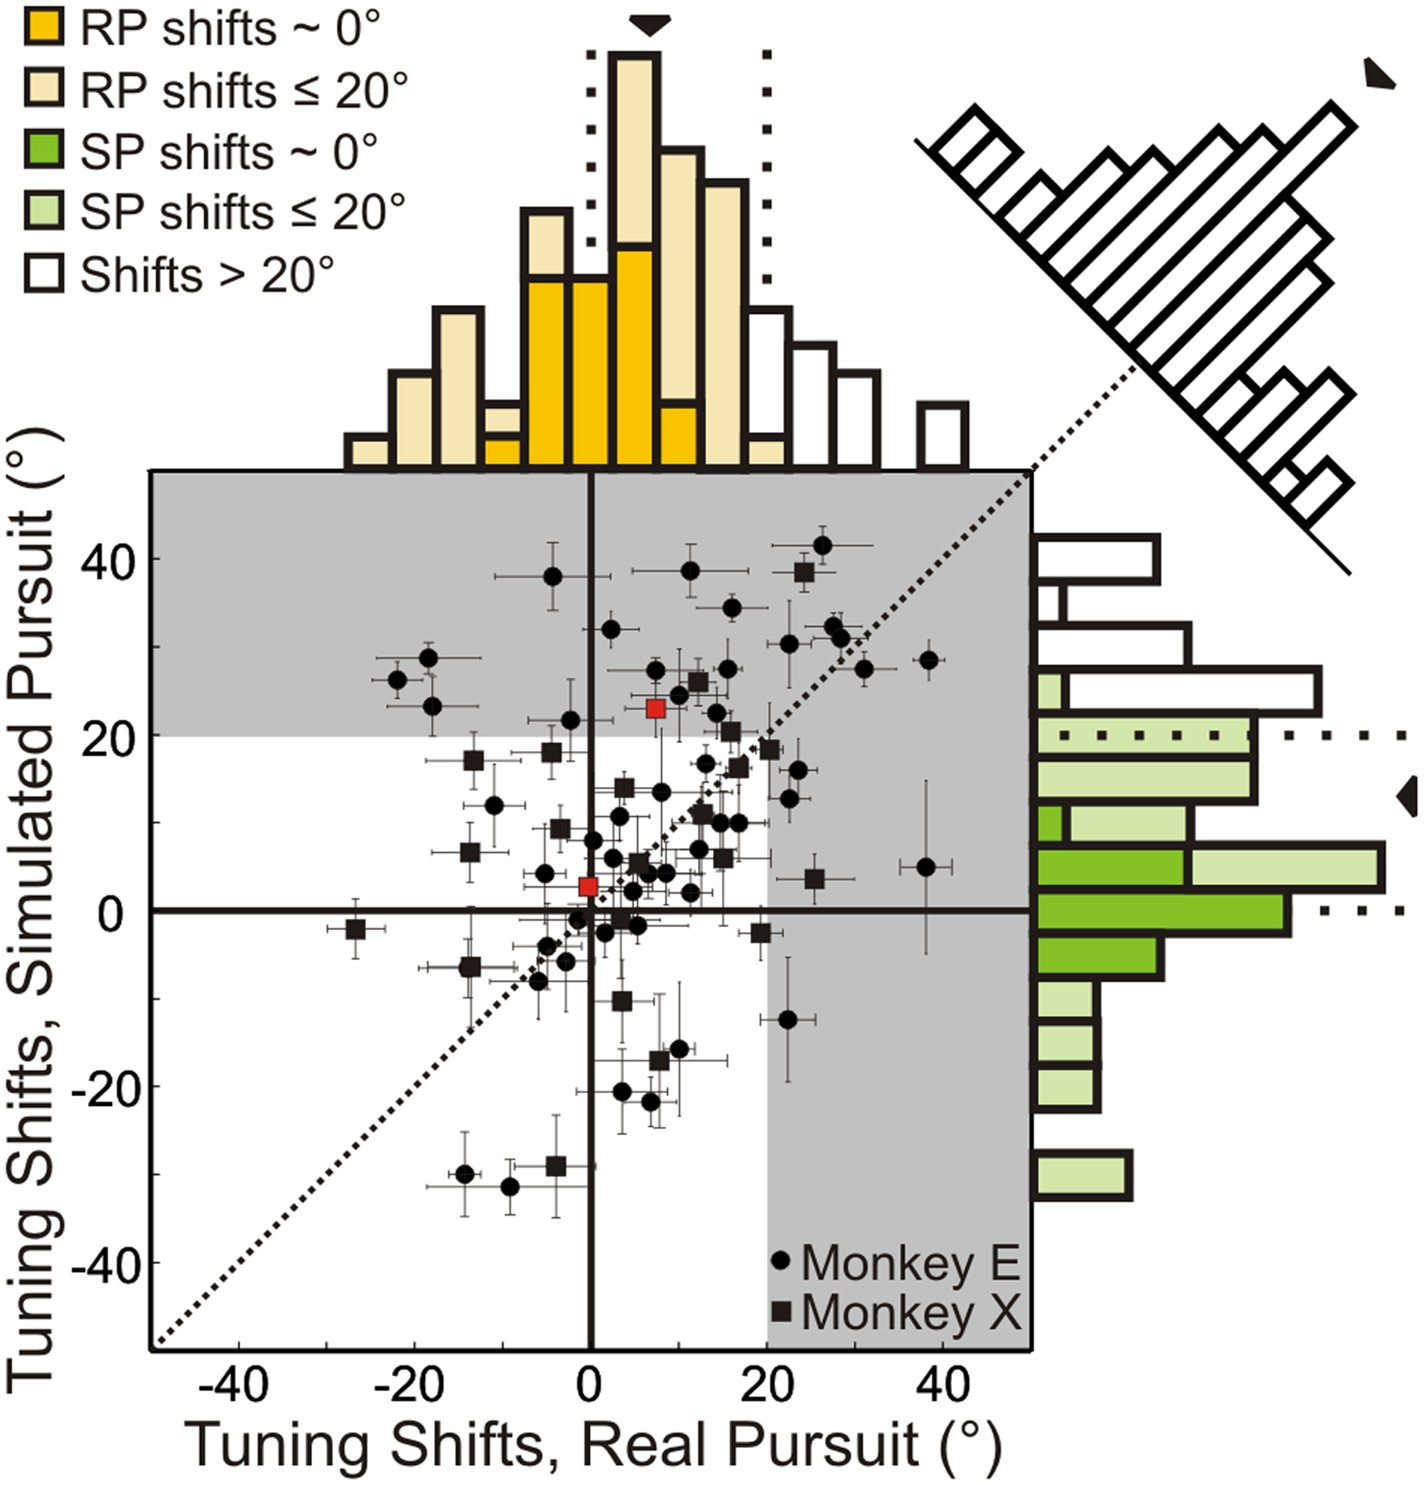
Scatterplot and marginal distributions of shifts measured during real pursuit (RP) and simulated pursuit (SP) using 3D cloud stimuli (n = 72 cells).
A shift of 0° indicates rotation-invariance. Positive and negative shifts indicate under-compensation and over-compensation for rotation, respectively. Grey shaded area corresponds to shifts >20° (conservative estimate of shift for cells with no tolerance to rotations). Red data points correspond to the shifts associated with the example cells shown in Figure 3. Error bars depict bootstrapped 95% confidence intervals (CI). Colored regions of marginal distributions indicate shifts ≤20°. Darker colors indicate shifts not significantly different from 0°. Uncolored histograms indicate shifts significantly >20°. Diagonal histogram shows difference in RP and SP shifts for each neuron with a median of −6.0° indicating that for most cells SP shifts tended to be larger than RP shifts (significantly <0°; Wilcoxon signed-rank test p = 0.02).
Figure 4—figure supplement 1
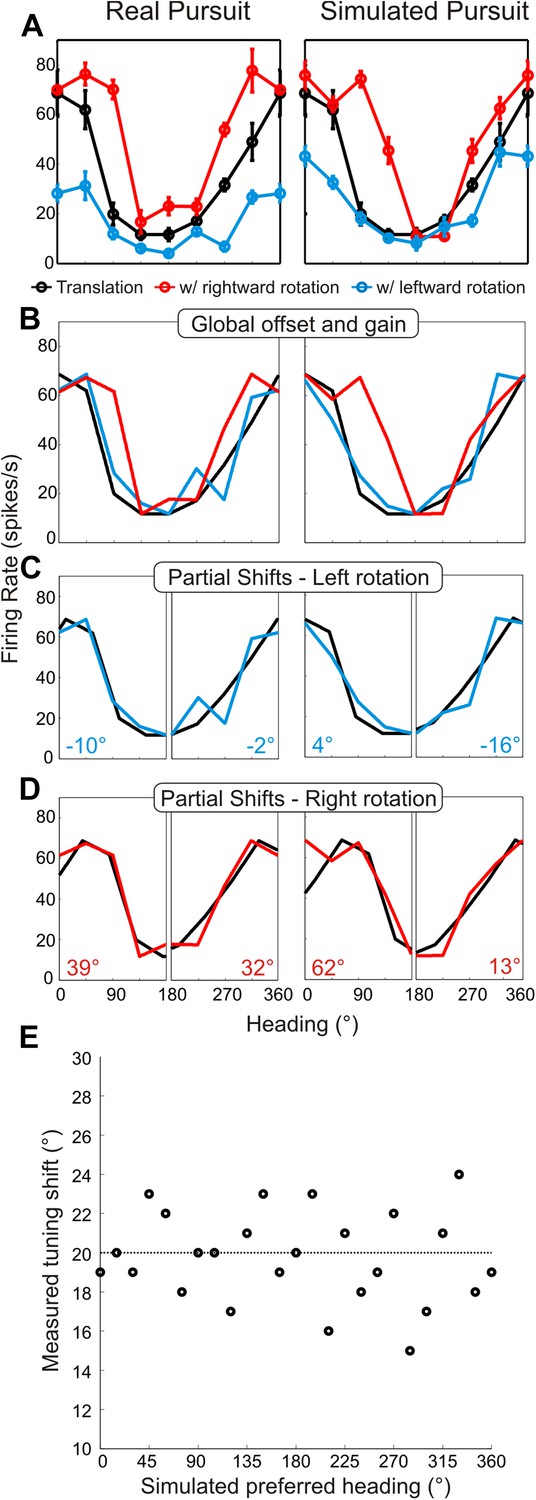
Method for analyzing tuning curve shifts.
(A) Example tuning curves of a single neuron for RP and SP conditions. Black–pure translation; red–rightward rotation; blue–leftward rotation. (B) First, the offset and gain of the RP/SP tuning curves are corrected to match the offset and gain values of the pure translation tuning curve. (C, D) To account for bandwidth changes in the shift calculations, the RP/SP tuning curves are split into halves corresponding to forward (0:180°) and backward (180:360°) headings. The pure translation tuning curve is then circularly shifted to minimize the sum squared error with each half of the leftward rotation (C) and rightward rotation tuning curves (D). This yields four shift values (shown in C, D) each, for SP and RP, which are averaged. (E) We simulated noisy neuronal tuning curves that have different response amplitudes, offsets and bandwidth/shape changes similar to real data (see ‘Materials and methods’). The expected shifts for the simulated data should correspond to 20°. The mean shifts (based on 10 repetitions) were not significantly different from 20° (t-test; p = 1), indicating that our analysis method correctly extracts tuning curve changes despite variations in shape, response amplitude, or baseline response.
Figure 4—figure supplement 2
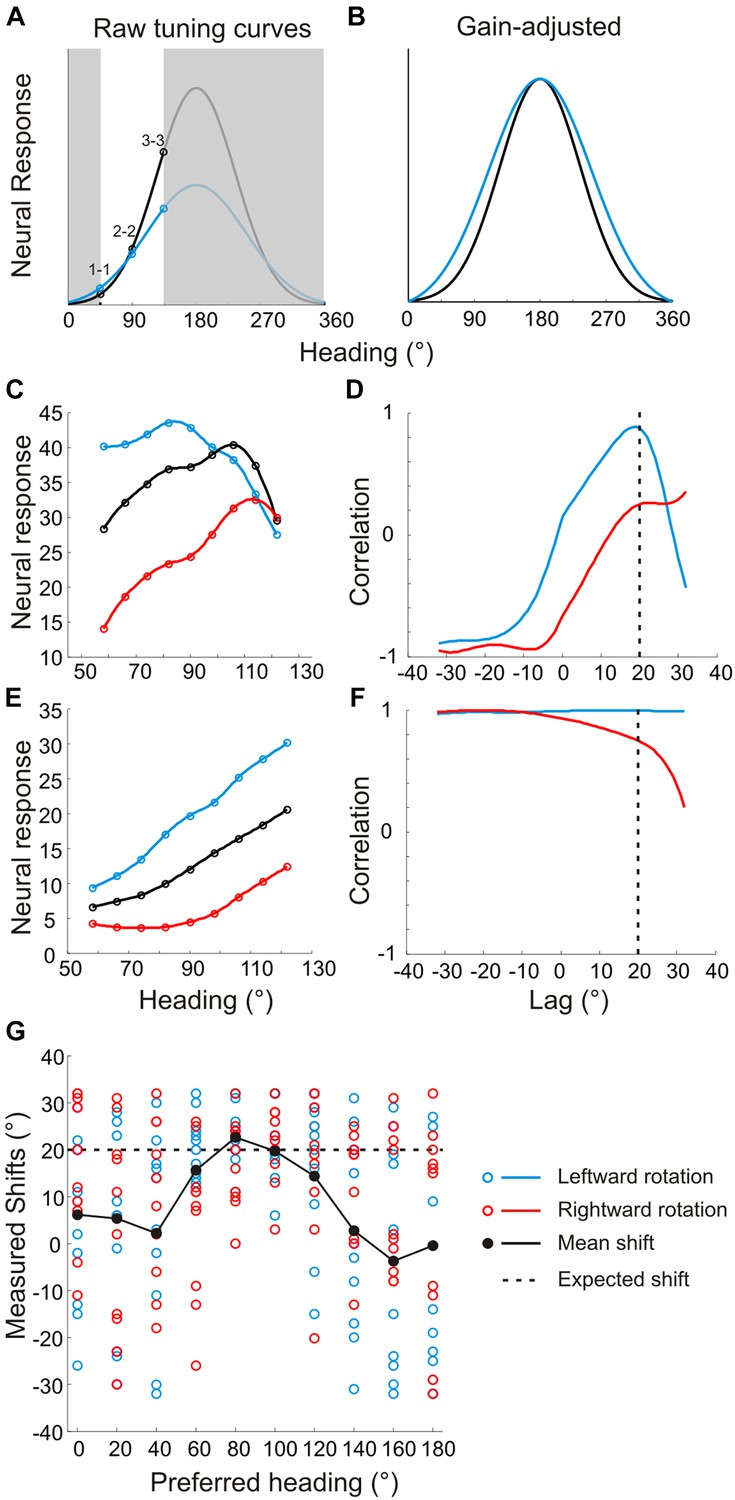
Problems with previous approaches to measuring shifts in the absence of full tuning curve measurements.
Previous studies (Bradley et al., 1996; Shenoy et al., 1999; Shenoy et al., 2002; Bremmer et al., 2010; Kaminiarz et al., 2014) evaluated heading tuning curves in a narrow range around straight ahead (white region around 90° in panel A). (A) Two hypothetical tuning curves with different bandwidths and amplitudes. (B) Correcting for the difference in response amplitudes reveals a clear difference in bandwidths, which may reflect a lack of compensation for rotation. The rank order of the responses (1–1, 2–2, 3–3) would be identical for the two curves, which previous methods would erroneously interpret as evidence for rotation-invariance (Bremmer et al., 2010; Kaminiarz et al., 2014). (C) Simulated tuning curves with peaks roughly near straight ahead. The underlying von Mises functions (to which Poisson noise was added) have peaks at headings of 80°, 100° and 120°, resulting in a simulated shift of 20°. (D) The cross-correlation function between the translation only (black) and rotation-added (red—leftward rotation, blue—rightward rotation) tuning curves. Reflecting the true shift of 20° that was introduced into the tuning curves (before noise was added), the cross-correlation functions peak near a lag of +20°. (E) Simulated tuning curves with peaks at 180° and different bandwidths. The difference in the width of the full tuning curves corresponded to a 20° shift (at half-height). (F) Cross-correlation functions for the simulated neurons with lateral heading preferences are quite flat and show no evidence of a peak near a lag of +20°. (G) Shifts from 10 sets of simulated tuning curves (with different noise samples) were measured using cross-correlation for heading preferences ranging from 0° to 180°. The gain and offsets of the tuning curves were randomized for each set. The mean shift (black markers) approaches the true shift (20°, dashed line) for tuning curves with heading preferences near 90°, but the mean shifts are grossly inaccurate for simulated neurons with lateral heading preferences. In contrast, Figure 4–figure supplement 1E shows that our analysis method correctly estimates tuning curve shifts regardless of heading preference.
Figure 5

Neural responses to pure rotation stimuli.
(A) Scatterplot and marginal distributions of baseline-subtracted rotation responses. The monkey either pursued a target across a dark screen (pursuit in darkness) or fixated centrally as rotation was simulated in the 3D dot cloud (simulated rotation). Filled marginal distributions indicate significant rotation responses compared to baseline (t-test, p ≤ 0.05). Red and blue symbols denote rightward and leftward rotations, respectively. (B) Scatterplot of differences between leftward and rightward rotation responses. Filled marginal distributions indicate significant differences between leftward and rightward rotation responses (t-test, p ≤ 0.05).
Figure 6

Role of dynamic perspective cues in signaling rotation-invariant heading.
(A) Optic flow fields during combined translation and rotation at two different depth planes have different FOE shifts. The dotted circle indicates true heading. Subtracting these flow fields yields a motion parallax field that eliminates the rotational component and the point of zero local motion parallax corresponds to the true heading. (B) Rotational optic flow can be decomposed into laminar flow and dynamic perspective cues. Dynamic perspective cues may signal eye rotations even in the absence of depth structure. (C) Scatterplot and marginal distributions of shifts measured using the fronto-parallel plane stimulus during real and simulated pursuit (n = 34 cells). Format as in Figure 4. Open and filled symbols denote data collected during binocular and monocular viewing, respectively. Errorbars denote bootstrapped 95% CIs. All filled histograms indicate shifts significantly <37°. Dark colored histogram bins indicate cells with shifts not significantly different from 0°. Uncolored bars indicate shifts ≥37°.
Figure 7
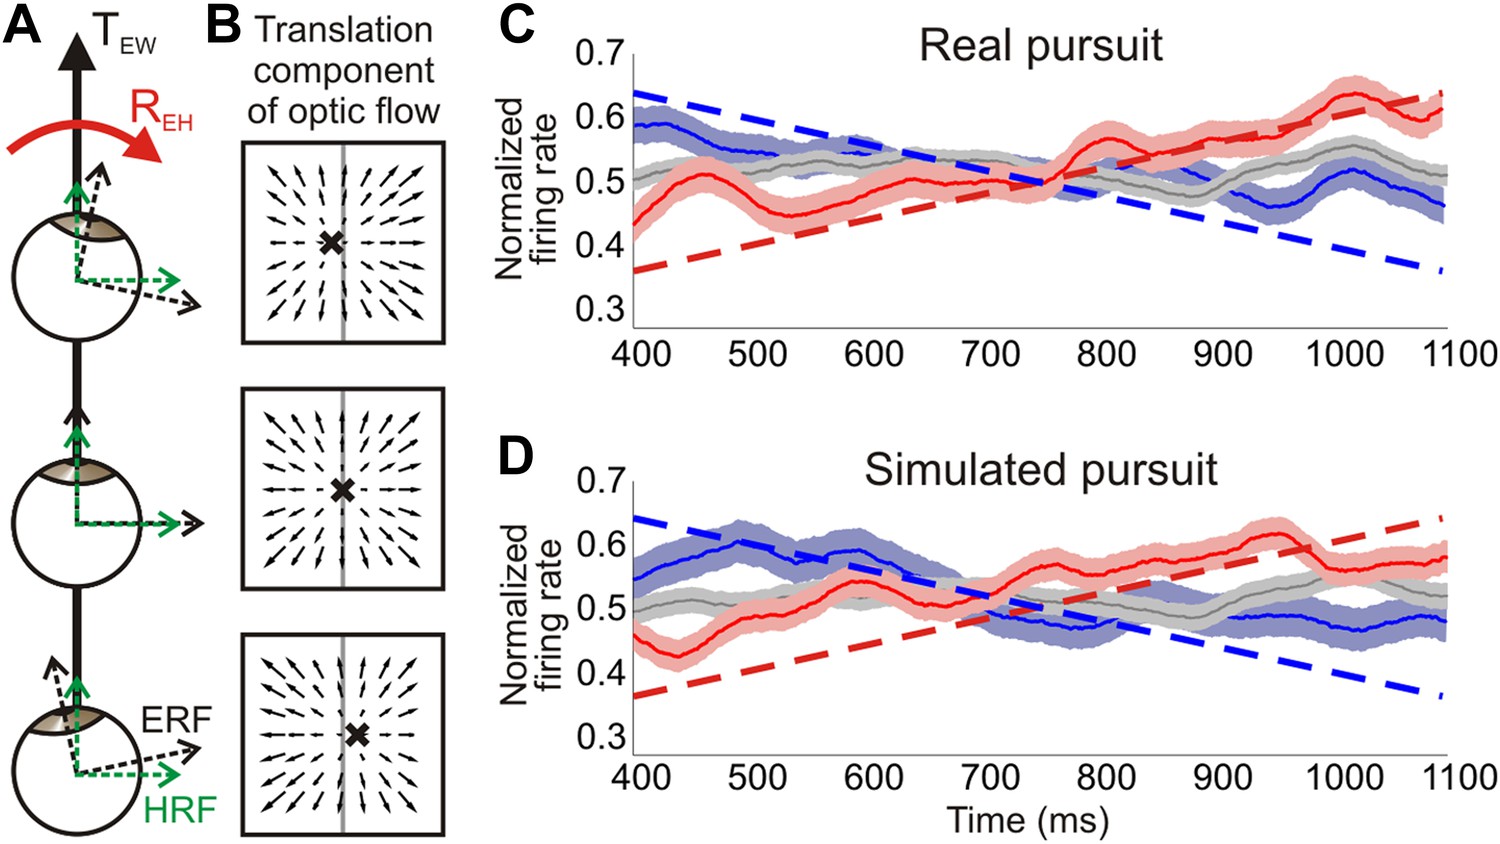
Distinguishing reference frames from rotation invariance.
(A) Schematic of a rightward eye rotation while translating forward. As the eye position changes during smooth pursuit, the eye reference frame (ERF, black axes) rotates relative to the head (REH) and the direction of translation in the world, TEW. Since the head is not rotating relative to the world, the head reference frame (HRF, green axes) remains constant with respect to the heading. (B) In retinal co-ordinates, the translation component of optic flow changes with eye position and results in a drifting FOE (x) across the retina. The translation direction represented by the FOE changes from right of straight ahead to left of straight ahead for rightward rotations. (C, D) Heading corresponding to the largest firing rate gradient was identified for each neuronal tuning curve and the temporal responses at that heading were evaluated. Dashed straight lines show the predicted population response slopes based on the assumption of an eye-centered reference frame. The population average of the normalized time course of firing rate is plotted for each condition type—translation only (grey), rightward rotation (red) and leftward rotation (blue) for real pursuit (C) and simulated pursuit (D). Shaded regions indicate standard errors. The significant positive and negative trends observed are consistent with a reference frame that is intermediate between eye- and head-centered, but closer to an eye-centered reference frame.
Additional files
-
Source code 1
Custom scripts. Custom scripts written for use with the TEMPO system (Reflective Computing, St. Louis, MO). The scripts define experiment specific parameters and the control loop determining the structure of each individual trial.
- https://doi.org/10.7554/eLife.04693.016
Download links
A two-part list of links to download the article, or parts of the article, in various formats.
Downloads (link to download the article as PDF)
Open citations (links to open the citations from this article in various online reference manager services)
Cite this article (links to download the citations from this article in formats compatible with various reference manager tools)
Role of visual and non-visual cues in constructing a rotation-invariant representation of heading in parietal cortex
eLife 4:e04693.
https://doi.org/10.7554/eLife.04693


