A genetically defined asymmetry underlies the inhibitory control of flexor–extensor locomotor movements
- Salk Institute for Biological Studies, United States
- University of Alberta, Canada
- Harvard Medical School, United States
Figures
Figure 1
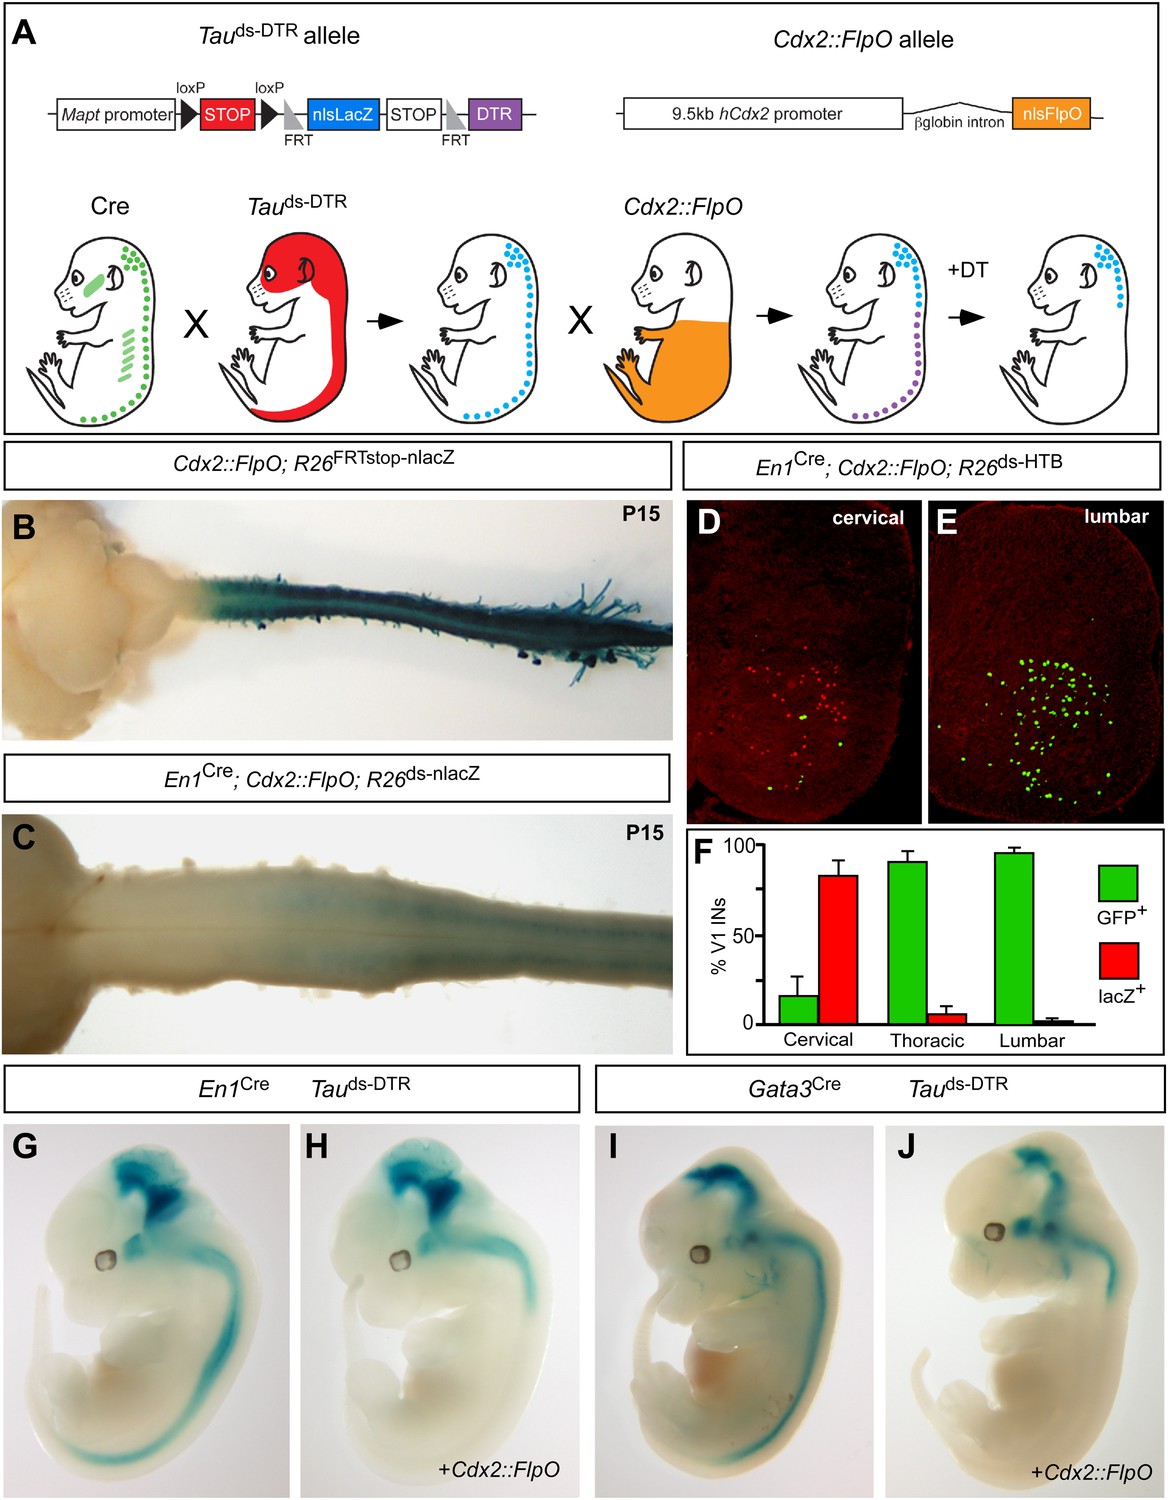
Genetic strategy for targeting DTR expression to V1 and V2b INs neurons in the caudal spinal cord.
(A) Schematic of the tripartite genetic system used to restrict diphtheria toxin receptor (DTR) expression to caudal V1 and V2b INs. The Tauds-DTR and Cdx2-FlpO alleles are shown above. Cre-mediated recombination removes the first stop cassette to activate nuclear β-galactosidase (β-gal/nlsLacZ) expression in neurons (light blue). DTR (purple) is only expressed in neurons following Cre- and FlpO-mediated excision of both stop cassettes. (B) Whole mount image of a P15 Cdx2-FlpO; R26FRTstop-nlslacZ brain and spinal cord viewed from the dorsal aspect showing β-galactosidase (β-gal) expression is restricted to the spinal cord and caudal PNS. (C) Whole mount image of the anterior spinal cord from a P15 En1Cre; Cdx2-FlpO; R26ds-lacZ mouse viewed from the ventral aspect showing expression of β-gal is restricted to caudal V1 INs and is absent at upper cervical levels and in the hindbrain. (D–F) Expression of a Cre- and FlpO-dependent GFP reporter (En1Cre; Cdx2-FlpO; R26ds-HTB) in V1 INs. Coronal sections from a En1Cre; Cdx2-FlpO; R26ds-HTB spinal cord (D, E) in which V1 INs that have undergone Cre recombination alone express β-gal (red), and V1 INs cells that have undergone both Cre and FlpO recombinations express GFP (green). FlpO recombination is fully penetrant in lumbar V1 INs (E, F). (G–J) Images from E12.5 embryos showing that the Maptds-DTR and Cdx2-FlpO alleles progressively restrict reporter gene expression to V1 and V2b INs in the caudal spinal cord. There is no β-gal expression in non-neuronal tissues. The absence of β-gal expression in the caudal CNS reflects the efficient excision of the nlsLacZ-stop cassette and expression of DTR in V1 and V2b INs.
Figure 2 with 1 supplement
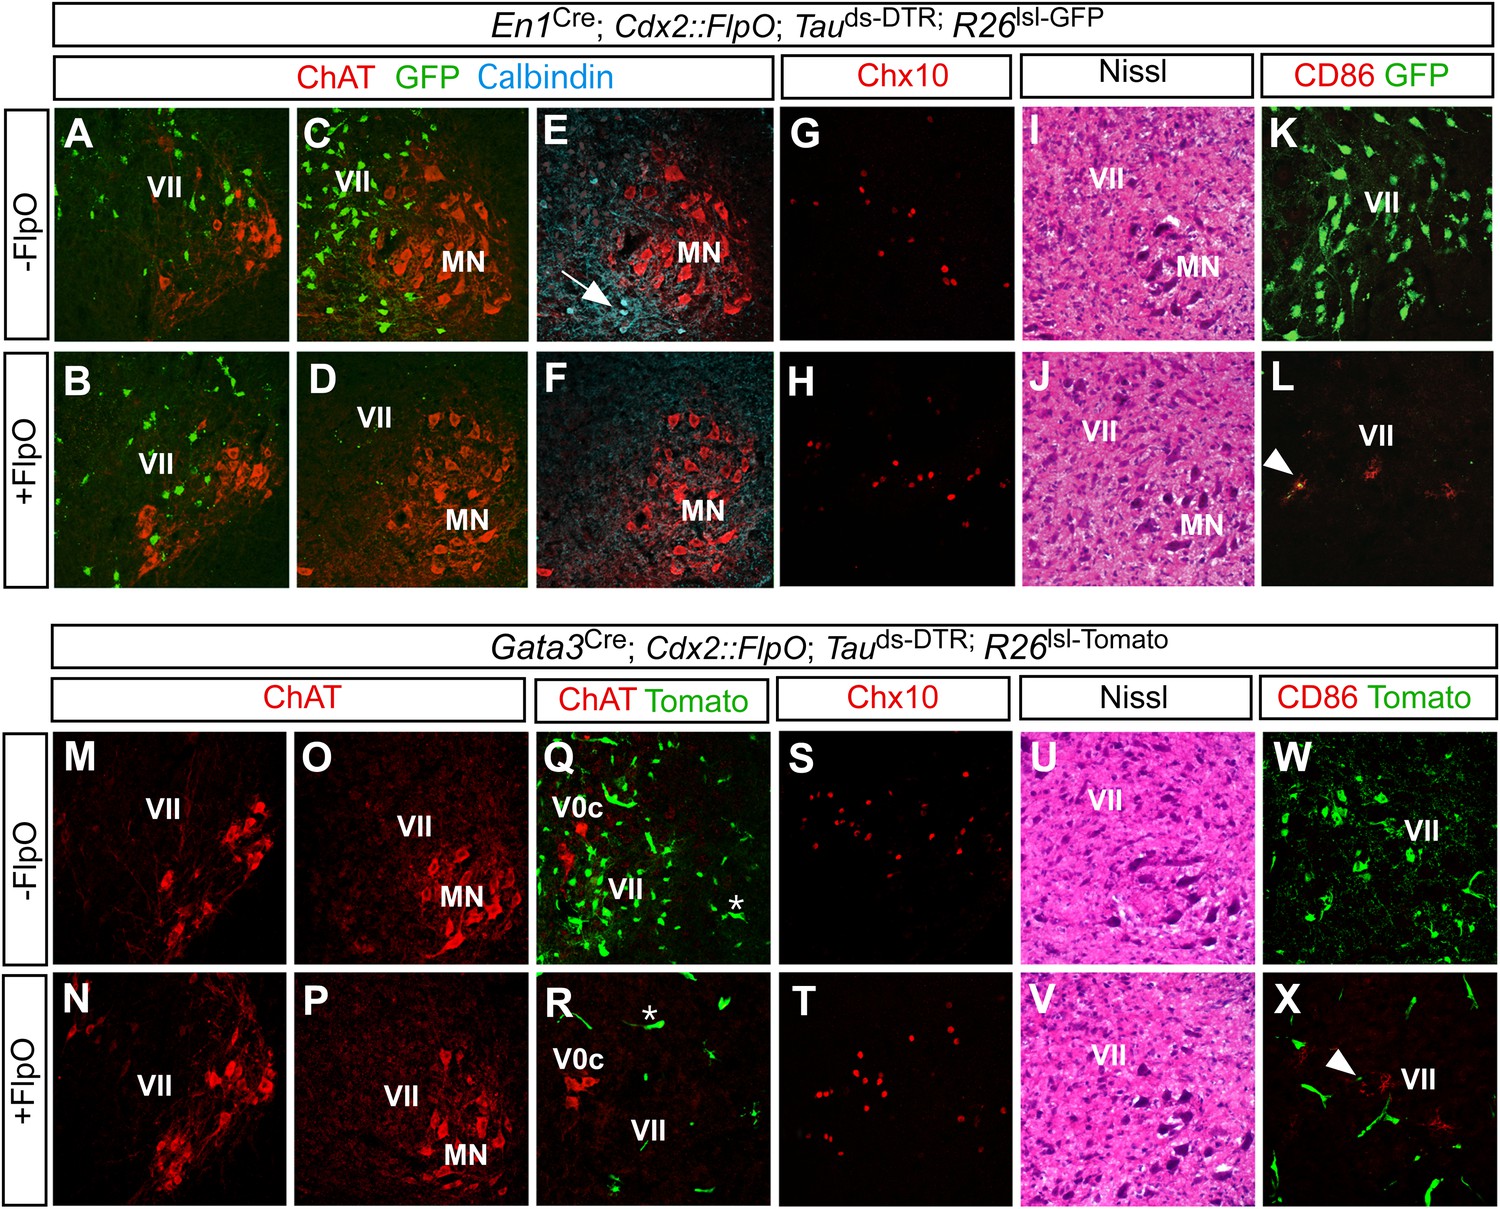
Restricted ablation of V1 and V2b INs following diphtheria toxin treatment.
Immunohistochemical and histological analysis of P7 control, En1Cre; Cdx2-FlpO; Maptds-DTR and Gata3Cre; Cdx2-FlpO; Maptds-DTR animals 6 days after administering DTX. All sections are from the mid-lumbar cord except for those in panels A, B, M, and N, which are from the cervical cord. (A–D) En1-derived V1 INs (green) are selectively ablated in the lumbar spinal cord (c.f. C, D), whereas ChAT+ motor neurons (red) are spared at lumbar (D) and cervical levels (B). (E, H) Calbindin+ Renshaw cells (blue) are present in control cords (E, arrow) but not in V1 IN-ablated cords (F). (G, H) Chx10+ V2a INs are present in normal numbers following V1 IN-ablation. (I, J) Hematoxylin-eosin staining reveals no evidence of widespread neuronal cell loss or gliosis. (K, L) CD86+ microglia were occasionally observed in close proximity to V1 cell debris (arrowhead). (M–P) Motor neurons are spared at both cervical (M, N) and lumbar (O, P) levels following ablation of the V2b INs. (Q, R) V2b INs (green) are specifically deleted in V2b IN-ablated mice (R) while V0c neurons (red) are spared. (S, T) Chx10+ V2a INs are present in normal numbers following V2b IN-ablation. (U, V) Hematoxylin-eosin staining. (W, X) Localized CD86 expression (red) in lamina VII is associated with dying V2b INs (green).
Figure 2—figure supplement 1
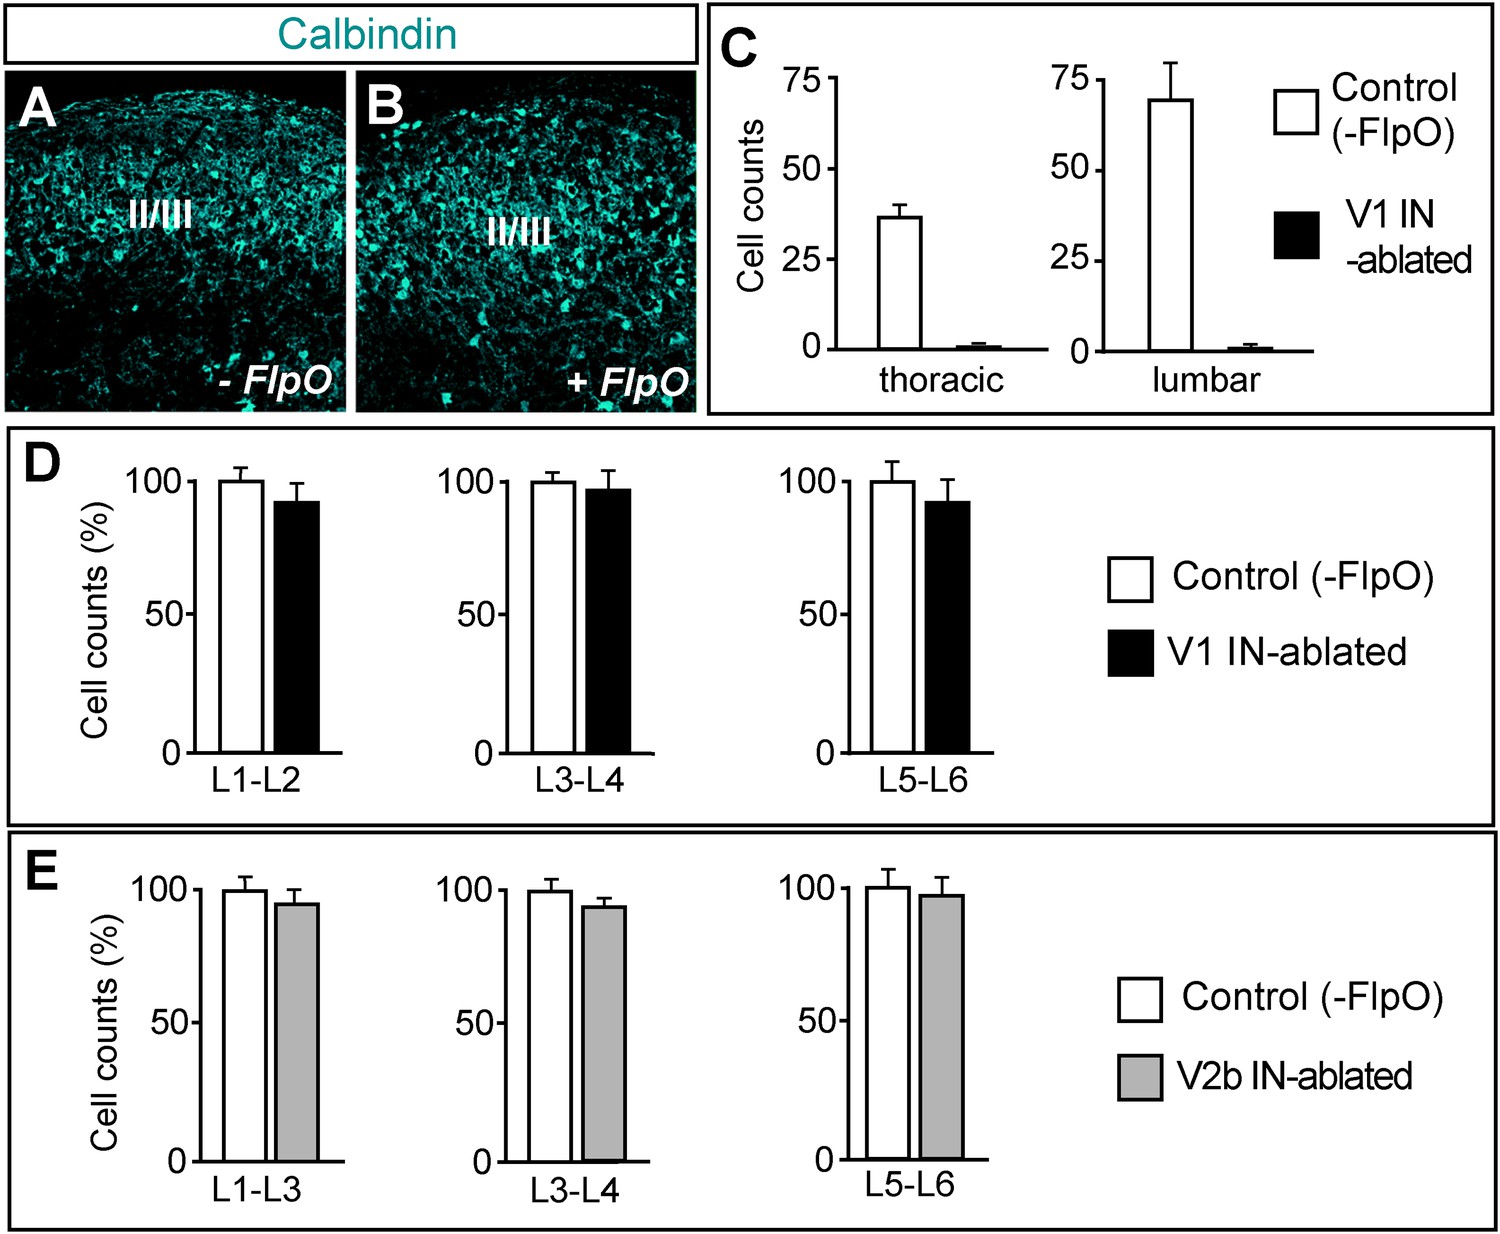
Selective ablation of ventral calbindin-expressing neurons.
(A, B) Expression of calbindin in the dorsal spinal cord of P7 control (A) and V1 IN-ablated mice (B). (C) V1 IN cell numbers per hemisection at thoracic and lumbar levels (n = 15 sections [30 μm] from 3 spinal cords each for control and V1 IN-ablated mice). (D, E) Counts of neurons in the lumbar spinal cord of P7 DTX-treated mice (6 days p.i.). Cell counts at the indicated levels were expressed as a percentage of comparable counts for control sections (n = 12 sections [30 μm] for control), V1 IN-ablated and V2b IN-ablated mice (n = 3 cords for each genotype). Data are expressed as mean ± s.d.
Figure 3
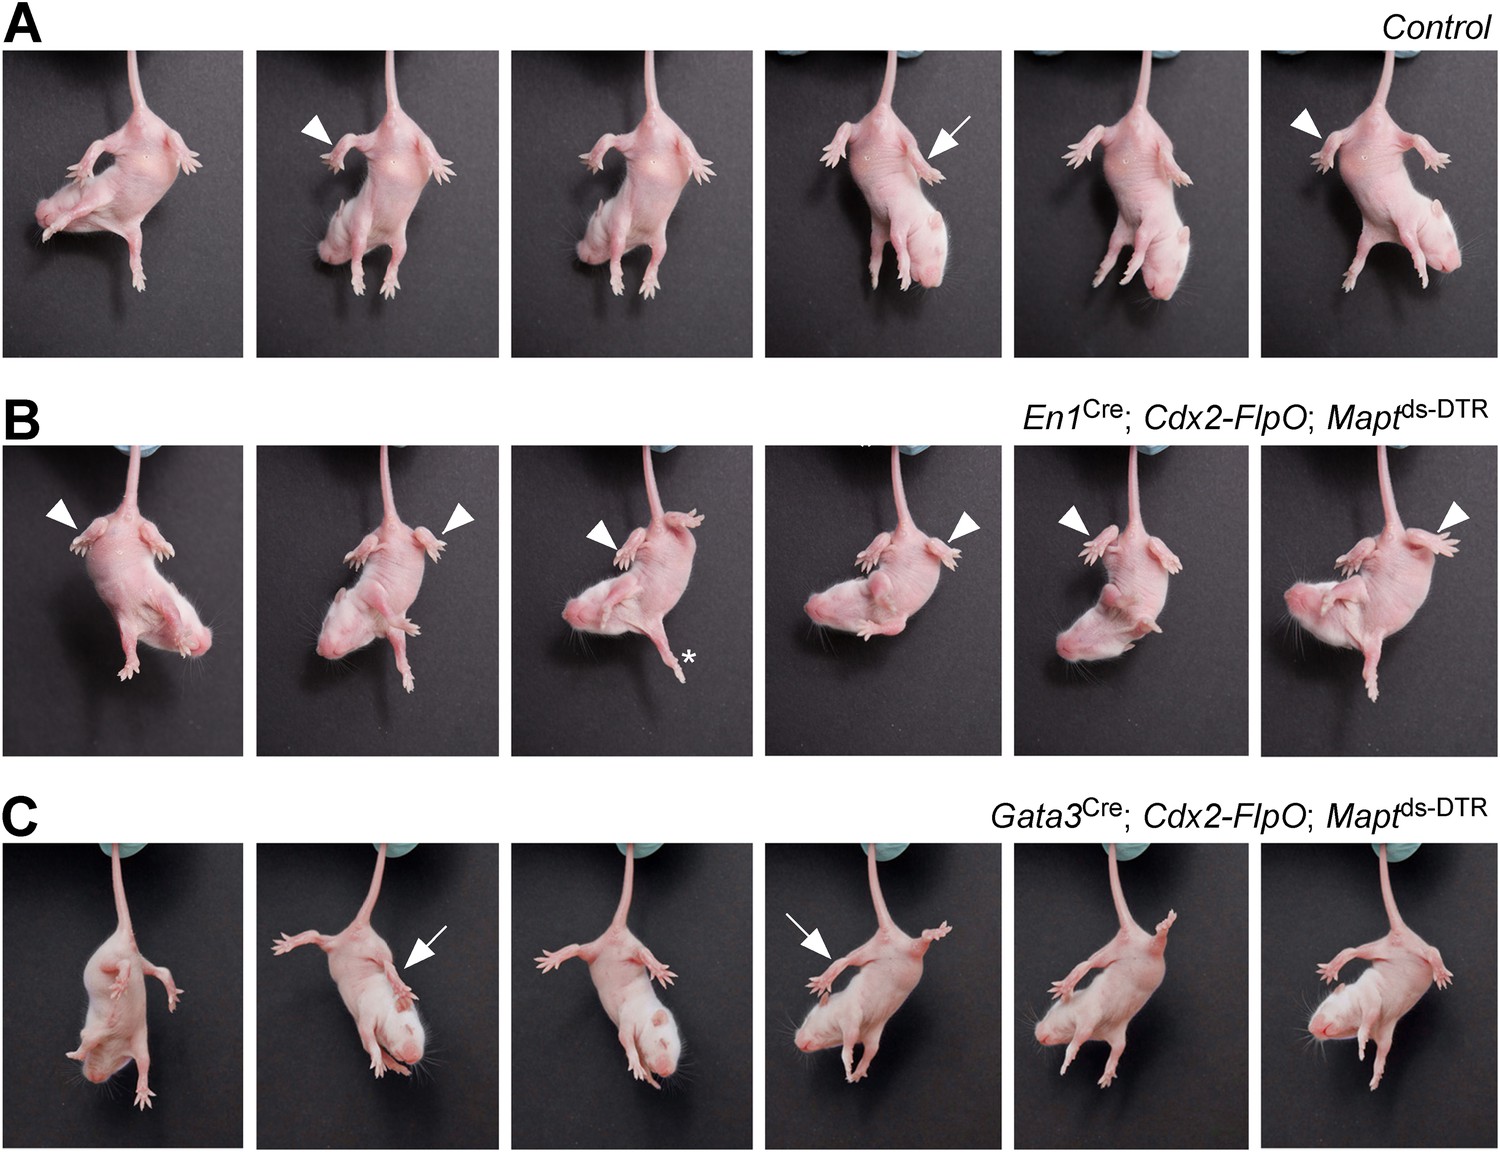
Mice lacking V1 and V2b INs show abnormal hindlimb movements.
Time-lapse sequence images showing the hindlimb movements of P7 mice suspended by their tails. Mice were photographed 4 days after DTX treatment. The genotypes of the mice are indicated. Control mice were littermates that lacked the Cdx2-FlpO allele. (A) Control mice are able to flex (arrowheads) and extend (arrow) their hindlimbs when suspended by their tail. (B) Following the ablation of V1 INs, P7 mice lose their ability to extend their hindlimbs, which remain clasped to the body in a flexed position (arrowheads). The forelimbs of these mice are able to undergo extension movements (asterisk). (C) Ablation of V2b INs leads to pronounced extension of the hindlimbs (arrows) and impairment of hindlimb flexion movements.
Figure 4
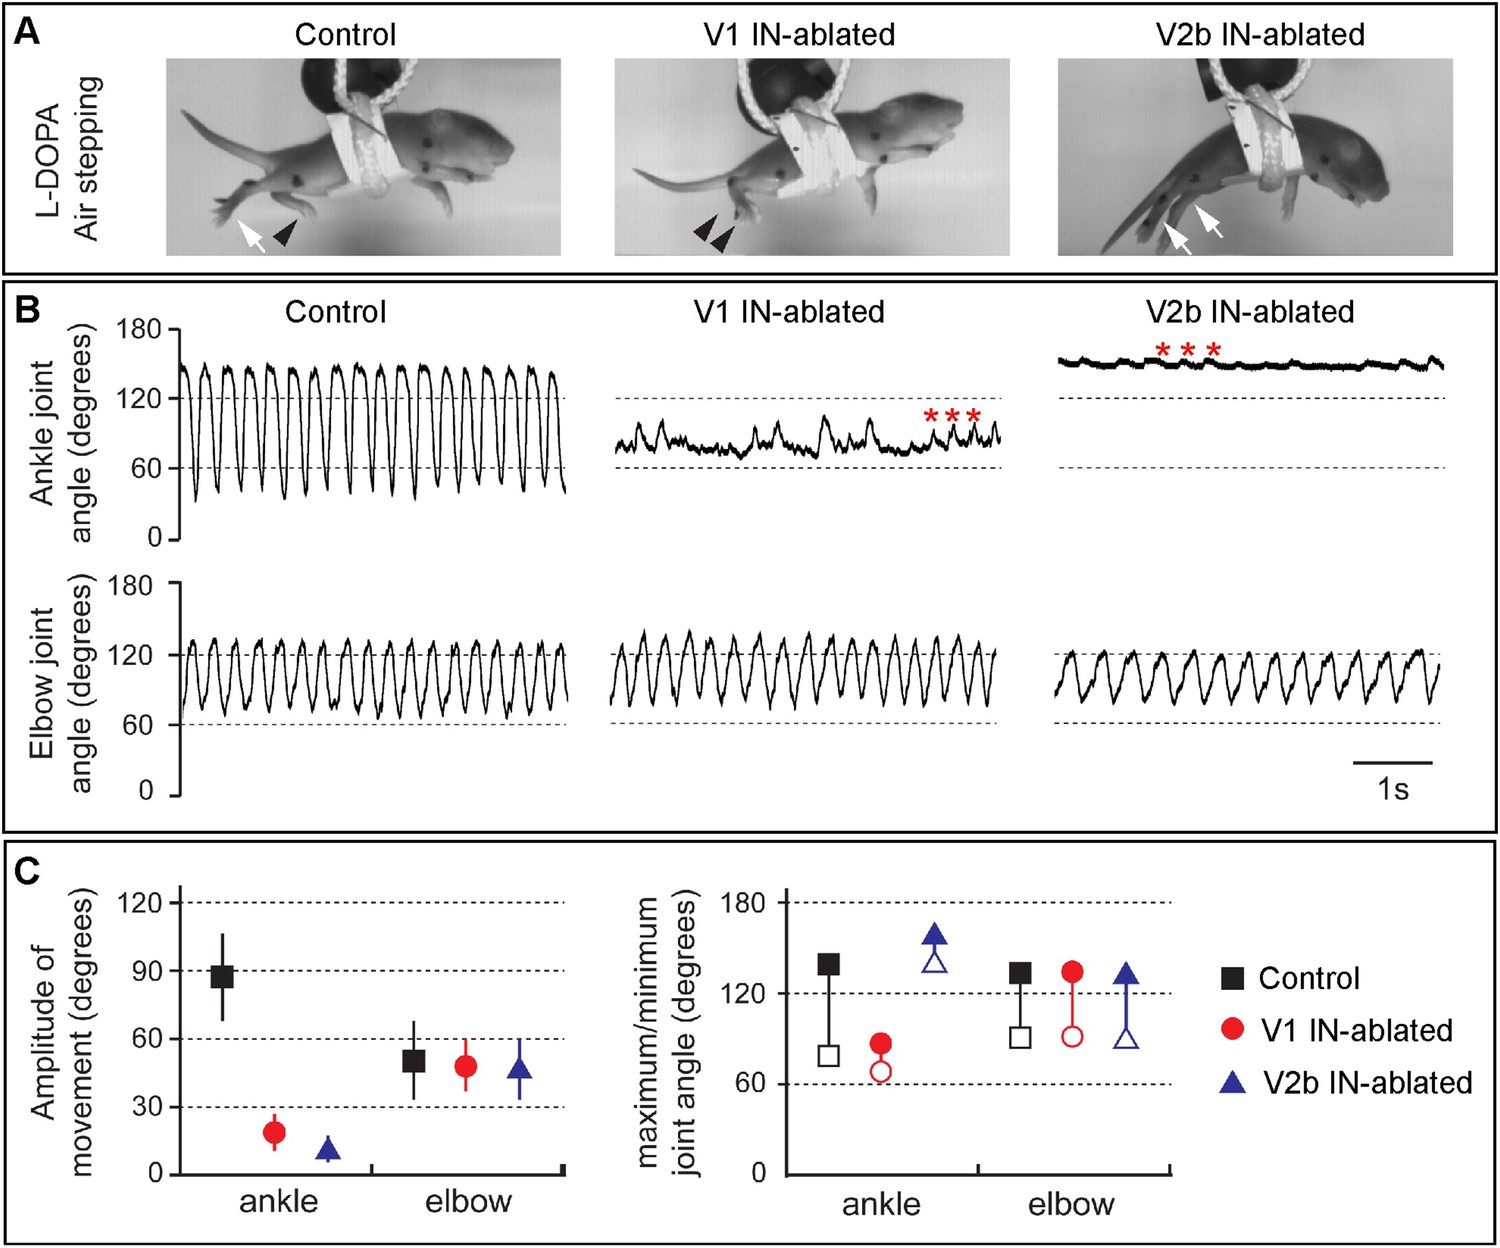
Juvenile mice lacking V1 and V2b INs display abnormal hindlimb movements.
(A) Images of airstepping P7 animals following DTX injection. Flexed limbs are depicted with black arrowheads and extended limbs with white arrows. Control animals (left) flex and extend their hindlimbs. The hindlimbs of V1 IN-ablated animals (middle) remain flexed and those of V2b IN-ablated mice (right) are fully extended. (B) Traces showing the change in ankle (top) and elbow (bottom) joint angle during 5 s of airstepping. Deletion of V1 and V2b INs impairs movement of the ankle joint, whereas rhythmic movements are maintained for the elbow joint. Small rhythmic variations of the ankle joint angle occur in phase with movements of the elbow joint angle (asterisks). (C) Measured changes in joint movement showing the amplitude change (left), the maximal joint angle (filled symbol) and the minimal joint angle (open symbol) joint angle (right). The mean and s.d. is shown for 24 consecutive steps (n = 3 animals for each genotype).
Figure 5
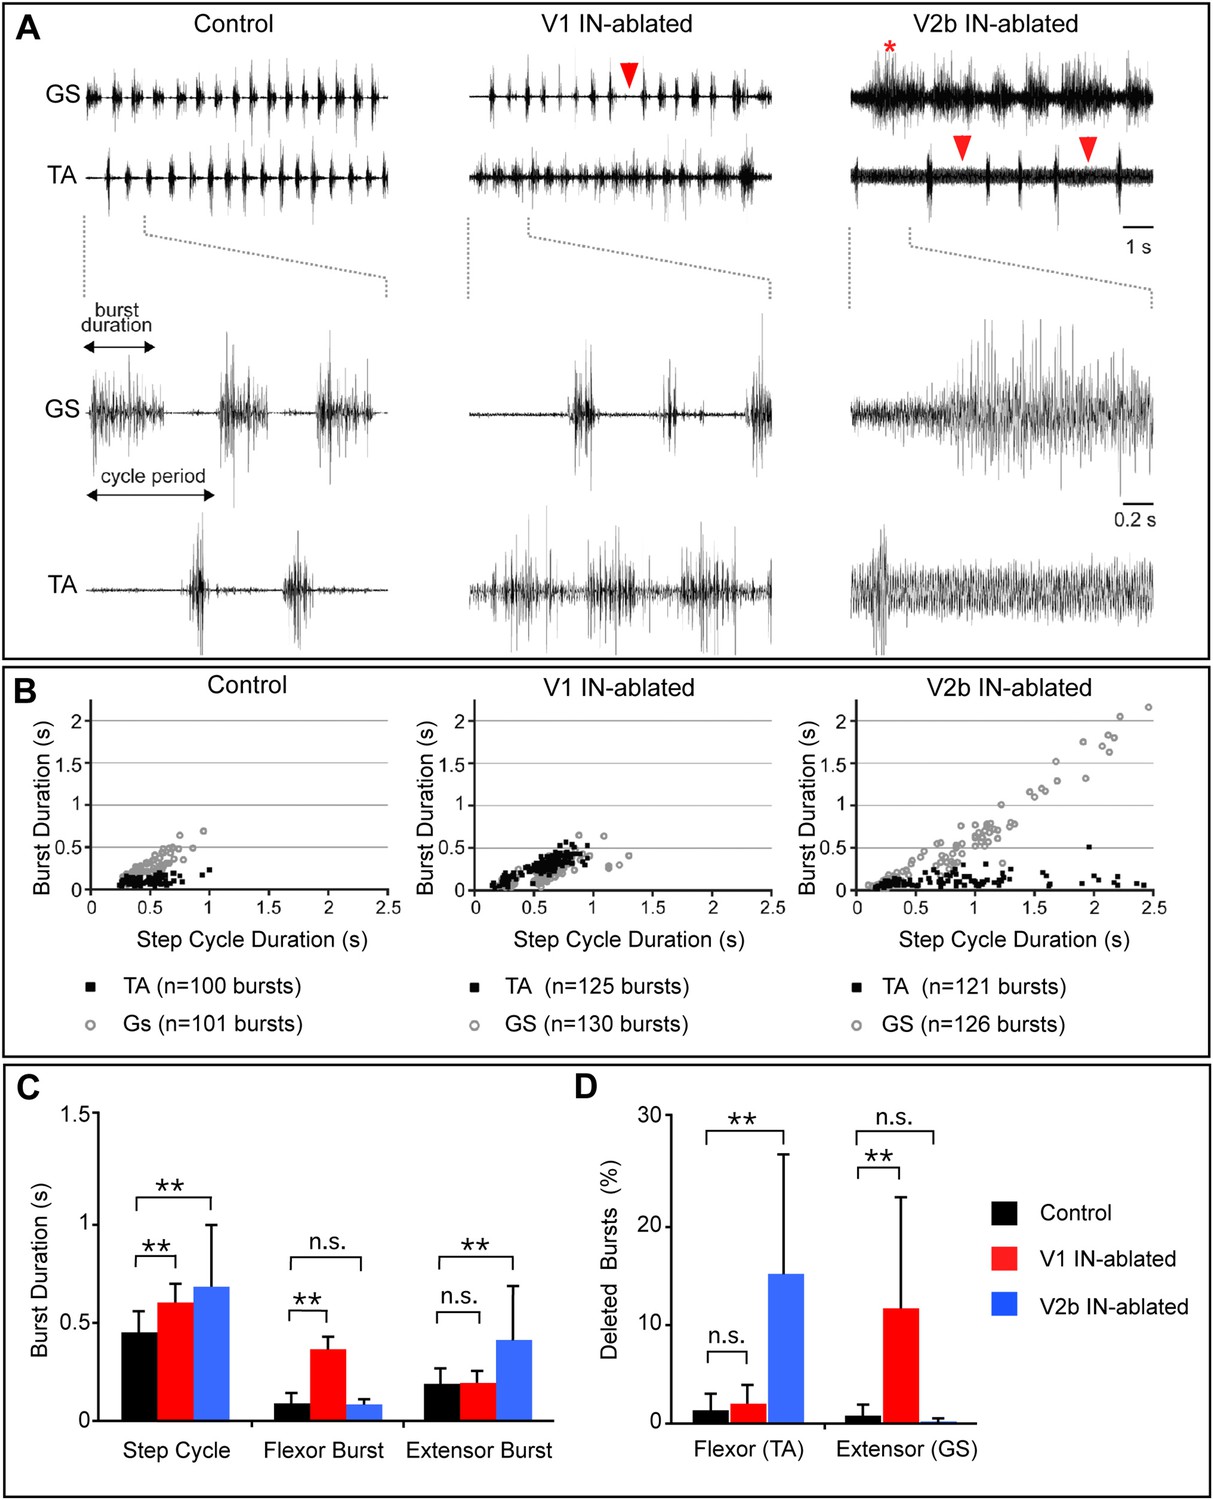
Altered rhythmic muscle activities during airstepping in the absence of V1 or V2b cells.
(A) EMG recordings from the tibialis anterior (TA, flexor) and gastrocnemius (GS, extensor) muscles during L-DOPA-induced airstepping. Single deleted bursts are indicated by arrowheads. The asterisk marks a prolonged deletion that encompasses two step cycles. (B) Scatter plots show the relationship between ankle flexor (TA) burst duration and the step cycle period (black dots) and between ankle extensor (GS) burst duration and the step cycle period (gray circles). Each point represents the ratio of burst to step cycle duration for a single step. Control and V2b IN-ablated animals display an extensor dominant pattern, whereas V1 IN-ablated animals show a flexor-phase dominant pattern. Mean slope of regression calculations for each experimental group shows that the step cycle period in control mice (aGS = 0.72) is strongly correlated with GS burst duration, while TA bursts remain relatively constant (aTA = 0.12). The increase in step cycle duration in V1 IN-ablated mice is moderately correlated with flexor phase duration (aTA = 0.46). V2b IN-ablated animals display a pronounced increase in step cycle duration that is very highly correlated with the length of the extensor phase (aGS = 0.96). (C) Quantification of step cycle period, flexor and extensor burst duration for control, V1 IN-ablated and V2b IN-ablated mice. (D) Percentage of skipped bursts/deletions as measured during twelve 10-s periods of locomotor activity (n = 3 animals each).
Figure 6 with 3 supplements
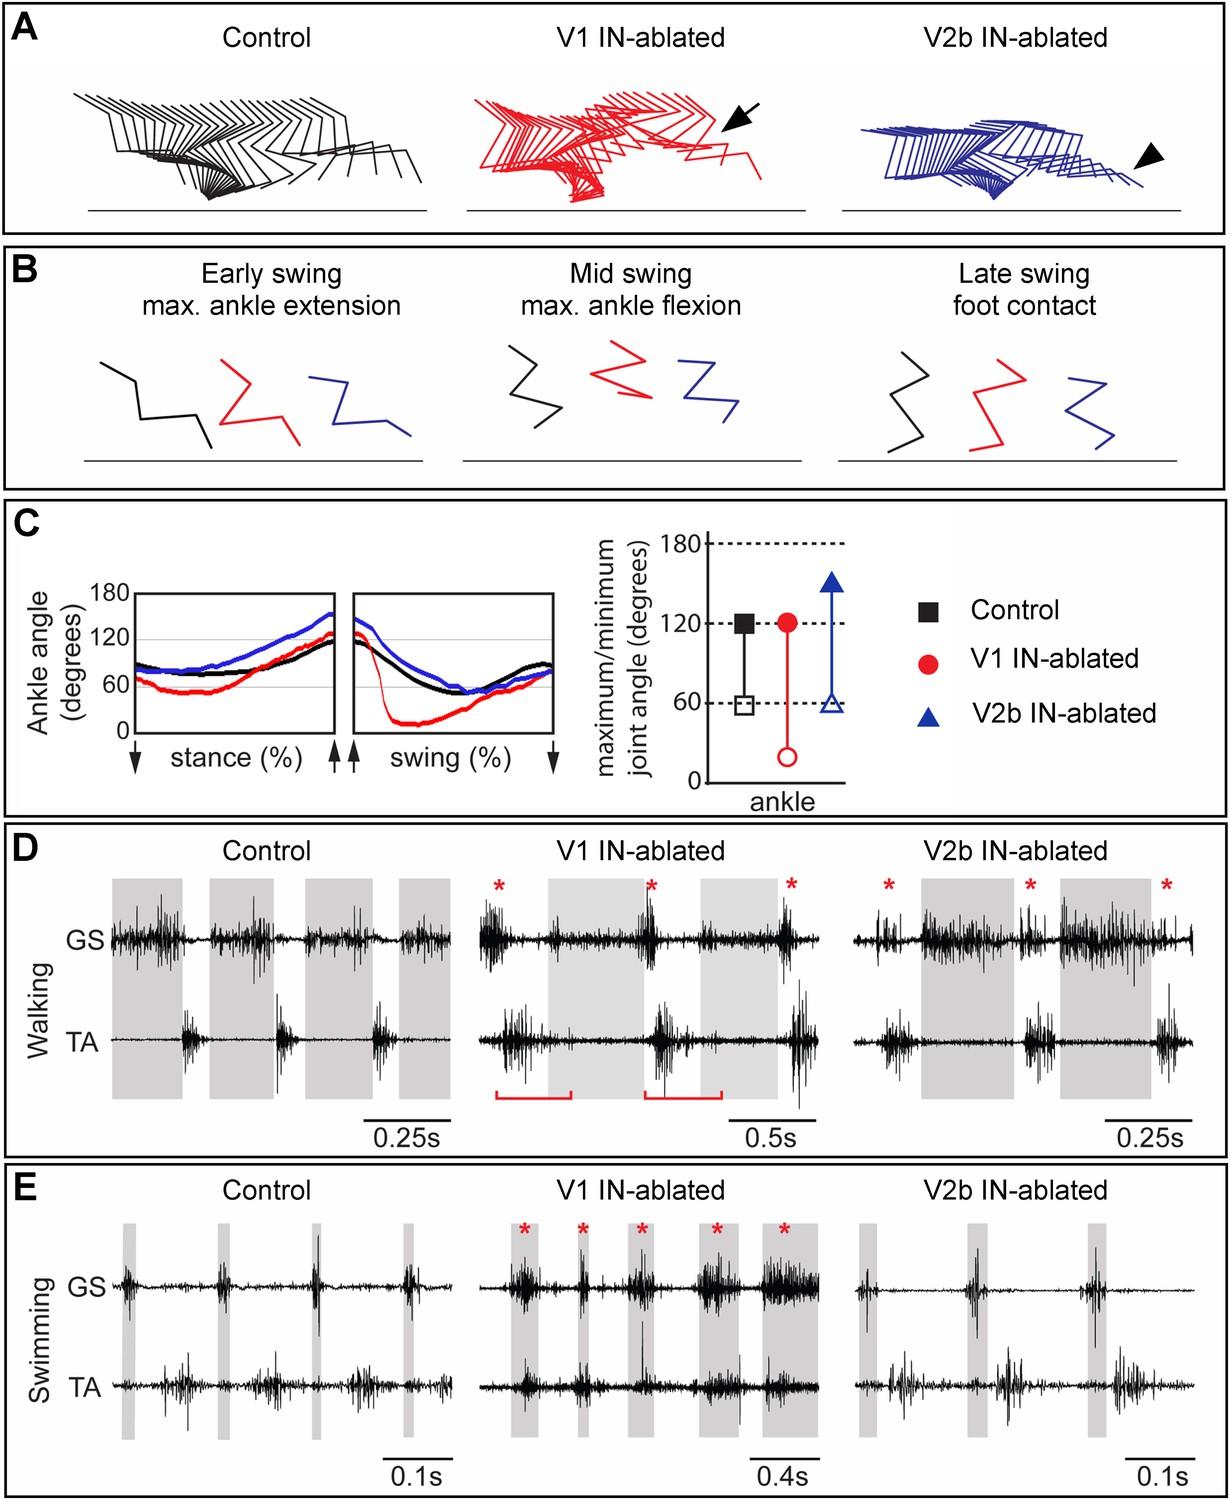
Mice lacking V1 and V2b INs have opposing changes to their gait.
Hindlimb kinematics from control (left), V1 IN-ablated (middle), and V2b IN-ablated (right) mice at 3 weeks post DTX injection, by which time functional recovery was maximal. (A) Representative stick figure diagrams showing one complete step cycle (swing and stance) for the hindlimb. The arrow (middle) indicates hyperflexion during early swing phase in V1 IN-ablated mice. The arrowhead shows hyperextension of the ankle joint during late stance in V2b IN-ablated mice. (B) Comparison of limb positions at the transition from stance to swing (left), at mid-swing (middle), and at the swing to stance transition (right). (C) Representative angular changes to the ankle joint. The arrows indicate when the foot is lifted (stance to swing) and when the foot is planted (swing to stance). (D, E) Simultaneous EMG recordings of the GS and TA muscles in one leg during walking (D) and swimming (E). The bar in D indicates the expansion in TA activity. The asterisks indicate co-activation of the TA and GS muscles. Note the synchronous activity of both muscles during swimming in V1 IN-ablated mice.
Figure 6—figure supplement 1
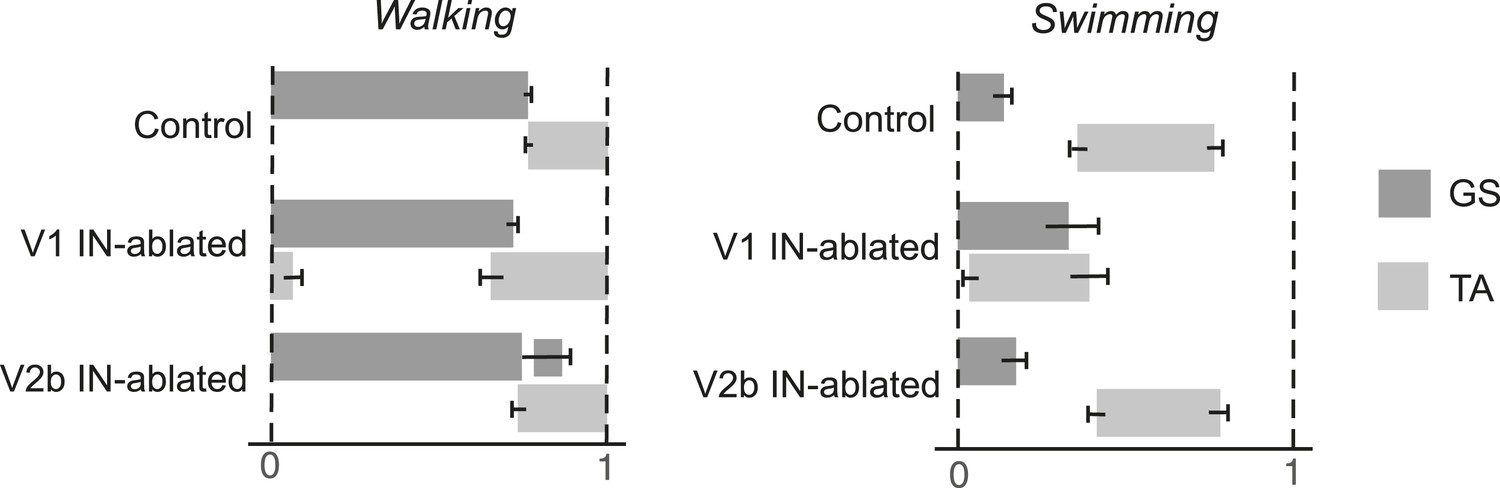
Phase relationship between TA and GS EMG activity.
The average period that the TA and GS muscles are active during the step cycle was calculated. Measurements were normalized for each step cycle, with the onset of GS EMG activity (0) serving as the reference for the beginning of the step cycle and 1 indicating the onset of the following stance phase. Note the expansion of TA activity in mice lacking V1 INs. Mice lacking V2b INs show prolonged GS activity during swing when the TA muscle is active. During swimming V1 IN-ablated mice show extensive co-activation of the GS and TA muscles. The mean period of muscle activity (gray solid bars) for each experimental sample is shown (n = 18 steps). Black error bars indicate the standard deviation for each sample.
Figure 6—figure supplement 2
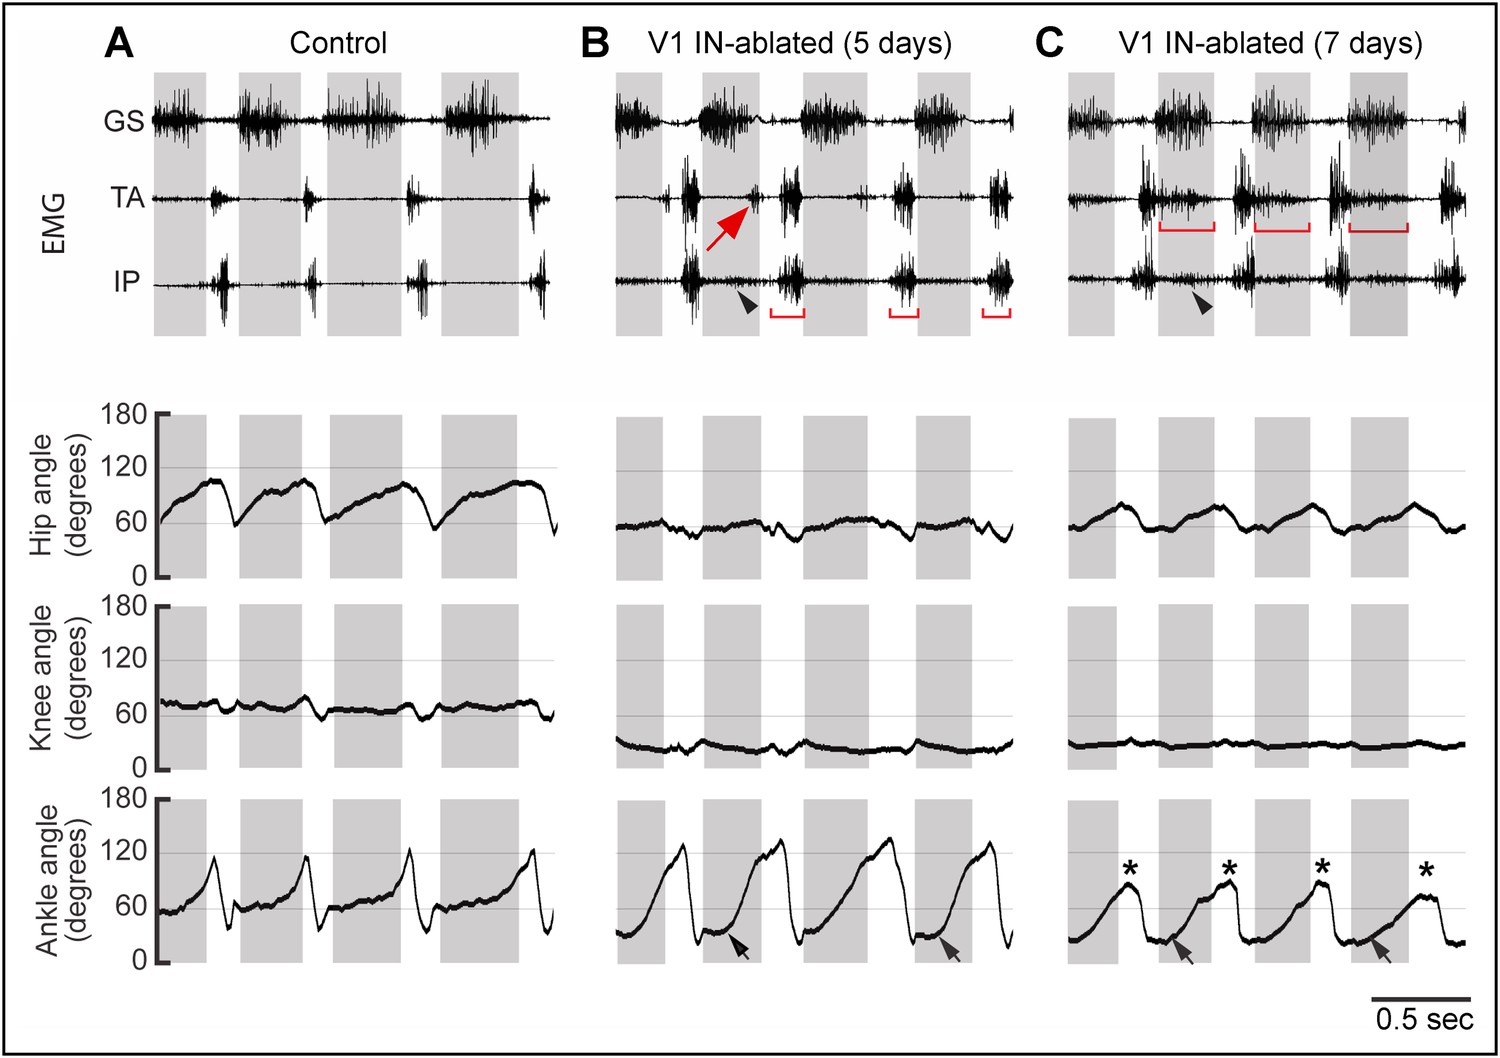
Progressive changes in EMG activity following V1 IN ablation.
Representative EMG recordings and kinematics from control (A), and V1 IN-ablated mice 5 (B) and 7 (C) days after commencing DTX treatment. The EMG recordings (upper panels) and joint angle plots (lower panel) are synchronized. In control animals, the TA and IP muscles are inactive during stance, and TA and GS activity is strictly alternating (A). The arrow in B indicates a small burst of ectopic TA activity which is associated with hyperflexion of the limb in V1 IN-ablated mice. By day 7 p.i., TA muscle activity has expanded and is co-active with the GS muscle during stance (C, bar). IP burst activity during swing (B, bar) and stance (arrowhead) is also increased. The matching lower traces show the accompanying changes in the angle of the hip, knee, and ankle joints during walking. Note the reduced opening of the hip and knee joints that accompanies the loss of V1 INs. At day 5 p.i., the ankle joint opens up more slowly (black arrows), but is still able to fully open. By day 7 p.i. the ankle joint is flexed throughout the step cycle, both at early stance (black arrow) and at the transition from stance to swing (asterisk). The small increase in hip motion seen at day 7 p.i. compared to day 5 p.i. is due to increased swaying of the pelvis during walking. The knee angle is also reduced during the step cycle. The shaded boxes indicate the extensor phase. Following V1 IN cell loss, ectopic TA muscle EMG activity is observed during stance (arrow).
Figure 6—figure supplement 3
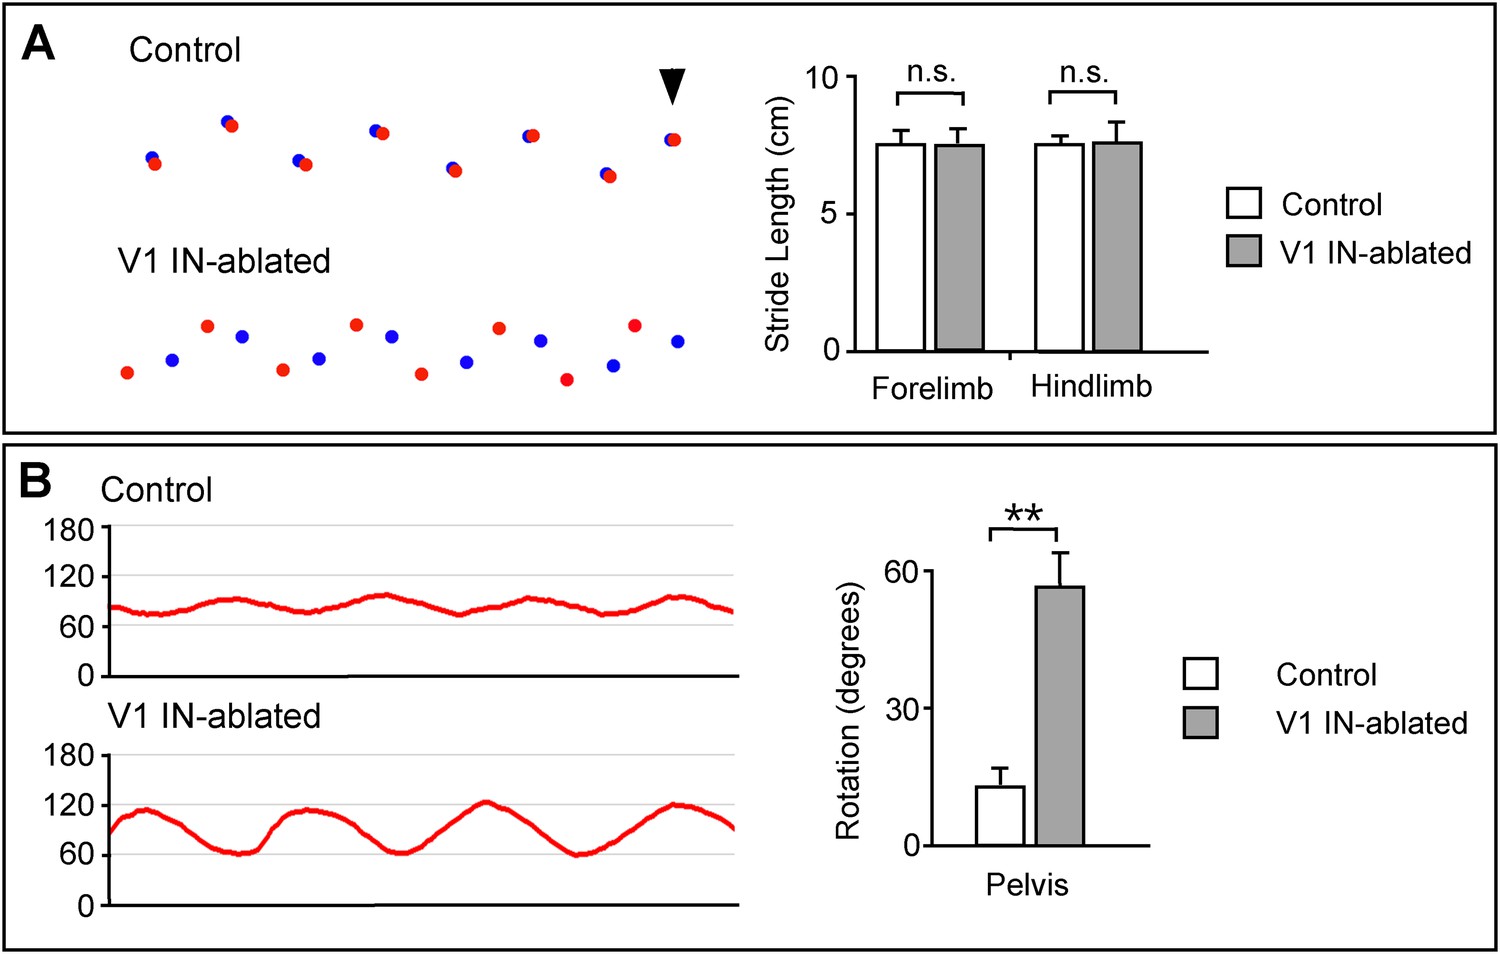
Altered limb and body movements in mice lacking V1 INs.
(A) Foot placement analysis in control and V1 IN-ablated mice 3 weeks post-DTX treatment. High-speed video was used to capture the foot strike during walking on an elevated walkway. (Left) The position of the forepaws during stance is shown in blue, the position of the hindpaws are shown in red. The arrowhead indicates the first forelimb step, with the animals moving from right to left. (Right) The stride lengths for the forelimb and hindlimb were calculated for 36 steps (n = 3 animals each for control and V1 IN-ablated). (B) V1 IN-ablated mice show an increase in the rotation of the pelvis during walking. (Left) The change in the angle of the pelvis was calculated with 90° representing the median position of the pelvis. (Right) Quantification of the angular change in pelvis during a single step. The angular change was calculated for 24 steps (n = 3 animals each for control and V1 IN-ablated). Data is expressed as mean ± s.d. ** indicates p < 0.01.
Figure 7
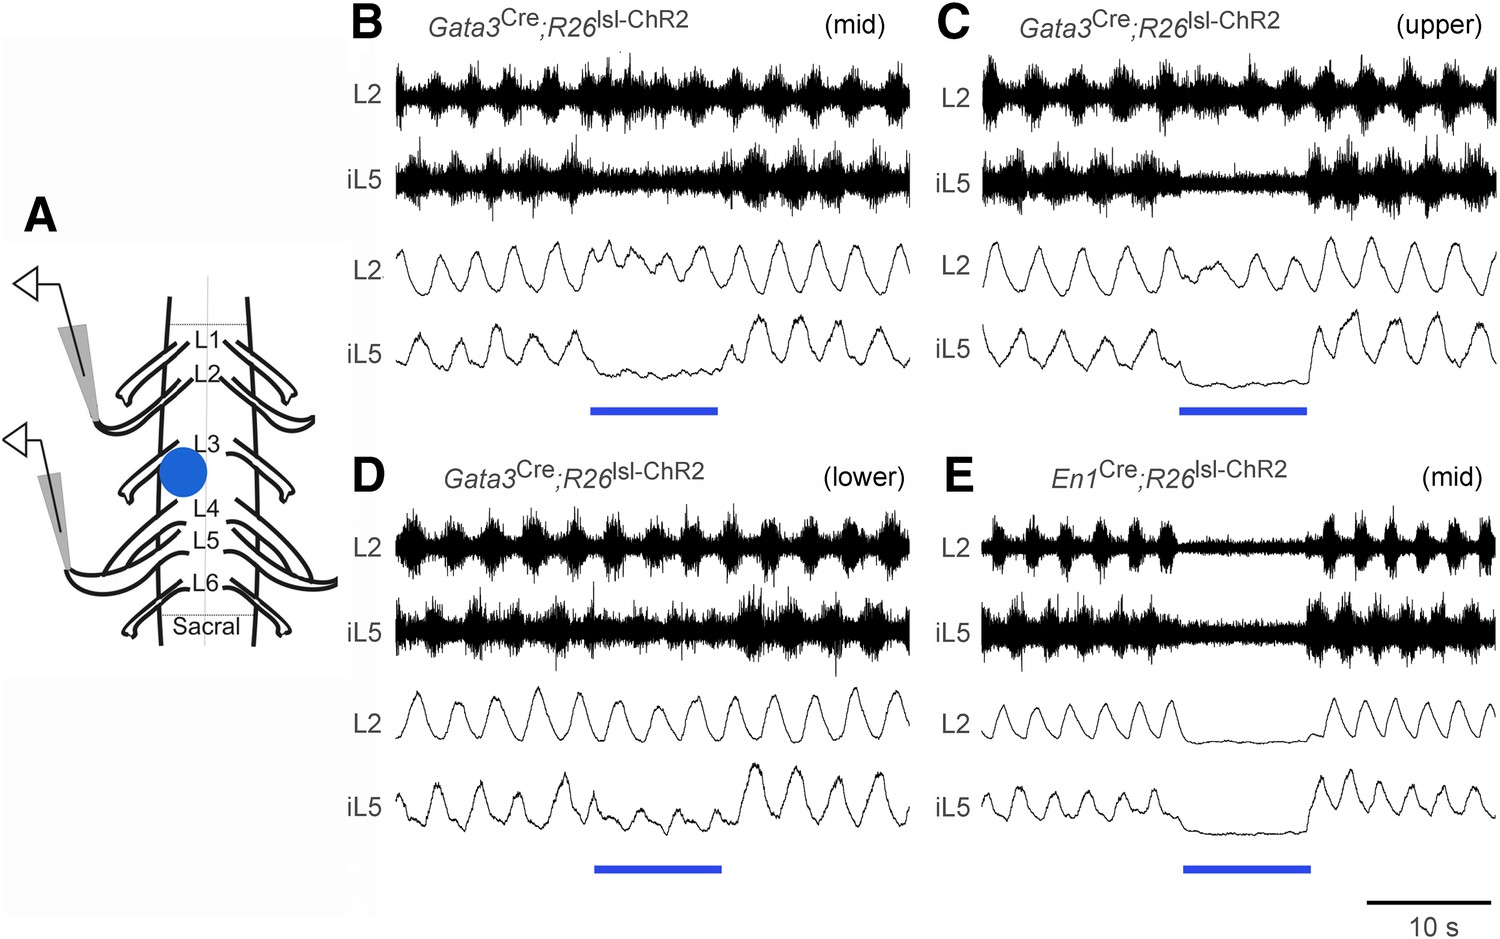
Effect of optogenetic activation of V2b and V1 INs on in vitro locomotion.
(A) Schematic showing the in vitro recording setup used for the localized light activation of ChR2 in V1 and V2b INs. (B–D) Representative ENG recordings from a P0 Gata3Cre; R26lsl-ChR2 (Ai32) spinal cord showing the suppression of L5 extensor-related activity in the presence of blue light photostimulation (blue bar). The lumbar levels that were photostimulated are indicated as upper (L1–L2), mid (L3–L4), and lower (L5–L6). (E) Representative recording from a P0 En1Cre; R26lsl-ChR2 (Ai32) spinal cord showing suppression of L2 and L5 ventral root activity following photostimulation of V1 INs at L3–L4. Upper traces represent the raw filtered ENG recordings. Lower traces display the matching online rectified ENG signal.
Figure 8 with 1 supplement
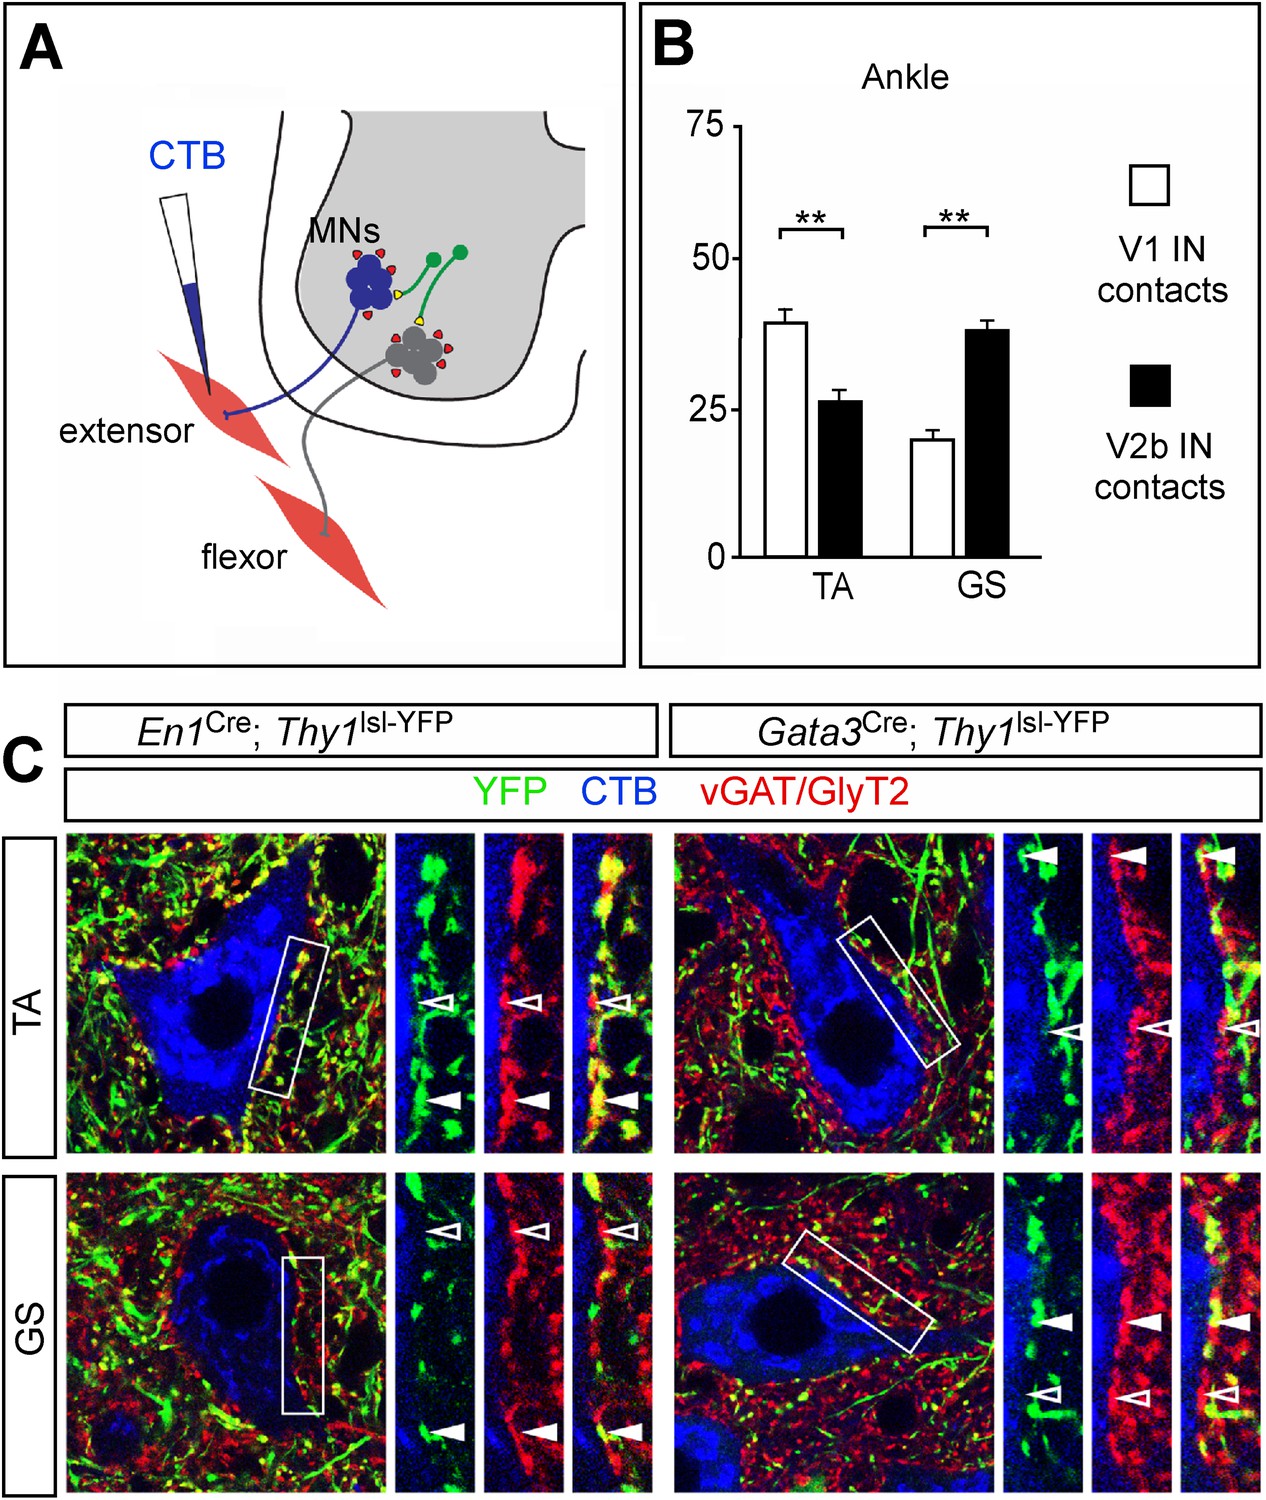
Biased V1 and V2b connections onto flexor- and extensor-related motor neurons.
(A) Schematic of experimental design used for labeling V1 and V2b inhibitory contacts on specific motor pools. Motor neurons (MNs) were retrogradely labeled by injecting Cy5-CTB into individual hindlimb muscles at P11. Interneuron class-specific contacts were labeled with a conditional Thy1lsl-YFP reporter allele (green) and inhibitory contacts were detected with antibodies to vGAT and GlyT2 (red). (B) Putative V1- and V2b-derived inhibitory contacts (vGAT/GlyT2 (red) and Thy1-YFP reporter (green)) onto CTB-labeled TA and GS motor neurons (blue). Filled arrowheads indicate examples of inhibitory synaptic terminals that co-localize with YFP. YFP-negative inhibitory contacts are marked with open arrowheads. (C) Quantification of V1- or V2b-IN-derived inhibitory contacts on the soma/proximal dendrites of defined hindlimb motor neurons (n = 12 motor neurons per pool). A greater number of putative V1 IN inhibitory synapses contact flexor motor neuron pools as compared to their antagonist extensor-related motor pools. In contrast, V2b-derived contacts represent a greater proportion of the inhibitory synapses onto extensor-related motor neurons as compared to antagonist flexor-related motor neurons. Abbreviations: GS, gastrocnemius; TA, tibialis anterior. Error bars: mean ± s.d.
Figure 8—figure supplement 1
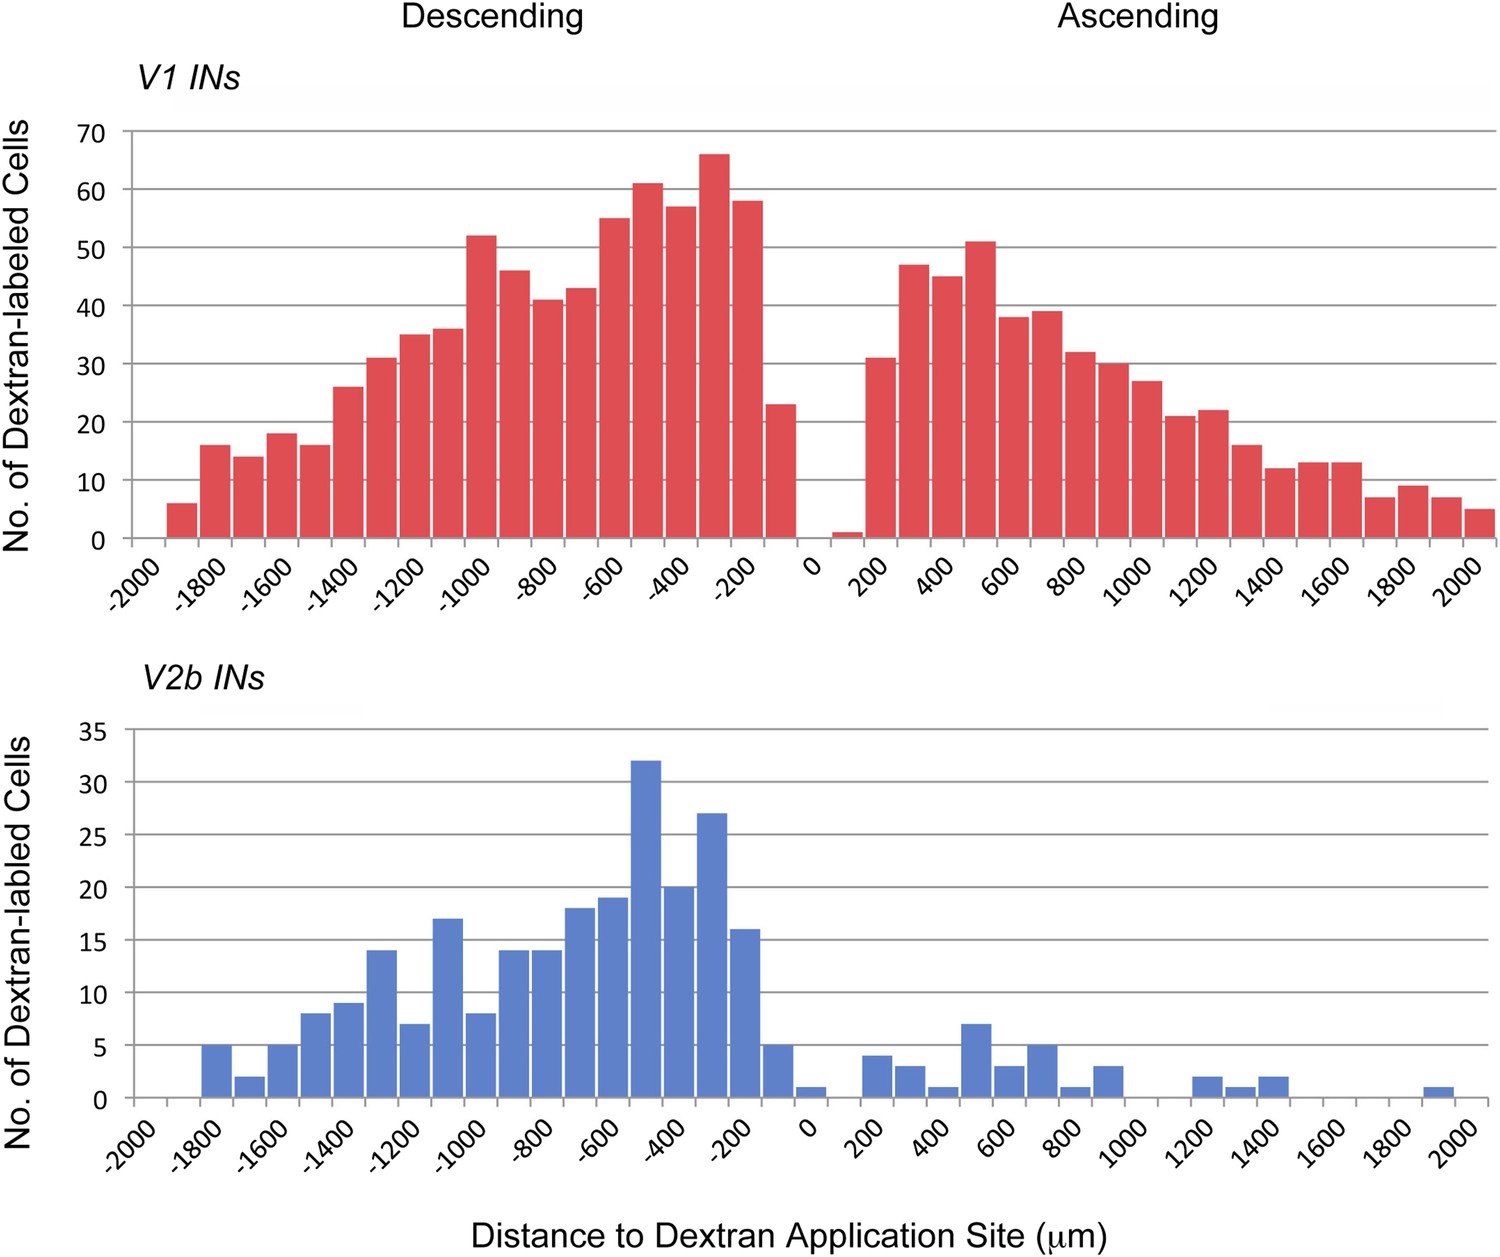
Axonal projections of V1 and V2b INs.
P0 En1Cre; R26lsl-HTB and Gata3Cre; R26lsl-HTB mice were used to label and trace the projections of V1 and V2b INs, respectively. Rhodamine-conjugated dextran was applied unilaterally to the cut ventral horn at the L2. Data represent cumulative cell counts from two cords each for V1 and V2b INs. The distribution shown covers the lumbar spinal cord from the T13/L1 border to L6.
Download links
A two-part list of links to download the article, or parts of the article, in various formats.
Downloads (link to download the article as PDF)
Open citations (links to open the citations from this article in various online reference manager services)
Cite this article (links to download the citations from this article in formats compatible with various reference manager tools)
A genetically defined asymmetry underlies the inhibitory control of flexor–extensor locomotor movements
eLife 4:e04718.
https://doi.org/10.7554/eLife.04718


