A dedicated visual pathway for prey detection in larval zebrafish
- Max Planck Institute of Neurobiology, Germany
- University of California at San Francisco
Figures
Figure 1 with 1 supplement
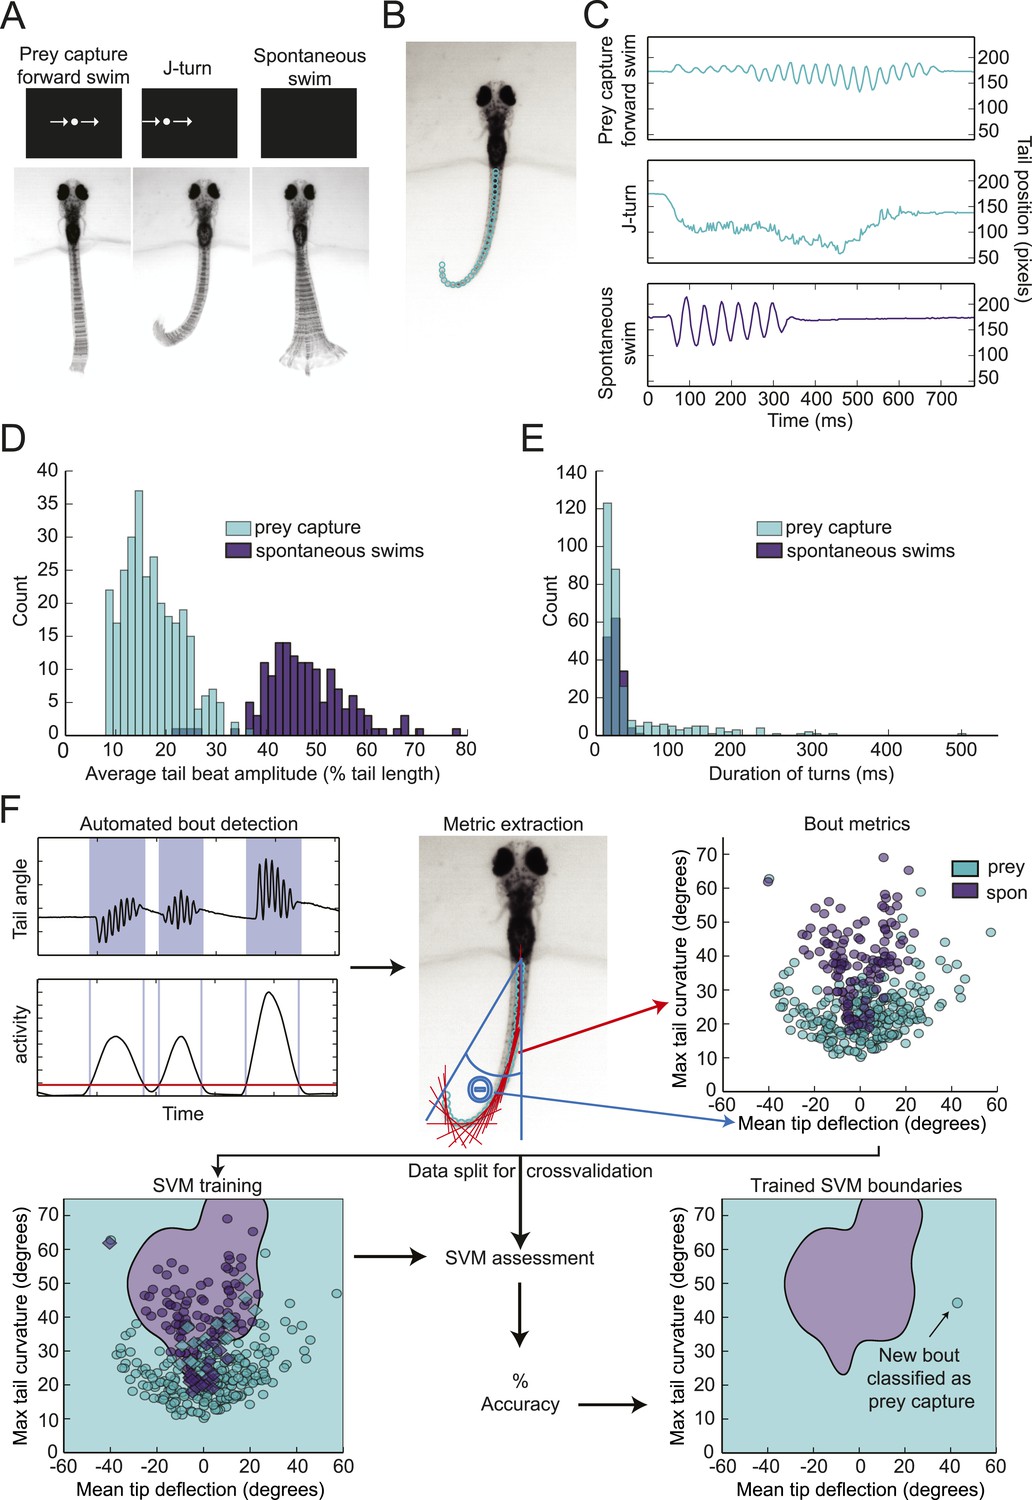
Head-fixed larvae respond to virtual prey with distinctive swimming movements.
(A) Overlay of 50 frames (167 ms) of high-speed video showing examples of behavior in head fixed larvae. Larvae performed forward swims in response to a 3° dot. j-turns were observed when the same dot was to the right or left. Spontaneous swims were often observed in the absence of any stimulus. (B) Example video frame showing points assigned by the digitization algorithm. (C) The position of the tip of the tail over time for the videos in (A). (D) The distribution of tail beat amplitudes for each bout in expert-classified prey capture and spontaneous swim videos. (E) Duration of the longest bend greater than 20° during each bout. (F) Overview of support vector machine (SVM) based bout classification procedure, displaying only two parameters (maximum tail bend and mean tail tip deflection) for clarity. Bouts are extracted using a threshold on the normalized and smoothed first derivative of tail bend angles. Values for each parameter are calculated for all bouts and used to train an SVM. The SVM is then used to classify unlabeled bouts. See Figure 1—figure supplement 1 for plots of each of the five parameters, and accuracy of the SVM vs number of parameters.
Figure 1—figure supplement 1
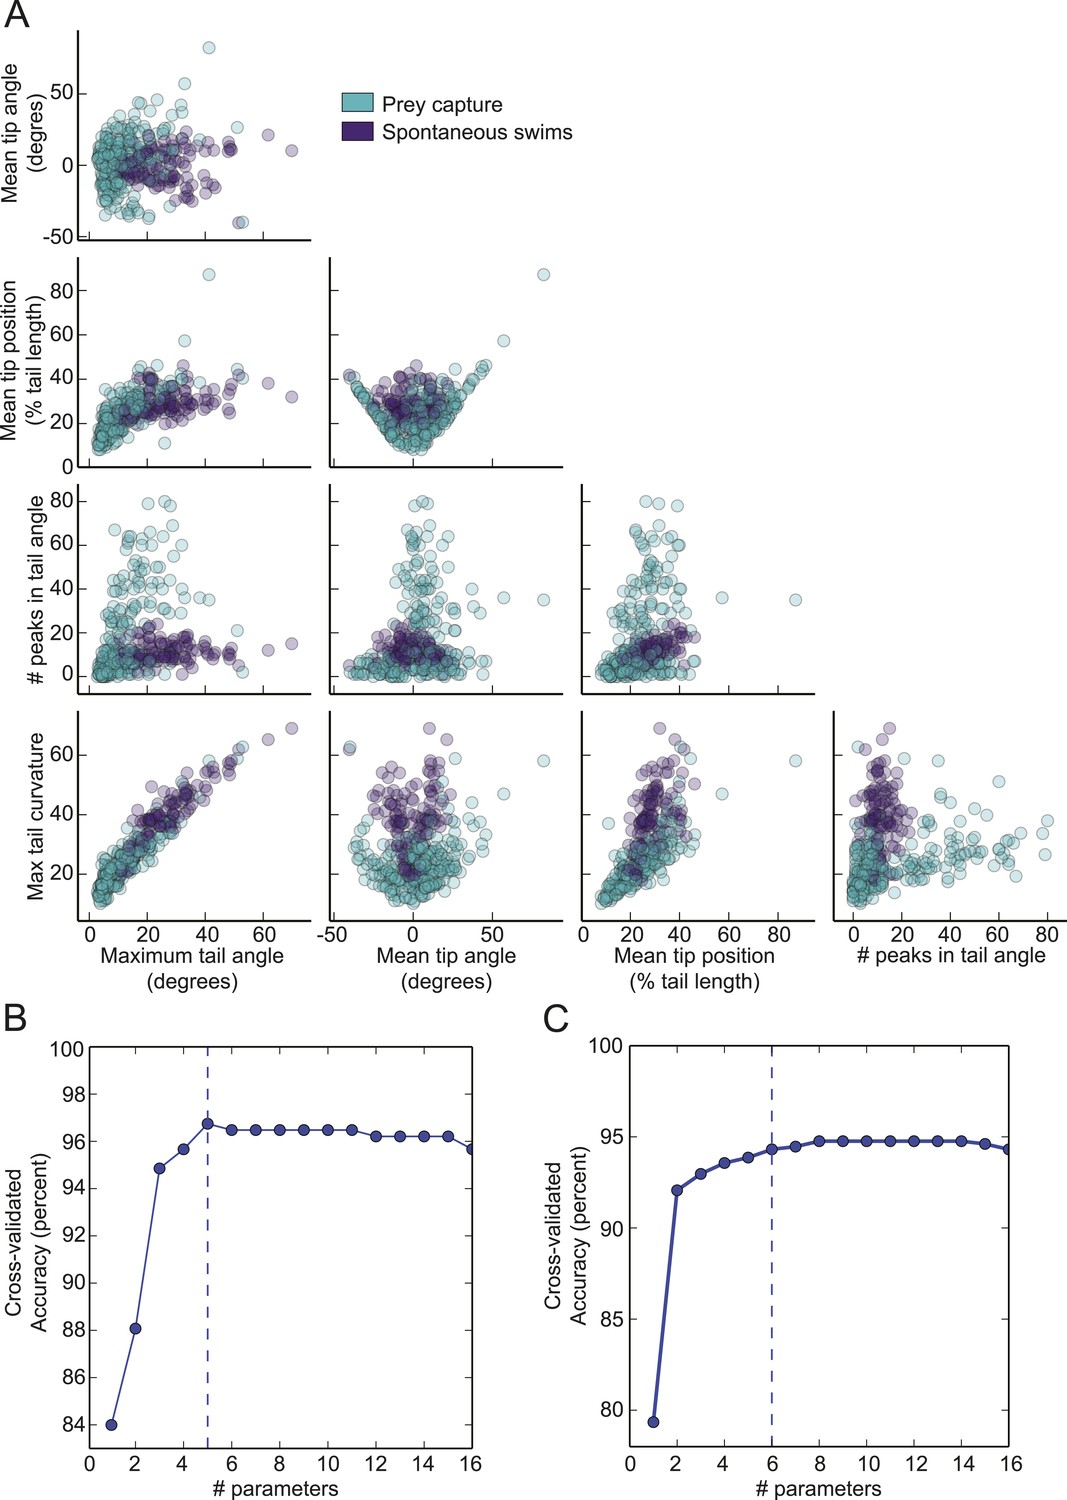
Prey capture and spontaneous behavior can be classified using five parameters.
(A) Each parameter used in the virtual prey SVM is plotted vs the other four. (B) Accuracy of the virtual prey SVM as more parameters are used to classify the bouts as prey capture or spontaneous swims. The dotted line represents the number of parameters used in the final version. The parameters plotted were: 1. Maximum tail curvature, 2. Number of peaks in tail angle, 3. Mean tip angle, 4. Maximum tail angle, 5. Mean tip position. (C). Accuracy of the paramecium SVM plotted vs number of parameters. The parameters shown here were 1. Mean tip angle, 2. Maximum tail curvature, 3. Number of peaks in tail angle, 4. Mean tip position, 5. Mean number of frames between peaks, 6. Maximum tail angle.
Figure 2
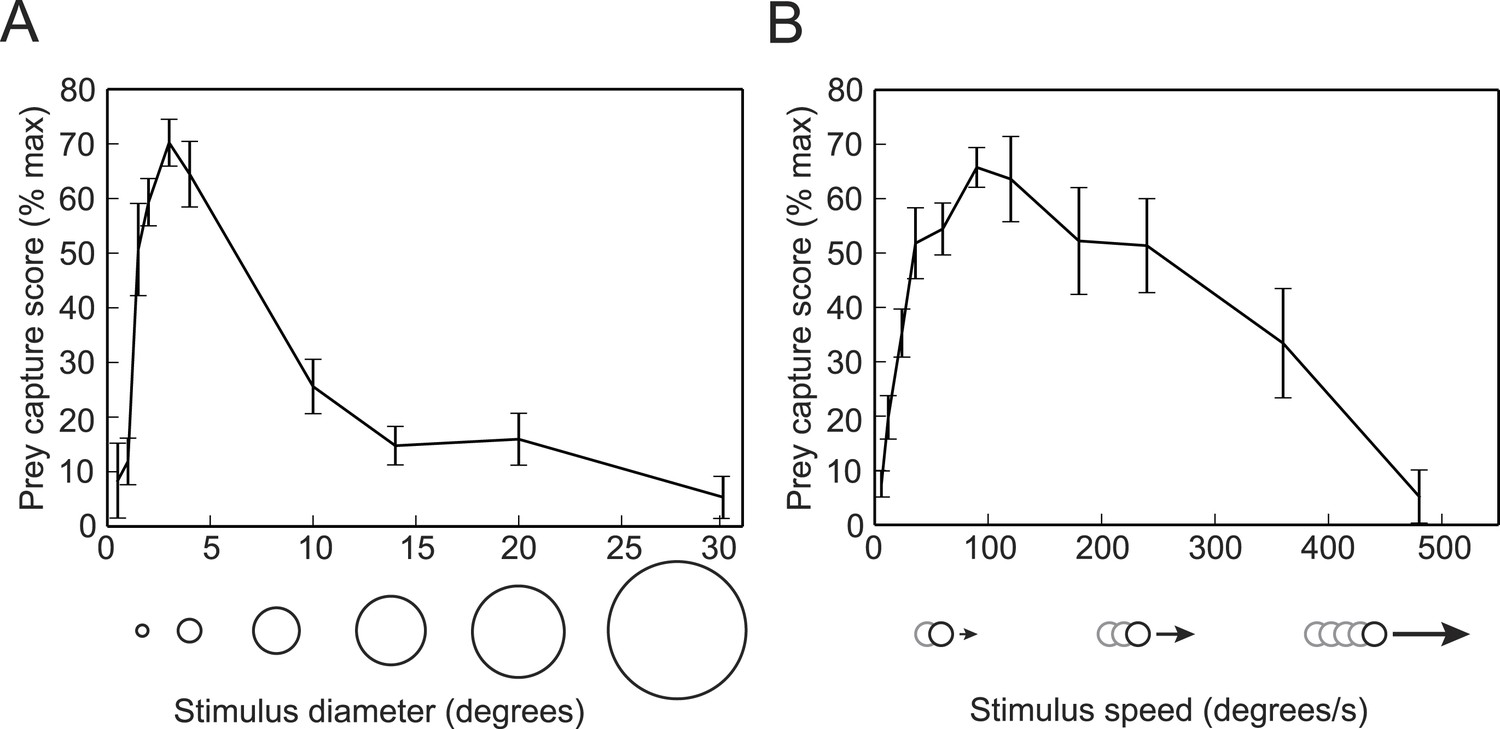
Prey capture behavior is triggered by dots of a particular size and speed.
(A) Larvae were shown white dots of various sizes moving at 90°/s. Trials were scored by using the SVM to classify each bout and calculating the percentage of the trial that consisted of prey capture bouts. Scores are expressed as a percentage of the maximum for that larva. n = 16 larvae. (B) Prey capture behavior in response to a 3° dot moving at 6 to 480°/s. n = 9 larvae. Error bars = ±SEM.
Figure 3 with 1 supplement
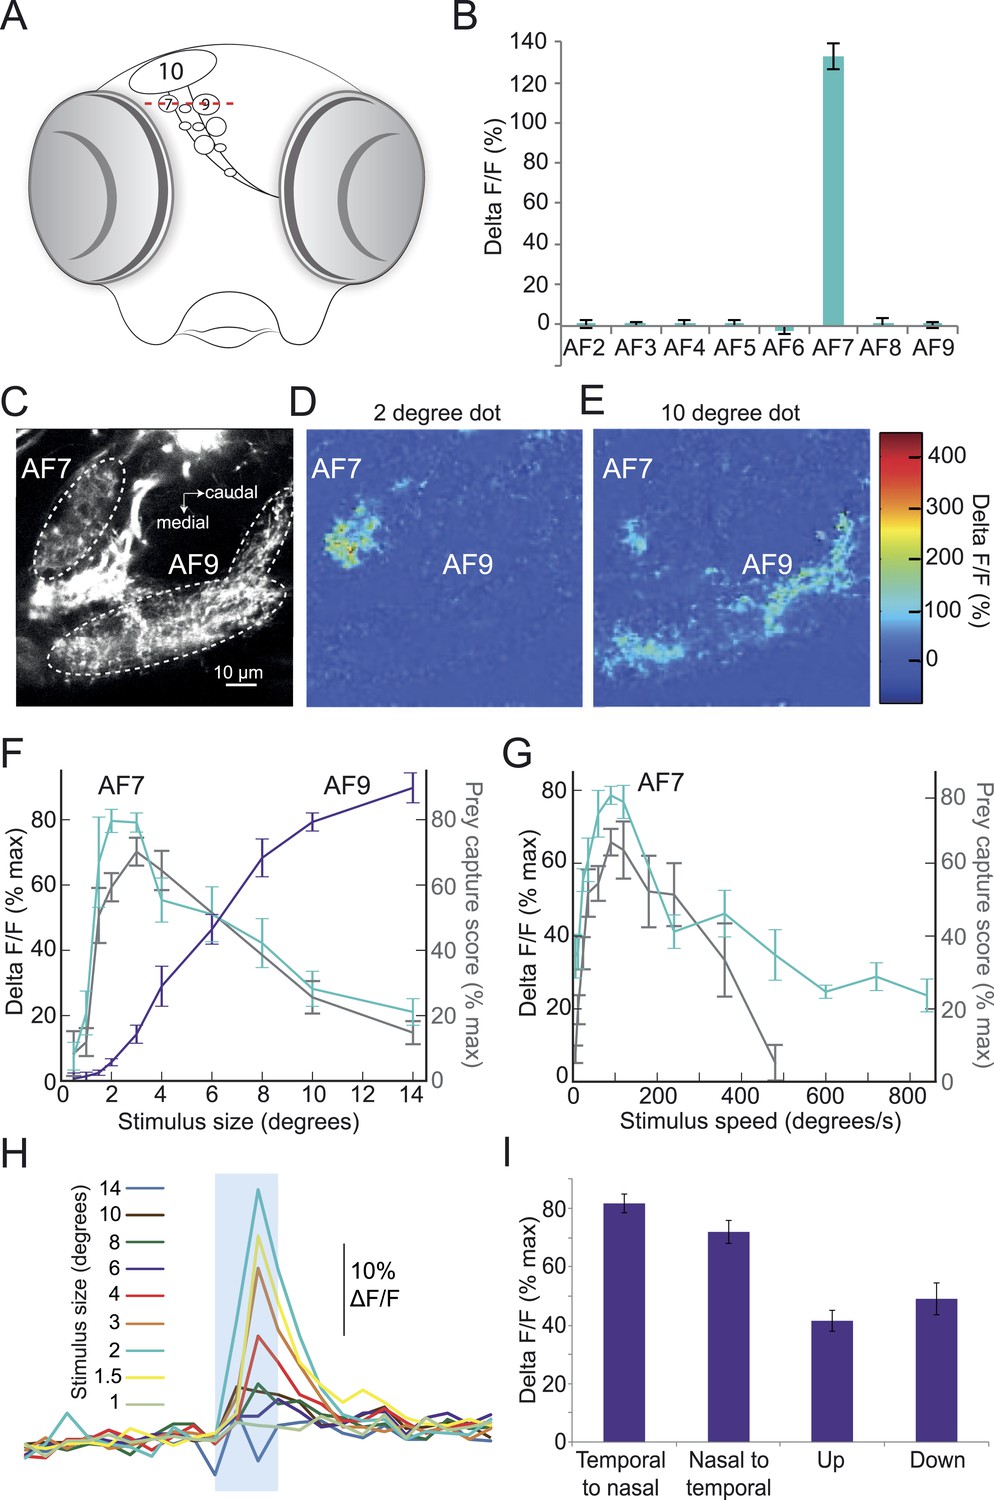
Prey stimuli activate RGC axons that project to AF7.
(A) Schematic frontal view of the brain showing AFs. Red line indicates imaging plane for C–G. (B) Response to the ideal prey stimulus (3° dot, 90°/s) in other AFs in an Isl2b:Gal4, UAS:GCaMP6s transgenic larva. n = 9 larvae. (C) Baseline fluorescence of RGCs in an Isl2b:Gal4, UAS:GCaMP3 larva. (D) Peak frame in the response to a 2° dot. (E) Peak frame in the response to a 10° dot. (F) Response of all larvae (n = 9) to stimuli 0.5–14° in diameter. ROIs were defined anatomically as in (C). The ΔF/F is plotted as a percentage of the maximum response for that larva. Grey lines represent the behavioral tuning curve from Figure 2A. (G) Response of AF7 RGC axons to a 3° dot travelling at a speed of 6–800°/s. Grey lines represent the behavioral tuning curve from Figure 2B. (H) Responses of AF7 to a range of different size stimuli. Blue box represents the one second interval when the stimulus was onscreen. (I) AF7 response to 3° dot moving in various directions. n = 10 larvae. Error bars = ±SEM. See Figure 3—figure supplement 1 for tuning properties of tectal RGC axons.
Figure 3—figure supplement 1
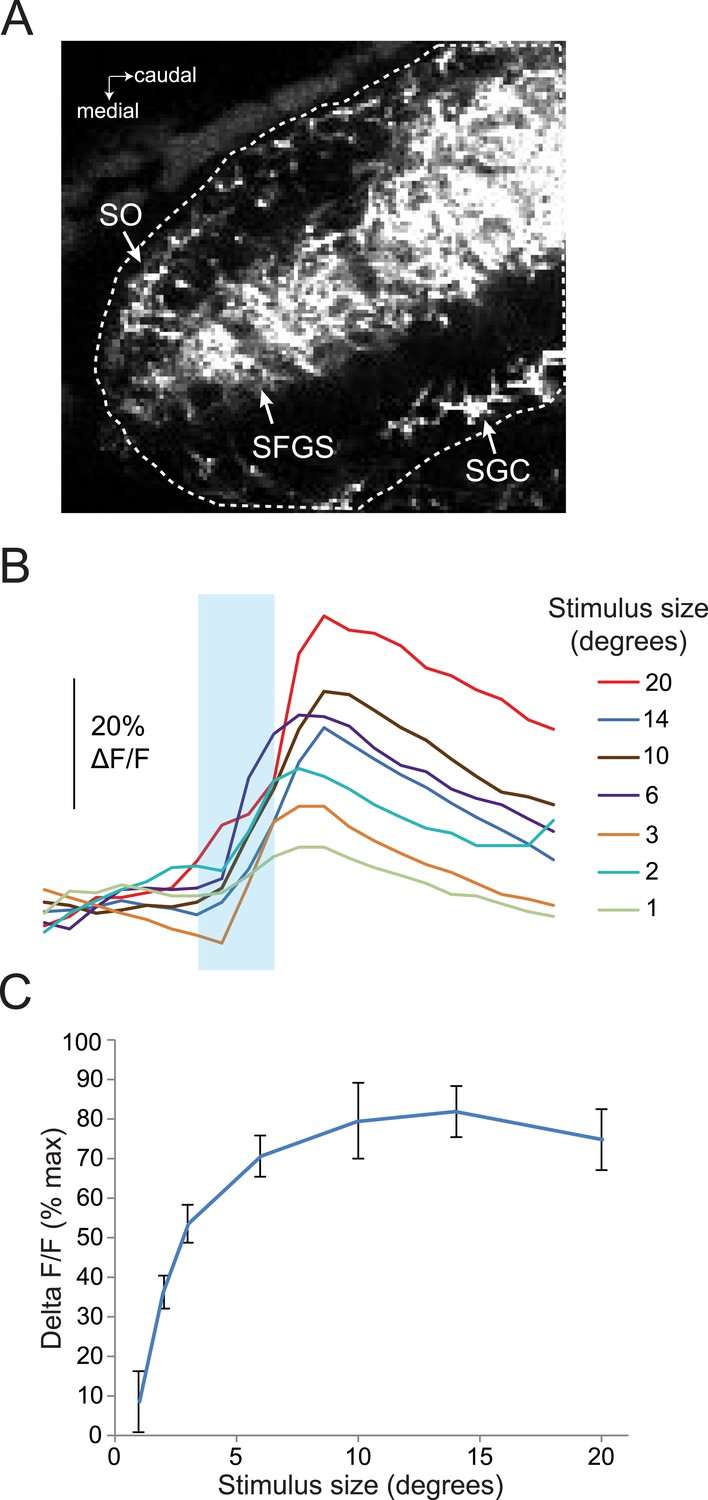
Response of RGC axons in the tectum to stimuli of varying sizes.
(A) Baseline fluorescence of RGC axons in the anterior half of the tectum, 50 µM below the dorsal surface of the tectum. Dotted line shows ROI, which includes the SO, SFGS, and SGC. (B) Traces showing responses to a range of different size stimuli in RGC axons in the anterior tectum of one larva. Ath5:Gal4, UAS:GCaMP6s larvae were used for these experiments. (C) Average response of five larvae to stimuli 1–20° in diameter.
Figure 4
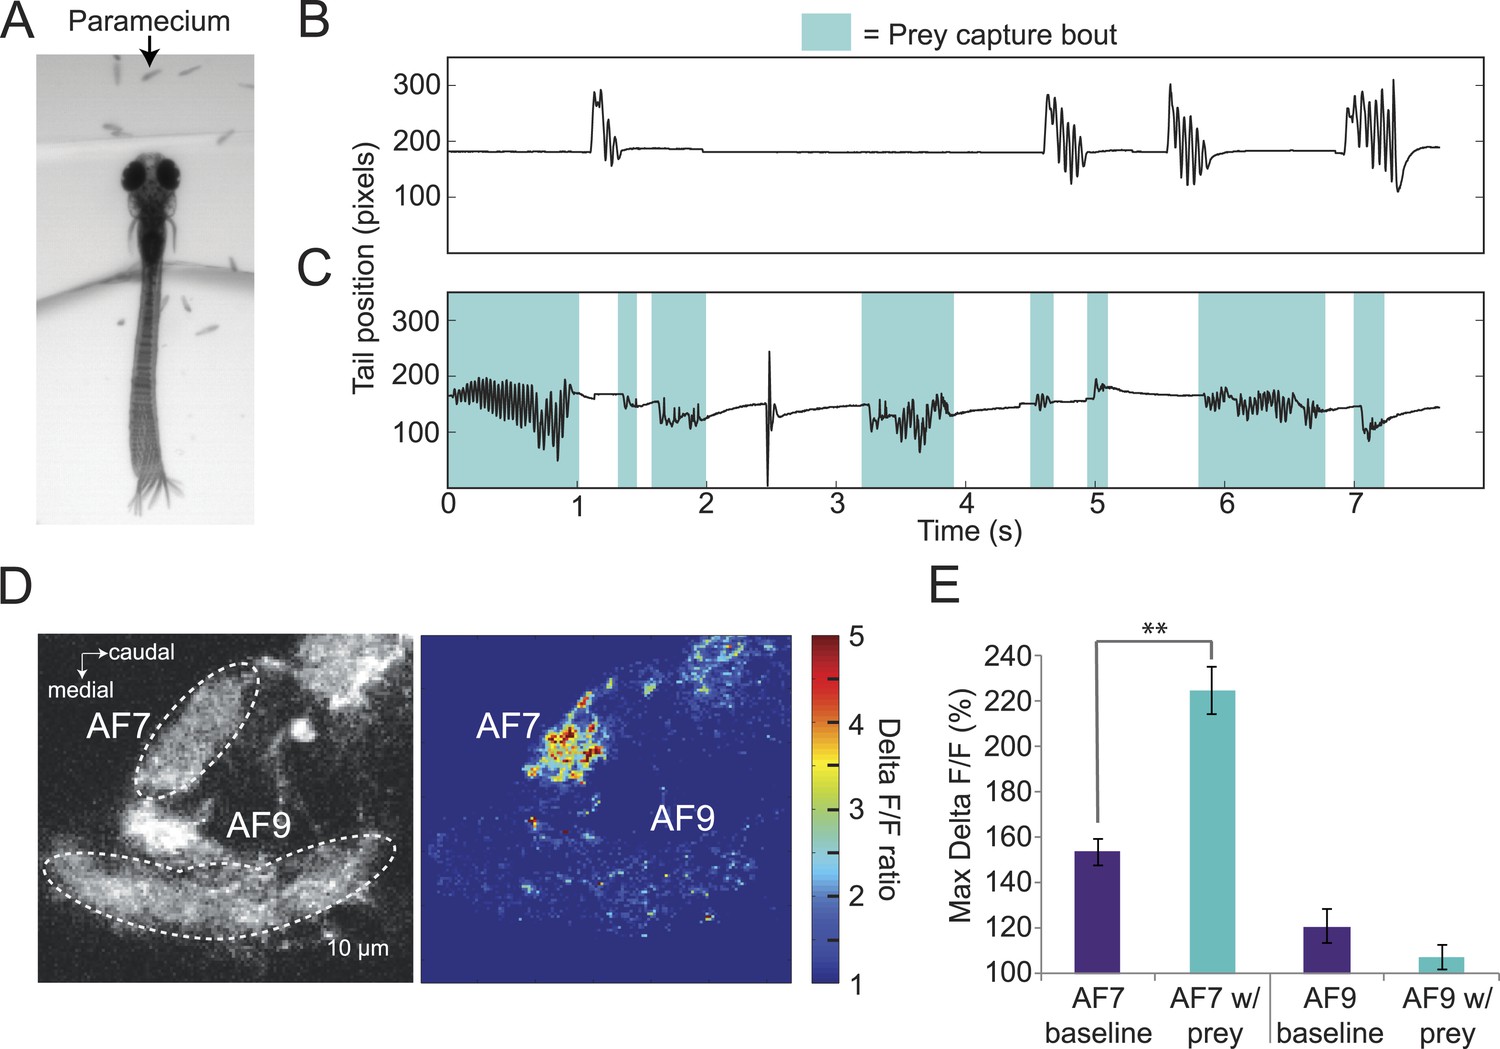
Paramecia evoke prey capture behavior and a response in AF7.
(A) Overlay of 50 frames (167 ms) of high-speed video showing a head fixed larva responding to paramecia. (B) The position of the tip of the tail of the larva in A without paramecia, showing spontaneous swims. (C) The same larva after paramecia were added to the dish. Bouts that were identified as prey capture by the SVM are colored blue. (D) Ath5:Gal4, UAS:GCaMP6s larvae were imaged before and after addition of paramecia. Pseudocolor represents the ratio of the ΔF/F with paramecia to without. (E) AF7 and AF9 responses to paramecia in nine larvae. Maximum ΔF/F is plotted for each trial. The AF7 response was significantly higher in trials with paramecia (p = 9.6 × 10⁻⁵, Wilcoxon rank sum test), whereas the AF9 response was not significantly different (p = 0.083). n = 10 larvae. Error bars = ±SEM. See also Video 2.
Figure 5
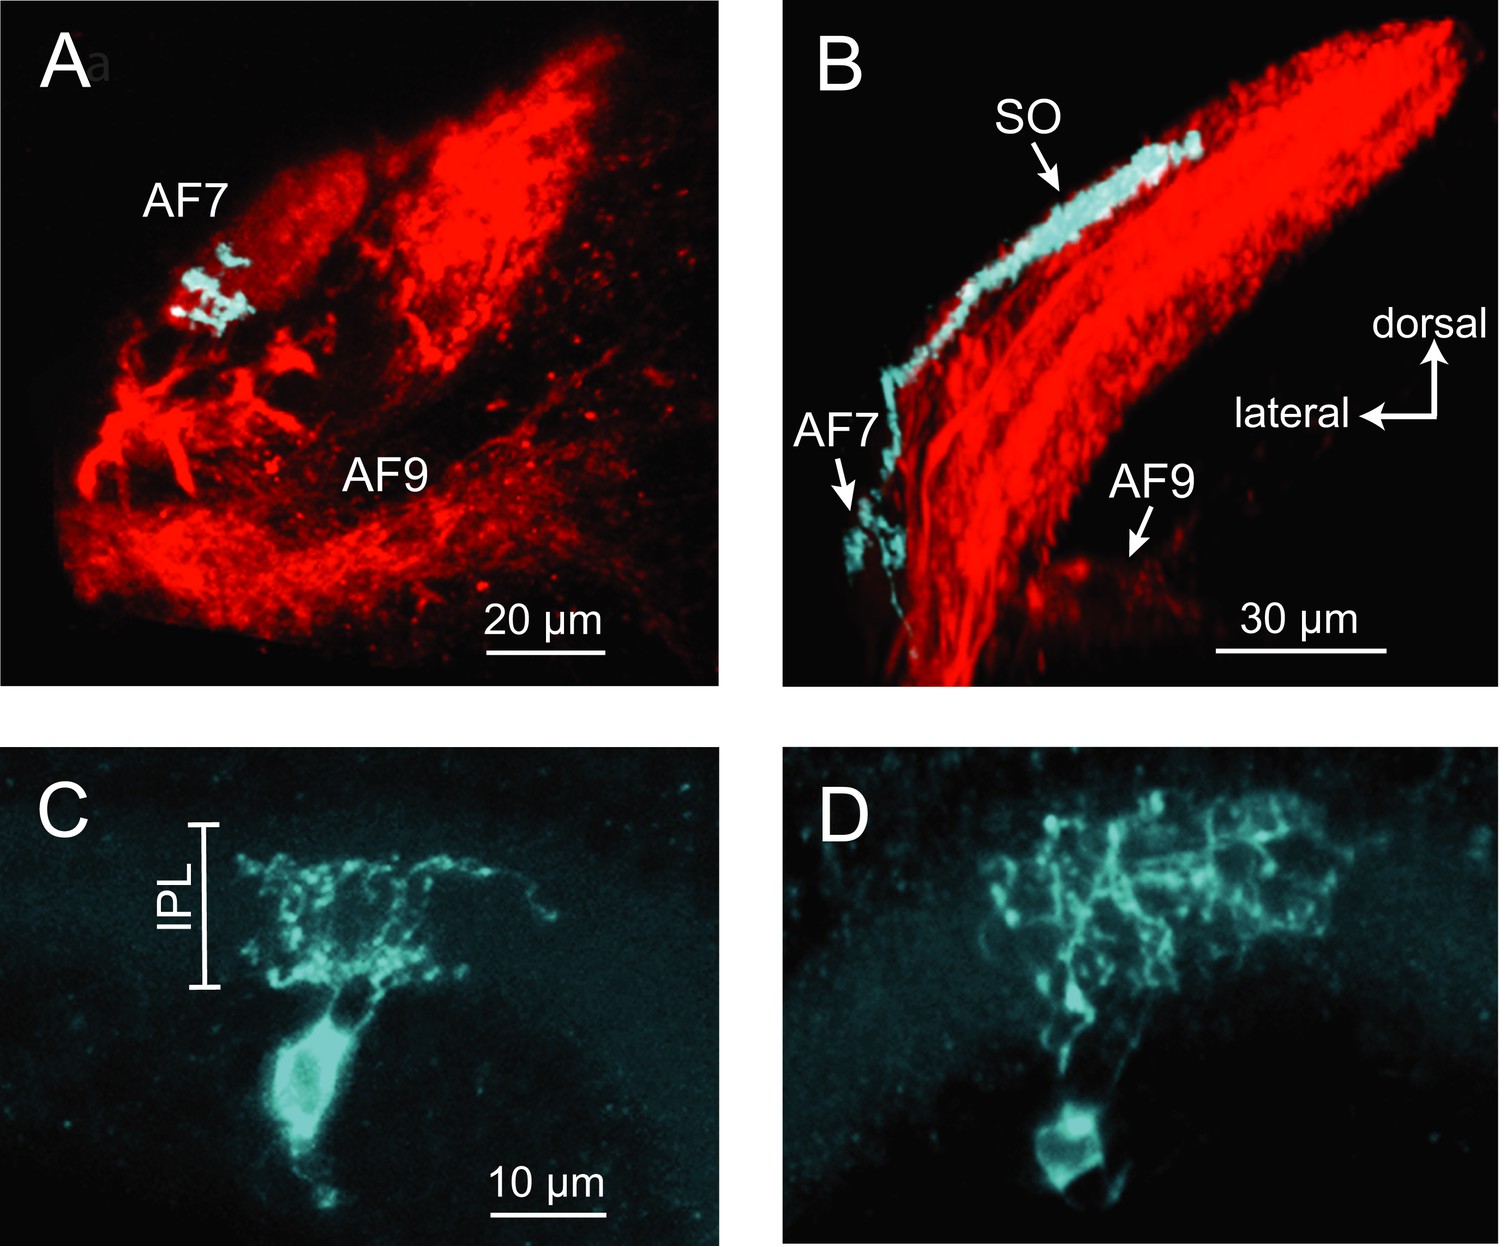
Two types of RGCs project to AF7 and also arborize in the tectum.
(A) A single GFP-expressing RGC axon (cyan) arborizes in AF7 in an Ath5:Gal4, UAS:mCherry, BGUG larva. (B) The same axon also innervates the SO layer of the tectum. (C) Section of the retina showing dendritic morphology of a bistratified AF7-projecting RGC. Bracket indicates borders of the IPL (16 µM). (D) Dendritic morphology of a diffuse bistratified AF7-projecting RGC.
Figure 6 with 1 supplement
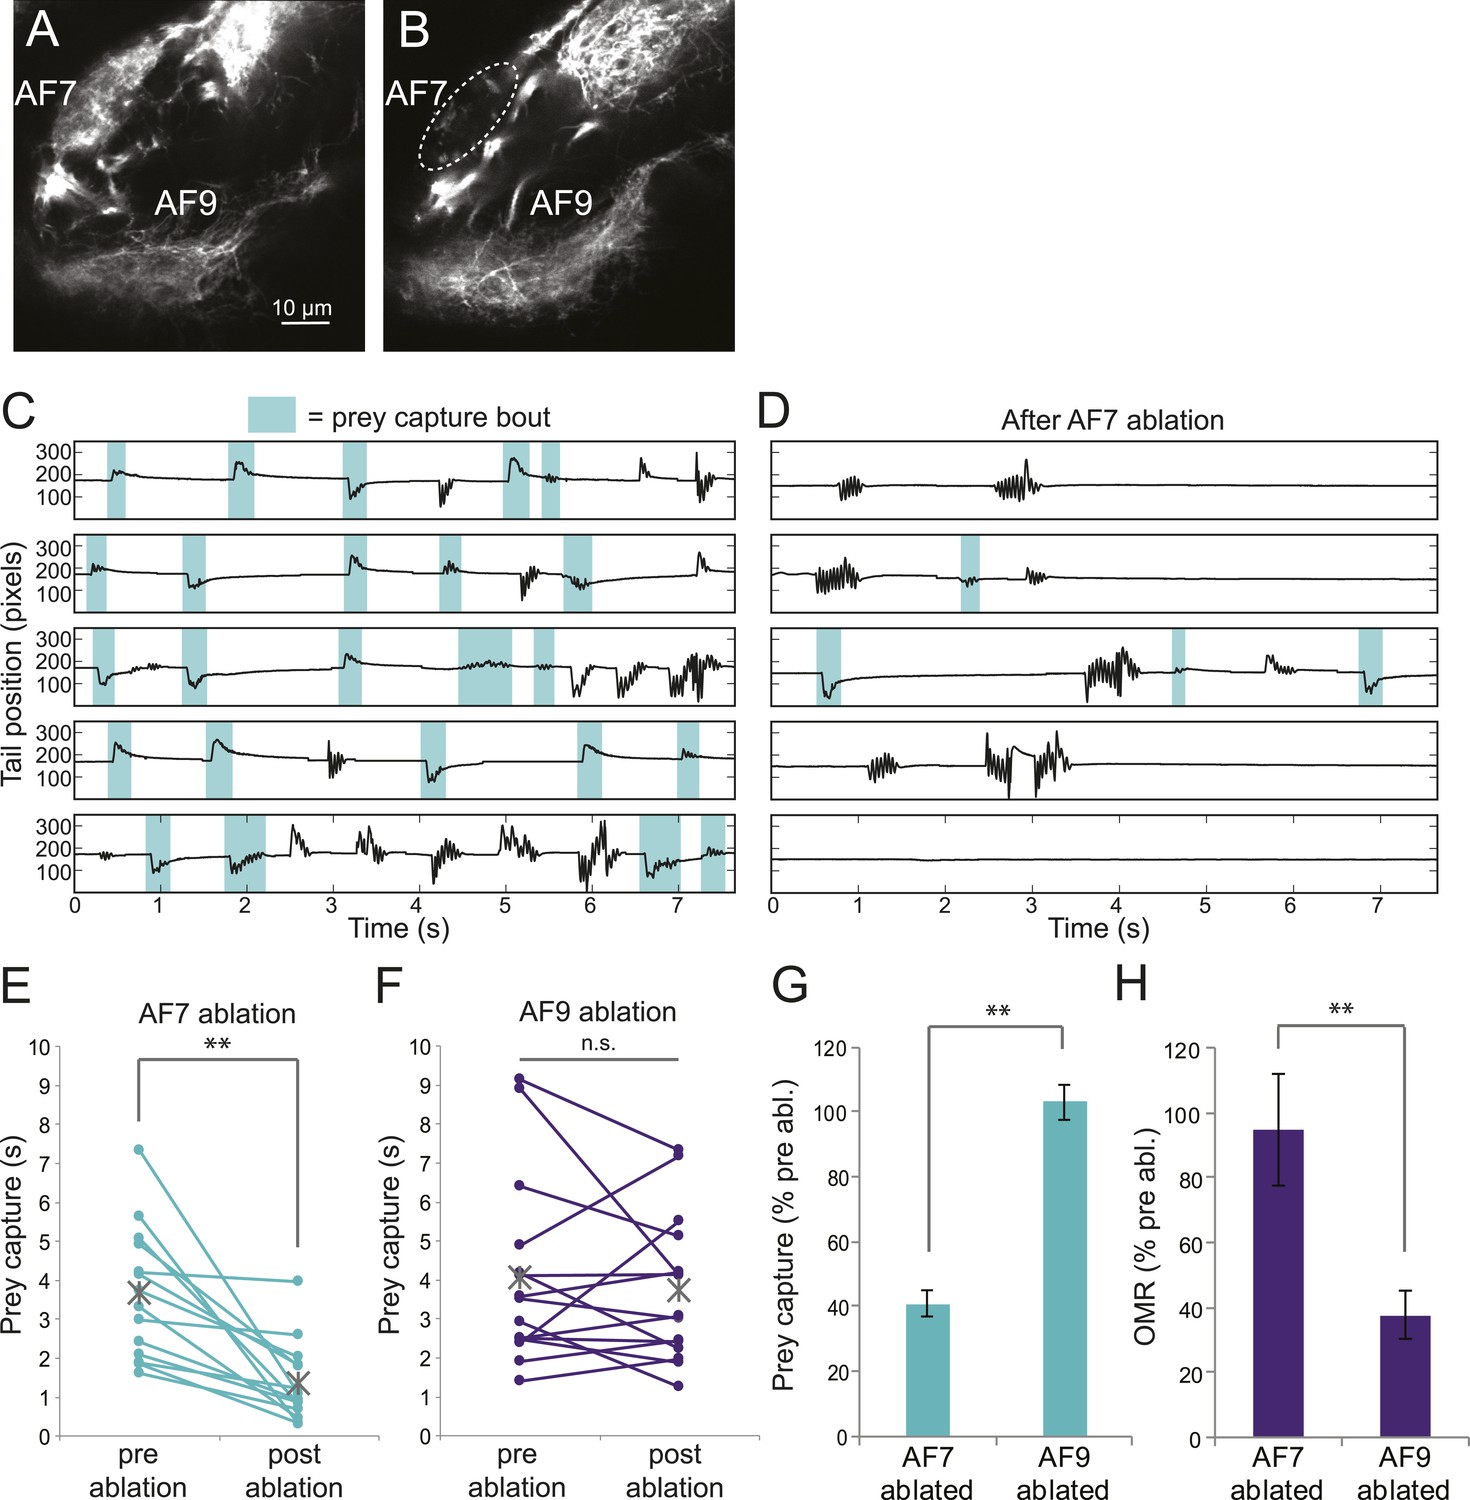
Ablation of AF7 markedly reduces prey capture behavior.
(A) Intact Ath5:Gal4, UAS:Dendra larva at 8dpf. (B) Ath5:Gal4, UAS:Dendra larva after ablation of AF7 neuropil. (C) Pre-ablation response to paramecia in one example larva. Behavior was recorded for 5 min and the videos were edited to display all swim bouts. Each bout was classified by the same SVM as in Figure 4C. (D) The same larva after 2P laser ablation of AF7. (E) Total duration of prey capture bouts during the five 1 min trials before and after AF7 ablations. n = 14 larvae. p = 2.59 × 10⁻⁴, Wilcoxon rank sum test. (F) Prey capture time before and after AF9 ablations. n = 15 larvae. (G) Duration of prey capture bouts after ablation as a percent of initial prey capture time. p = 2.68 × 10⁻⁴, Wilcoxon rank sum test. (H) Optomotor response to moving gratings after AF7 and AF9 ablation. AF7ablation n = 7 larvae, AF9 ablation n = 9 larvae. p = 5.2 × 10⁻³, Wilcoxon rank sum test. Error bars = ±SEM. See Figure 6—figure supplement 1 for AF7 and SO axon anatomy and periventricular neuron activity before and after ablation.
Figure 6—figure supplement 1
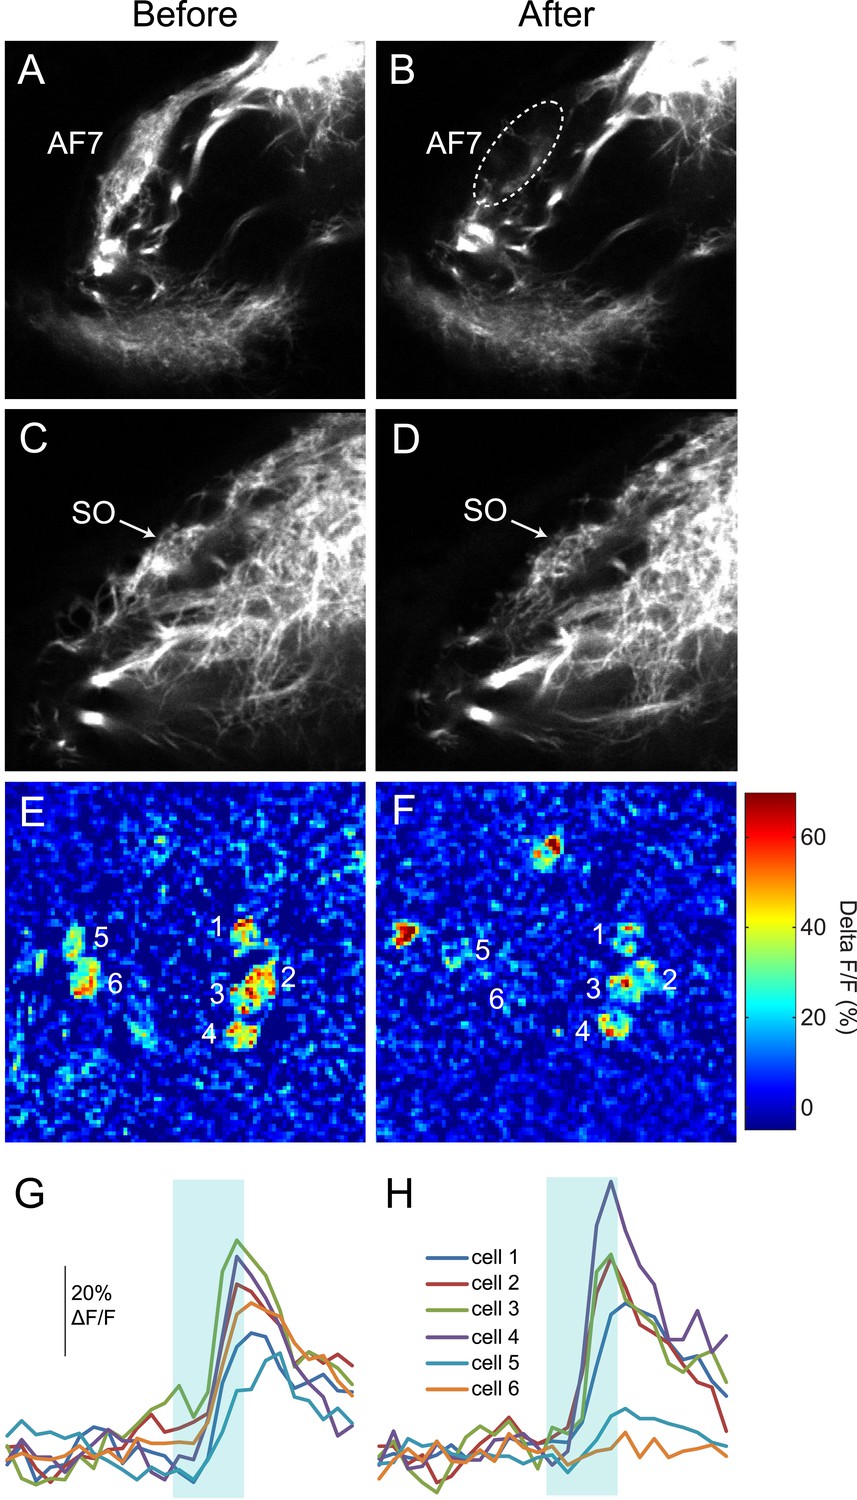
RGC axons in AF7 and the tectum after AF7 ablation.
(A) Ath5:Gal, UAS:Dendra transgenes label RGC axons in AF7 and 9. (B) The same larva 3 hr after laser ablation of AF7. (C) RGC axons in the tectum in the same larva as above, before ablation. (D) SO axons 3 hr after AF7 ablation. (E) Responses of tectal neurons in the same larva as in A-D. Periventricular neurons of the tectum labeled by elavl3:GCaMP5G responded to a prey stimulus (3° dot moving at 90°/s). (F) The same field of view after AF7 ablation. (G) Traces showing the responses of the individual cell bodies. (H) Responses in the same six cells after AF7 ablation.
Figure 7 with 1 supplement

Morphologies of pretectal AF7 neurons.
(A) Single cells were electroporated with tetramethylrhodamine (TMR) dextran (cyan) in an Ath5:Gal4, UAS:GCaMP6s larva (red). These neurons innervate AF7, as well as the adjacent non-retinorecipient neuropil in the same plane. (B) The cell imaged in (A) projects to the rostral tectum. (C) Tracing of the same cell, showing pretectal and tectal arbors. (D–E) Confocal images of a single electroporated cell in an Ath5:Gal4, Gal4s1171t UAS:GCaMP6s larva. (F) Tracing of the same cell as in (D) and (E) overlaid on a confocal image showing the Gal4s1171t labeling to identify the nMLF. See Figure 7—figure supplement 1 for more examples.
Figure 7—figure supplement 1

Examples of AF7 neurons.
(A–C). Tracings of example neurons with projections in AF7 and the tectum. (D) Overlay of tracings from four neurons with arbors in AF7 and the nMLF. In two cases, the projections toward the hindbrain became too faint to follow.
Figure 8
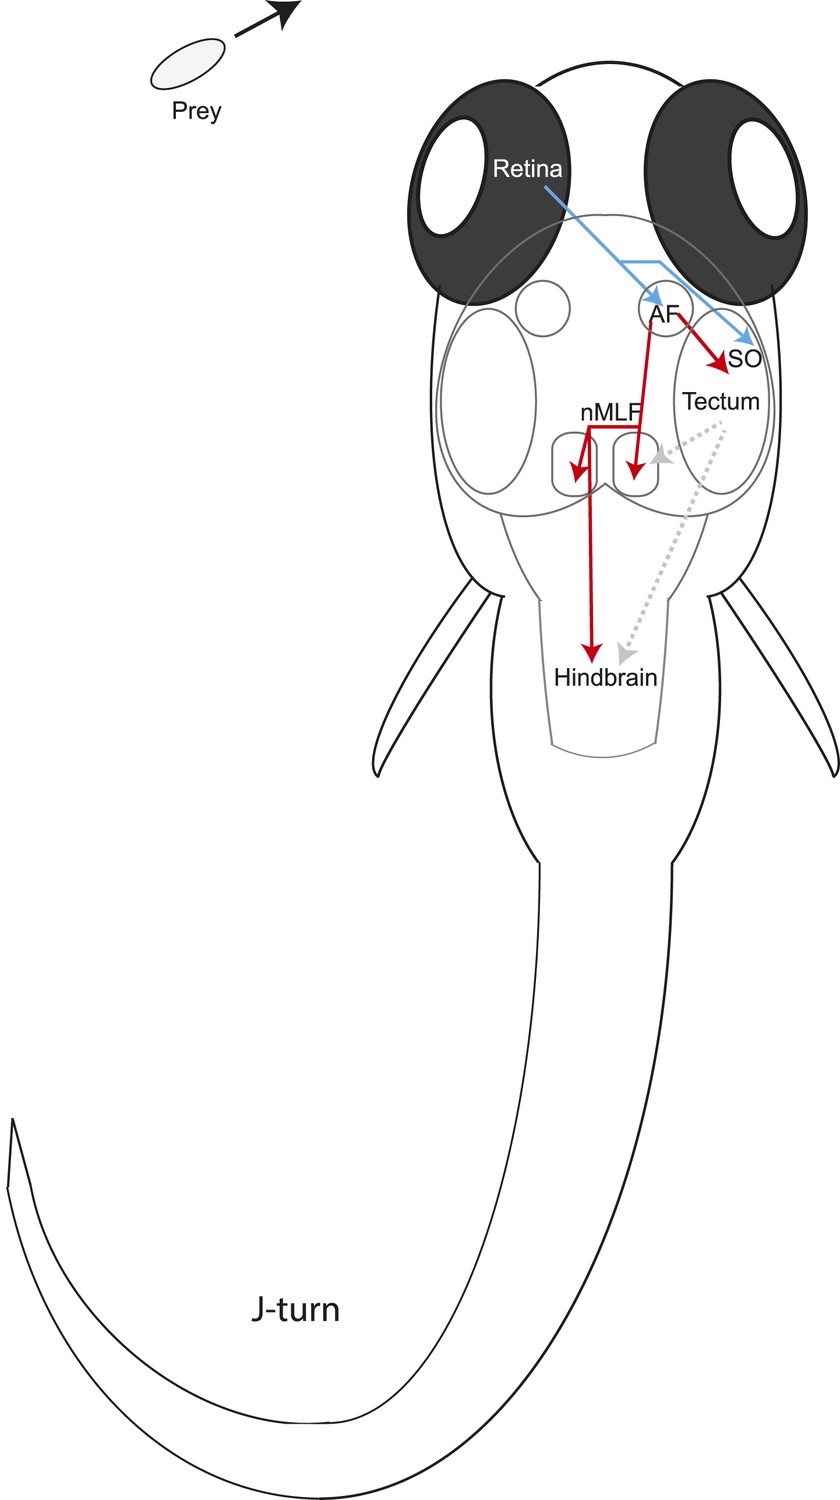
Model for prey capture circuitry.
A prey stimulus on the left activates RGCs in the left eye (blue) which project to AF7 and the SO layer of the right tectum. Pretectal neurons (red) arborize in AF7 and send projections to the tectum or the nMLF and hindbrain. Activation of this circuitry produces a j-turn to the left, turning the larva in the direction of the prey. Previous studies have demonstrated connections between the tectum and nMLF (Gahtan et al., 2005) and between the tectum and hindbrain (Robles et al., 2011) (gray arrows).
Videos
Video 1
Prey capture in response to virtual prey.
A head-fixed larva responds to a 3° dot moving at 90°/s.
Video 2
AF7 RGC axons respond to paramecia.
Ath5:Gal4, UAS:GCaMP6s axons are activated in the presence of paramecia. Pseudocolor represents the ratio of the ΔF/F with paramecia to without. Scale is the same as in Figure 4D. Imaging frame rate was 3.3 Hz.
Download links
A two-part list of links to download the article, or parts of the article, in various formats.
Downloads (link to download the article as PDF)
Open citations (links to open the citations from this article in various online reference manager services)
Cite this article (links to download the citations from this article in formats compatible with various reference manager tools)
A dedicated visual pathway for prey detection in larval zebrafish
eLife 3:e04878.
https://doi.org/10.7554/eLife.04878


