Reconstitution of a eukaryotic replisome reveals suppression mechanisms that define leading/lagging strand operation
- Howard Hughes Medical Institute, Rockefeller University, United States
Figures
Figure 1 with 2 supplements
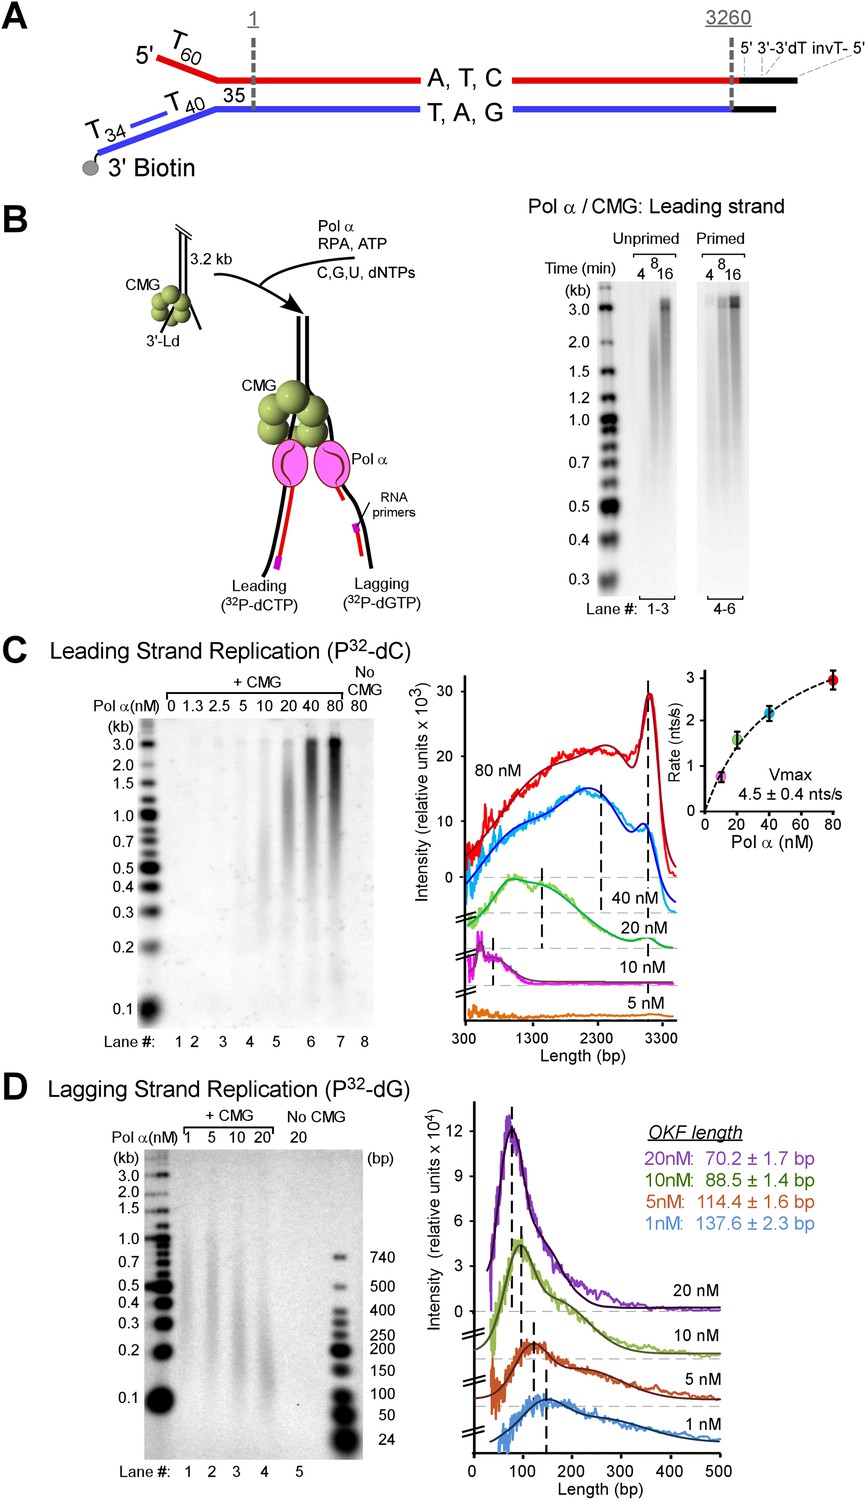
Pol α primes and extends leading and lagging strands with CMG helicase.
(A) Scheme of the nucleotide-biased 3.2 kb fork substrate used in our experiments, explained further in ‘Materials and methods’. (B) Left: scheme of the assay. CMG is assembled onto the linear 3.2 kb forked DNA in the presence of 0.1 mM AMP-PNP, 60 μM dATP, followed by Pol α and RPA along with 5 mM ATP, 60 μM dTTP and 60 μM dGTP, 200 μM each rCTP, rUTP, rGTP, 20 μM dCTP, and 10 μCi 32P-dCTP, as described in ‘Materials and methods’. The nucleotide bias of the forked DNA enables labeling either the leading or lagging strand using 32P-dCTP or 32P-dGTP, respectively. Right: autoradiograph of leading strand products using unprimed (lanes 1–3) or primed (lanes 4–6) forked DNA. (C) Left: autoradiograph of leading strand replication products upon titrating Pol α into 20 min reactions. Right: scans of the gel lanes of leading strand products; the gel lanes were analyzed by Typhoon laser scanner, and the lane profiles were normalized to the corresponding molecular weight at each pixel in order to correct for the fact that longer products incorporate more radiolabel (α32P-dCTP) than shorter products. Replication reactions are plotted at the same scale. Each line trace was fit to a multiple Gaussian function, shown as a thin dashed line in each scan. The vertical dashed gray lines indicate the average rate of replisome progression at each concentration of Pol α examined. The inset graph plots the average replication rate vs the concentration of Pol α; the maximal rate (Vmax) of 4.5 ± 0.4 ntd/s was obtained by fitting of the data with a Michaelis–Menten-type equation. (D) Left: autoradiograph of lagging strand replication products using the indicated amounts of Pol α in 20 min reactions. Right: scans of the gel lanes of lagging strand Okazaki fragments showed in Figure 1D. Gel lanes were analyzed as described in (C). The average Okazaki fragment size obtained from the fit to the data is listed as an inset in the figure for each concentration of Pol α used. Omission reactions pertaining to Figure 1C,D are shown in Figure 1—figure supplement 1.
Figure 1—figure supplement 1
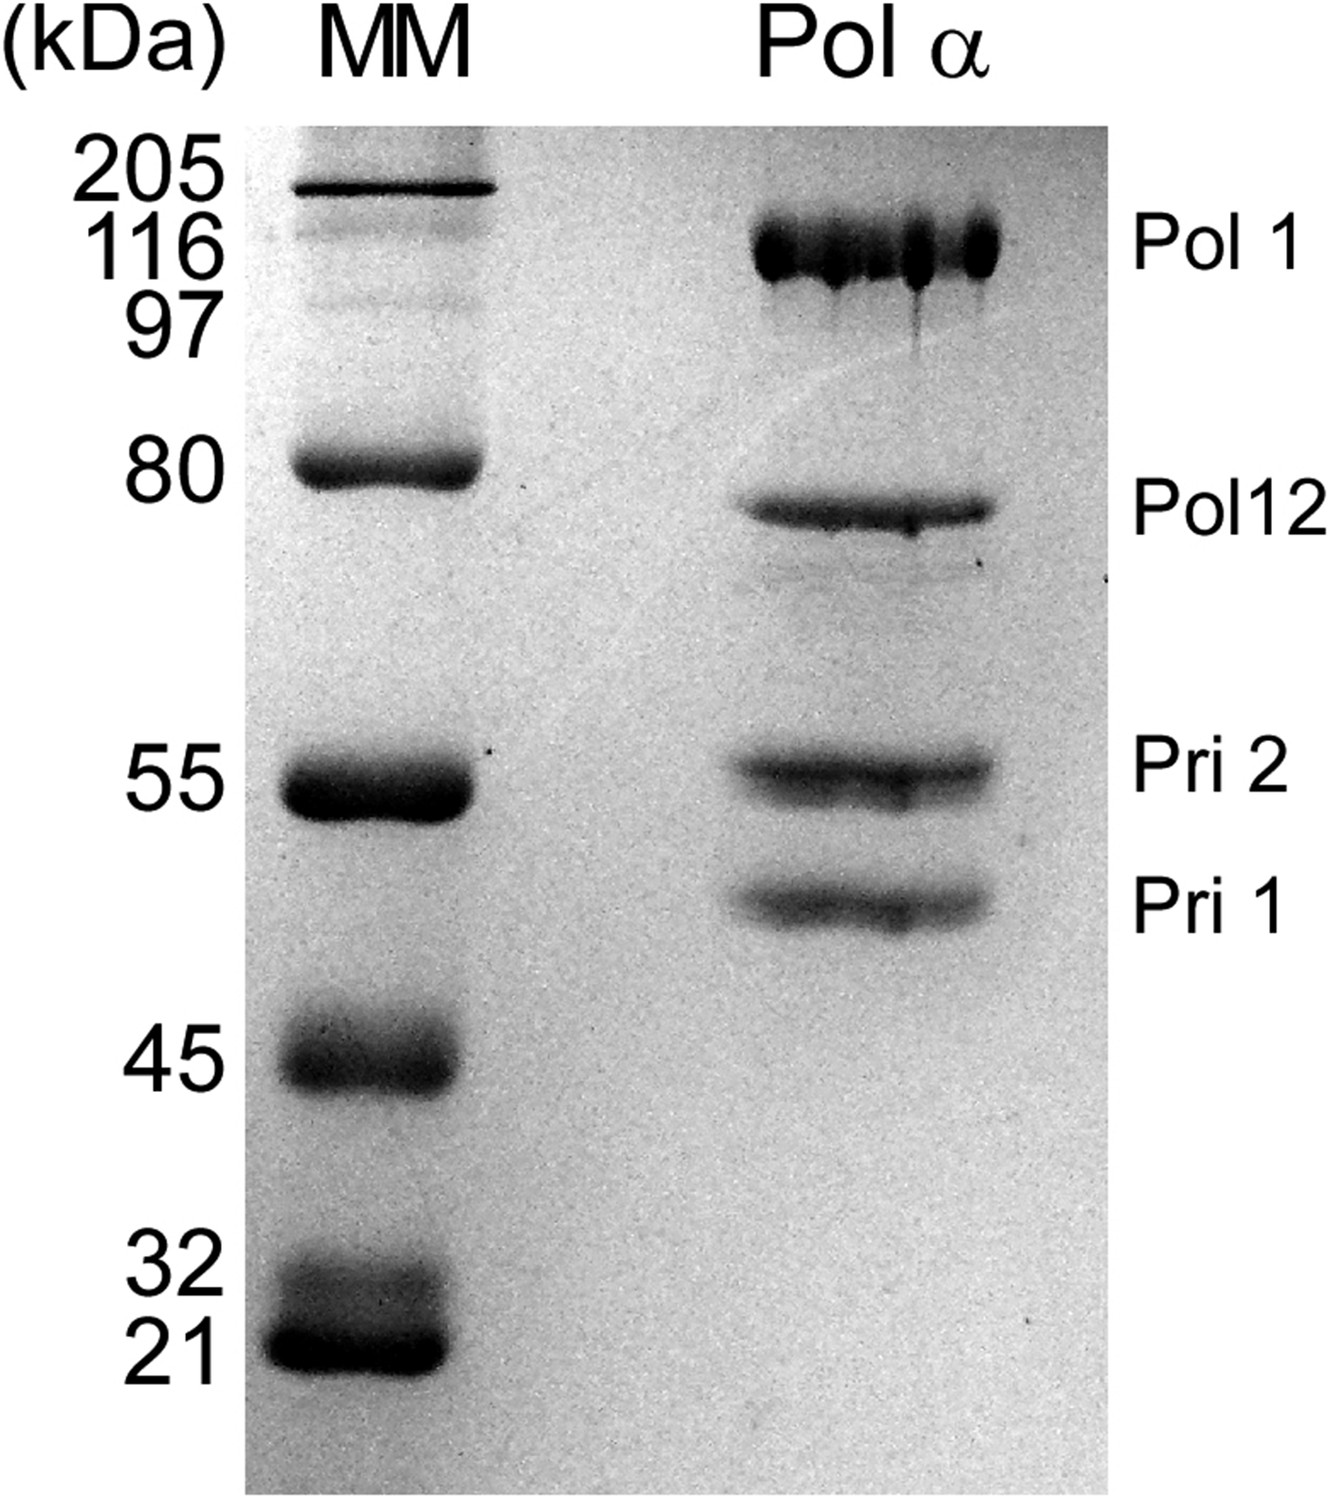
SDS-PAGE of purified Pol α.
Pol α (2 μg) was analyzed in a 8% SDS polyacrylamide gel stained with Coomassie Brilliant Blue. The left lane, labeled ‘MM’ represents the Broad Molecular Weight markers (Bio-Rad). Subunits, labeled at the right, were confirmed by mass spectrometry analysis. The mass spectrometry analysis of the gel bands, and regions between bands, showed no trace of Ctf4 or Mcm10.
Figure 1—figure supplement 2
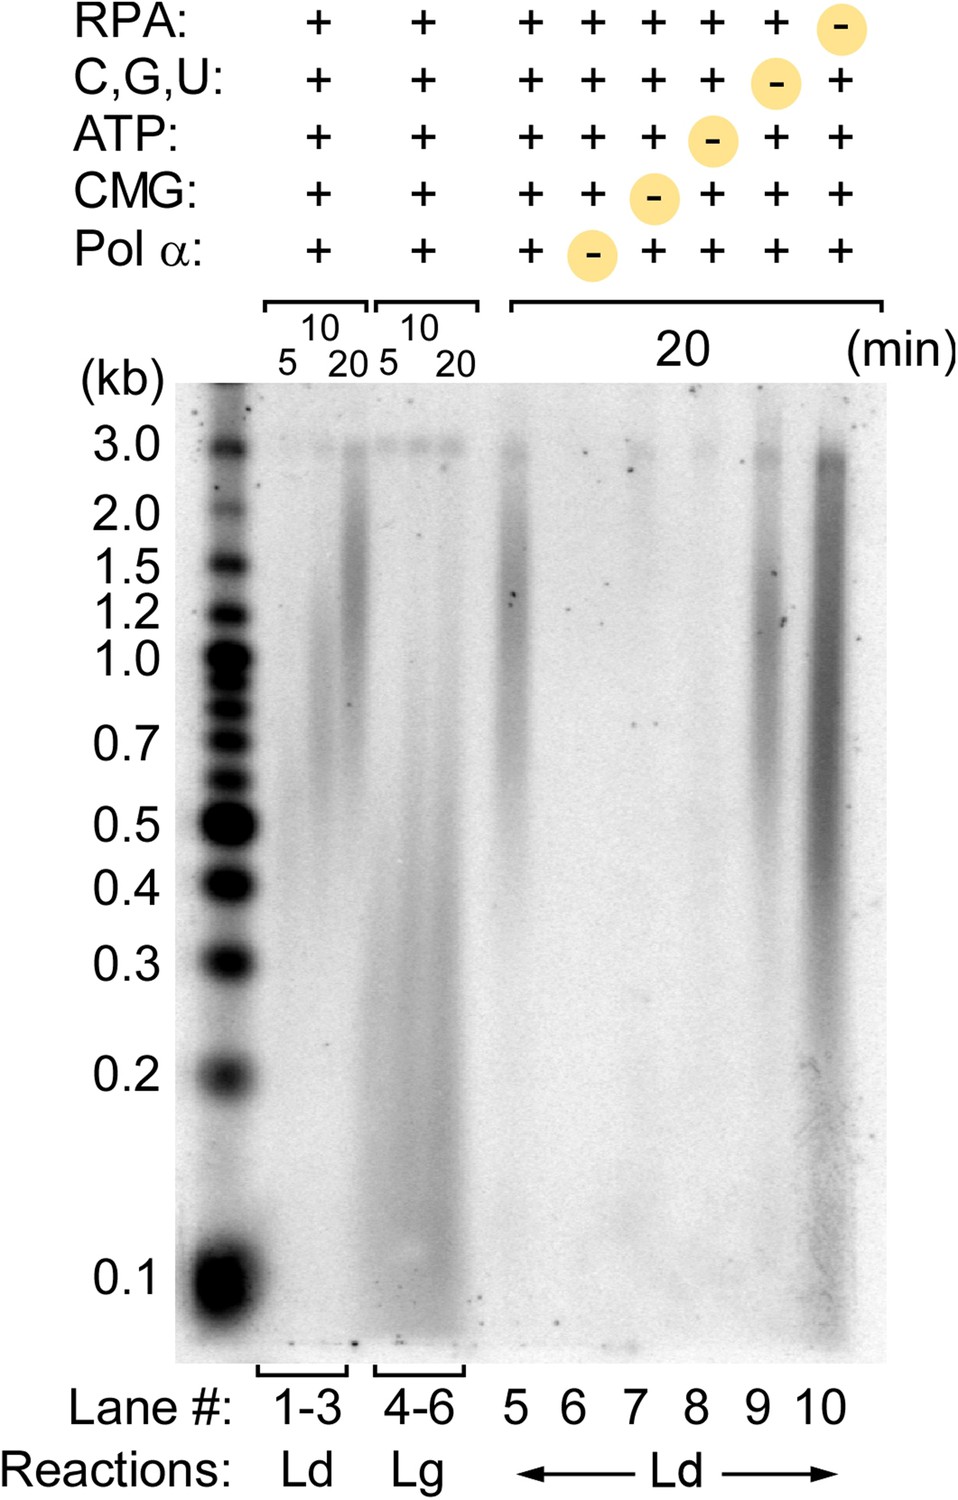
Pol α activity on the 3 kb forked DNA is dependent on CMG.
Alkaline gel of omission assays for the Pol α, CMG, RPA leading strand replication reactions illustrated in Figure 1B,C. Lanes 1–6 show a time course of the complete replication reactions for the leading (lanes 1–3) and lagging strands (lanes 4–6). Lanes 5–10 illustrate leading strand products obtained upon omission of the indicated components at the top of the gel.
Figure 2
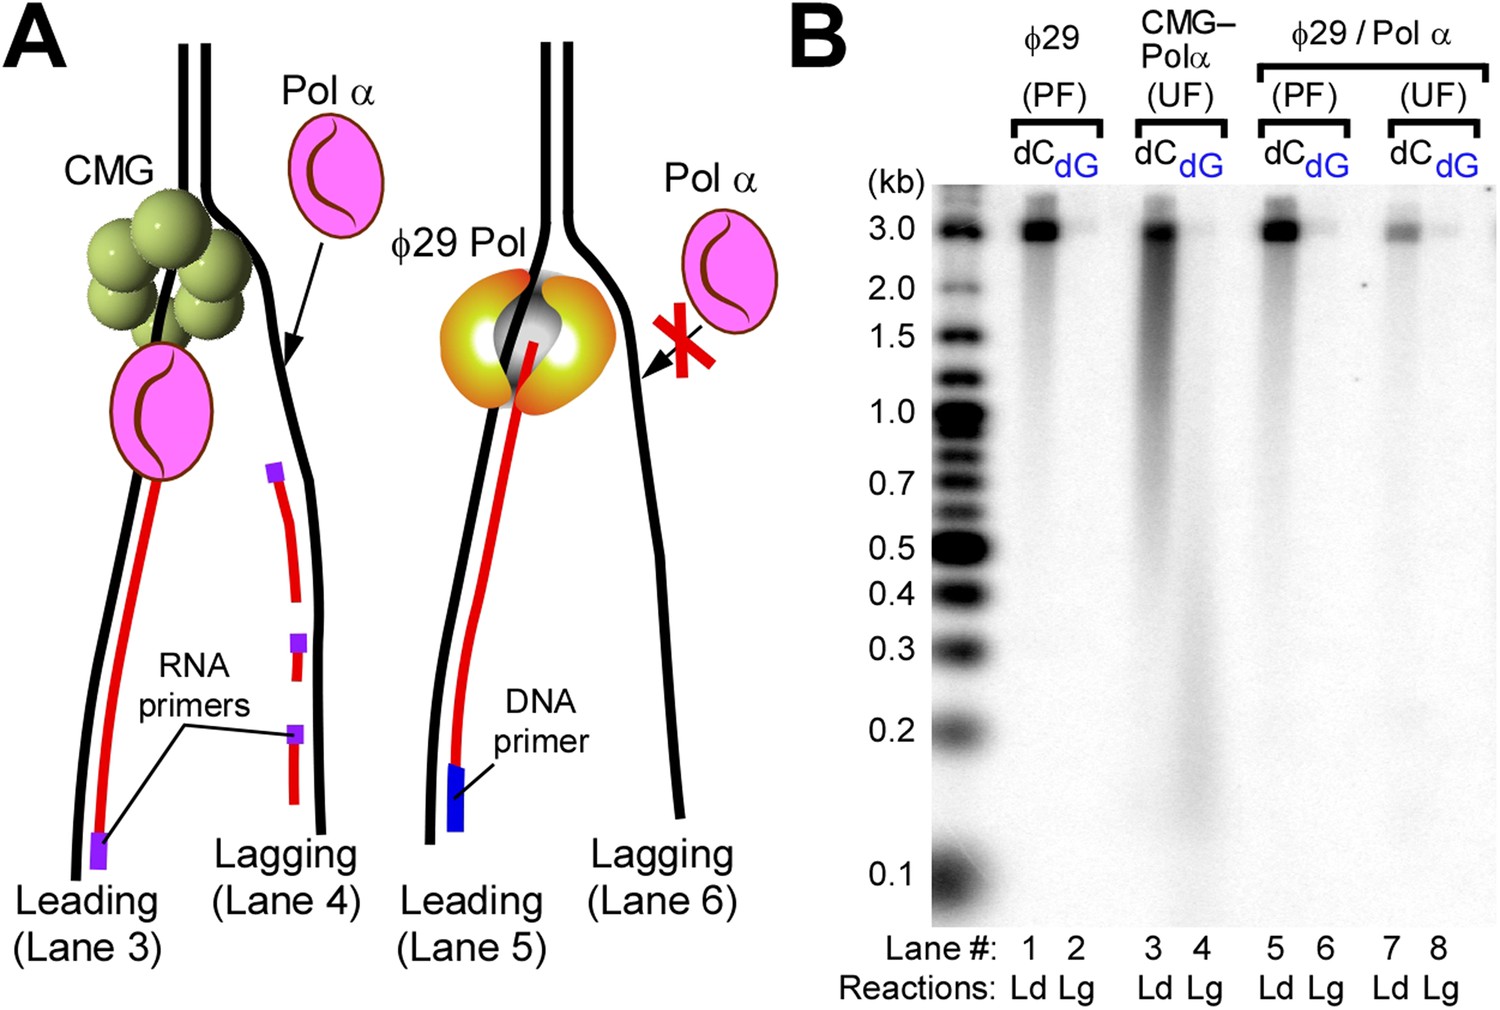
Pol α requires CMG for priming activity during unwinding of forked DNA.
(A) Scheme of assays comparing Pol α activity using either CMG helicase or the strand displacing ϕ29 polymerase. (B) Autoradiograph of DNA products using either 32P-dCTP (leading) or 32P-dGTP (lagging). Use of a DNA-primed leading strand fork (PF) or an unprimed fork (UF) is indicated in the figure. Pol α was present at 10 nM, and reactions were for 20 min. Lanes 1 and 2 represent control reactions of ϕ29 polymerase alone.
Figure 3
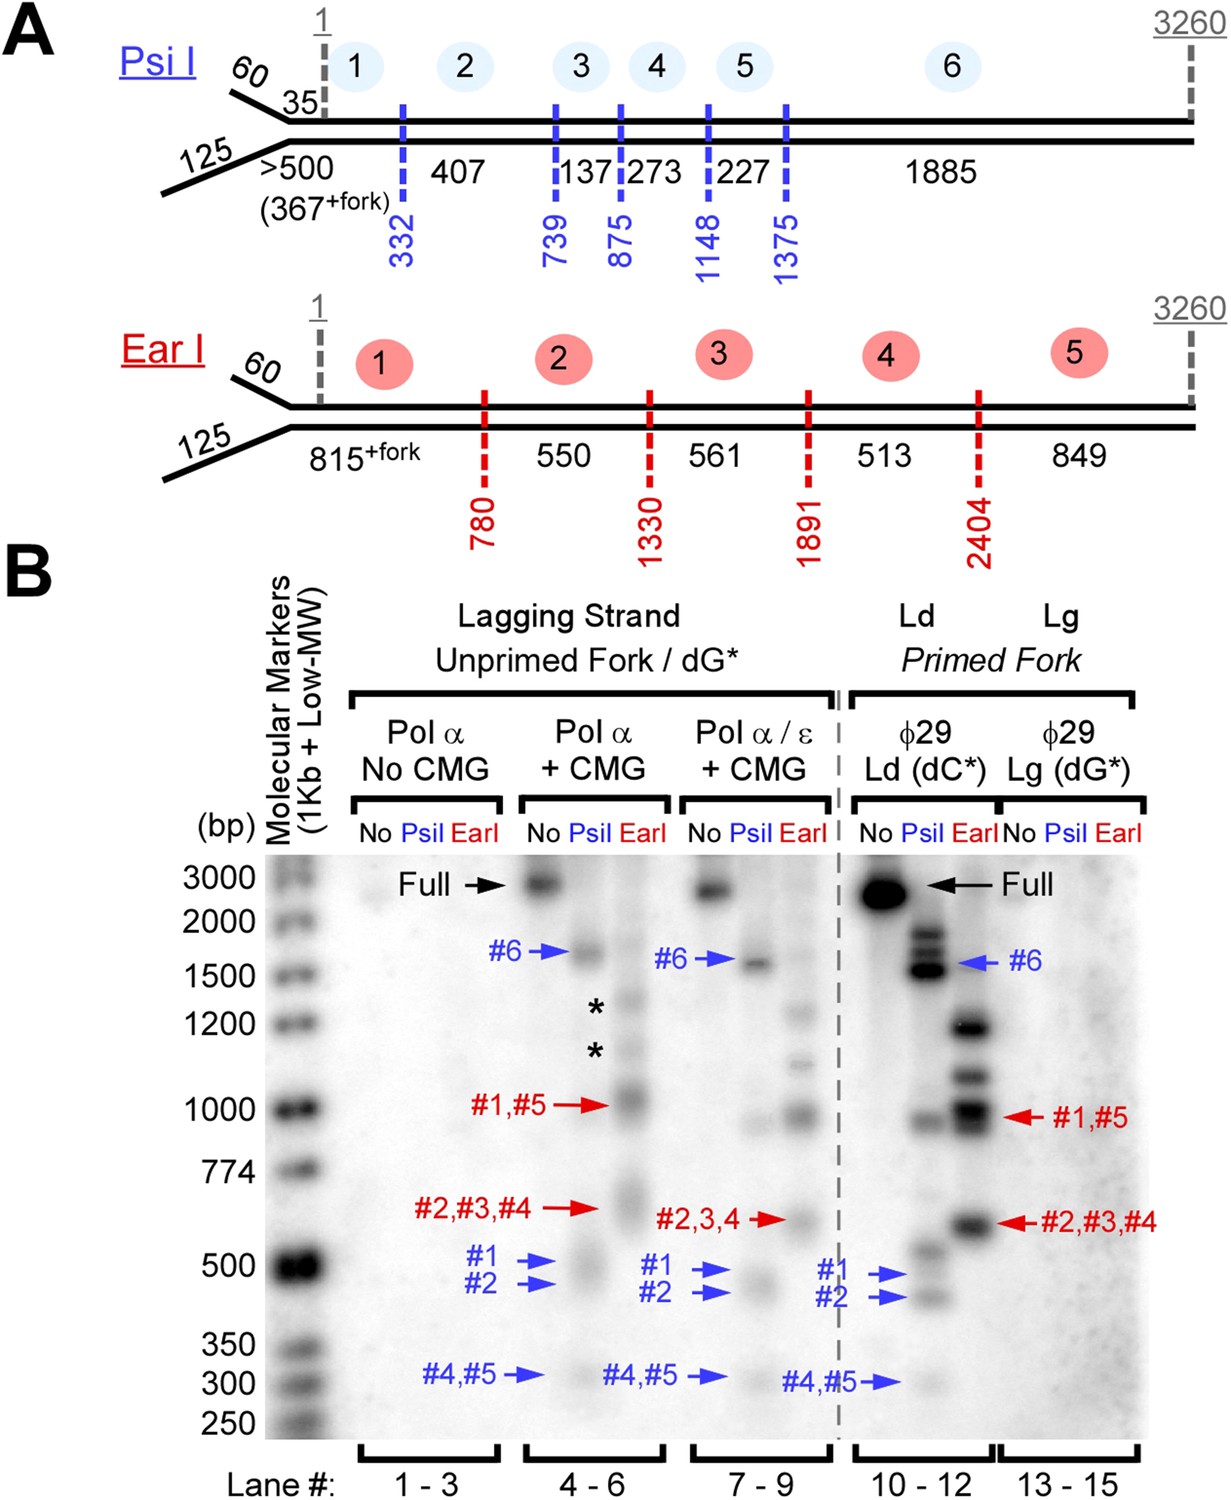
Okazaki Fragments are produced along the entire DNA.
(A) Restriction enzyme map of the 3.2 kb substrate for Psi I and Ear I. (B) Lagging strand reactions were performed as detailed in ‘Materials and methods’ using an unprimed forked DNA, CMG, RPA, and either Pol α (lanes 4–6) or Pol α and Pol ε (lanes 7–9), then were either untreated (lanes 4, 7), treated with Psi I (lanes 5, 8), or treated with Ear I (lanes 6, 9). A control leading strand reaction using only ϕ29 Pol is shown in lanes 10–12. Pol α without CMG (lanes 1–3) and ϕ29 alone (lanes 13–15) gave no lagging strand products. The (*) mark incomplete digestion products. The reaction products were analyzed on a native 2% agarose gel.
Figure 4 with 3 supplements
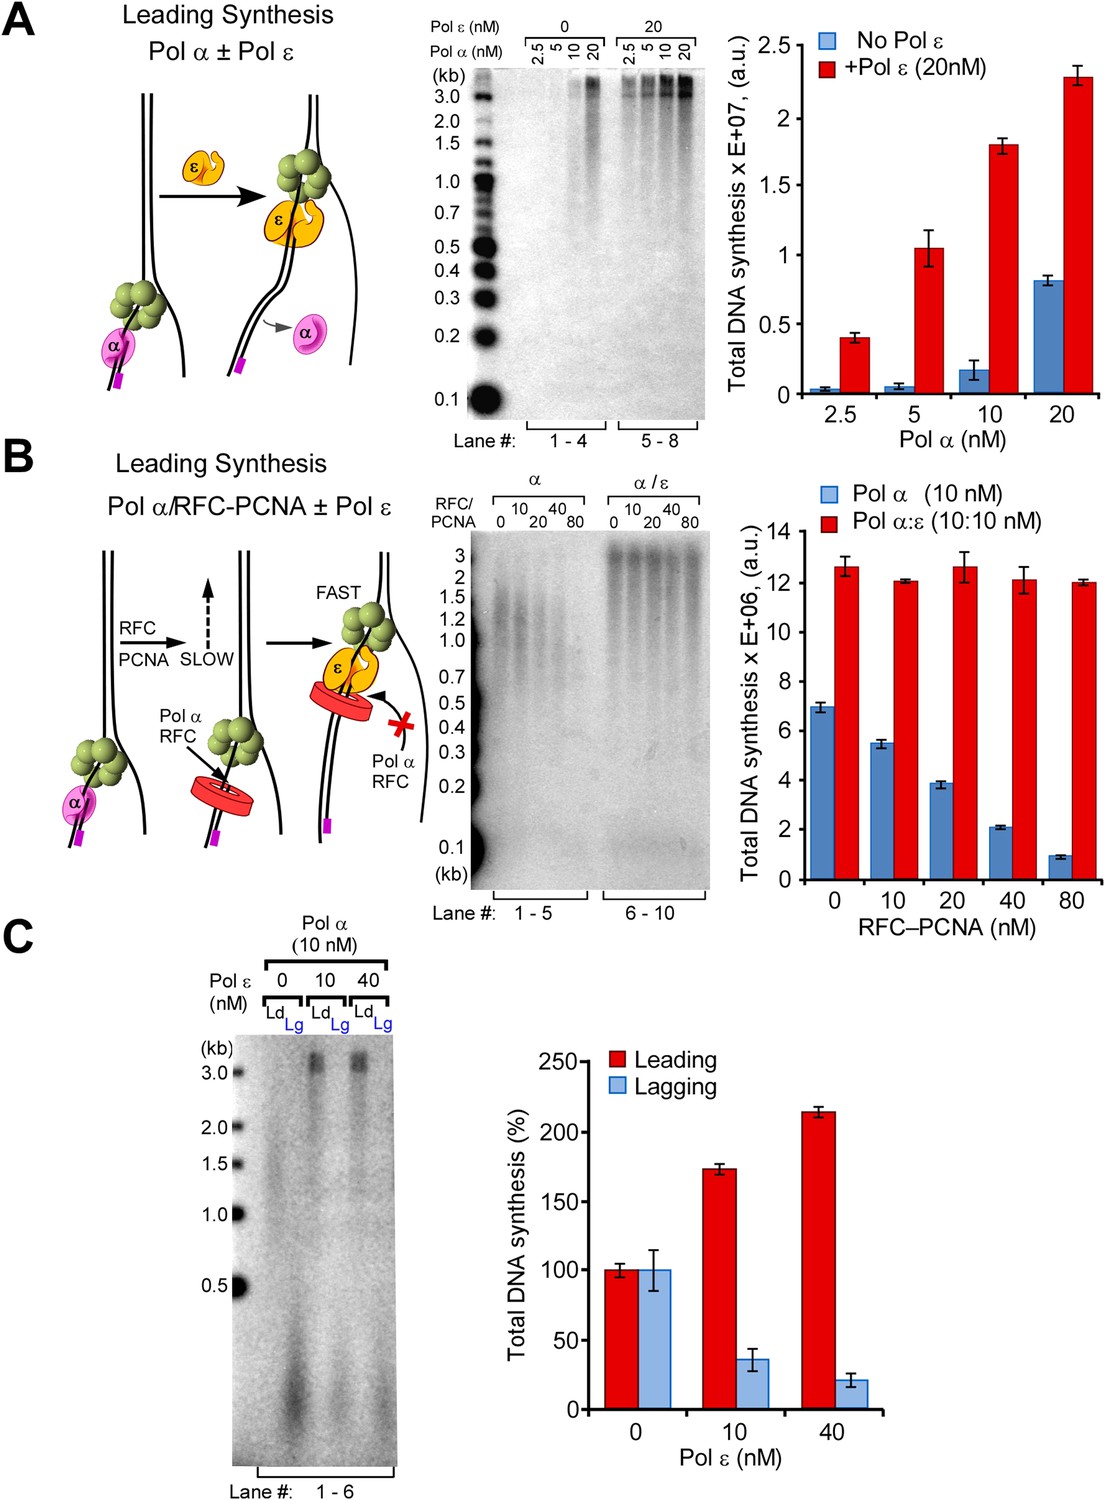
Pol ε switches with Pol α on the leading strand but is not active on the lagging strand.
(A) Left: scheme of the assay. Middle: titration of Pol α into leading strand reactions in the absence of Pol ε (lanes 1–4) or in the presence of 20 nM Pol ε (lanes 5–8). The reactions were 20 min and contained unprimed DNA fork template. Right: histogram illustrating total DNA synthesis obtained from Typhoon laser scan analysis in Figure 4—figure supplement 1A (the error bars represent Standard Fit Errors obtained from the Gaussian fit analysis). (B) Left: scheme of the assay. Titration of RFC-PCNA into a primed leading strand assay containing 10 nM Pol α with or without 10 nM Pol ε. Right: RFC-PCNA inhibits Pol α (lanes 1–5) probably by competing for the 3′ terminus as illustrated. When present, Pol ε rapidly extends the leading strand and is not inhibited by RFC-PCNA (lanes 6–10). Replication reactions were performed in the presence of 32P-dCTP for 15 min. Right: histogram illustrating total DNA synthesis obtained from Typhoon laser scan analysis in Figure 4—figure supplement 1B (the error bars represent Standard Fit Errors obtained from the Gaussian fit analysis). (C) Left: leading and lagging strand synthesis is monitored in the same reaction plus or minus Pol ε. Each reaction was divided to separately monitor either the leading (32P-dCTP) or lagging (32P-dGTP) strand. Pol ε is absent in the reaction of lanes 1 and 2, and Pol ε is present in the reaction of lanes 3 and 4. Right: histogram illustrating total DNA synthesis obtained from Typhoon laser scan analysis in Figure 4—figure supplement 1C (the error bars represent Standard Fit Errors obtained from the Gaussian fit analysis). Lane analysis of the autoradiographs from panels A, B, and C are shown in Figure 4—figure supplement 1.
Figure 4—figure supplement 1
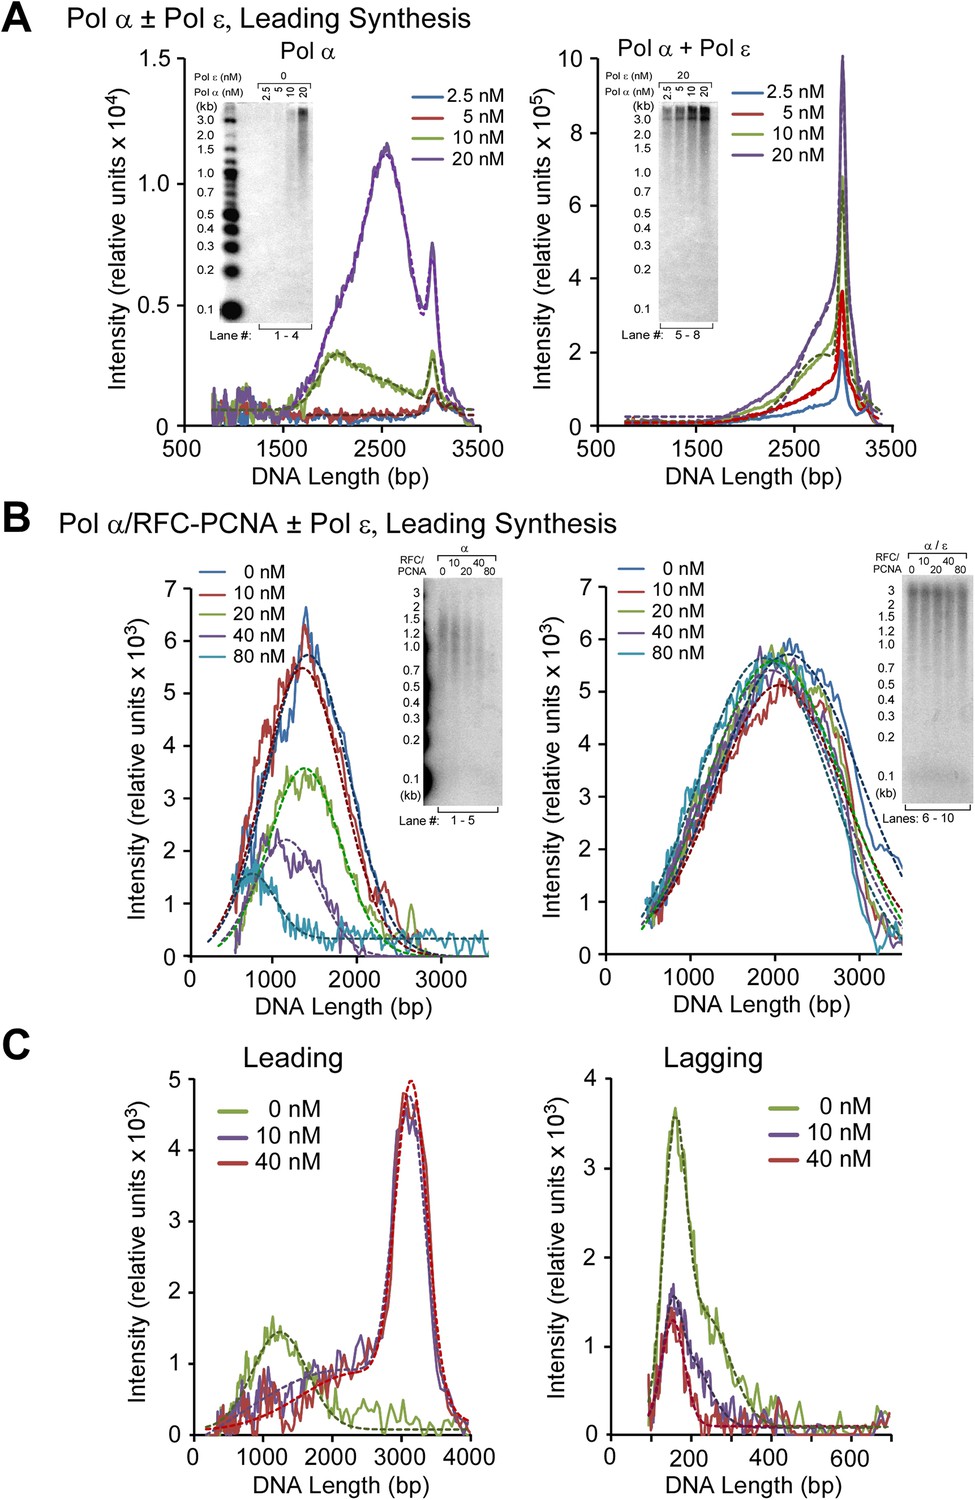
Analysis of replication products in Pol α and Pol α−ε titrations illustrated in Figure 4A–C.
The autoradiographs shown in Figure 4 were analyzed by Typhoon laser scanner, and the lane profiles were normalized to the corresponding molecular weight at each pixel, as previously described (Kurth et al., 2013). This corrects for the fact that longer products incorporate more radiolabel (α32P-dCTP or α32P-dGTP) than shorter products. Each line trace was fit to a single or multiple Gaussian functions, shown as a thin dashed line in each scan. For ease of understanding, each of the panels A, B, and C correspond to the autoradiographs displayed in Figure 4A–4C, respectively (a cutout of the gels in Figure 4 are inserted, for ease of identification).
Figure 4—figure supplement 2
Pol ε excludes Pol α from the leading strand by taking over the primer whether RFC and PCNA are present or not.
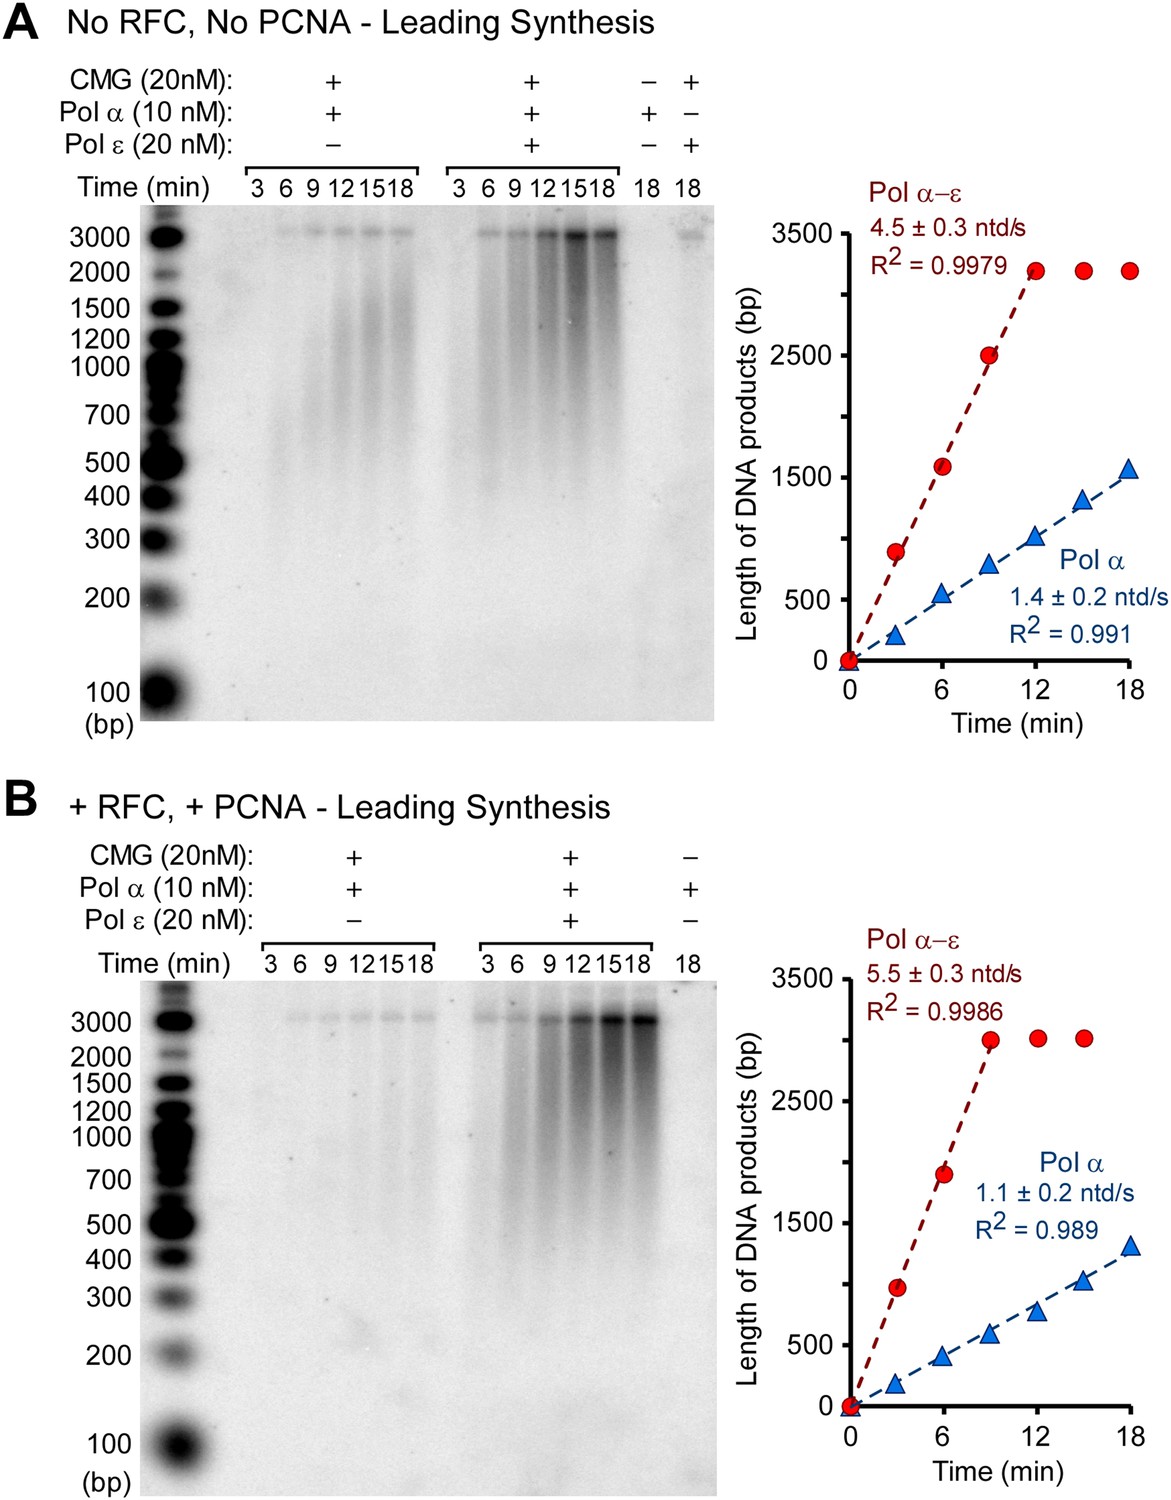
(A) Autoradiogram of CMG mediated Pol α extension of the leading strand on the unprimed 3.2 kb forked DNA, in the presence or absence of Pol ε, as indicated in the figure. Reactions were performed for the indicated times and otherwise performed as described in ‘Materials and methods’. The gel lanes were analyzed by Typhoon laser scanner (as in Figures 1, 4), and the plot on the right side quantitates the progression of DNA product length at the times indicated in the gel. The numbers in the plots represent the rate of the Pol α (blue) or Pol α-ε (red) obtained from the linear fit of the data points. (B) Autoradiogram of reactions performed as described in panel A, except 20 nM each of RFC and PCNA were present in all reactions. The plot on the right quantitates the data as described for panel A.
Figure 4—figure supplement 3
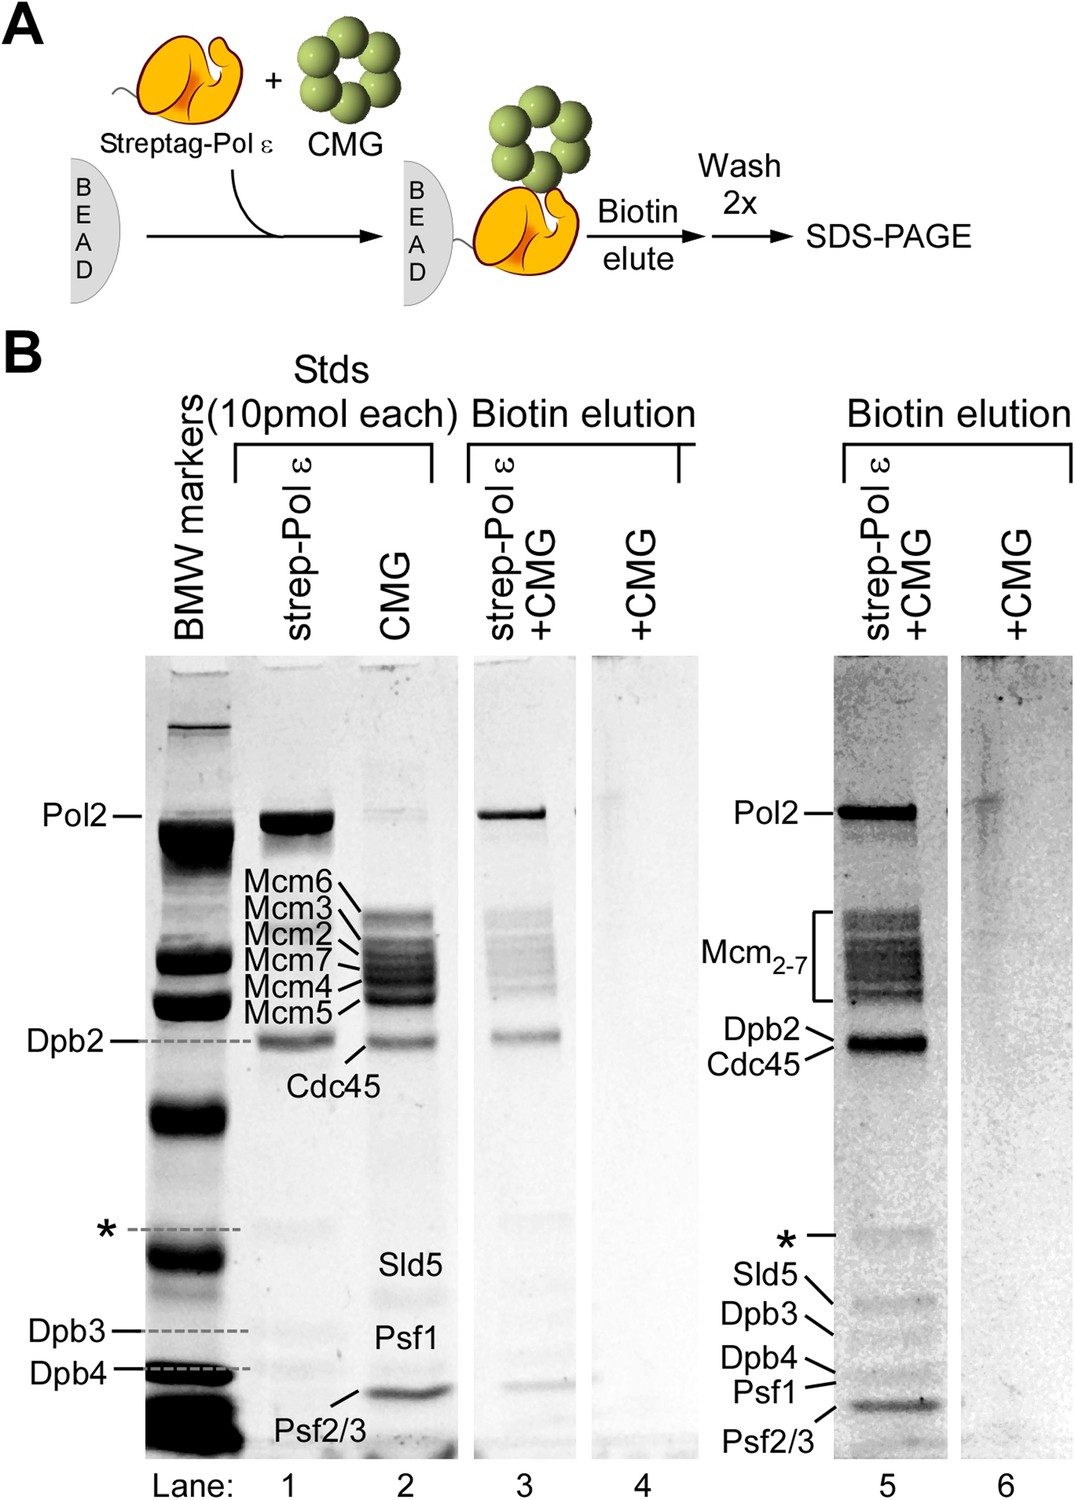
CMG and Pol ε form a stable CMGE complex.
(A) Scheme of the bead assay to detect protein interactions. CMG-Pol ε complex was bound to Strep-Tactin magnetic beads via a strep-Pol ε, then washed and eluted with biotin; products were analyzed by 8% SDS-PAGE. Mixtures of proteins were as described in ‘Materials and methods’ and included 80 pmol strep-Pol ε and 120 pmol CMG. (B) SDS-Coomassie Blue stained PAGE of eluted protein complexes. The left lane, labeled ‘BMW markers’ represent the Broad Molecular Weight markers (Bio-Rad); lanes 1 and 2 show the protein preps used in the analysis. The location of each subunit is indicated. Cdc45 and Dpb2 co-migrate. The ‘*’ marks an impurity present in the strep-Pol ε prep. Lane 3 illustrates the biotin elution of the CMGE complex. Lane 4 represents the negative control in which the same amounts of CMG was mixed, in the absence of strep-Pol ε, then incubated with the beads, washed and eluted with biotin. The clear spaces between the last two lanes indicate these two lanes were taken from the same gel but were not adjacent to one another. Lanes 5 and 6 are a higher contrast of the lanes 3 and 4 to more clearly show the Sld5 and Psf1 subunits.
Figure 5 with 2 supplements
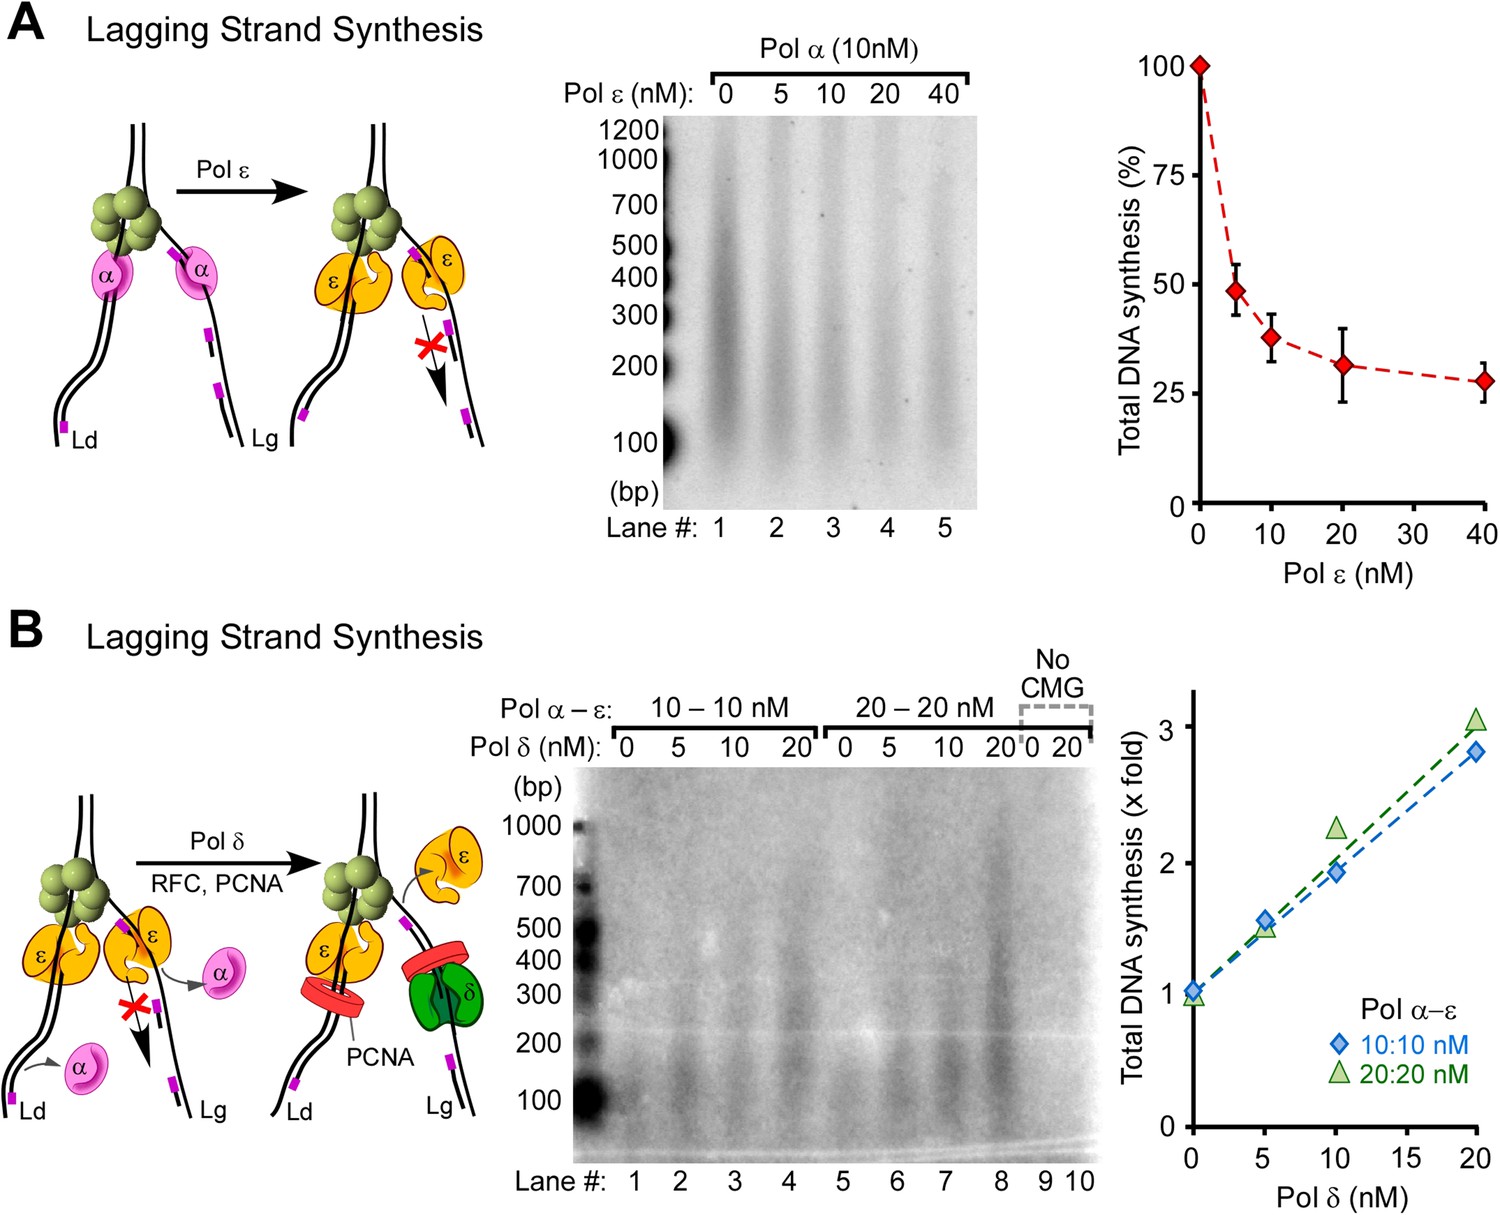
Pol δ functions on the ‘Pol ε suppressed’ lagging strand.
(A) Titration of Pol ε into lagging strand reactions containing Pol α/CMG results in inhibition of the lagging strand in the absence of RFC-PCNA. Similar reactions containing RFC-PCNA give even more inhibition on the lagging strand (Figure 5—figure supplement 1). Reactions were for 20 min. (B) Pol δ is titrated into lagging strand reactions containing Pol α, Pol ε, RFC-PCNA, and CMG under conditions in which Pol ε and RFC-PCNA inhibit lagging strand synthesis. Lagging strand reactions (32P-dGTP) contain 10 nM each Pol α and Pol ε (lanes 1–4), or 20 nM each Pol α and Pol ε (lanes 5–8); RFC-PCNA are at 20 nM each. CMG concentration was 24 nM in all reactions. Lanes 9 and 10 are controls with no CMG but contain 20 nM each of Pol α, Pol ε, RFC, PCNA, and either no Pol δ (lane 9) or 20 nM Pol δ (lane 10). Reactions were for 20 min. The plots on the right of panels A and B represent quantifications of lagging strand replication reactions (using α−32P-dGTP) as described in the legend of Figure 4.
Figure 5—figure supplement 1
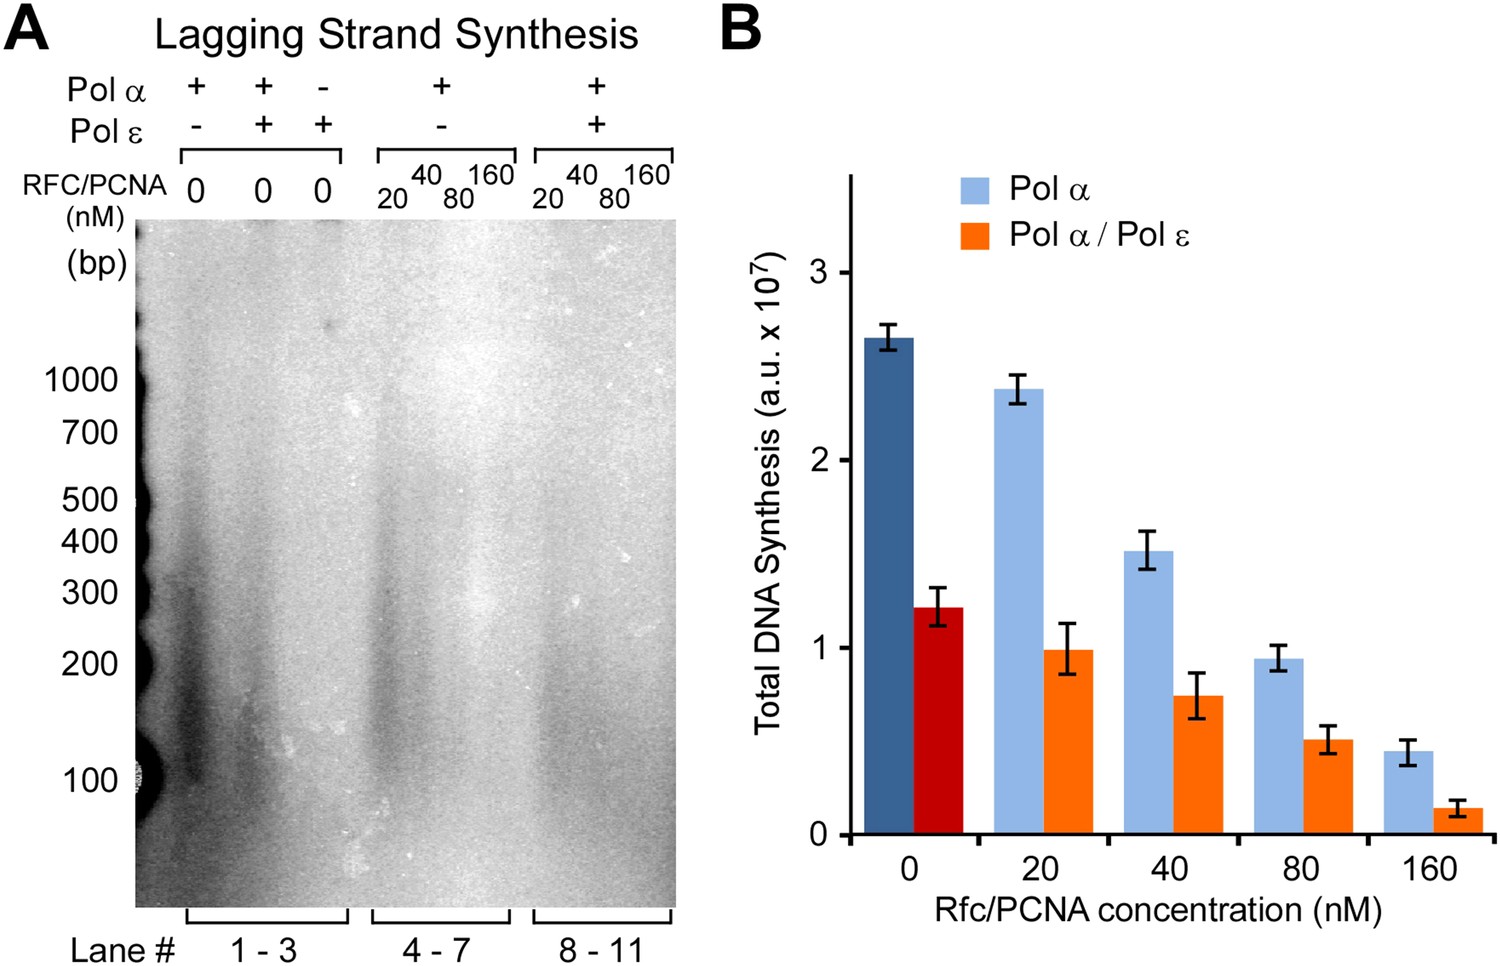
Pol ε and RFC/PCNA inhibit Pol α DNA polymerase on the lagging strand, but Pol ε cannot extend primed sites with or without RFC/PCNA.
(A) Autoradiograph of lagging strand replication reactions using α32P-dGTP. CMG is pre-incubated and loaded on unprimed forked DNA, as described in ‘Materials and methods’, then either 10 nM Pol α (lane 1), 10 nM each Pol α and Pol ε (lane 2) or only 10 nM Pol ε (lane 3) are added along with RPA, dNTPs, and rNTPs; RFC-PCNA are absent. The Pol ε/CMG control shows no product synthesis on the lagging strand, as expected. The analysis of DNA products in lanes 1 and 2 show a 2.1 fold decrease in total DNA synthesis for the Pol α/Pol ε reaction relative to Pol α alone. Next, RFC-PCNA was titrated into reactions containing 10 nM Pol α with no Pol ε (lanes 4–7), or 10 nM each of Pol α and Pol ε (lanes 8–11). Reactions were 20 min. (B) Histogram illustrating total DNA synthesis obtained from Typhoon laser scan analysis of the autoradiograph in panel A (the error bars represent Standard Fit Errors obtained from the Gaussian fit analysis).
Figure 5—figure supplement 2
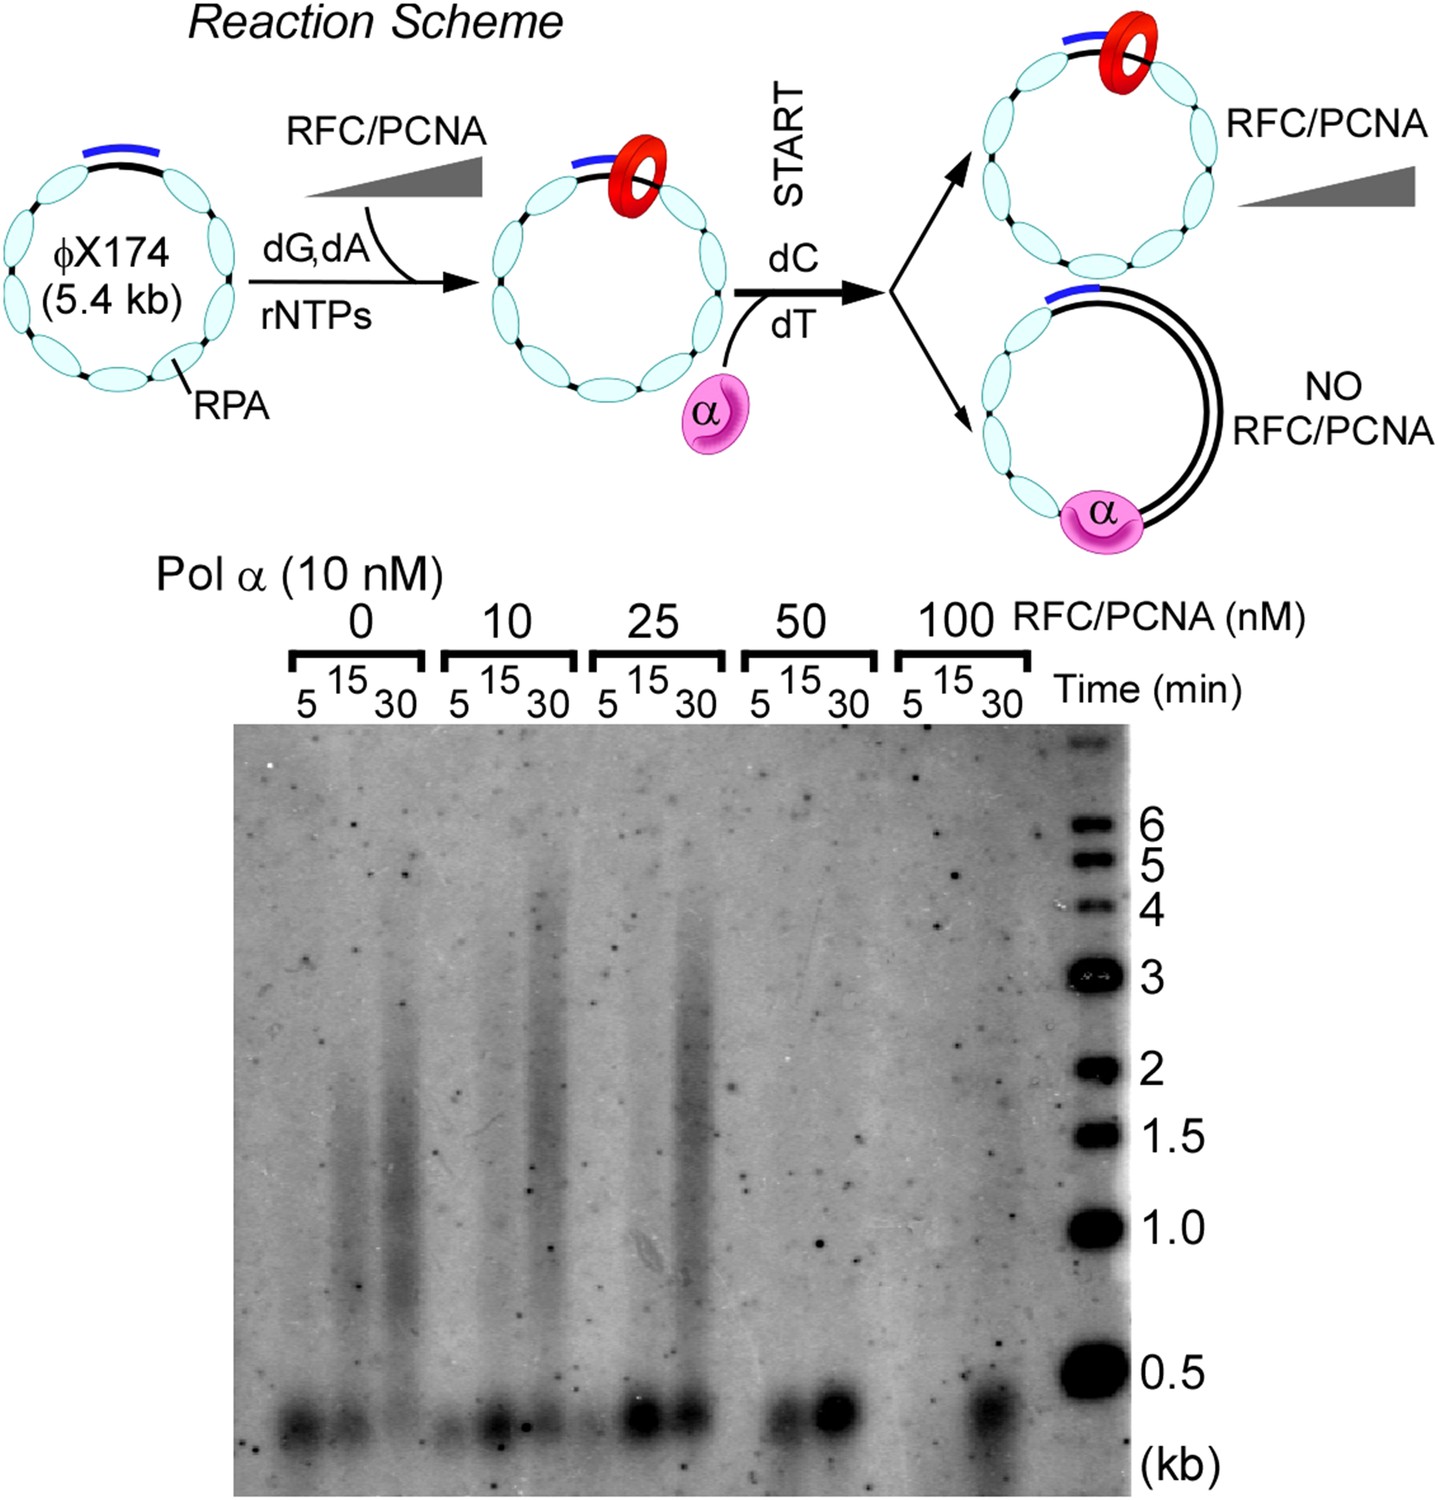
RFC and PCNA inhibit Pol α DNA polymerase activity on ssDNA model templates.
Top: scheme of the assay. Primer extension assays utilized RPA-coated singly primed 5.4 kb φX174 ssDNA. RFC-PCNA is titrated into singly primed ssDNA replication assays containing 10 nM Pol α as described in ‘Materials and methods’. Concentrations of RFC, PCNA, and reaction times are indicated in the figure.
Figure 6 with 1 supplement
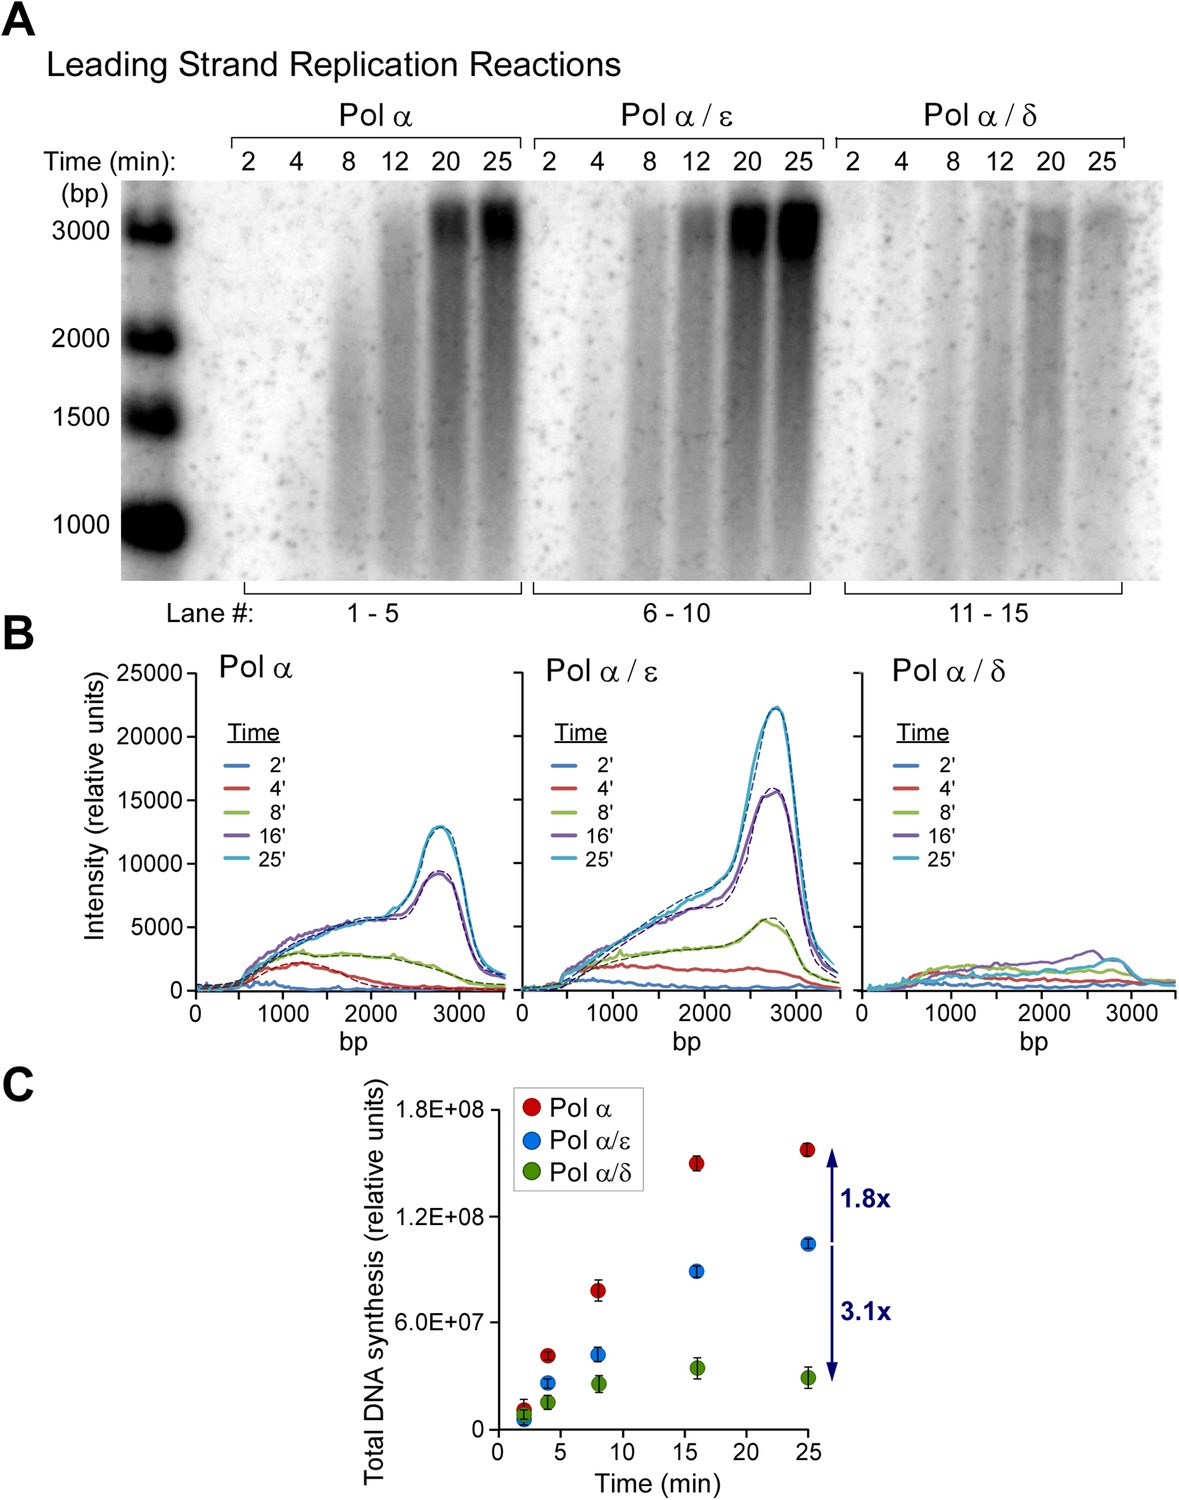
Polymerases switch with Pol α on the leading strand.
(A) Alkaline agarose gel following the time course of leading strand extension using the indicated DNA polymerases. Reactions were assembled on unprimed forked DNA in presence of 24 nM CMG for 10 min before adding 15 nM Pol α (lanes 1–5), 15 nM each Pol α and Pol ε (lanes 6–10), and 15 nM each Pol α and Pol δ (lanes 11–15); all reactions contained 6 nM RFC and 20 nM PCNA. Reactions were initiated upon adding RPA and nucleotides as described in ‘Materials and methods’. The rates of Pol α reactions are high in this experiment because the amount of Pol α used here promotes relatively rapid fork progression as documented in Figure 1 and Figure 1—figure supplement 1. Still, the addition of Pol ε gives slightly faster forks due to the intrinsically faster rate of CMG-Pol ε over the rate of the distributive Pol α with CMG. (B) Autoradiograph quantification as described in the legend to Figure 4. (C) The analysis of DNA products at the end-point reaction (25 min) reveals a 1.8 fold increase in total DNA synthesis for the Pol α/Pol ε reaction relative to Pol α alone (lane 10 vs lane 5); the same comparison of total DNA synthesis in Pol α vs the Pol α/Pol δ reaction reveals a 3.2 fold decrease in total DNA synthesis (lane 15 vs 5).
Figure 6—figure supplement 1
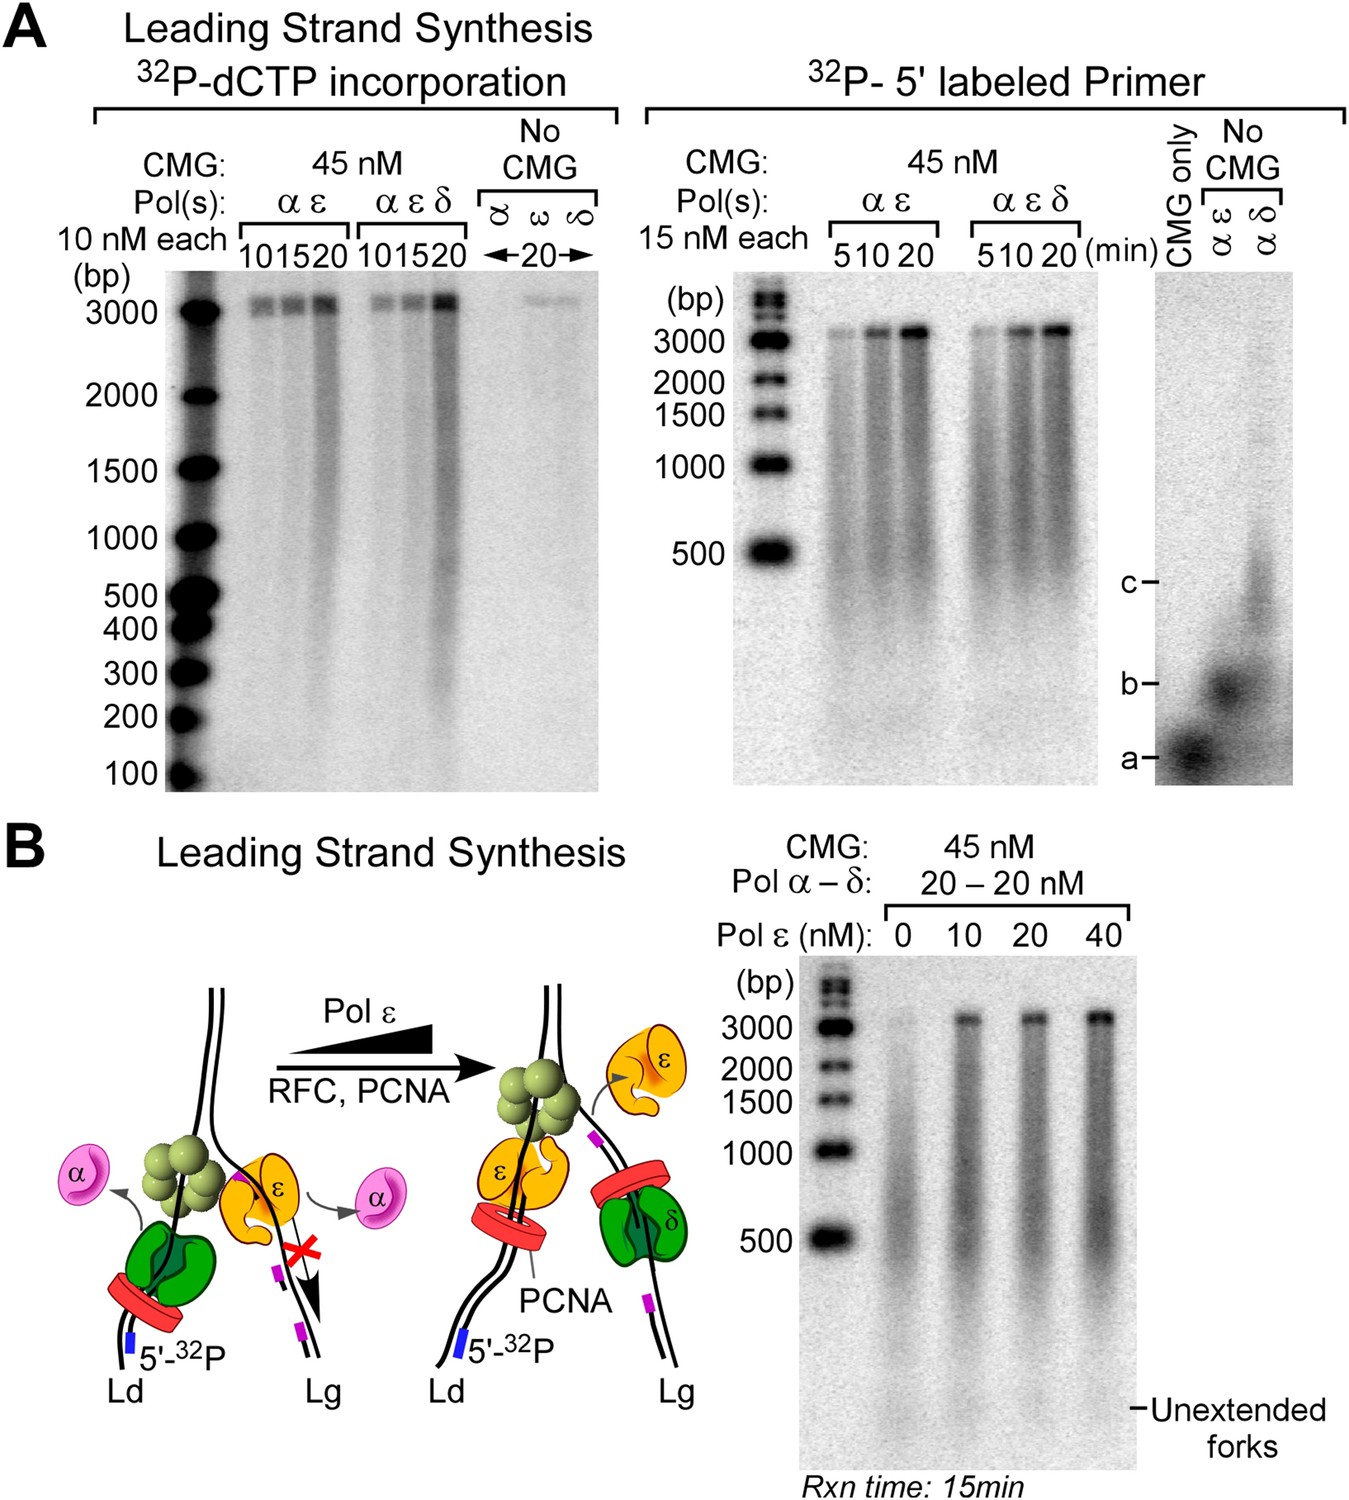
Pol δ does not inhibit the leading strand replication activity of Pol ε when all three polymerases are present.
(A) Autoradiographs of leading strand replication reactions using α32P-dCTP (left) or 32P-5′ labeled primed fork (right). CMG is pre-incubated and loaded on DNA, as described in ‘Materials and methods’, then the different polymerases are added into the reaction at the specified concentrations along with RFC-PCNA, RPA, dNTPs, and rNTPs. There is a slight end-labeling product observed in the 32P-dCTP experiment (20′ control time points), and therefore, we repeated these reactions using the 32P-5′ labeled primed fork. At high CMG concentration and in the presence of all three polymerases, there is a very efficient replication of the forked DNA template. a, b and c mark the location of 32P-primers that are not extended, location of 32P-primers extended up to the fork junction, and location of a minority of 32P-primer extension by strand displacement activity of Pol δ in 20 min control reactions, respectively. (B) Pol ε functions on the ‘Pol δ suppressed’ leading strand. Left: scheme of the reaction. Right: Pol ε is titrated into leading strand reactions containing Pol α, Pol δ, RFC-PCNA, and CMG, and under these conditions, the Pol δ and RFC-PCNA inhibit leading strand synthesis by Pol α. The leading strand reactions contain 10 nM RFC, 20 nM PCNA, and the specified amounts of polymerases and CMG.
Figure 7
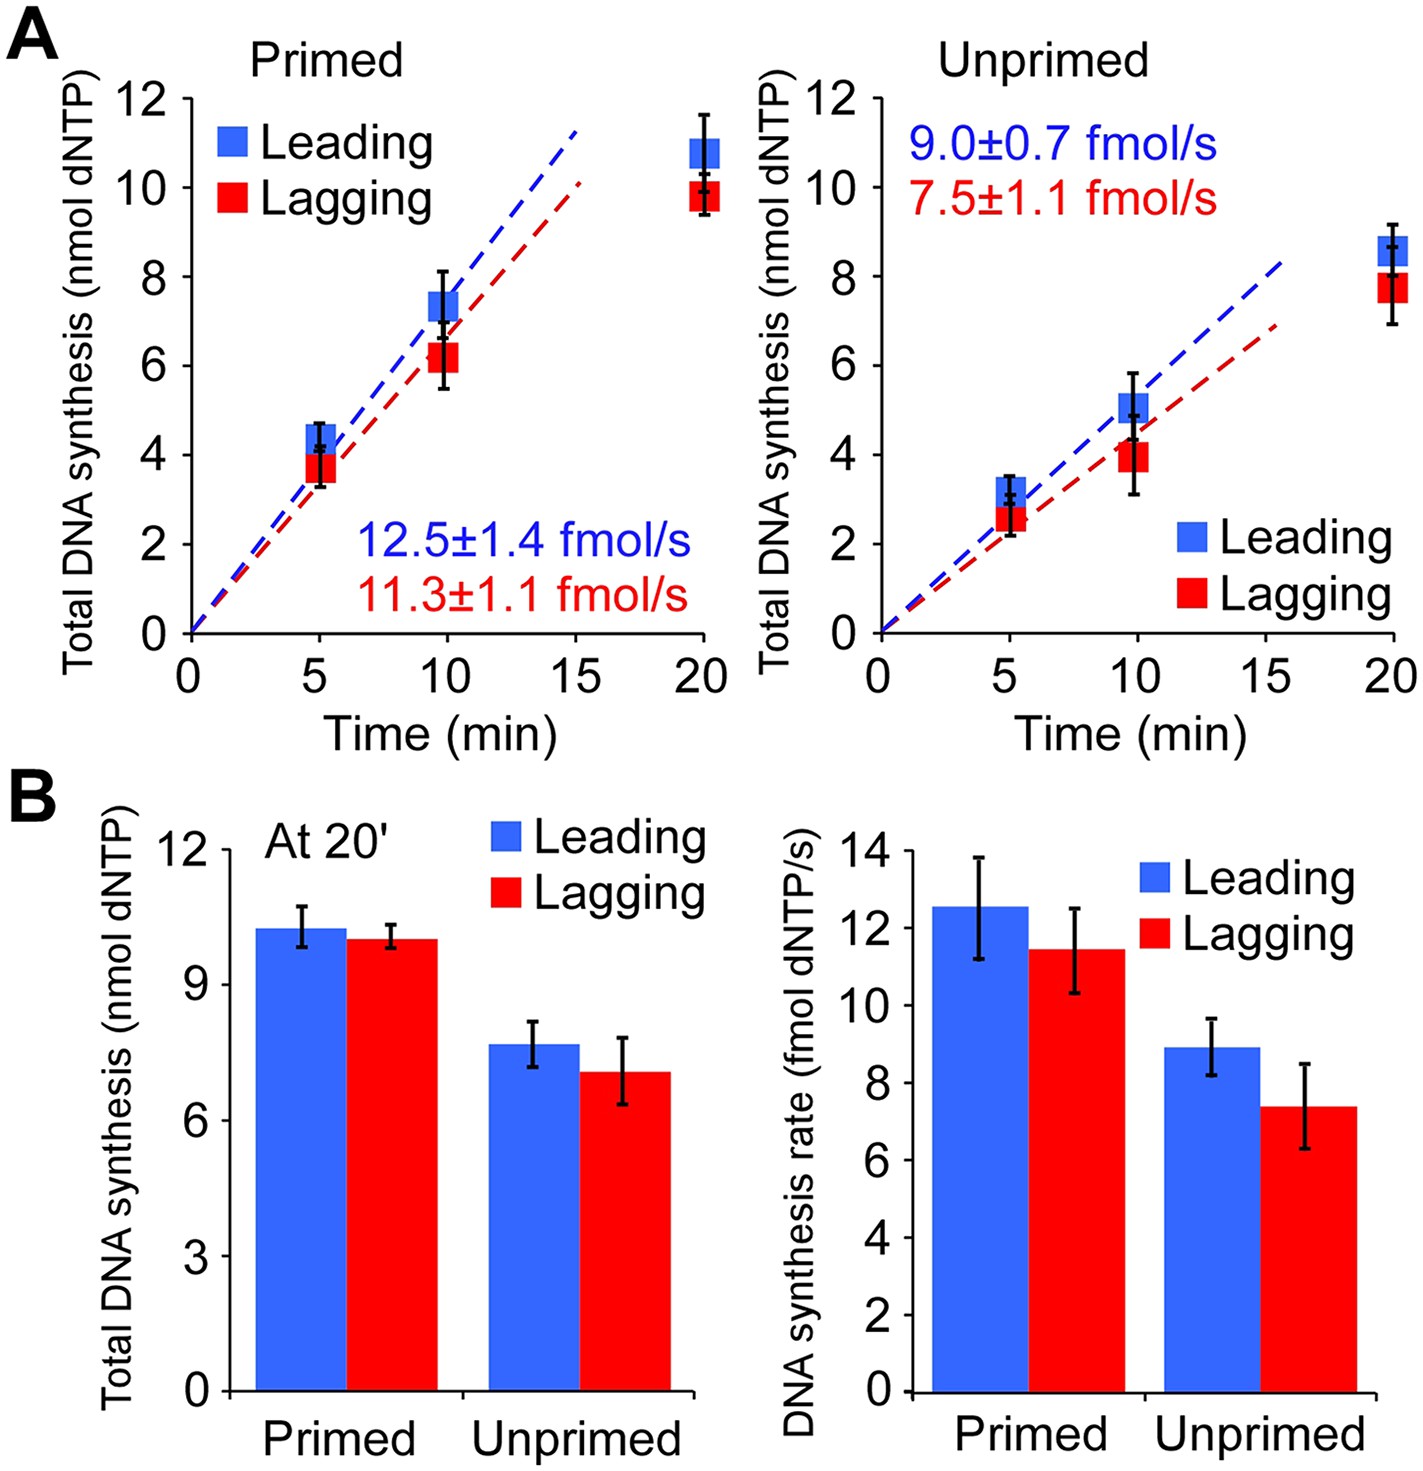
The leading and lagging strands are replicated at similar rates.
(A) Time course of leading–lagging strand replication reactions with all three polymerases at 10 nM each using either a pre-primed fork (Left panel) or unprimed fork (Right panel). Experiments were performed in triplicate, using either 32Pα-dCTP or 32Pα-dGTP for leading–lagging replication reactions, respectively (for experimental details, see ‘Materials and methods’ section). The numbers shown represent the rate of incorporation (fmol dNTPs/s) and the SE obtained from the linear fit. (B) Left: comparative histogram depicting total DNA synthesis at the 20 min time point; Right: comparative histogram of the rate of incorporation of leading–lagging strand replication reactions on pre-primed and unprimed forked DNA substrates.
Figure 8
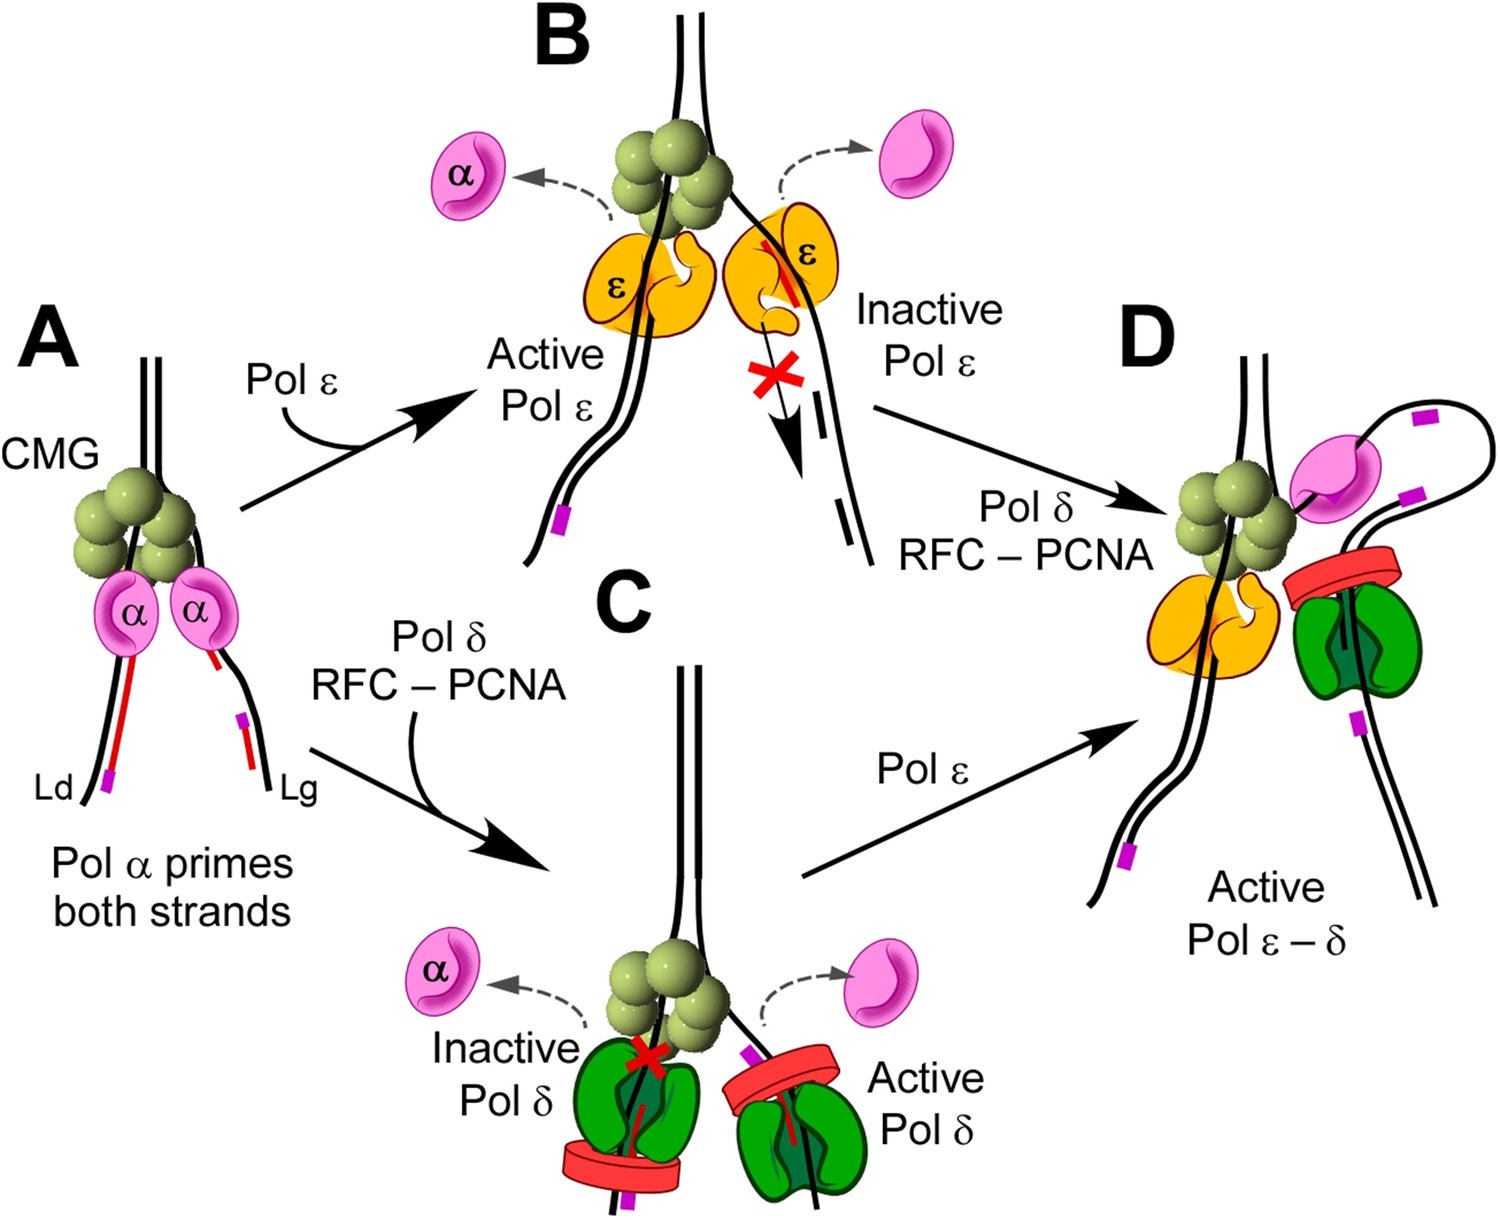
Exclusion reactions specify polymerase action at the eukaryotic fork.
(A) Pol α interacts with CMG to prime the leading and lagging strands. Pol α can extend DNA on both strands with CMG in vitro, but it lacks high fidelity and does not replicate bulk DNA in vivo. (B) Pol ε can switch with Pol α on both strands, in the presence or absence of RFC/PCNA, but Pol ε is not active on the lagging strand. (C) Pol δ/RFC/PCNA can switch with Pol α on both strands, but Pol δ is inactive with CMG on the leading strand. (D) Presence of all three polymerases, Pols α, δ, and ε, provides active leading/lagging strand synthesis.
Download links
A two-part list of links to download the article, or parts of the article, in various formats.
Downloads (link to download the article as PDF)
Open citations (links to open the citations from this article in various online reference manager services)
Cite this article (links to download the citations from this article in formats compatible with various reference manager tools)
Reconstitution of a eukaryotic replisome reveals suppression mechanisms that define leading/lagging strand operation
eLife 4:e04988.
https://doi.org/10.7554/eLife.04988


