A feedback loop between nonsense-mediated decay and the retrogene DUX4 in facioscapulohumeral muscular dystrophy
- Fred Hutchinson Cancer Research Center, United States
- University of Rochester, United States
- Leiden University Medical Center, Netherlands
- University of Washington, United States
Figures
Figure 1 with 1 supplement
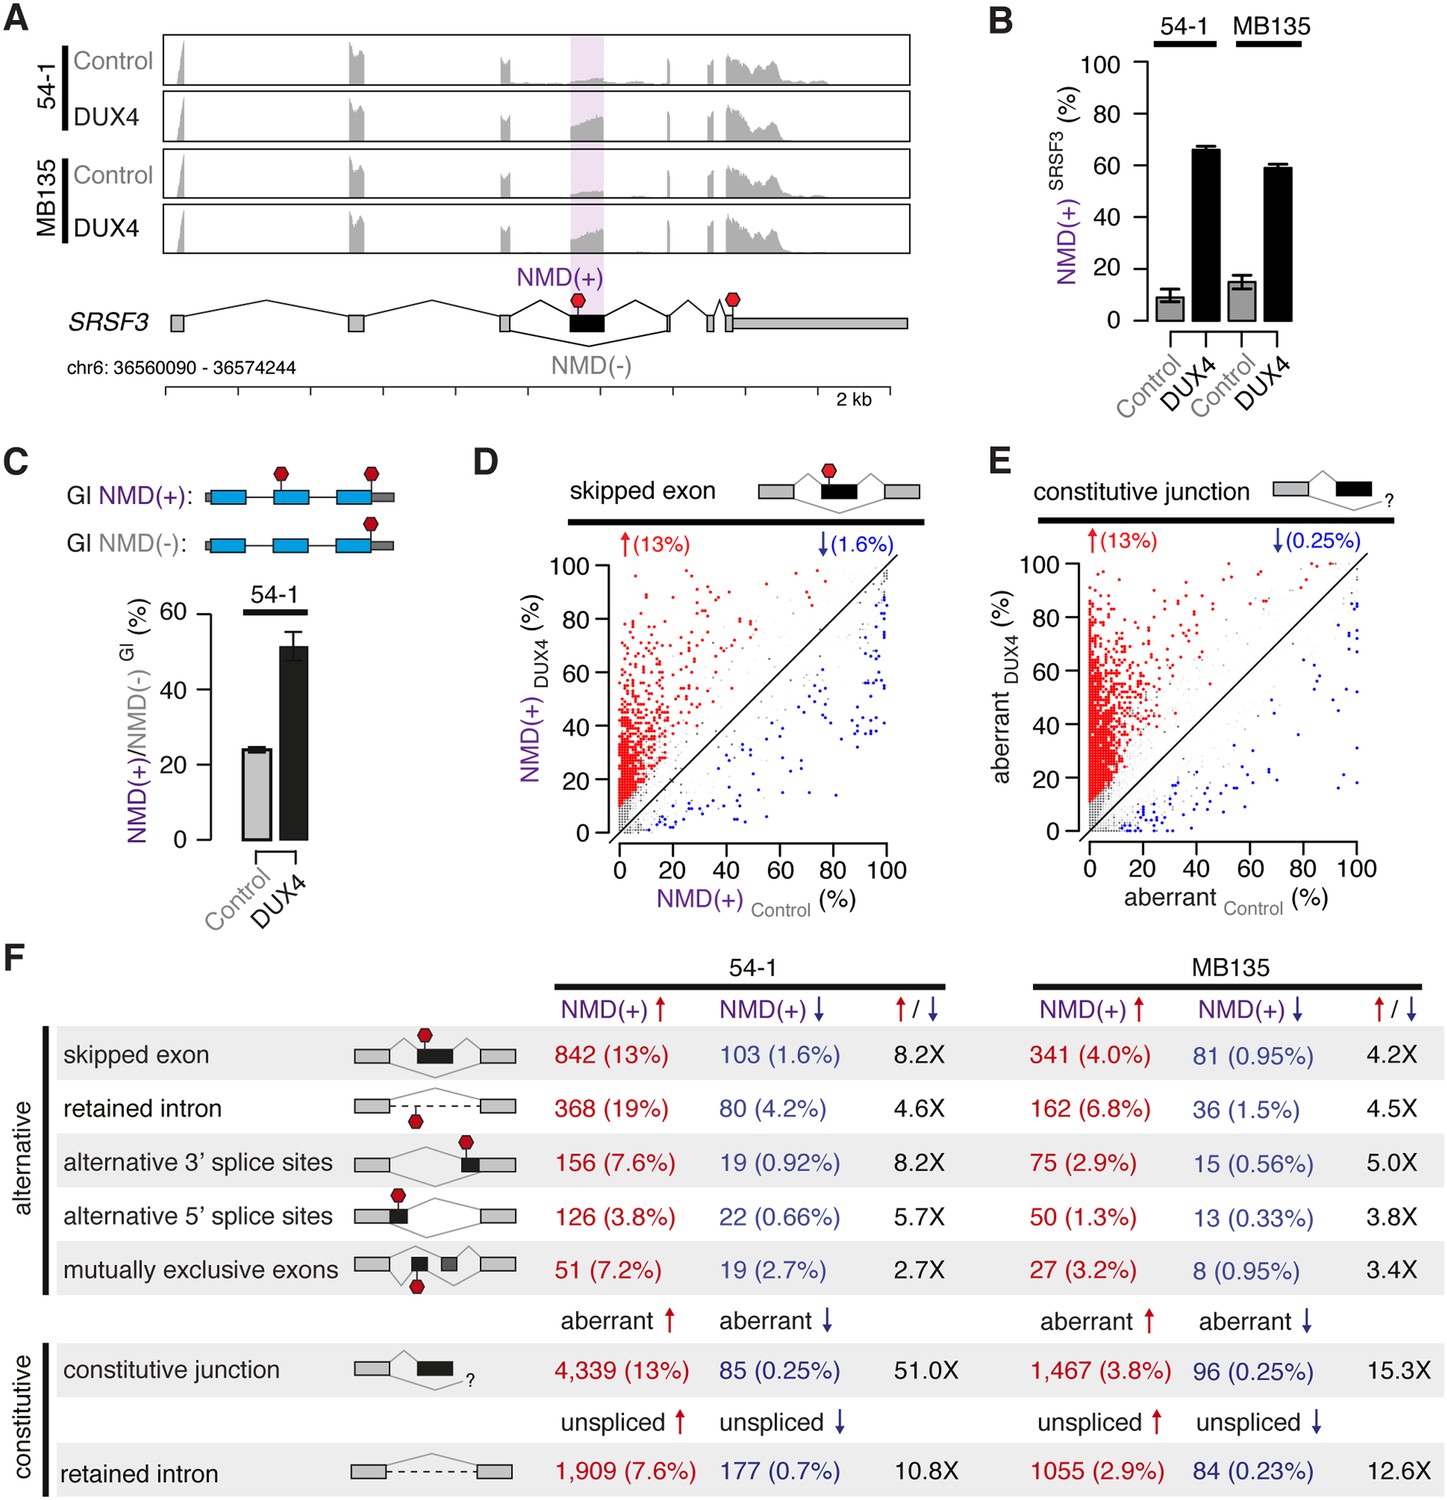
DUX4 expression inhibits nonsense-mediated decay.
(A) RNA-seq read coverage of the SRSF3 gene in control and DUX4-expressing myoblasts. 54-1, immortalized myoblasts; MB135, primary myoblasts. Purple shading, NMD-inducing cassette exon. Red stop sign, termination codon. (B) Inclusion of the premature termination codon-containing cassette exon of SRSF3 illustrated in (A). Error bars, 95% confidence intervals as estimated by MISO (Katz et al., 2010). (C) Relative levels of transcripts produced from NMD reporter plasmids encoding either premature termination codon-containing (top) or normal (bottom) β-globin (Gl). Bar plot illustrates the ratio NMD(+)/NMD(−) of transcripts from the NMD(+) and NMD(−) constructs. (D) Isoform ratios of predicted NMD substrates generated by cassette exon alternative splicing in control and DUX4-expressing myoblasts (54-1 cells). Red/blue, cassette exons exhibiting increases/decreases of ≥10% in isoform ratios for the isoforms that are predicted NMD substrates. (E) Isoform ratios of mis-spliced isoforms of annotated constitutive splice junctions generated by abnormal 5′ and 3′ splice site recognition (54-1 cells). Color as in (D). (F) Global increases and decreases in relative levels of predicted NMD substrates generated by differential splicing. Annotated alternative splicing events are illustrated in upper panel, and alternative splicing and intron retention of annotated constitutively spliced junctions are illustrated in lower panel. Up/down arrows, percentages of predicted NMD substrates generated by alternative splicing exhibiting increases/decreases of ≥10% in isoform ratios in DUX4-expressing vs control cells. Enrichment for increased vs decreased levels of NMD substrates indicated in columns three and six.
Figure 1—figure supplement 1
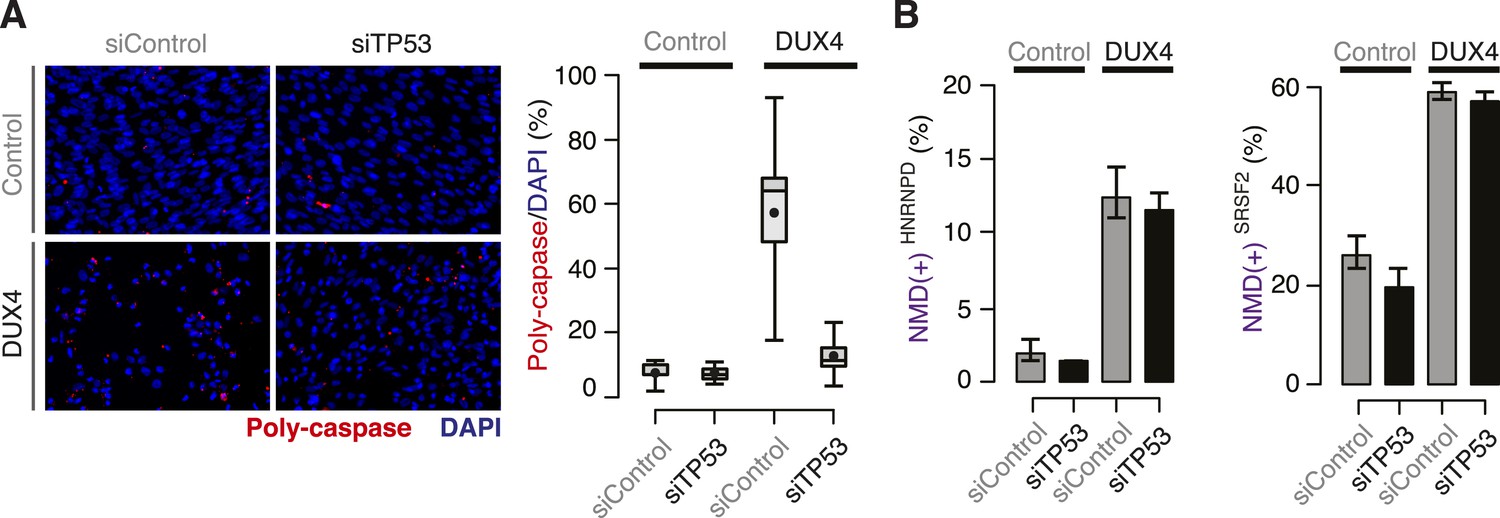
DUX4-induced NMD inhibition is not a side effect of DUX4 toxicity.
(A) Poly-caspase activity (red) following transfection with a control siRNA or siRNA against TP53 40 hr after lentiviral infection. Box plot, percentage of nuclei with poly-caspase granules (estimated by ImageJ; n = 8 fields). Whiskers, max and min over the fields. (B) Isoform ratios of endogenously produced NMD-degraded isoforms of HNRNPD and SRSF2. Error bars, standard deviation.
Figure 2
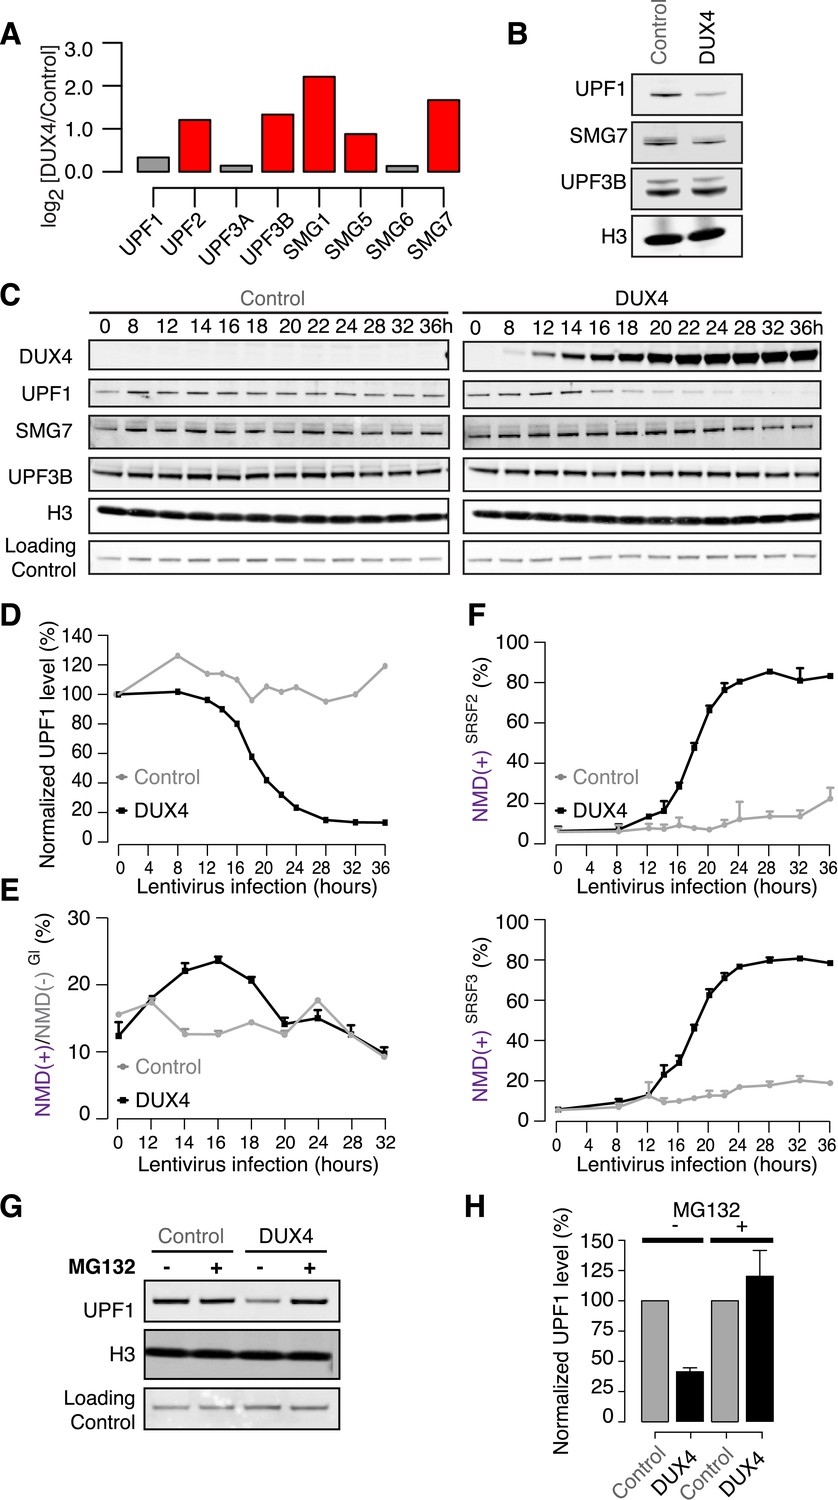
DUX4 destabilizes UPF1 via the proteasome.
(A) Relative mRNA levels of NMD factors in DUX4-expressing vs control myoblasts (54-1 cells). Red, up-regulation by ≥1.5-fold. (B) Immunoblot for NMD factors UPF1, SMG7, and UPF3B in DUX4-expressing and control myoblasts (54-1 cells) at 36 hr post-infection. H3, histone H3 (loading control). (C) Immunoblot of total protein from a 36-hr time course of DUX4-expressing and control myoblasts (54-1 cells). H3, histone H3. Loading Control, a nonspecific band that serves as an additional loading control. (D) Quantification of UPF1 protein level from the immunoblot presented in (C), normalized to the nonspecific band that serves as a loading control. (E) Relative levels of transcripts produced from the NMD(+) and NMD(−) β-globin reporter plasmids. (F) Isoform ratios of endogenously produced NMD-degraded isoforms of SRSF2 and SRSF3. Time course identical to (C). Error bars, standard deviation. (G) Immunoblot of total protein from DUX4-expressing and control myoblasts (54-1 cells) treated with the proteasome inhibitor MG132 (10 µM; 8 hr treatment initiated 16 hr after infection with lentiviral expression constructs). Loading control H3, histone 3, has a long half-life (Toyama et al., 2013). (H) Quantification of UPF1 protein levels from three independent replicates of the immunoblot presented in (G), normalized to the nonspecific band that serves as a loading control. Error bars, standard deviation.
Figure 3
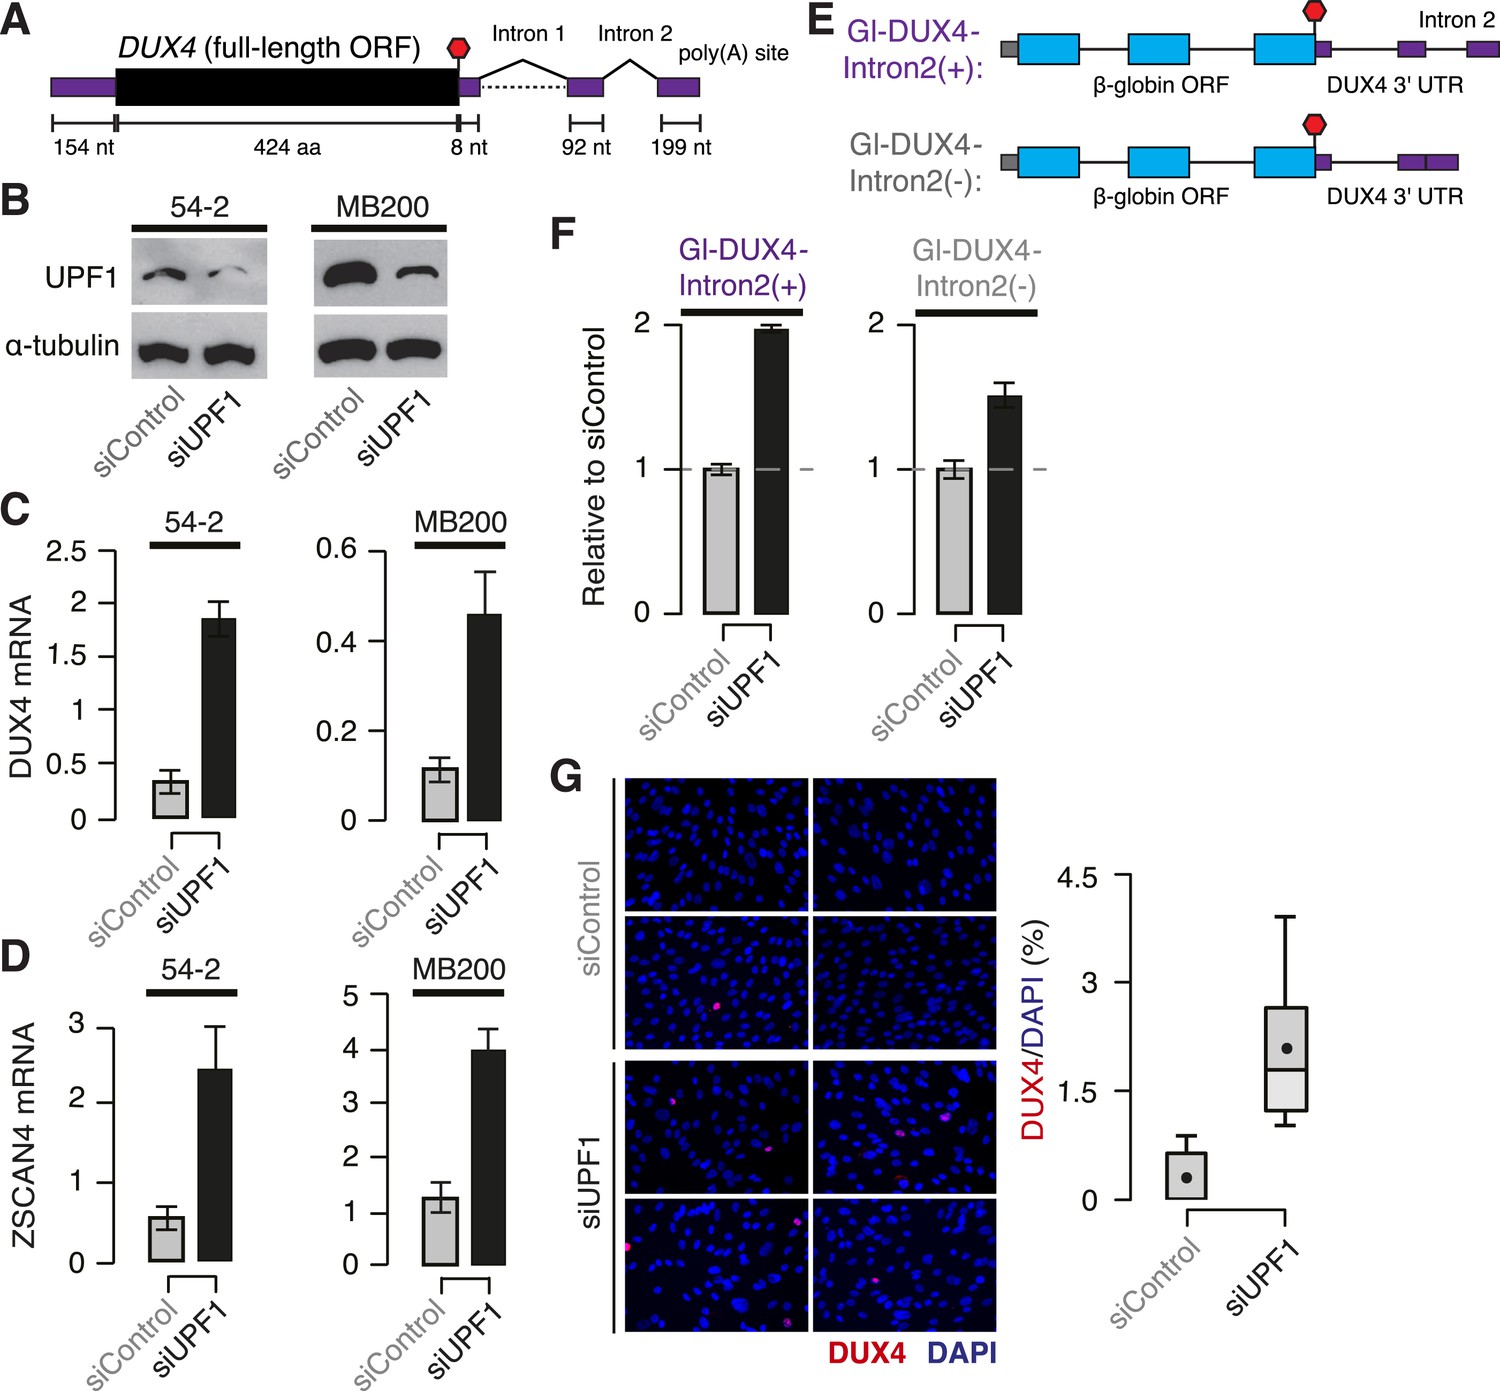
DUX4 mRNA is an endogenous NMD substrate.
(A) Schematic of the DUX4 mRNA. Intron 2, constitutively spliced intron within the 3′ UTR. Black, coding sequence; purple, 5′ and 3′ untranslated regions (UTRs). Red stop sign, termination codon. (B) Immunoblot of total protein from FSHD1 (54-2) and FSHD2 (MB200) myoblasts following transfection with a siRNA against UPF1 or a control non-targeting siRNA. α-tubulin, loading control. (C) Levels of DUX4 mRNA following control or UPF1 knock-down, measured 2 days after the initiation of myogenesis. Error bars, standard deviation. (D) Levels of ZSCAN4 mRNA following control or UPF1 knock-down, measured 2 days after the initiation of myogenesis. Error bars, standard deviation. (E) Schematic of chimeric constructs encoding the β-globin opening reading frame (cyan) followed by the DUX4 3′ UTR (purple) containing (top) or lacking (bottom) the second intron of DUX4's 3′ UTR (Intron 2). (F) Relative levels of transcripts from the Gl-DUX4-Intron2(+) and Gl-DUX4-Intron2(−) constructs following control or UFP1 KD in normal myoblasts (54-1 cells). For each construct, data are normalized such that the siControl treatment is 1. Error bars, standard deviation. (G) Immunofluorescence with an antibody against DUX4 following control or UPF1 knock-down, measured 2 days after the initiation of myogenesis in FSHD1 cells (54-2), which was prior to significant fusion. Box plot, percentage of DUX4+ nuclei as estimated by ImageJ (Fiji); n = 8 fields. Whiskers, max and min over the fields.
Figure 4
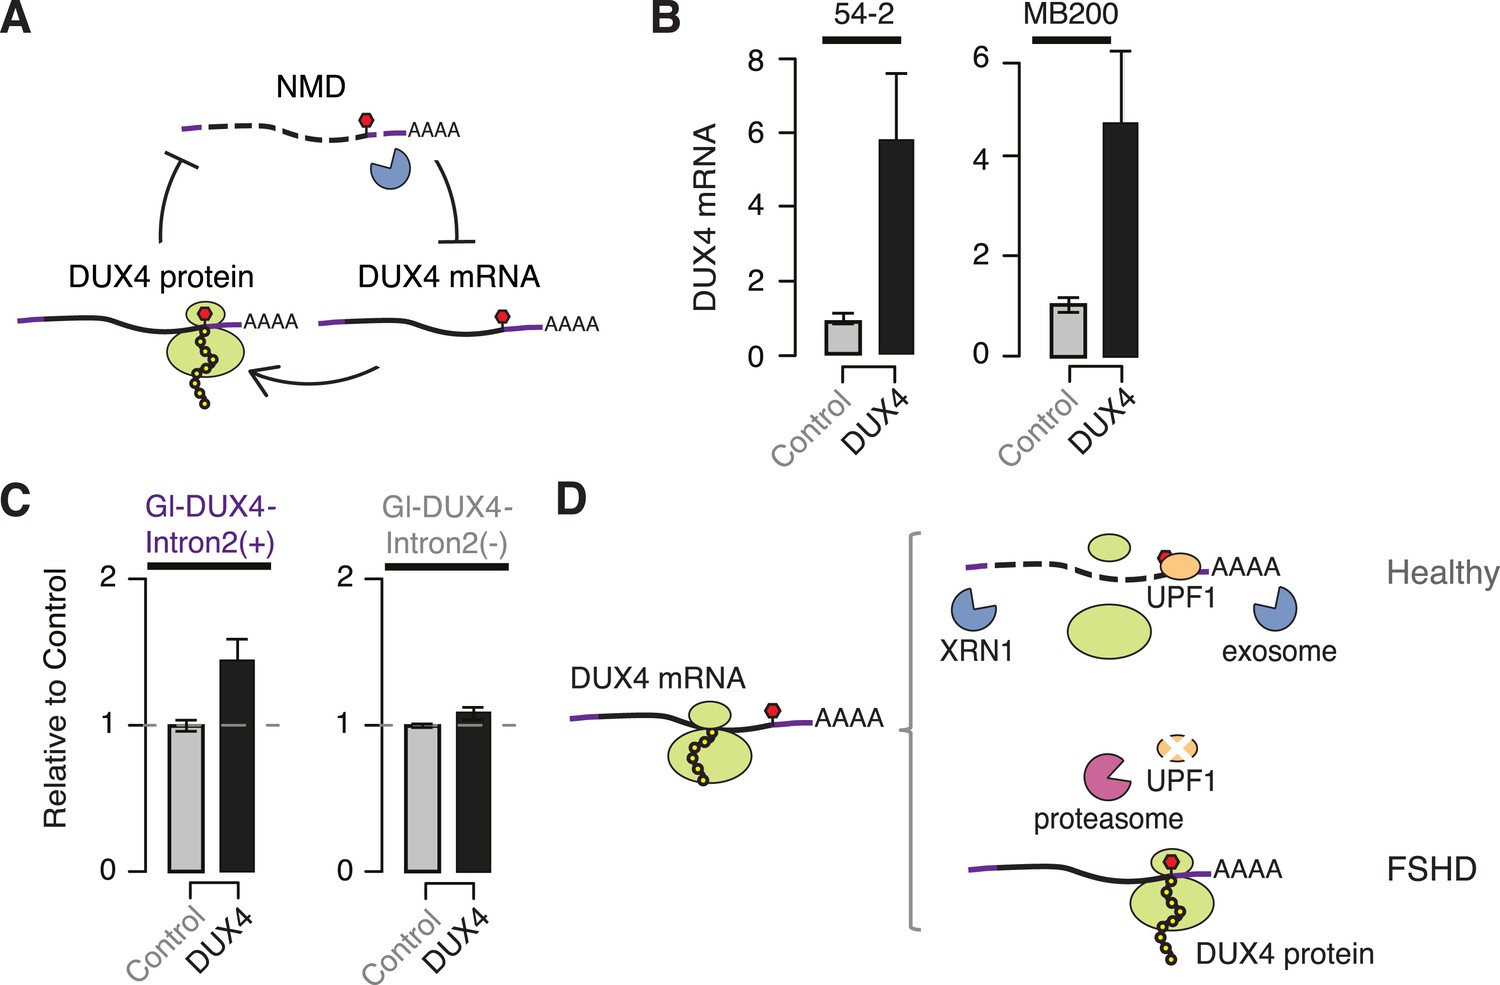
DUX4 and NMD form a feedback loop.
(A) Schematic of potential double-negative feedback loop between DUX4 and NMD, in which DUX4 inhibits NMD and NMD degrades DUX4 mRNA. (B) Levels of endogenously transcribed DUX4 mRNA following control treatment or ectopic DUX4 expression, measured 2 days after the initiation of myogenesis in FSHD1 (54-2) and FSHD2 (MB200) cells. (C) Relative levels of transcripts from the Gl-DUX4-Intron2(+) and Gl-DUX4-Intron2(−) constructs following control treatment or ectopic DUX4 expression in normal myoblasts (54-1 cells). For each construct, data are normalized such that the siControl treatment is 1. Error bars, standard deviation. (D) Schematic of potential model of interactions between DUX4 and NMD in healthy (top) and FSHD (bottom) muscle cells. In healthy cells, DUX4 mRNA is efficiently degraded by NMD; in FSHD cells, DUX4 triggers proteolytic degradation of UPF1 and inhibits NMD, resulting in the accumulation of DUX4 mRNA and protein.
Additional files
-
Supplementary file 1
Primer sequences used for cloning and real-time PCR assays. List of primers used for cloning and real-time PCR. GENE ID, Ensembl ID for the tested genes. RPL27 and SRP14: housekeeping genes. HNRNPD, SRSF2, and SRSF3: inclusion primer sets measure levels of endogenously produced NMD-degraded isoforms. Endogenous DUX4 mRNA was measured with primers specific to its 3′ UTR (RKB_929 and RKB_930). Expression from chimeric Gl-DUX4-Intron2(+) and Gl-DUX4-Intron2(−) constructs was measured with primers specific to the spliced β-globin region.
- https://doi.org/10.7554/eLife.04996.008
Download links
A two-part list of links to download the article, or parts of the article, in various formats.
Downloads (link to download the article as PDF)
Open citations (links to open the citations from this article in various online reference manager services)
Cite this article (links to download the citations from this article in formats compatible with various reference manager tools)
A feedback loop between nonsense-mediated decay and the retrogene DUX4 in facioscapulohumeral muscular dystrophy
eLife 4:e04996.
https://doi.org/10.7554/eLife.04996


