The equatorial position of the metaphase plate ensures symmetric cell divisions
- University of Geneva, Switzerland
- ETH Zurich, Switzerland
- Universidade do Porto, Portugal
Figures
Figure 1
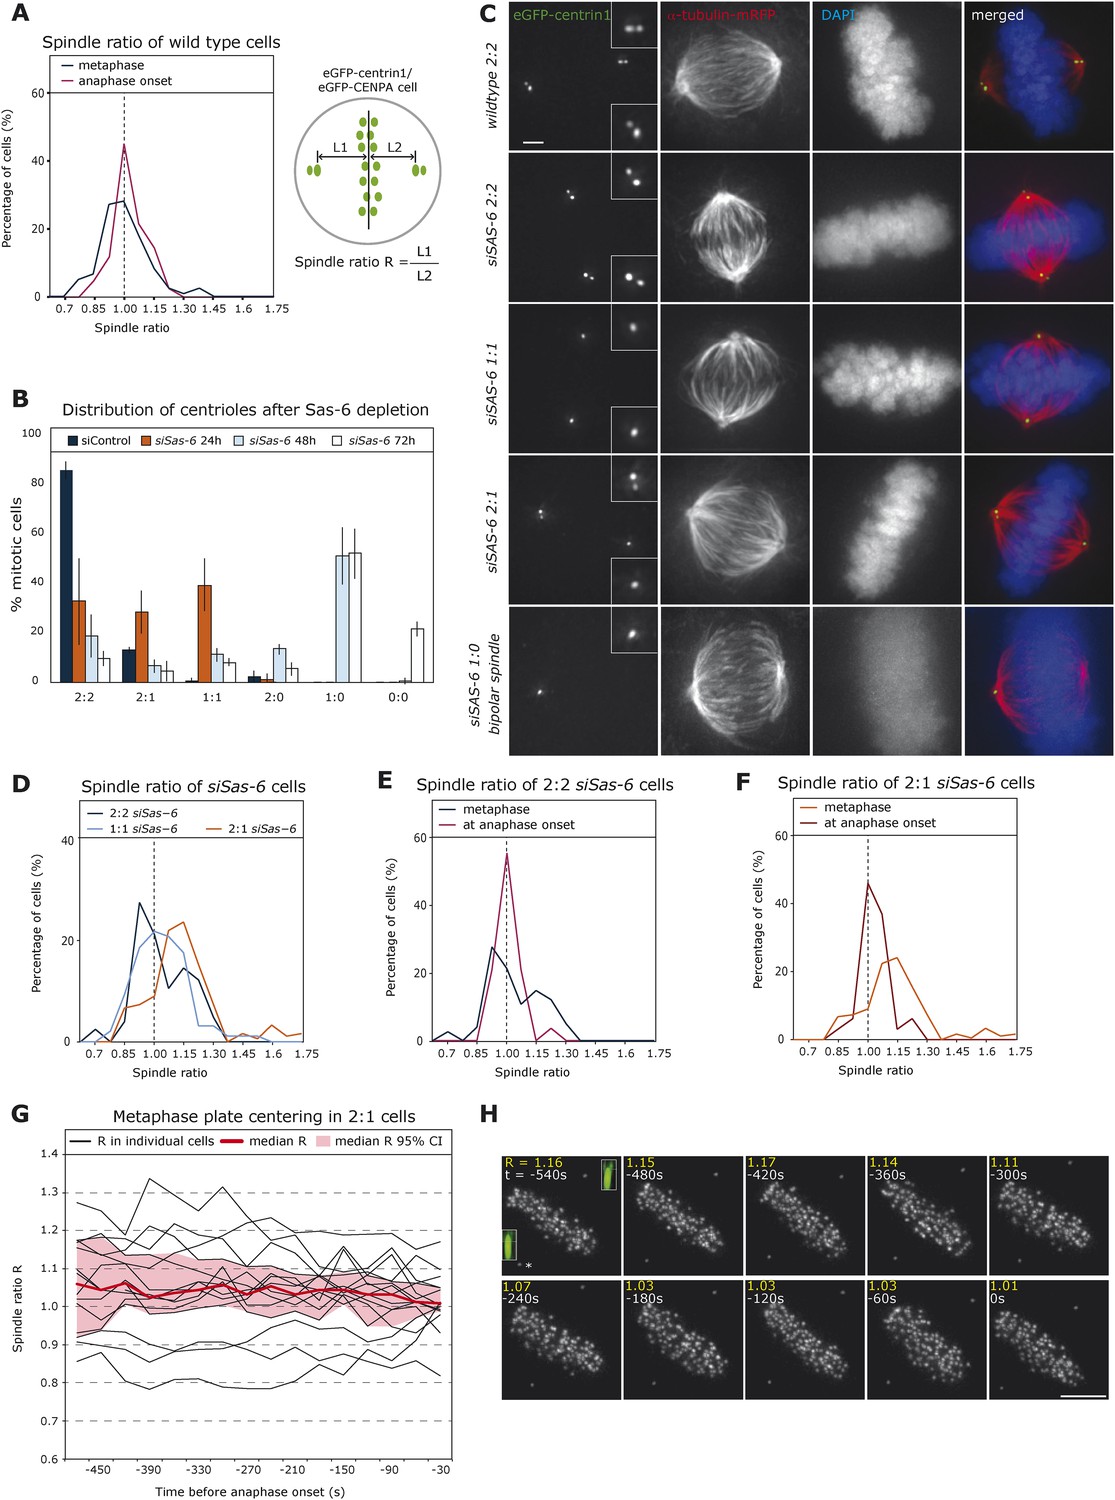
Cells center the position of the metaphase plate before anaphase onset.
(A) Distribution of spindle ratio R in metaphase cells in wild-type eGFP-centrin1/CENPA HeLa cells during metaphase in general (black curve) or 30 s before anaphase onset (red curve). The spindle ratio R was calculated by dividing the half-spindle length L1 associated with the grandmother centriole (brightest eGFP-centrin1) by the other half-spindle length L2 (for all cell numbers in all experiments see Table 1). (B) Depletion of Sas-6 but not control depletion leads to the gradual loss of centrioles after 24, 48, or 72 hr, resulting in a mixed population of cells with different number of centrioles as indicated. Centrioles were visualized based on images of eGFP-centrin1/mRFP-α-tubulin cells as shown in C (n = 50 cells per experiment, in 3 experiments, error bars indicate s.e.m.). (C) Immunofluorescence images of eGFP-centrin1 (green)/mRFP-α-tubulin (red) cells stained with DAPI (blue) with different centriole configurations as indicated. Scale bar indicates 2 μm. (D) Distribution of spindle ratio R in metaphase cells in siSas-6-transfected eGFP-centrin1/CENPA cells with different centriole configurations (2:2, 2:1, or 1:1). The spindle ratio was calculated by dividing the half-spindle length L1 associated with the grandmother centriole (2:2 and 1:1 cells) or the half-spindle length associated with 2 centrioles (2:1 cells) by the other half-spindle length L2. The spindle ratio of 2:1 cells was significantly different from the ratios seen in 2:2 or 1:1 cells (T-test with Welch's correction, 2:1 > 2:2, p = 0.018). (E, F) Distribution of spindle ratio R in Sas-6-depleted eGFP-centrin1/CENPA 2:2 (E) or 2:1 (F) cells in metaphase and before anaphase onset. 2:1 cells have a significantly more asymmetric plate position in metaphase when compared to cells just before anaphase (Mann–Whitney U test, p = 7.16 × 10⁻⁷). (G) Plot of half-spindle ratio R over time in 15 individual eGFP-centrin1/CENPA 2:1 cells that entered anaphase during live-cell imaging (black lines). The timeline was synchronized to anaphase onset (t = 0); the red curve indicates the median of R, and red surface the 95% confidence interval. Note how median R approaches 1 over time and how its variability decreases. (H) Time-lapse images of a eGFP-centrin1/CENPA 2:1 cell as analyzed in G. Half-spindle ratio R and time before anaphase are indicated for each frame. Number of centrioles was determined in IMARIS in 3D (see 3D-insets in green), * denotes the pole with 1 centriole.
Figure 2 with 2 supplements
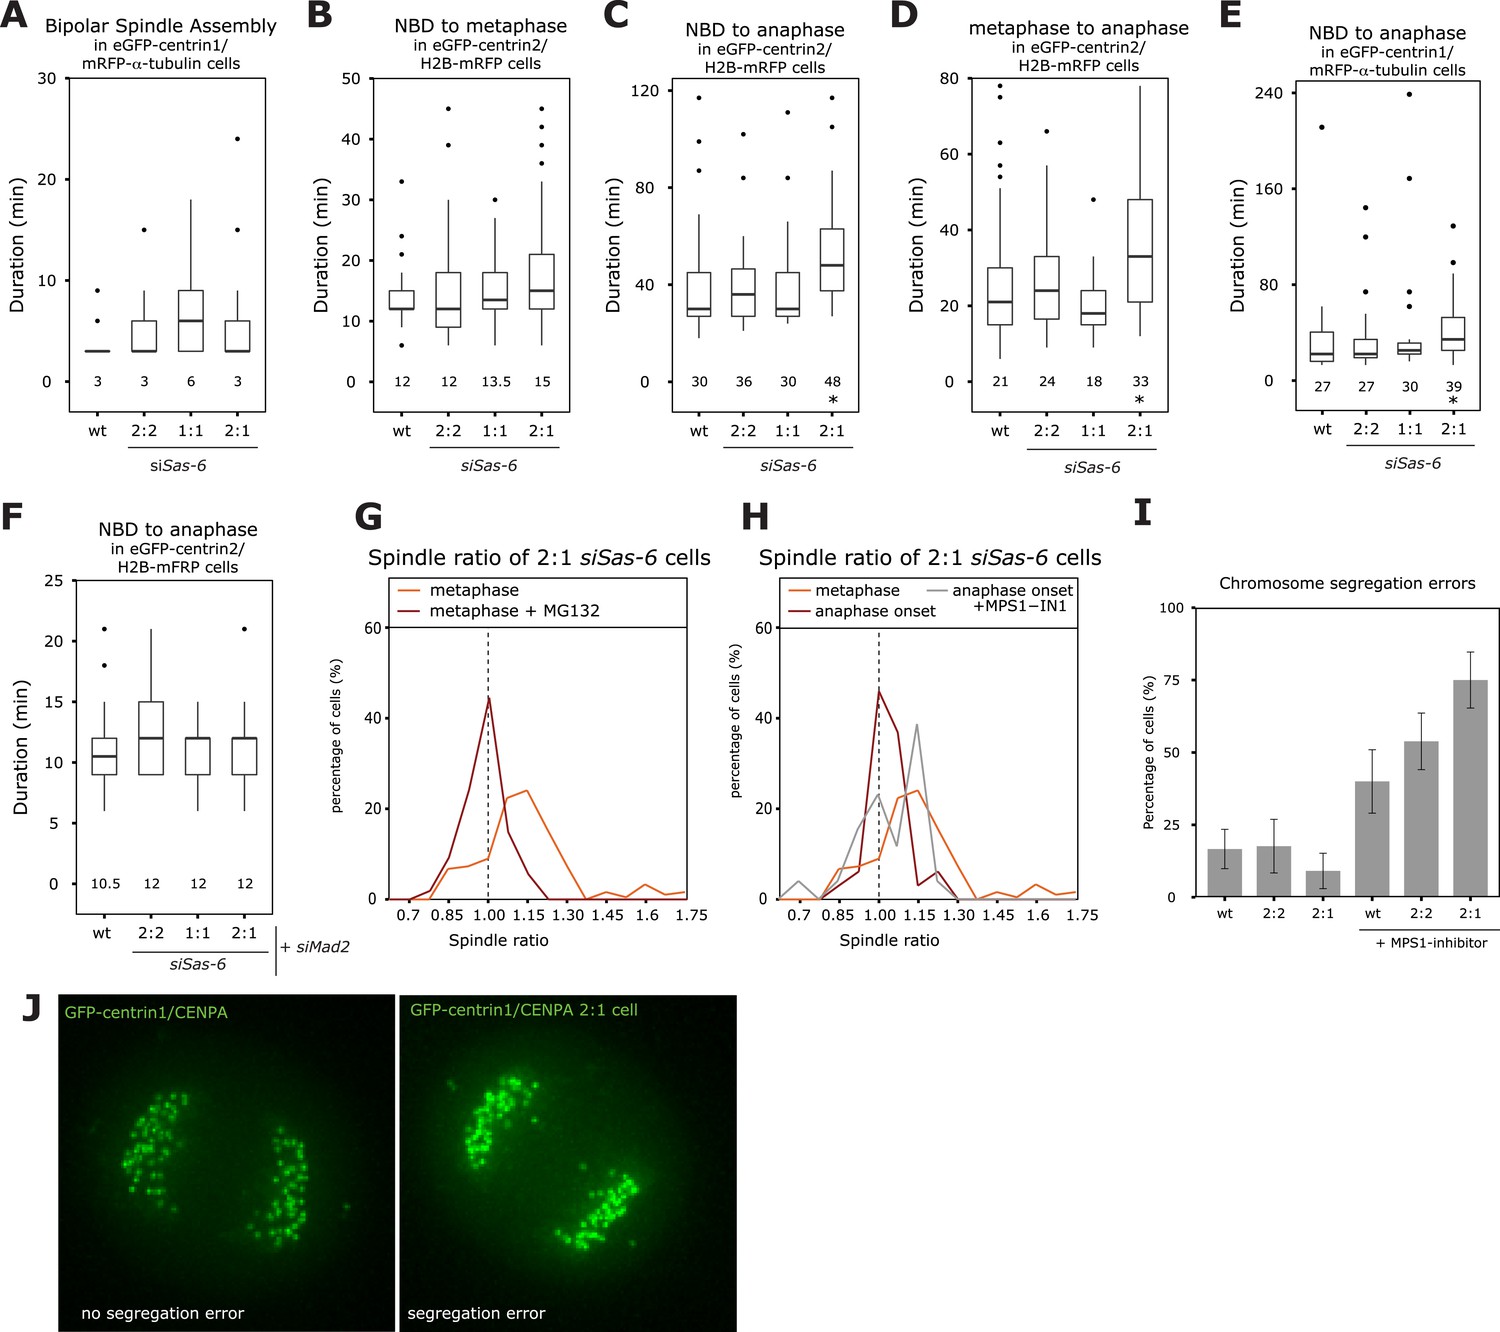
The SAC delays anaphase in cells with asymmetric spindles allowing the centering of the metaphase plate.
(A) Boxplots of the spindle assembly time (NBD until bipolar spindle formation) in wild-type and Sas-6-depleted 2:2, 1:1, or 2:1 eGFP-centrin1/mRFP−α-tubulin cells. Numbers indicate the median value, n = 49–59 cells in 2–6 experiments. (B–D) Boxplots for the time between NBD and metaphase (B); the time between NBD and anaphase onset (C); and the time between metaphase and anaphase (D) in wild-type and Sas-6-depleted 2:2, 1:1, or 2:1 eGFP1-centrin2/H2B-mRFP cells. * indicates statistically significant difference in C (Mann–Whitney U test, p = 0.003), and D (Mann–Whitney U test, p = 0.015), n = 36–100 cells in 6–13 experiments. (E) Boxplot for the time between NBD and anaphase B in wild-type and Sas-6-depleted 2:2, 1:1, or 2:1 eGFP1-centrin1/ mRFP−α-tubulin cells. * indicates statistically significant difference (Mann–Whitney U test, p = 0.003). (F) Boxplots for the time between NBD and anaphase onset in Mad2-depleted or Mad-2/Sas-6-depleted 2:2, 1:1 or 2:1 eGFP1-centrin2/H2B-mRFP cells. 2:1 cells are not delayed (Mann–Whitney U test, p = 0.836). (G) Distribution of spindle ratios R in 2:1 eGFP-centrin1/CENPA cells treated with DMSO or MG132. For cell numbers see Table 1. (H) Distribution of spindle ratio R in Sas-6-depleted eGFP-centrin1/CENPA 2:1 cells in metaphase, at anaphase onset, or at anaphase onset when treated in metaphase with the Mps1 inhibitor MPS1-IN-1. Values for metaphase and anaphase without Mps1-IN treatment were taken from Figure 1E for comparison. MPS1-IN treated 2:1 anaphase cells are significantly more asymmetric (Mann–Whitney U test, p = 0.032). (I) Quantification of chromosome segregation errors in eGFP-centrin1/CENPA cells under the indicated conditions (n = 17–30 cells; N = 4–13 experiments). Error bars indicate s.e.m. (J) Illustrative live-cell imaging stills of eGFP-centrin1/CENPA cells in anaphase with (right panel) or without (left panel) chromosome segregation errors. SAC, spindle assembly checkpoint.
Figure 2—figure supplement 1
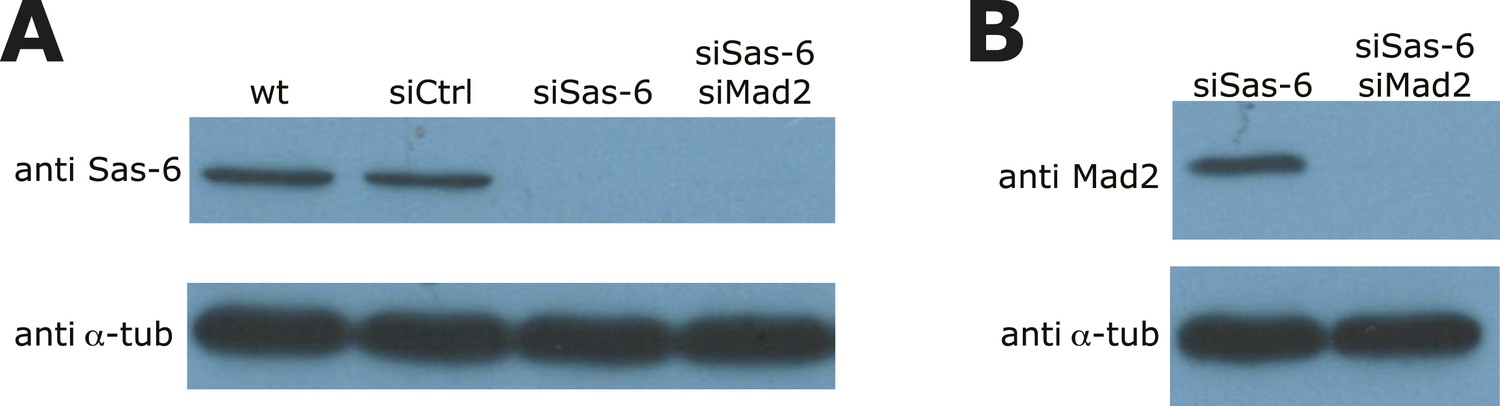
Validation of Sas-6 and Mad2 co-depletion.
(A, B) Immunoblots of wild-type, siControl-, siSas-6, or siSas-6/siMad2 treated eGFP1-centrin2/H2B-mRFP HeLa cells probed with (A) Sas-6 and α-tubulin antibodies or (B) with Mad2 and α-tubulin antibodies.
Figure 2—figure supplement 2
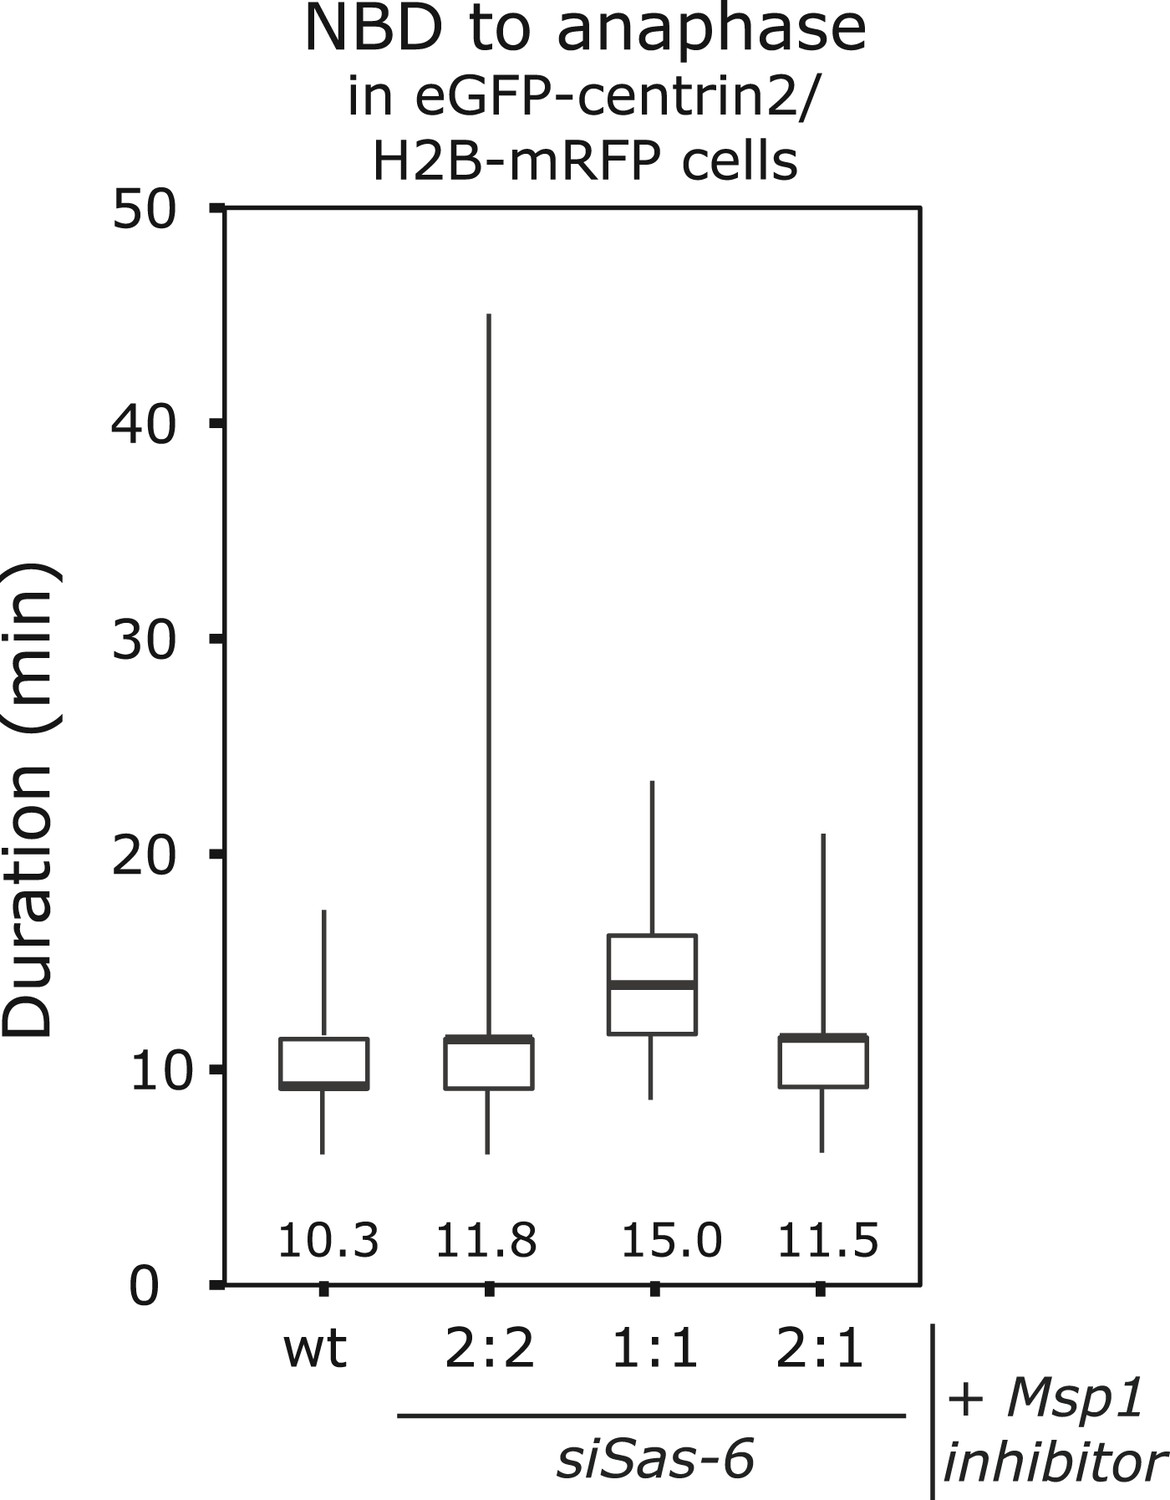
Mps1 inhibition suppresses the anaphase delay in 2:1 cells.
Boxplots for the time between NBD and anaphase onset in wild-type, siSas-6-treated 2:2, 1:1, or 2:1 eGFP1-centrin2/H2B-mRFP cells treated with an Mps1 inhibitor. Numbers indicate average anaphase times. Note that 2:1 cells are not delayed when compared to 2:2 cells (Mann–Whitney U test, p = 0.9673).
Figure 3

2:1 cells have half-spindles with different microtubule stability and fail to mature kinetochore–microtubule attachments.
(A) eGFP-centrin1 cells (green) were treated with monastrol and stained for HEC1 (red; right panel) to calculate the distance between kinetochores and the closest centriole. The left panel shows the distribution of centriole-HEC1 distances from n =16−28 cells, >1000 kinetochores. Scale bar indicates 2 μm. (B, C) The difference in centrosomal levels of TPX-2 and phospho-Aurora-A (B), and centrobin between each spindle pole was quantified in HeLa eGFP-centrin1 by immunofluorescence using the indicated formula, and plotted as boxplots for each centriole configuration; n = 12–63 cells. Scale bar indicates 2 μm. (D) Representative image of wild-type and siSas-6-treated 2:1 eGFP-centrin1 (green)/mRFP−α-tubulin (white) cells stained with anti-centrobin sera (red). Insets show magnified centrioles. Scale bar indicates 2 μm. (E) Quantification of the difference in α-tubulin (red signal) levels between the two half-spindles, according to the formula shown in the box. Results were plotted in the left panel using a boxplot. n = 19–25 cells, N = 2 experiments. Scale bar indicates 2 μm. (F) The difference in centrosomal levels of γ-tubulin, pericentrin, ninein and p150glued between each spindle pole was quantified as in (B) and plotted as boxplots for each centriole configuration; n = 18–68 cells. (G) Immunofluorescence images of 2:2 and 2:1 siSas-6 eGFP-centrin1/CENPA (green) cells treated for 7 min with ice-cold medium and stained with anti-α-tubulin sera (magenta). Subsetted images are maximum intensity projections of 10 stacks (z = 0.2 μm) around centrioles. Scale bar indicates 2 μm. (H) Quantification of kinetochore–microtubule minus-end stability at poles. Bar graph indicates percentage of cells that have asymmetric levels of kinetochore–microtubule minus-ends at the poles after cold-treatment; n = 26–49 cells; * indicates that within the 2:1 cell population the minus-end stability was significantly higher at the pole with 2 centriole (p = 0.00082 exact binomial test). (I) Quantification of spindle rotation in control- and Sas-6-depleted 2:2, 2:1, or 1:1 eGFP-centrin1 (green)/mRFP−α-tubulin (red) cells based on time-lapse images as shown in the right panels. Times indicate minutes after NBD. Scale bar indicates 5 μm. A spindle was counted as rotating if it had turned by more than 90° in X/Y. n = 32–122 cells in 2–6 experiments. * indicates significant difference; Fisher's exact test p = 8.39e-09. (J) Quantification of kinetochore–microtubule stability at poles. Bar graph indicates percentage of cells that have more stable kinetochore–microtubule minus-ends either at the pole with the grandmother centriole (2:2) cells or at the 2-centriole pole (2:1 cells); n = 20–40 cells in N = 3 independent experiments; * indicates that the MG132 treatment significantly reduced the percentage of cells with more stable minus-ends at the 2-centriole pole (p = 0.0275 in unpaired t-test). (K) Distribution of spindle ratios R in wild-type and siKIF2a/MCAK-treated HeLa eGFP-centrin1/CENPA cells in metaphase. For cell number see Table 1. (L) Quantification of spindle rotation in wild type, Sas-6-depleted 2:1, KIF2a/MCAK-depleted, or KIF2a/MCAK/Sas-6-depleted 2:1 eGFP-centrin2/H2B-mRFP cells, n = 18–37 cells in 1–3 experiments. * indicates significant difference; p = 0.024 in Fisher's exact test. See also Videos 1–3. (M) Distribution of spindle ratios R in Sas-6-depleted 2:1 and KIF2a/MCAK/Sas-6-depleted 2:1 eGFP-centrin1/CENPA cells in metaphase. For cell numbers see Table 1. (N) Distribution of spindle ratios R in metaphase in Sas-6-depleted 2:2 and 2:1 cells treated either with DMSO or 10 nM taxol. For cell numbers see Table 1.
Figure 4
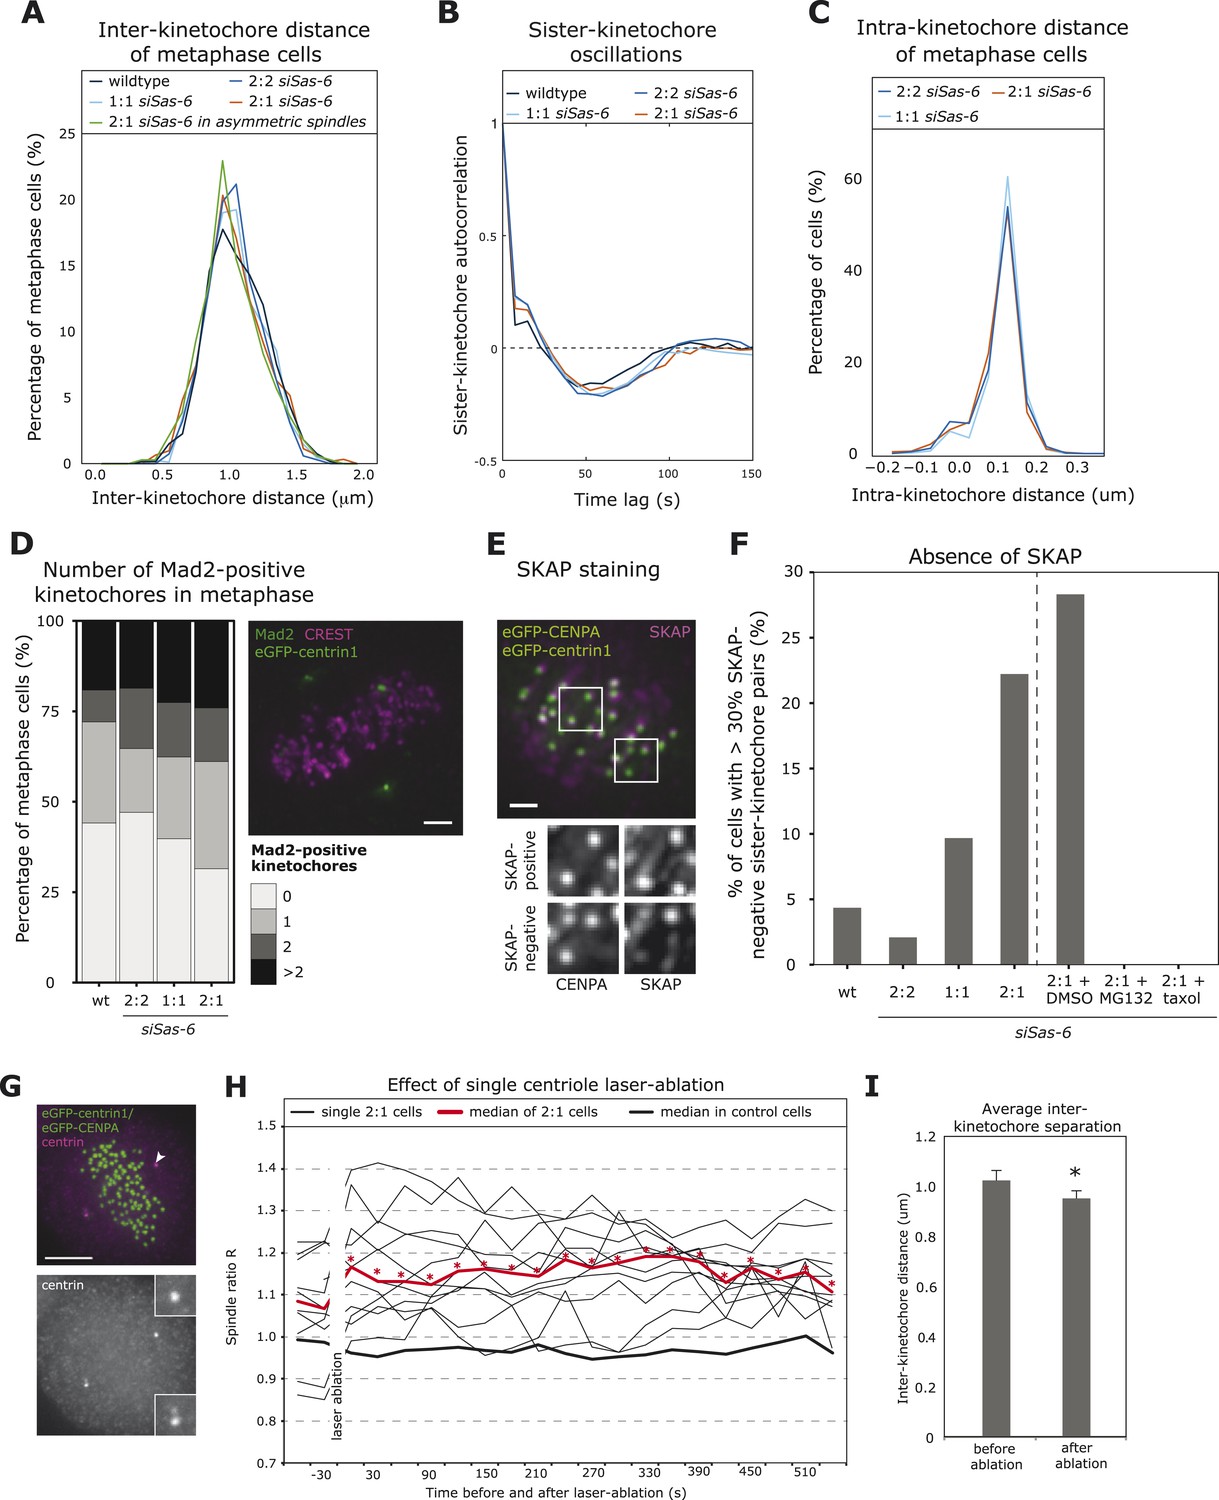
2:1 cells have immature kinetochore–microtubule attachments.
(A, B) Analysis of inter-kinetochore distances and sister-kinetochore oscillations in wild-type, Sas-6-depleted 2:2, 1:1, 2:1, or the subset of 2:1 eGFP1-centrin1/CENPA metaphase cells with an asymmetric plate position based on our in-house kinetochore tracking assay (Jaqaman et al., 2010), n = 620–889 kinetochores in 36–48 cells. The distribution of inter-kinetochore distances (CENPA to CENPA distance) is shown in A (no significant difference, t-test, p = 0.99), and the autocorrelation of the sister-kinetochore movements in B. The first minima of the autocorrelation curve indicate the half-period of the chromosome oscillations, and their depth the regularity of the oscillations. (C) Distribution of intra-kinetochore distances in wild-type and Sas-6-depleted 2:2, 1:1, or 2:1 eGFP1-centrin1/CENPA metaphase cells. Cells were stained with antibodies against the N-terminus of HEC1. Using the tracking assay, we determined for each sister-kinetochore pair the CENPA–CENPA and the HEC1-HEC1 distances, and calculated the CENPA-HEC1 distances by halving the difference, n = 701–790 kinetochores in 26–30 cells in 3 experiments (no significant difference, Mann–Whitney test, 2:1 vs 2:2, p = 0.203). (D) Quantification of Mad2-positive kinetochores in wild-type or Sas-6-depleted 2:2, 1:1, or 2:1 cells. eGFP-centrin1 (green) metaphase cells were stained with anti-Mad2 (green), and CREST sera (magenta; left panel) and the number of Mad2-positive kinetochores quantified in the right panel (n = 50–102 cells in 2 (wt) or 8 (siSas-6) experiments; no significant difference was found; Fisher's exact test, p = 0.17). Scale bar indicates 2 μm. (E, F) Quantification of SKAP-negative kinetochores in wild-type, siSas-6-depleted 2:2, 2:1, 2:1 + DMSO, 2:1, 2:1 + MG132, and 2:1 + taxol-treated eGFP-centrin1/CENPA cells. Cells were stained with antibodies against the kinetochore protein SKAP (magenta), as shown in E (maximum-intensity projection of 8 stacks [z = 0.3 μm]). Using the eGFP-CENPA (green) signal, we quantified the number of sister-kinetochore pairs with at least one SKAP-negative kinetochore (as shown in inlets). Quantification in F shows the percentage of cells where more than 30% of the sister-pairs were SKAP-negative. Fisher's exact test for 2:1 > 2:2, p = 0.0013. n = 46–72 cells in N = 4–7 experiments. Scale bar indicates 2 μm. (G) Example of an eGFP-centrin1/CENPA (green) cell in which a single daughter centriole was ablated (white arrow indicates the location of the laser pulse). Cells were fixed and stained with anti-centrin sera (magenta) to confirm the loss of a centriole, as opposed to the mere bleaching of eGFP-centrin1. Scale bar indicates 5 μm. (H) Plot of half-spindle ratio R over time in 11 single eGFP-centrin1/CENPA cells in which a single centriole was ablated. The time point of laser ablation is t = 0. The thick red curve indicates the median of R of laser ablated 2:1 cells (* denotes when median R is asymmetric [p < 0.01]), the thick black curve indicates the median R distribution of 8 control-ablated cells. (I) Average inter-kinetochore distances in eGFP-centrin1/CENPA cell before or after a single daughter centriole was ablated as determined by the kinetochore tracking assay. Error bars indicate s.e.m. n = 11 cells, 2 time points before and after ablation and on average 20 kinetochores per cell. * denotes a statistically significant difference (p = 0.001 in two-tailed paired t-test).
Figure 5 with 1 supplement
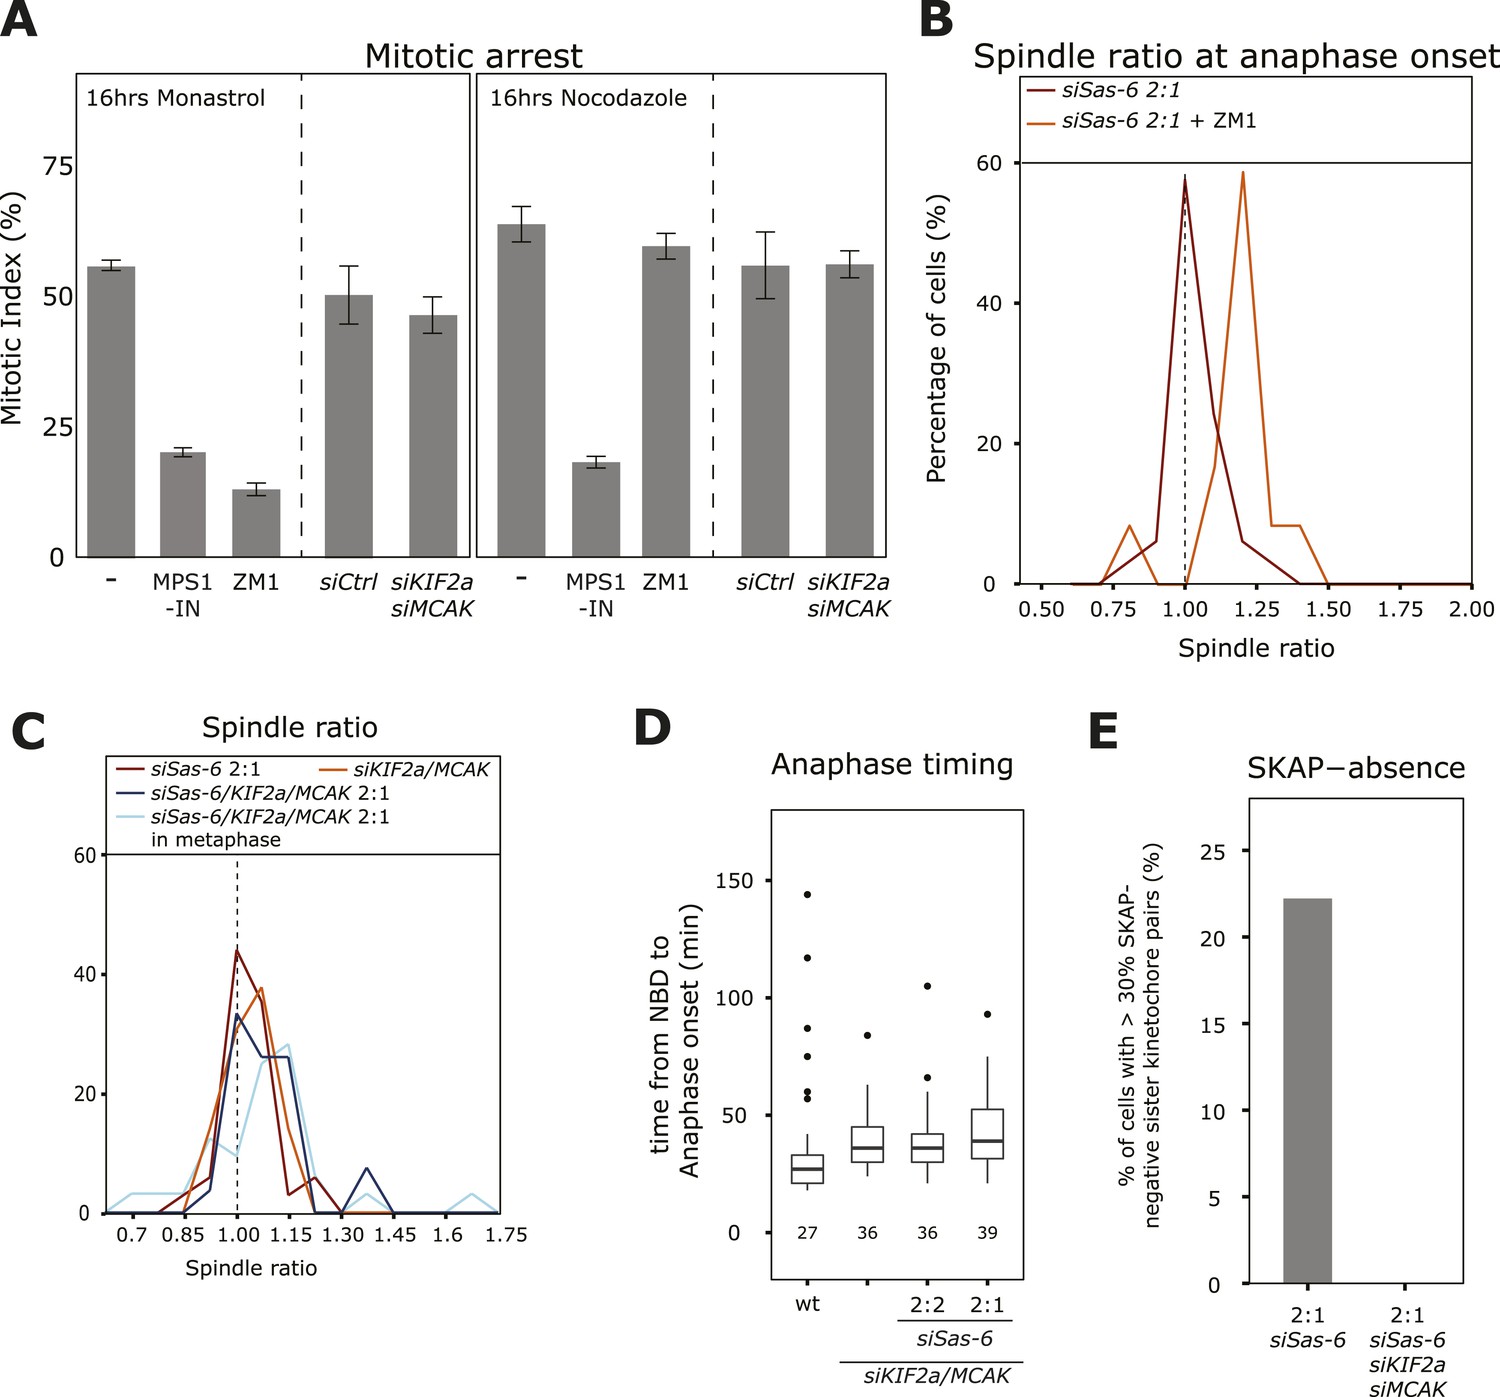
Depleting KIF2a and MCAK overcomes the SAC response in 2:1 cells.
(A) Mitotic index of untreated, ZM-1-treated, MPS1-IN-treated, control-depleted, or KIF2a/MCAK-depleted cells treated for 16 hr with nocodazole (unattached kinetochores) or monastrol (lack of tension), n ≥ 400 cells in 3–4 experiments, error bars indicate s.e.m. * ZM1 and MPS1-IN overcome a monastrol arrest (t-test p < 0.0001), and MPS1-IN overcomes a nocodazole arrest (t-test p = 0.0044). (B) Distribution of spindle ratio R in Sas-6-depleted eGFP-centrin1/CENPA 2:1 cells at anaphase onset treated with or without the Aurora-B inhibitor ZM1. Data from Figure 1E without Aurora-B inhibition are shown for comparison. Aurora-B inhibition allows cells to enter anaphase with asymmetric spindles (n = 12 cells; Mann–Whitney U test, p = 7.57 × 10⁻⁶). (C) Distribution of spindle ratios R in Sas-6-depleted 2:1, KIF2a/MCAK-depleted, and KIF2a/MCAK/Sas-6-depleted 2:1 eGFP-centrin1/CENPA cells in metaphase or at anaphase onset. (D) Boxplots of anaphase timing of wild-type, KIF2a/MCAK-depleted, or KIF2a/MCAK/Sas-6 depleted 2:2 and 2:1 eGFP1-centrin2/H2B-mRFP cells. n = 23–61 cells in 1–3 experiments. (E) Quantification of SKAP-negative kinetochores as in Figure 4F in Sas-6-depleted 2:1 and KIF2a/MCAK/Sas-6-depleted 2:1 eGFP-centrin1/CENPA cells. SAC, spindle assembly checkpoint.
Figure 5—figure supplement 1
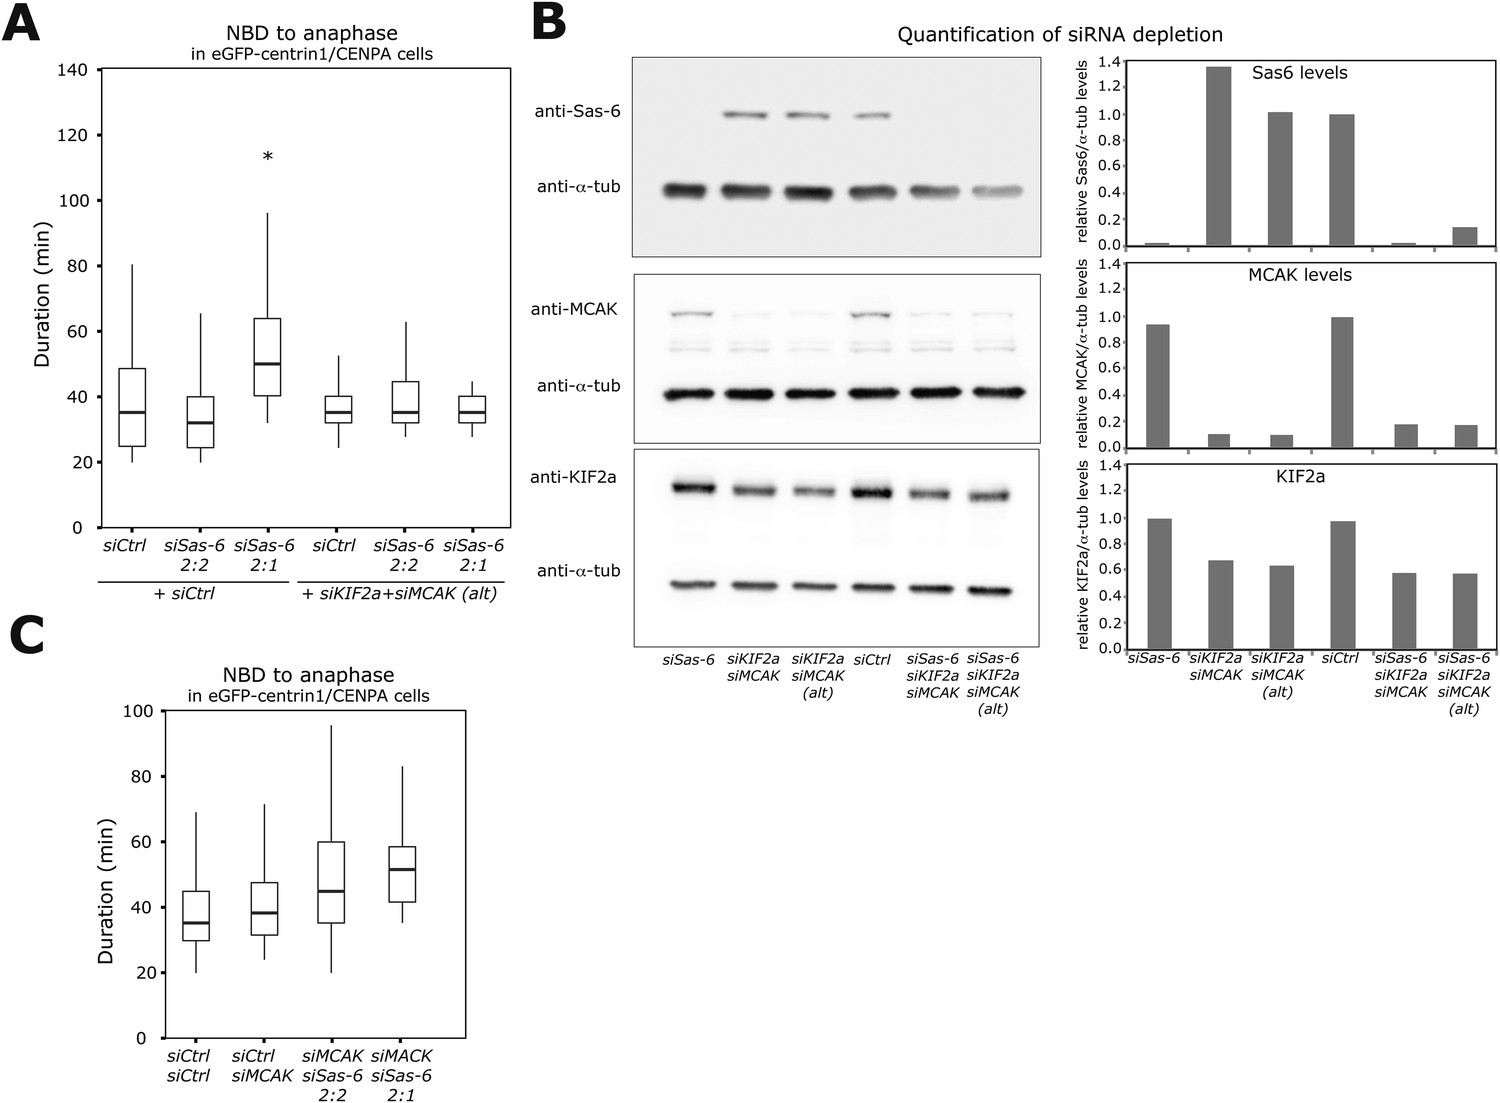
Validation of Sas-6, KIF2a, and MCAK co-depletion.
(A) Boxplots of anaphase timing of siControl, siSas-6 2:2, siSas-6 2:1, siCtrl/KIF2a/MCAK, siKIF2a/MCAK/Sas-6 2:2, and siKIF2a/MCAK/Sas-6 2:1 eGFP1-centrin1/CENPA cells. n = 14–78 cells in 3 independent experiments. Note that siSas-6 2:1 cells are delayed compared to siSas-6 2:2 cells (p < 0.00001 in Mann–Whitney test), but that siKIF2a/MCAK/Sas-6 2:1 are not delayed compared to siKIF2a/MCAK/Sas-6 2:2 cells. (B) Immunoblots of eGFP1-centrin2/H2B-mRFP cells treated with the indicated siRNA and probed with anti-Sas6, anti-MCAK, anti-KIF2A and anti-α-tubulin (loading control) antibodies. The relative ratio with the α-tubulin signal is quantified for each condition on the right panels. Note the KIF2a siRNA only led to a partial depletion. (C) Boxplots of anaphase timing of siControl, siCtrl/MCAK, siMCAK/Sas-6 2:2, siMCAK/Sas-6 2:1 eGFP1-centrin1/CENPA cells. n = 9–169 cells in 3 independent experiments.
Figure 6
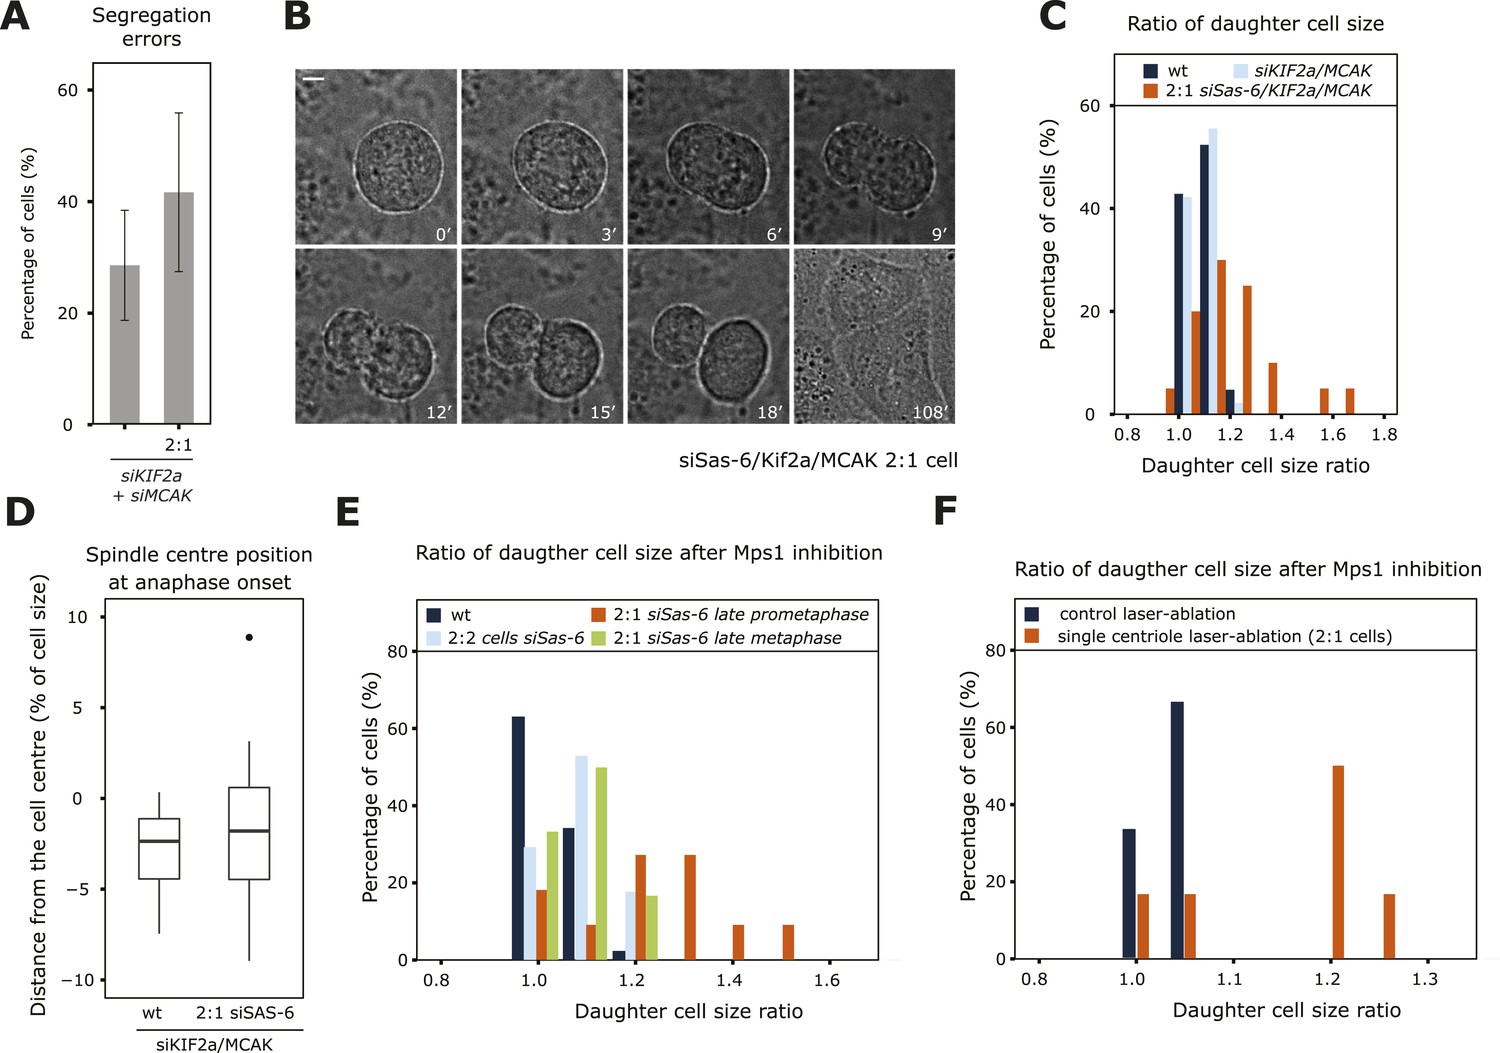
An asymmetric plate position at anaphase onset leads to segregation errors and asymmetric cell division.
(A) Quantification of chromosome segregation errors in KIF2a/MCAK-depleted and KIF2a/MCAK/Sas-6-depleted 2:1 eGFP-centrin1/eGFP-CENPA cells based on time-lapse images. n = 12–21 cells in 2–4 experiments. Error bars indicate s.e.m. (B, C) Wild-type, KIF2a/MCAK-depleted or KIF2a/MCAK/Sas-6-depleted 2:1 eGFP-centrin1/CENPA cells were recorded by time-lapse imaging using the eGFP-centrin1 signal to count centrioles and phase contrast to detect the cell membrane as shown in B for a siKIF2a/MCAK/Sas-6 2:1 cell (scale bar = 5 μm). Phase contrast images were used to quantify the ratio of the two daughter cell sizes, which was plotted as a histogram in C. Half the Kif2a/MCAK/Sas-6-depleted 2:1 cells had a ratio of over 1.2, a ratio never observed in other conditions (t-test with Welch's correction between KIF2a/MCAK and KIF2a/MCAK/Sas-6 2:1, p = 3.1e-05; n = 20–45 cells in 2–4 experiments). (D) Quantification of spindle center position in relation to cell center in KIF2a/MCAK-depleted or KIF2a/MCAK/Sas-6 2:1 eGFP-centrin1/CENPA cells at anaphase onset. n = 20–45 cells in 2–4 experiments. (E) Wild-type HeLa eGFP-centrin1/eGFP-CENPA cells, 2:2 cells, 2:1 cells in late prometaphase (still 1–2 chromosomes not perfectly aligned on the plate), or 2:1 cells in late metaphase (plate perfectly in the middle) were treated with an Mps1 inhibitor and recorded by time-lapse imaging using phase contrast to detect the cell membrane as shown in B. Shown is the ratio of the two daughter cell sizes; 45% of the 2:1 cells treated in late prometaphase/early metaphase had a ratio of over 1.2, a ratio never observed in other conditions (t-test with Welch's correction between 2:1 cells in late prometaphase and 2:1 cells in late metaphase, p = 0.0141; n = 11–17 cells in 3 experiments). See also Videos 5, 6. (F) HeLa eGFP-centrin1/CENPA cells were treated with a laser pulse in the cytoplasm (control) or ablation of a centriole (2:1 cells) and acutely treated with an Mps1 inhibitor to force cells into anaphase. Shown is the ratio of the two daughter cell sizes. Note that 67% of the 2:1 cells treated in late prometaphase/early metaphase had a ratio of over 1.2, a ratio never observed in other conditions (t-test with Welch's correction between control and 2:1 cells p = 0.0451; n = 6). See also Videos 7, 8.
Videos
Video 1
Sas-6-depleted 2:2 HeLa cell expressing eGFP-centrin1 (centriole marker; green) and mRFP-α-tubulin (microtubules; red) in mitosis.
Time is indicated in minutes.
Video 2
Sas-6-depleted 2:1 HeLa cell expressing eGFP-centrin1 (centriole marker; green) and mRFP-α-tubulin (microtubules; red) in mitosis.
Time is indicated in minutes. Note the spindle rotation movements.
Video 3
Sas-6-depleted 1:1 HeLa cell expressing eGFP-centrin1 (centriole marker; green) and mRFP-α-tubulin (microtubules; red) in mitosis.
Time is indicated in minutes.
Video 4
Laser-ablated 2:1 HeLa cell expressing eGFP-centrin1 (centriole marker) and eGFP-CENPA (kinetochore marker) in metaphase.
Note the asymmetric metaphase plate position after the ablation of a single centriole.
Video 5
KIF2a/MCAK-depleted HeLa cell expressing eGFP-centrin1 (centriole marker; green) and eGFP-CENPA (kinetochore marker; green) entering anaphase and recorded with phase contrast microscopy.
https://doi.org/10.7554/eLife.05124.017
Video 6
KIF2a/MCAK/Sas-6-depleted 2:1 HeLa cell expressing eGFP-centrin1 (centriole marker; green) and eGFP-CENPA (kinetochore marker; green) entering anaphase and recorded with phase contrast microscopy.
Note the asymmetric cell division.
Video 7
Laser-ablated control (ablation in the cytoplasm) HeLa cell expressing eGFP-centrin1 (centriole marker) and eGFP-CENPA (kinetochore marker) treated in metaphase with an Mps1 inhibitor.
Shown is the GFP-fluorescence channel (left) and the DIC channel (right). Note how the cell divides in a symmetric manner.
Video 8
Laser-ablated 2:1 HeLa cell expressing eGFP-centrin1 (centriole marker) and eGFP-CENPA (kinetochore marker) treated in metaphase with an Mps1 inhibitor.
Shown is the GFP-fluorescence channel (left) and the DIC channel (right). Note how the cell divides in an asymmetric manner.
Tables
Table 1
Number of cells in every experiment
| Condition | N° of cells |
|---|---|
| WT | 40 |
| WT at anaphase onset | 42 |
| WT + MPS1-IN | 19 |
| SiSas-6 2:2 cells | 41 |
| SiSas-6 2:2 cells at anaphase onset | 29 |
| SiSas-6 2:2 cells + MPS1-IN | 19 |
| SiSas-6 2:1 cells | 59 |
| siSas-6 2:1 cells + MG132 | 18 |
| SiSas-6 2:1 cells at anaphase onset | 33 |
| SiSas-6 2:1 cells in long term videos | 14 |
| SiSas-6 2:1 cells + MPS1-IN | 26 |
| SiSas-6 1:1 cells | 36 |
| SiKif2a + siMCAK | 20 |
| SiKif2a + siMCAK at anaphase onset | 41 |
| SiKif2a + siMCAK + siSas-6 2:1 cells | 29 |
| SiKif2a + siMCAK + siSas-6 2:1 cells at anaphase onset | 24 |
| SiSas-6 2:1 cells + ZM1 | 10 |
| SiSas-6 2:2 + DMSO | 15 |
| SiSas-6 2:2 + taxol | 11 |
| SiSas-6 2:1 + DMSO | 16 |
| SiSas-6 2:1 + taxol | 15 |
| Centriole laser-ablation (2:1) | 11 |
| Control laser-ablation | 8 |
| Centriole laser-ablation (2:1) + Mps1 inhibitor | 6 |
| Control laser-ablation + Mps1 inhibitor | 6 |
Additional files
-
Source code 1
Custom built software in Matlab.
- https://doi.org/10.7554/eLife.05124.021
Download links
A two-part list of links to download the article, or parts of the article, in various formats.
Downloads (link to download the article as PDF)
Open citations (links to open the citations from this article in various online reference manager services)
Cite this article (links to download the citations from this article in formats compatible with various reference manager tools)
The equatorial position of the metaphase plate ensures symmetric cell divisions
eLife 4:e05124.
https://doi.org/10.7554/eLife.05124


