Large-scale whole genome sequencing of M. tuberculosis provides insights into transmission in a high prevalence area
- London School of Hygiene and Tropical Medicine, United Kingdom
- Karonga Prevention Study, Malawi
- Wellcome Trust Sanger Institute, United Kingdom
Figures
Figure 1

Phylogenetic tree of all samples from Karonga.
Lineages form monophyletic groups within the phylogeny, as expected. Lineage 1 (Indo Oceanic) is represented in dark blue, Lineage 2 (Beijing/East Asian) in light blue, Lineage 3 (East African Indian) in green, and Lineage 4 (Europe American) in red.
Figure 2 with 1 supplement
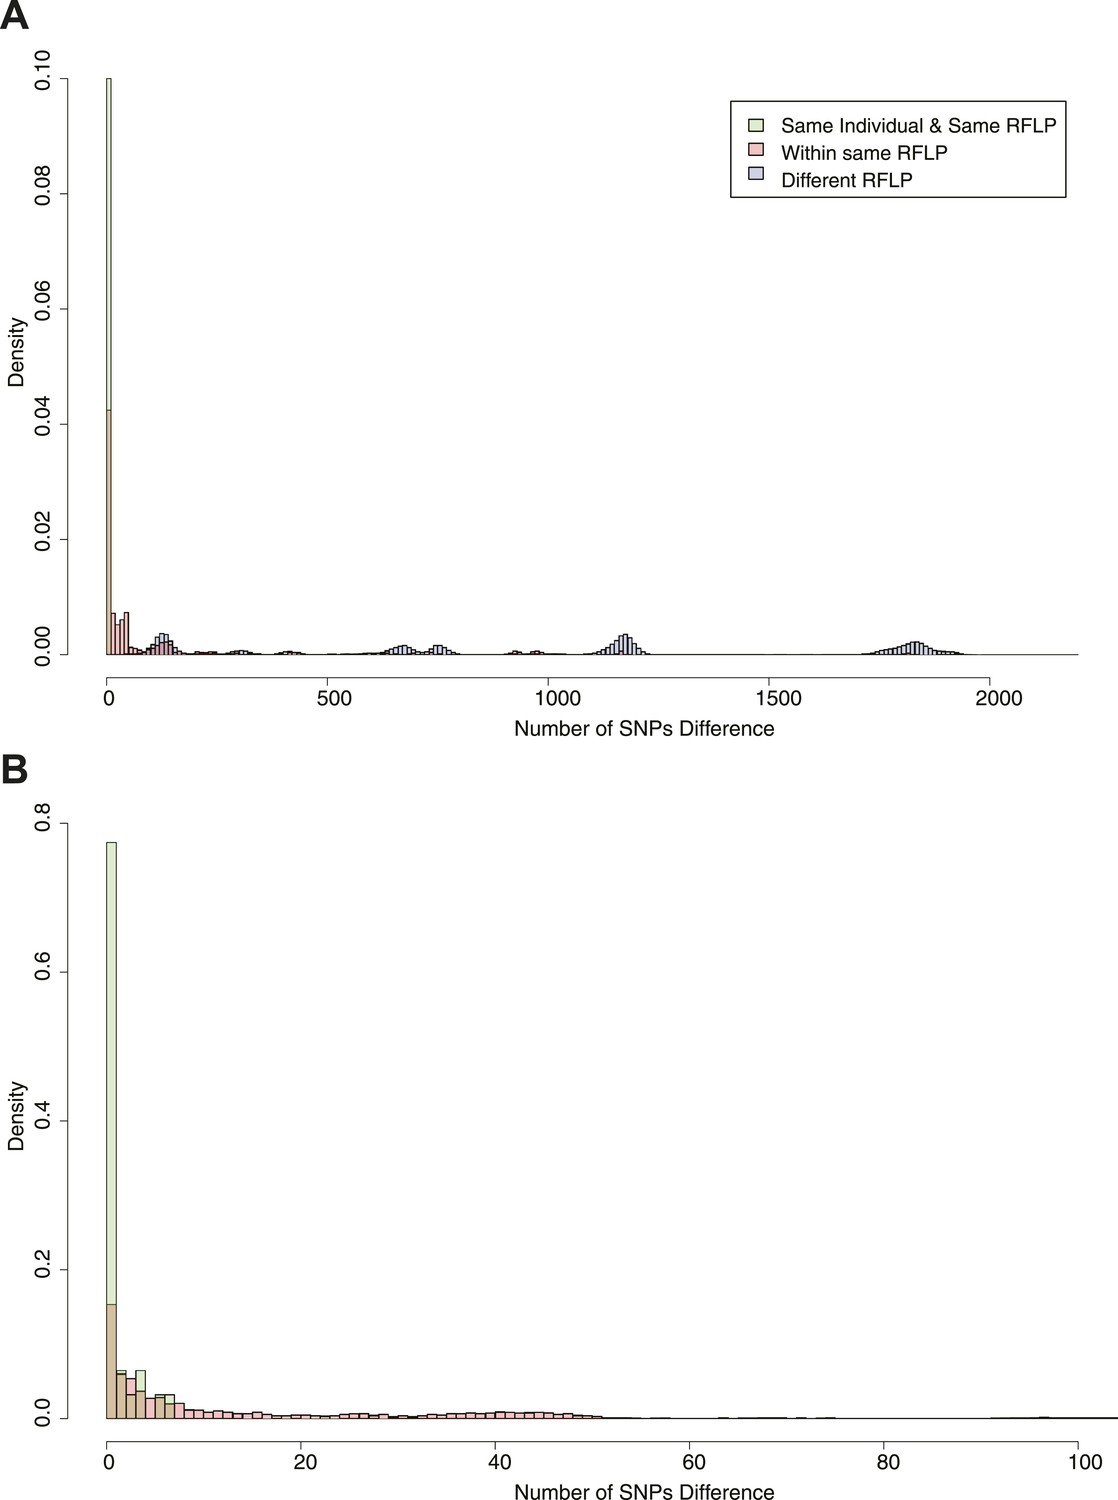
Pairwise SNP distances between all pairs of samples with known RFLP.
The y axis shows the relative frequency within each subgroup: same RFLP pattern (red), different RFLP patterns (blue); same individual, same RFLP (green). (A) shows the full data set, and (B) is part of the same figure drawn at a larger scale (each bar corresponds to 1 SNP) to show the smaller distances more clearly.
Figure 2—figure supplement 1
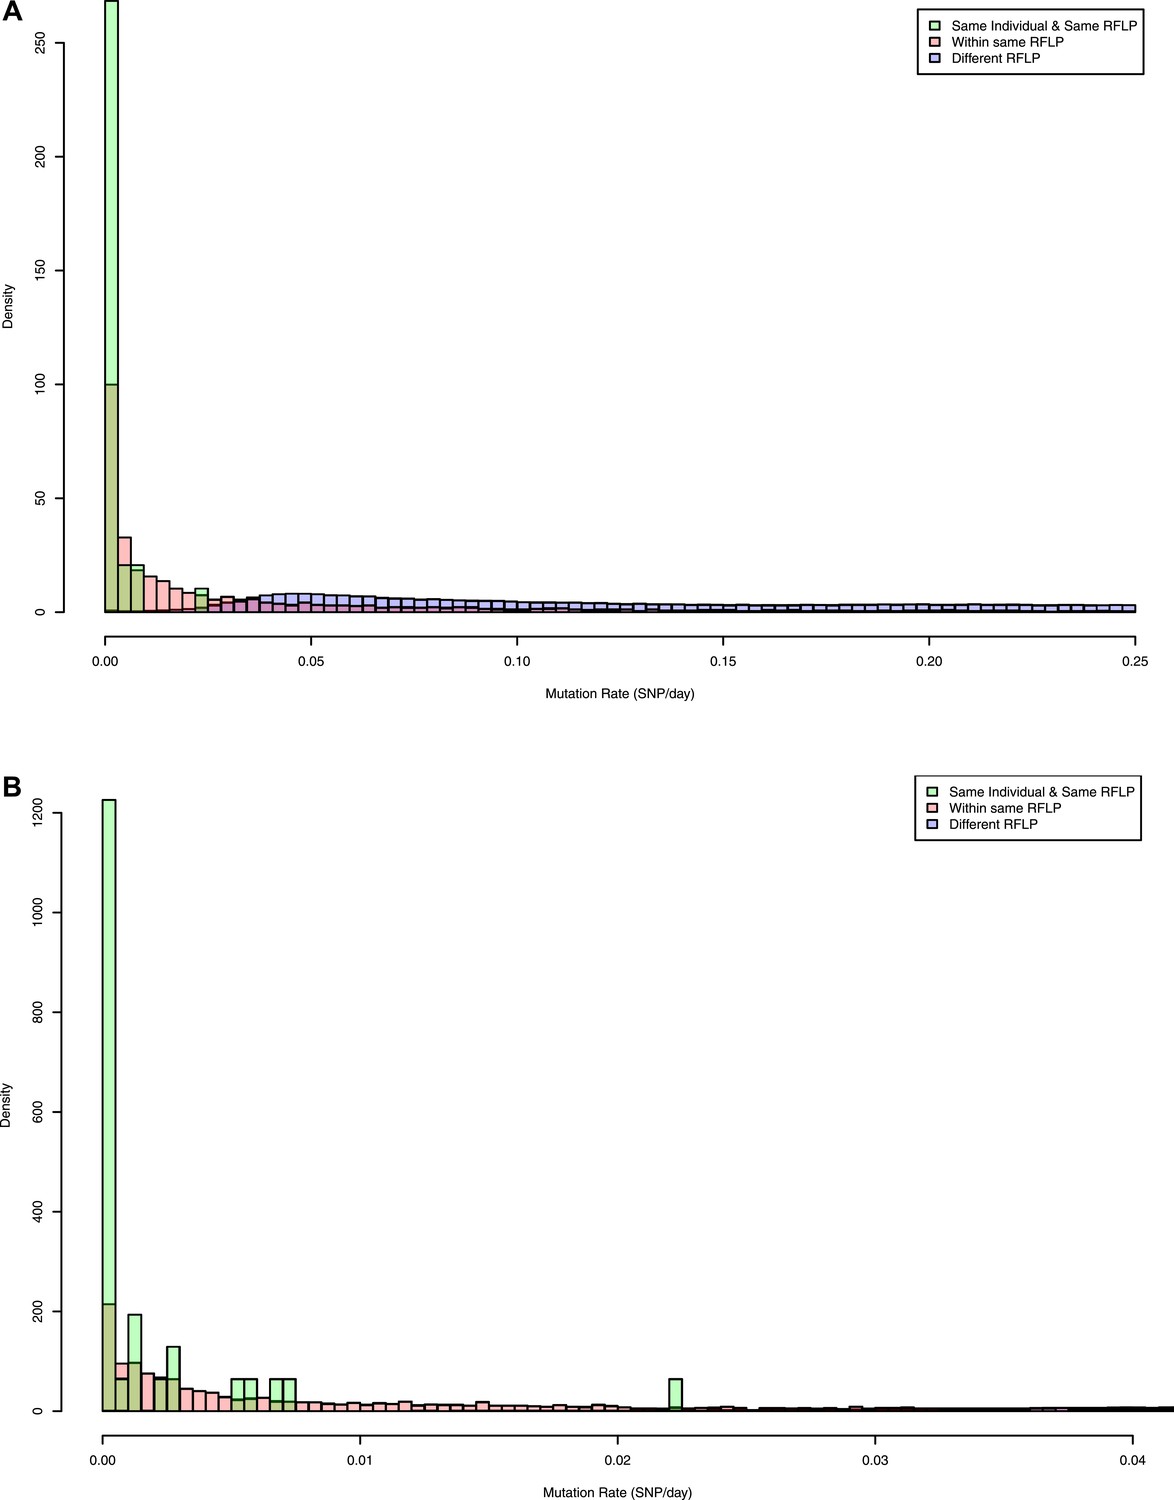
Pairwise mutation rates between all pairs of samples with known RFLP (calculated as number of SNPs/number of days between dates of disease onset between individuals).
The y axis shows the relative frequency within each subgroup: same RFLP pattern (red), different RFLP patterns (blue); same individual, same RFLP (green). (A) shows the full data set, and (B) is part of the same figure drawn at a larger scale (each bar corresponds to 0.001 SNP/day) to show the smaller distances more clearly.
Figure 3 with 1 supplement
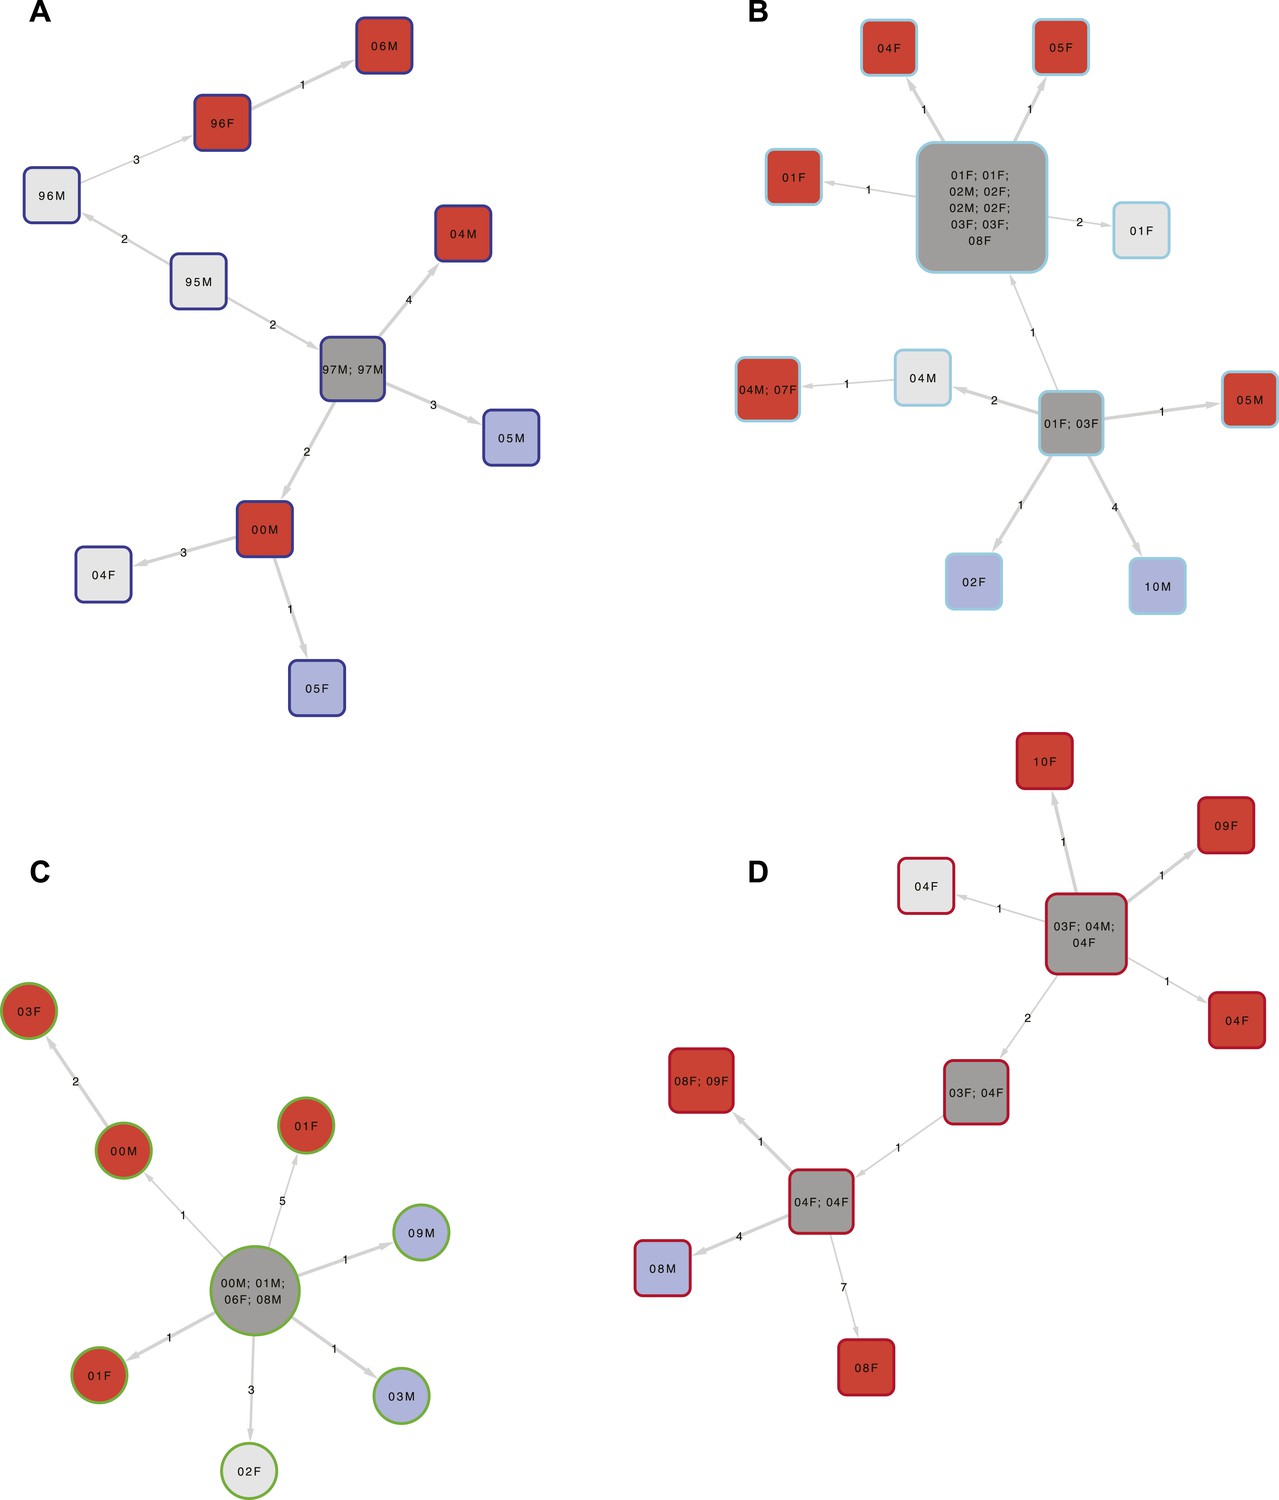
Examples of clusters built using SeqTrack.
All clusters are shown in Figure 3—figure supplement 1. Each polygon represents a patient, with larger polygons representing two or more patients with identical sequences. The patient details are written inside the polygon: F = female, M = male. The number is the year of the start of the disease episode. The shapes describe drug resistance of the strain: squares = drug sensitive, circles = drug resistant. The colour of the polygon refers to HIV status of the patient: red = positive, blue = negative, grey = unknown (or multiple patients). The colour of the edge refers to the lineage: Lineage 1 (Indo Oceanic) dark blue (B), Lineage 2 (Beijing/East Asian) light blue (C), Lineage 3 (East African Indian) green (A), and Lineage 4 (Europe American) red (D). The numbers on the arrows between the polygons are the number of SNPs between them.
Figure 3—figure supplement 1
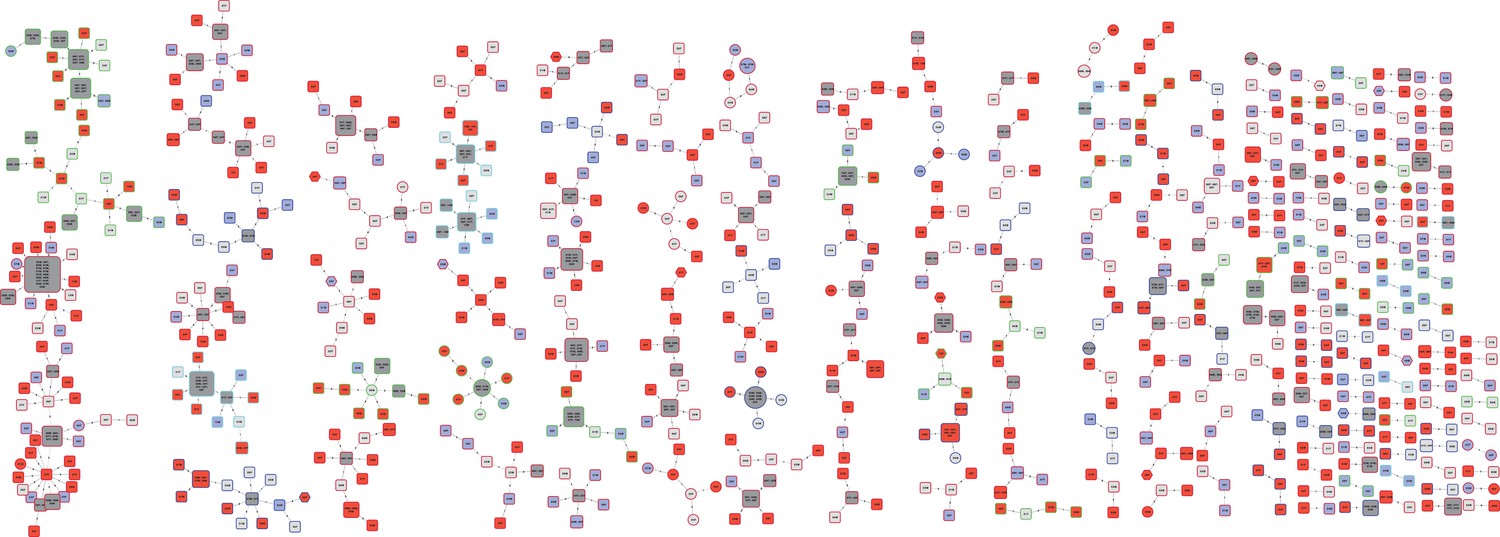
Clusters built using SeqTrack.
Each polygon represents a patient, with larger polygons representing two or more patients with identical sequences. The patient details are written inside the polygon: F = female, M = male. The number is the year of the start of the disease episode. The shapes describe drug resistance of the strain: squares = drug sensitive, circles = drug resistant, octagons = unknown. The colour of the polygon refers to HIV status of the patient: red = positive, blue = negative, grey = unknown. The colour of the edge refers to the lineage: Lineage 1 (Indo Oceanic) dark blue, Lineage 2 (Beijing/East Asian) light blue, Lineage 3 (East African Indian) green, and Lineage 4 (Europe American) red. The numbers on the arrows between the polygons are the number of SNPs between them.
Figure 4 with 2 supplements
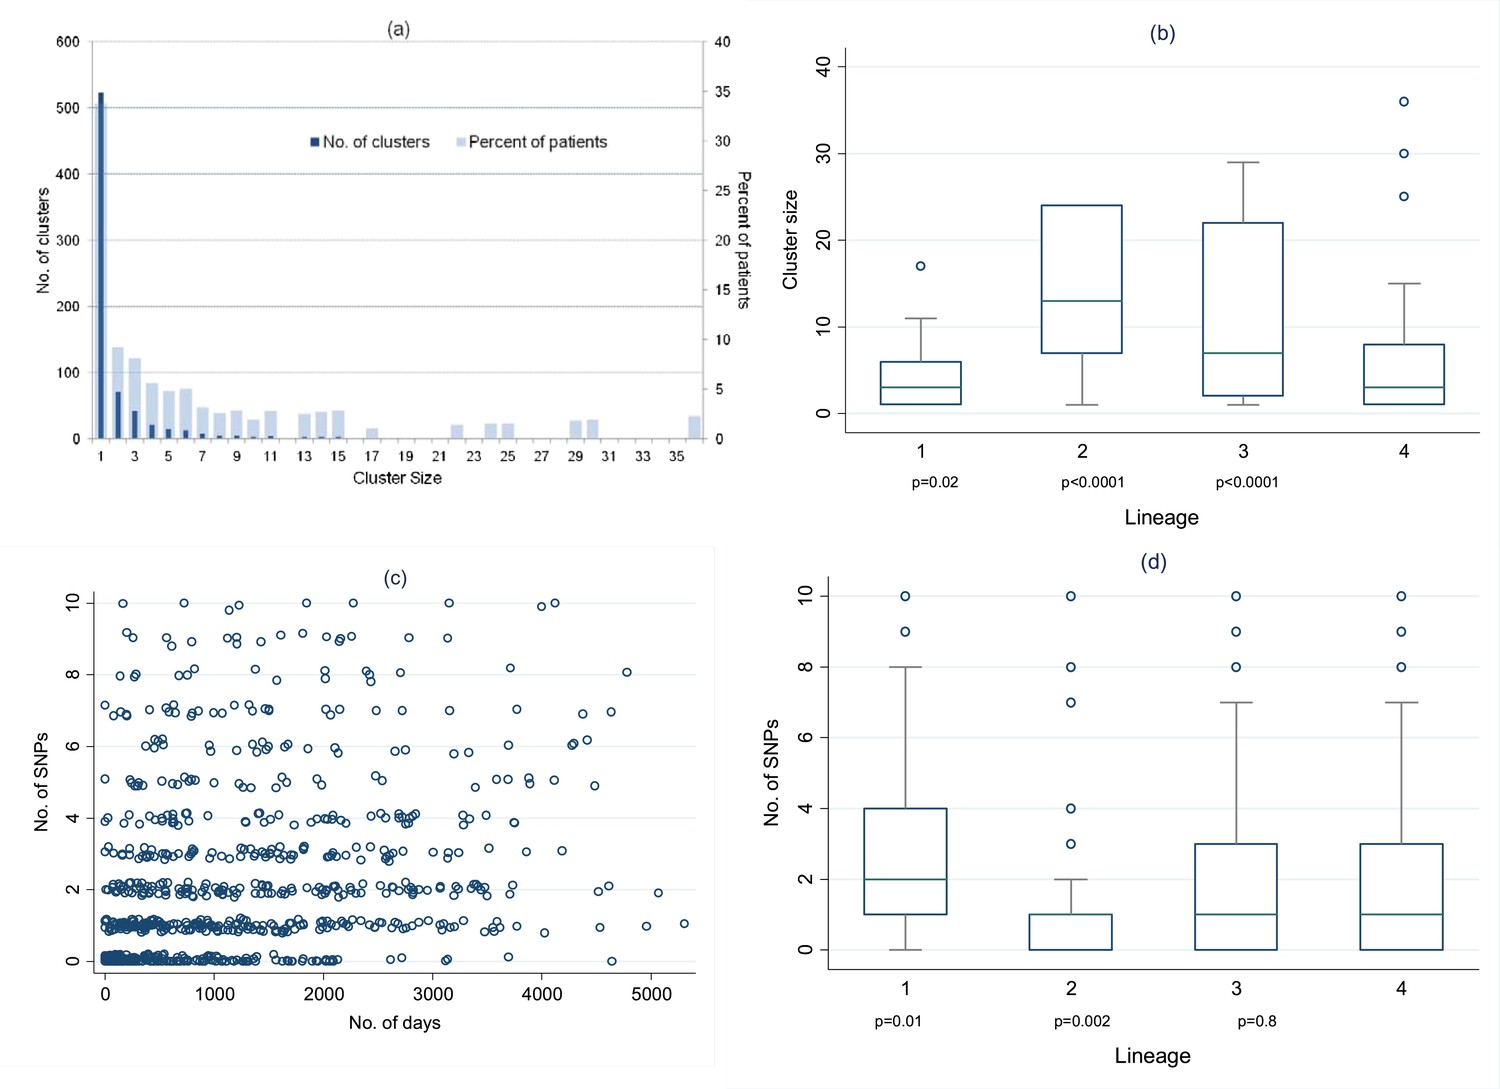
Distribution of clusters and SNPs.
(A) Number of clusters of different sizes and percentage of patients in clusters of different sizes. Cluster size 1 refers to unclustered patients. (B) Cluster size by lineage. The p values are for the comparison of each lineage with lineage-4 (Wilcoxon rank sum test). (C) Relationship between number of SNPs between individuals and the time interval between disease onset in each individual of the pair. (Random noise has been introduced to allow multiple similar results to be visualized.) Linear regression gives r2 = 10%, p < 0.001, slope 0.26 SNPs per year (95% CI 0.21–0.31). (D) Number of SNPs between individuals in clusters, by lineage. The p values are for the comparison of each lineage with lineage-4 (Wilcoxon rank sum test).
Figure 4—figure supplement 1
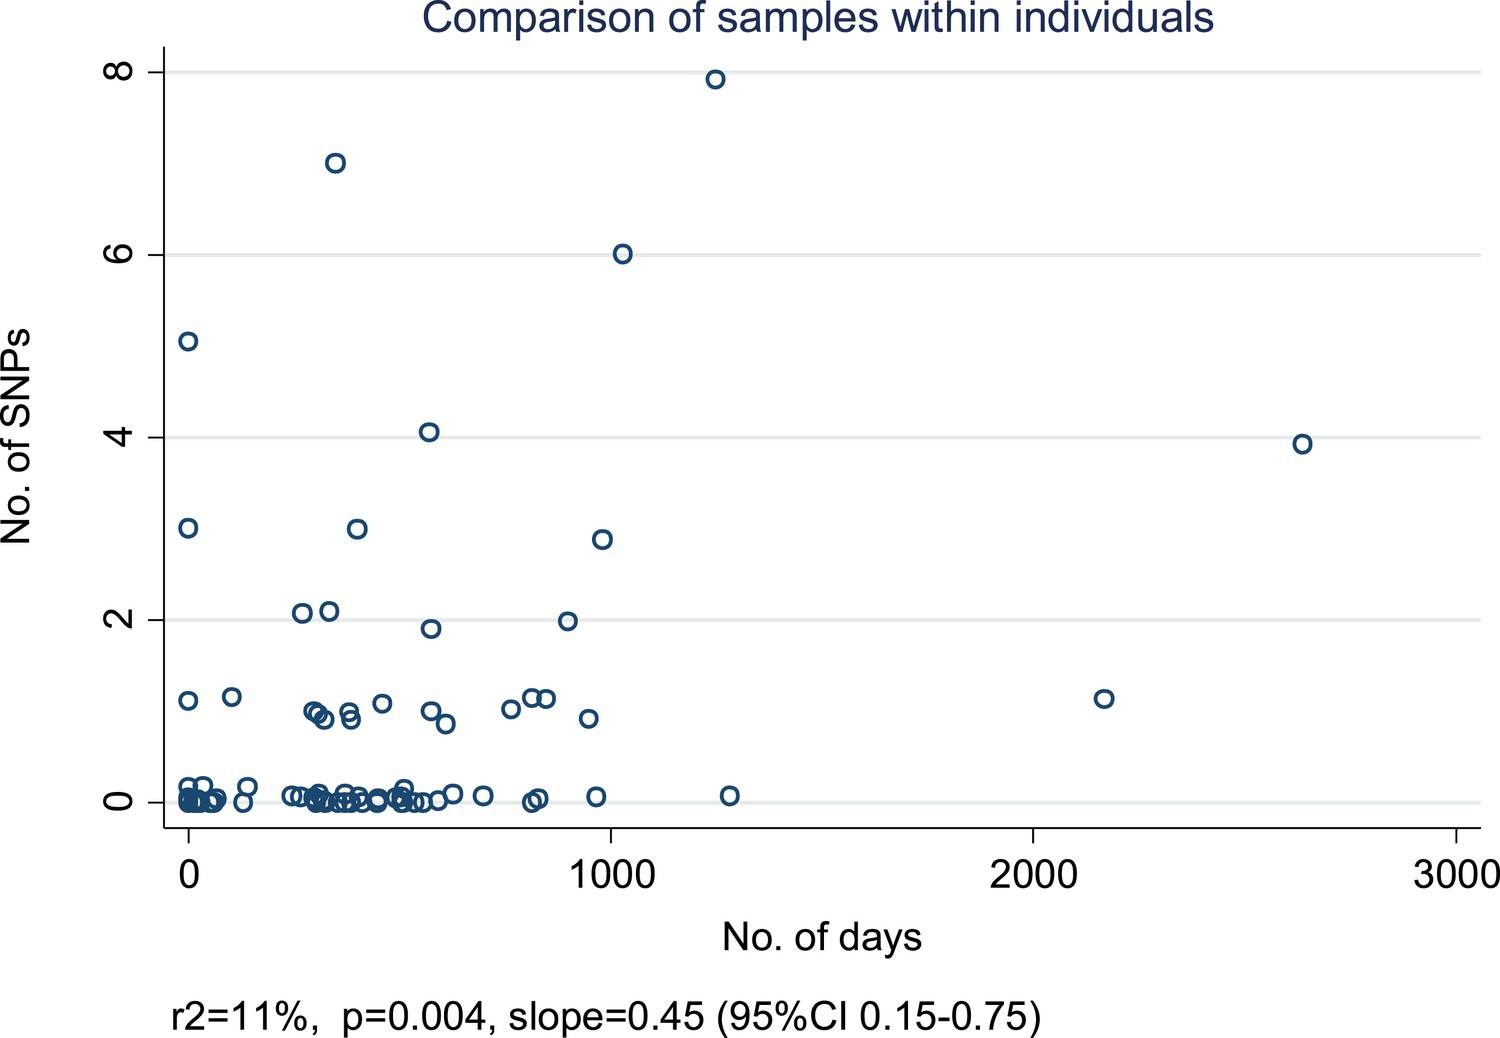
Relationship between number of SNPs and the number of days between samples from individuals with more than one specimen available from the same of episode of disease or from a relapse.
For each individual, we selected the first and last specimens if there were more than two. (Random noise has been introduced to allow multiple similar results to be visualized.) The slope is given in SNPs/year.
Figure 4—figure supplement 2
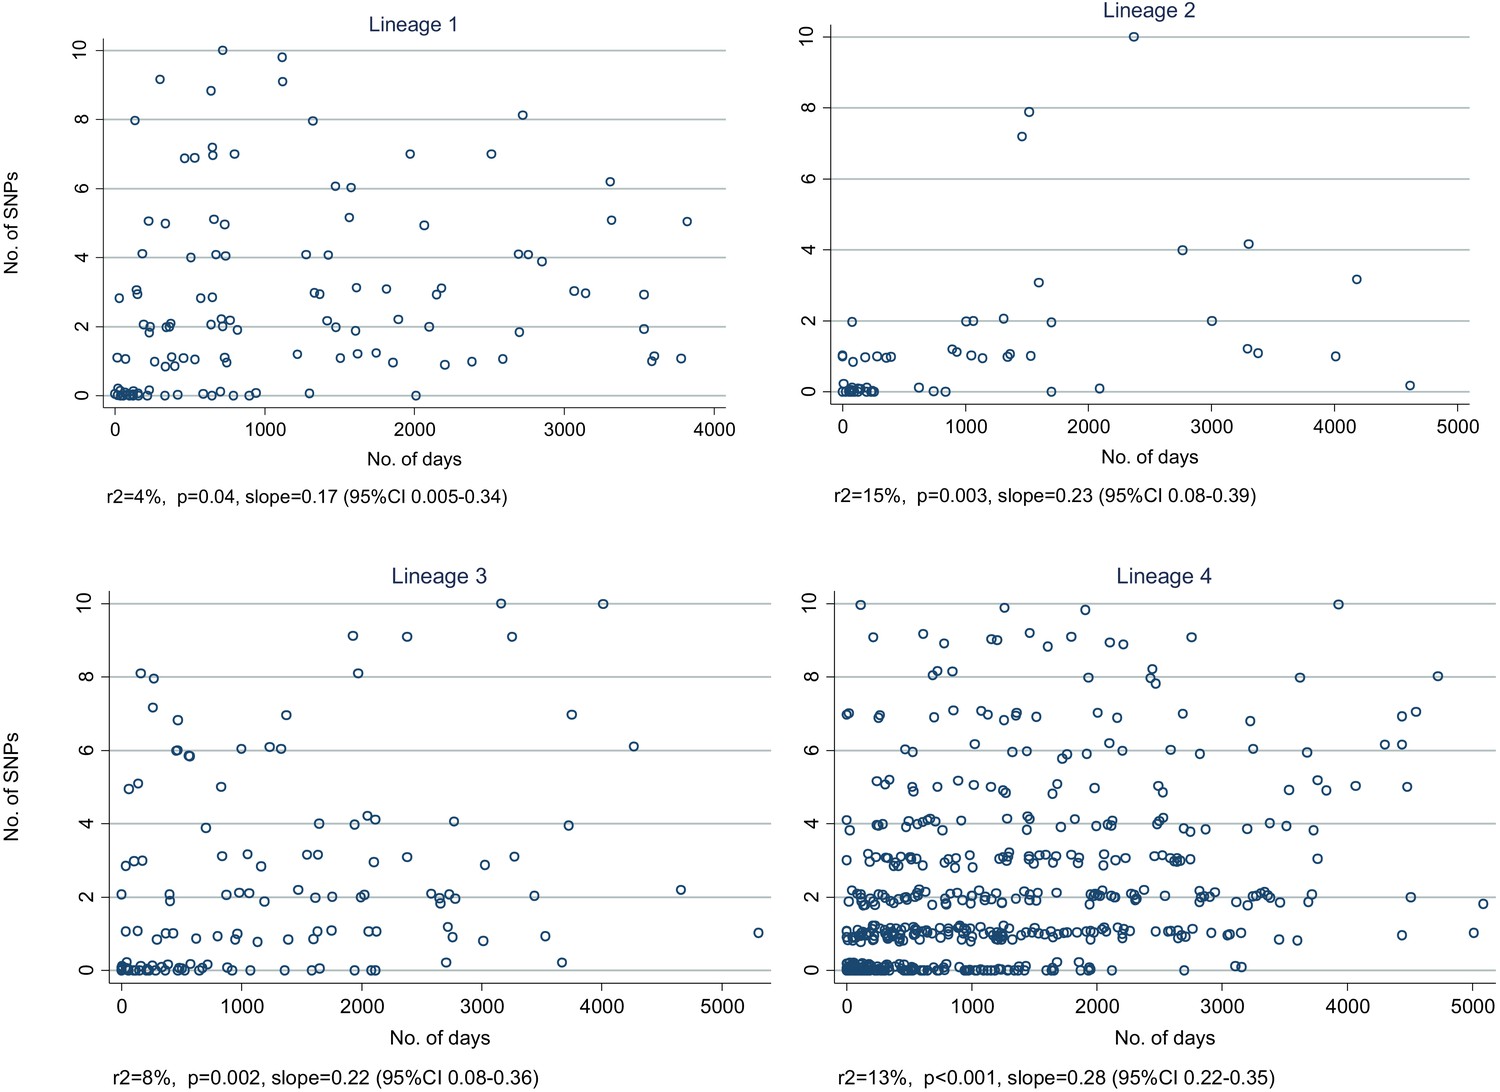
Relationship between number of SNPs and the number of days between dates of disease onset for transmissions identified from the network, by lineage.
(Random noise has been introduced to allow multiple similar results to be visualized.) The slopes are given in SNPs/year.
Tables
Table 1
Characteristics of patients included in the analysis and distribution of lineages
| Lineage | Overall | p* | ||||
|---|---|---|---|---|---|---|
| 1 | 2 | 3 | 4 | |||
| Overall | 269 (16.0) | 74 (4.4) | 205 (12.2) | 1139 (67.5) | 1687 | |
| Age | ||||||
| <20 | 9 (12.3) | 7 (9.6) | 9 (12.3) | 48 (65.7) | 73 | |
| 20–29 | 46 (10.3) | 26 (5.8) | 48 (10.7) | 327 (73.2) | 447 | |
| 30–39 | 109 (18.4) | 17 (2.9) | 81 (13.7) | 386 (65.1) | 593 | |
| 40–49 | 61 (19.8) | 18 (5.8) | 39 (12.7) | 190 (61.7) | 308 | |
| 50+ | 44 (16.5) | 6 (2.3) | 28 (10.5) | 188 (70.7) | 266 | 0.001 |
| Sex | ||||||
| Female | 130 (14.6) | 47 (5.3) | 94 (10.6) | 617 (69.5) | 888 | |
| Male | 139 (17.4) | 27 (3.4) | 111 (13.9) | 522 (65.3) | 799 | 0.02 |
| Year | ||||||
| 1995–1998 | 55 (15.5) | 8 (2.3) | 29 (8.2) | 263 (74.1) | 355 | |
| 1999–2001 | 43 (11.5) | 23 (6.1) | 43 (11.5) | 266 (70.9) | 375 | |
| 2002–2004 | 80 (19.4) | 22 (5.3) | 54 (13.1) | 257 (62.2) | 413 | |
| 2005–2007 | 54 (17.4) | 11 (3.5) | 44 (14.2) | 202 (65.0) | 311 | |
| 2008–2010 | 37 (15.9) | 10 (4.3) | 35 (15.0) | 151 (64.8) | 233 | 0.004 |
| TB type | ||||||
| Smear+ | 212 (17.3) | 52 (4.3) | 156 (12.8) | 804 (65.7) | 1224 | |
| Smear− | 46 (12.1) | 19 (5.0) | 38 (10.0) | 276 (72.8) | 379 | |
| Extrapulmonary | 11 (13.1) | 3 (3.6) | 11 (13.1) | 59 (70.2) | 84 | 0.1 |
| HIV status | ||||||
| Negative | 47 (10.8) | 23 (5.3) | 57 (13.0) | 310 (70.9) | 437 | |
| Positive | 148 (19.3) | 28 (3.6) | 107 (13.9) | 486 (63.2) | 769 | 0.001 |
| Previous TB | ||||||
| No | 251 (16.7) | 66 (4.4) | 171 (11.4) | 1019 (67.6) | 1507 | |
| Yes | 18 (10.0) | 8 (4.4) | 34 (18.9) | 120 (66.7) | 180 | 0.007 |
| Isoniazid resistance | ||||||
| Resistant | 20 (17.2) | 0 (0.0) | 21 (18.1) | 75 (64.7) | 116 | |
| Sensitive | 244 (15.9) | 74 (4.8) | 181 (11.8) | 1033 (67.4) | 1532 | 0.03 |
| Residence | ||||||
| Karonga | 198 (16.4) | 53 (4.4) | 148 (12.3) | 806 (66.9) | 1205 | |
| Malawi | 48 (16.6) | 13 (4.5) | 32 (11.1) | 196 (67.8) | 289 | |
| Other country | 11 (11.5) | 7 (7.3) | 17 (17.7) | 61 (63.5) | 96 | 0.4 |
| Birth place | ||||||
| Karonga | 174 (17.0) | 46 (4.5) | 135 (13.2) | 667 (65.3) | 1022 | |
| Malawi | 55 (16.3) | 14 (4.1) | 31 (9.2) | 238 (70.4) | 338 | |
| Other country | 34 (11.7) | 14 (4.8) | 37 (12.7) | 206 (70.8) | 291 | 0.2 |
-
*
From Χ2 comparison between lineages.
Table 2
Characteristics associated with disease due to recent infection
| Characteristic | Linked/Total | Association with links (unadjusted) | p (lrtest) | Adjusted for age, sex, year, lineage | Adjusted for other variables included in model* | p (lrtest) | |
|---|---|---|---|---|---|---|---|
| n/N | % | OR (95% CI) | OR (95% CI) | OR (95% CI) | |||
| Overall | 409/1074 | 38.1 | |||||
| Lineage | |||||||
| 1 | 56/183 | 30.6 | 0.76 (0.53–1.1) | 0.81 (0.57–1.2) | 0.81 (0.57–1.2) | ||
| 2 | 34/52 | 65.4 | 3.2 (1.8–5.9) | 3.0 (1.6–5.4) | 3.2 (1.7–5.8) | ||
| 3 | 58/129 | 45.0 | 1.4 (0.96–2.1) | 1.5 (1.0–2.2) | 1.5 (1.0–2.2) | ||
| 4 | 261/710 | 36.8 | 1 | <0.001 | 1 | 1 | <0.001 |
| Age | |||||||
| <20 | 19/36 | 65.8 | 2.9 (1.4–6.0) | 2.5 (1.2–5.4) | 2.6 (1.2–5.6) | ||
| 20–29 | 113/276 | 45.8 | 1.8 (1.2–2.7) | 1.6 (1.1–2.5) | 1.8 (1.2–2.8) | ||
| 30–39 | 152/404 | 39.6 | 1.5 (1.0–2.3) | 1.5 (0.99–2.2) | 1.6 (1.0–2.3) | ||
| 40–49 | 81/201 | 44.2 | 1.7 (1.1–2.7) | 1.0 (1.0–2.6) | 1.7 (1.1–2.6) | ||
| 50+ | 44/157 | 33.5 | 1 | 0.007† | 1 | 1 | 0.03† |
| Sex | |||||||
| Female | 229/575 | 39.8 | 1 | ||||
| Male | 180/499 | 36.1 | 0.85 (0.67–1.1) | 0.05 | 0.93 (0.72–1.2) | 0.94 (0.72–1.2) | 0.4 |
| Year | |||||||
| 1999–2001 | 141/311 | 45.3 | 1 | 1 | 1 | <0.001† | |
| 2002–2004 | 117/322 | 36.3 | 0.69 (0.50–0.95) | 0.73 (0.52–1.0) | 0.69 (0.50–0.97) | ||
| 2005–2007 | 92/244 | 37.7 | 0.73 (0.52–1.0) | 0.78 (0.55–1.1) | 0.70 (0.49–1.0) | ||
| 2008–2010 | 59/197 | 30.0 | 0.52 (0.35–0.75) | 0.001† | 0.53 (0.36–0.77) | 0.48 (0.32–0.70) | |
| TB type | |||||||
| Smear-positive pulmonary | 312/821 | 38.0 | 1 | 1 | |||
| Smear-negative pulmonary | 97/253 | 38.3 | 1.0 (0.76–1.4) | 0.9 | 0.95 (0.71–1.3) | ||
| HIV status | |||||||
| HIV− | 102/283 | 36.0 | 1 | ||||
| HIV+ no ART | 173/436 | 39.7 | 1.2 (0.85–1.6) | 1.1 (0.75–1.5) | |||
| HIV+ on ART | 27/77 | 35.1 | 0.96 (0.56–1.6) | 0.5 | 1.0 (0.56–1.8) | ||
| INH resistance | |||||||
| No | 375/979 | 38.3 | 1 | 1 | |||
| Yes | 28/64 | 43.8 | 1.3 (0.75–2.1) | 0.4 | 1.4 (0.81–2.3) | ||
| Unknown | |||||||
| Recent residence | |||||||
| Karonga | 328/816 | 40.2 | 1 | 1 | 0.005 | ||
| Other Malawi | 56/176 | 31.8 | 0.69 (0.49–0.98) | 0.58 (0.41–0.84) | 0.58 (0.40–0.84) | ||
| Other country | 16/54 | 29.6 | 0.63 (0.34–1.1) | 0.04 | 0.48 (0.26–0.91) | 0.48 (0.26–0.91) | |
| Birth place | |||||||
| Karonga | 267/659 | 40.5 | 1 | 1 | |||
| Other Malawi | 81/227 | 35.7 | 0.81 (0.60–1.1) | 0.79 (0.57–1.1) | |||
| Other country | 59/180 | 32.8 | 0.72 (0.51–1.0) | 0.1 | 0.67 (0.47–0.97) | ||
-
In this analysis individuals are defined as linked (‘backwards links’) using the cut-offs described in the text and if the closest link was with a patient within the previous 5 years. Extrapulmonary, recurrent cases, and cases before 1999 were excluded. Odds ratios (OR) calculated using logistic regression.
-
*
In this model a dummy variable was used for the 32 individuals with missing data on recent residence.
-
†
Test for trend.
Table 3
Characteristics associated with transmissibility
| Characteristic | Any Linked/Total | Association with links | p | Adjusted for age, sex, year, lineage, smear status | p (lrtest) | |
|---|---|---|---|---|---|---|
| n/N | % | OR (95% CI) | OR (95% CI) | |||
| Overall | 431/1346 | 32.0 | ||||
| Lineage | ||||||
| 1 | 59/217 | 27.2 | 0.87 (0.63–1.2) | 0.94 (0.66–1.3) | ||
| 2 | 27/61 | 44.3 | 1.7 (1.0–2.7) | 1.9 (1.1–3.2) | ||
| 3 | 65/154 | 42.2 | 1.6 (1.2–2.3) | 1.9 (1.4–2.7) | ||
| 4 | 280/914 | 30.6 | 1 | 0.006 | 1 | <0.001 |
| Age | ||||||
| <20 | 20/50 | 40.0 | 2.3 (1.2–4.4) | 1.9 (0.98–3.7) | ||
| 20–29 | 134/349 | 38.4 | 2.3 (1.5–3.3) | 2.2 (1.5–3.3) | ||
| 30–39 | 159/490 | 32.5 | 1.7 (1.2–2.5) | 2.0 (1.3–2.9) | ||
| 40–49 | 71/238 | 29.8 | 1.6 (1.0–2.4) | 1.7 (1.1–2.7) | ||
| 50+ | 47/219 | 21.5 | 1 | <0.001 | 1 | 0.002 |
| Sex | ||||||
| Female | 239/718 | 33.3 | 1 | 1 | ||
| Male | 192/628 | 30.6 | 0.87 (0.69–1.1) | 0.2 | 0.93 (0.73–1.2) | 0.5 |
| Year | ||||||
| 1995–1998 | 159/314 | 50.6 | 1 | 1 | ||
| 1999–2001 | 119/345 | 34.5 | 0.49 (0.36–0.66) | 0.42 (0.31–0.58) | ||
| 2002–2004 | 95/389 | 24.4 | 0.30 (0.22–0.41) | 0.27 (0.19–0.37) | ||
| 2005–2007 | 58/298 | 19.5 | 0.22 (0.16–0.32) | <0.001 | 0.20 (0.14–0.29) | <0.001 |
| TB type | ||||||
| Smear pos pulm | 338/1003 | 33.7 | 1 | 1 | ||
| Smear neg pulm | 93/343 | 27.1 | 0.72 (0.55–0.94) | 0.01 | 0.73 (0.55–0.96) | <0.001 |
| HIV status | ||||||
| HIV− | 91/318 | 28.6 | 1 | 1 | ||
| HIV+ no ART | 170/540 | 31.5 | 1.1 (0.83–1.5) | 1.1 (0.81–1.6) | ||
| HIV+ on ART | 11/48 | 22.9 | 0.70 (0.35–1.4) | 0.3 | 1.4 (0.62–3.1) | 0.6 |
| Previous TB | ||||||
| No | 391/1200 | 32.6 | 1 | 1 | ||
| Yes | 40/146 | 27.4 | 0.77 (0.53–1.1) | 0.2 | 0.85 (0.58–1.3) | 0.4 |
| INH resistance | ||||||
| No | 402/1237 | 32.5 | 1 | 1 | ||
| Yes | 29/100 | 29.0 | 0.86 (0.55–1.3) | 0.5 | 0.86 (0.54–1.4) | 0.5 |
| Recent residence | ||||||
| Karonga | 284/942 | 30.2 | 1 | 1 | ||
| Other Malawi | 80/234 | 34.2 | 1.2 (0.89–1.6) | 1.0 (0.74–1.4) | ||
| Other country | 20/74 | 27.0 | 0.88(0.52–1.5) | 0.4 | 0.57 (0.33–0.98) | 0.09 |
| Birth place | ||||||
| Karonga | 276/811 | 34.0 | 1 | 1 | ||
| Other Malawi | 80/272 | 29.4 | 0.83 (0.62–1.1) | 0.82 (0.60–1.1) | ||
| Other country | 64/234 | 27.4 | 0.77 (0.56–1.1) | 0.2 | 0.71 (0.51–0.99) | 0.08 |
-
The numbers of likely transmissions (‘forward links’) were compared by individual characteristics using ordered logistic regression. Extrapulmonary cases and cases occurring after 2007 were excluded.
Download links
A two-part list of links to download the article, or parts of the article, in various formats.
Downloads (link to download the article as PDF)
Open citations (links to open the citations from this article in various online reference manager services)
Cite this article (links to download the citations from this article in formats compatible with various reference manager tools)
Large-scale whole genome sequencing of M. tuberculosis provides insights into transmission in a high prevalence area
eLife 4:e05166.
https://doi.org/10.7554/eLife.05166


