Intercellular propagation of extracellular signal-regulated kinase activation revealed by in vivo imaging of mouse skin
- Kyoto University, Japan
Figures
Figure 1 with 2 supplements
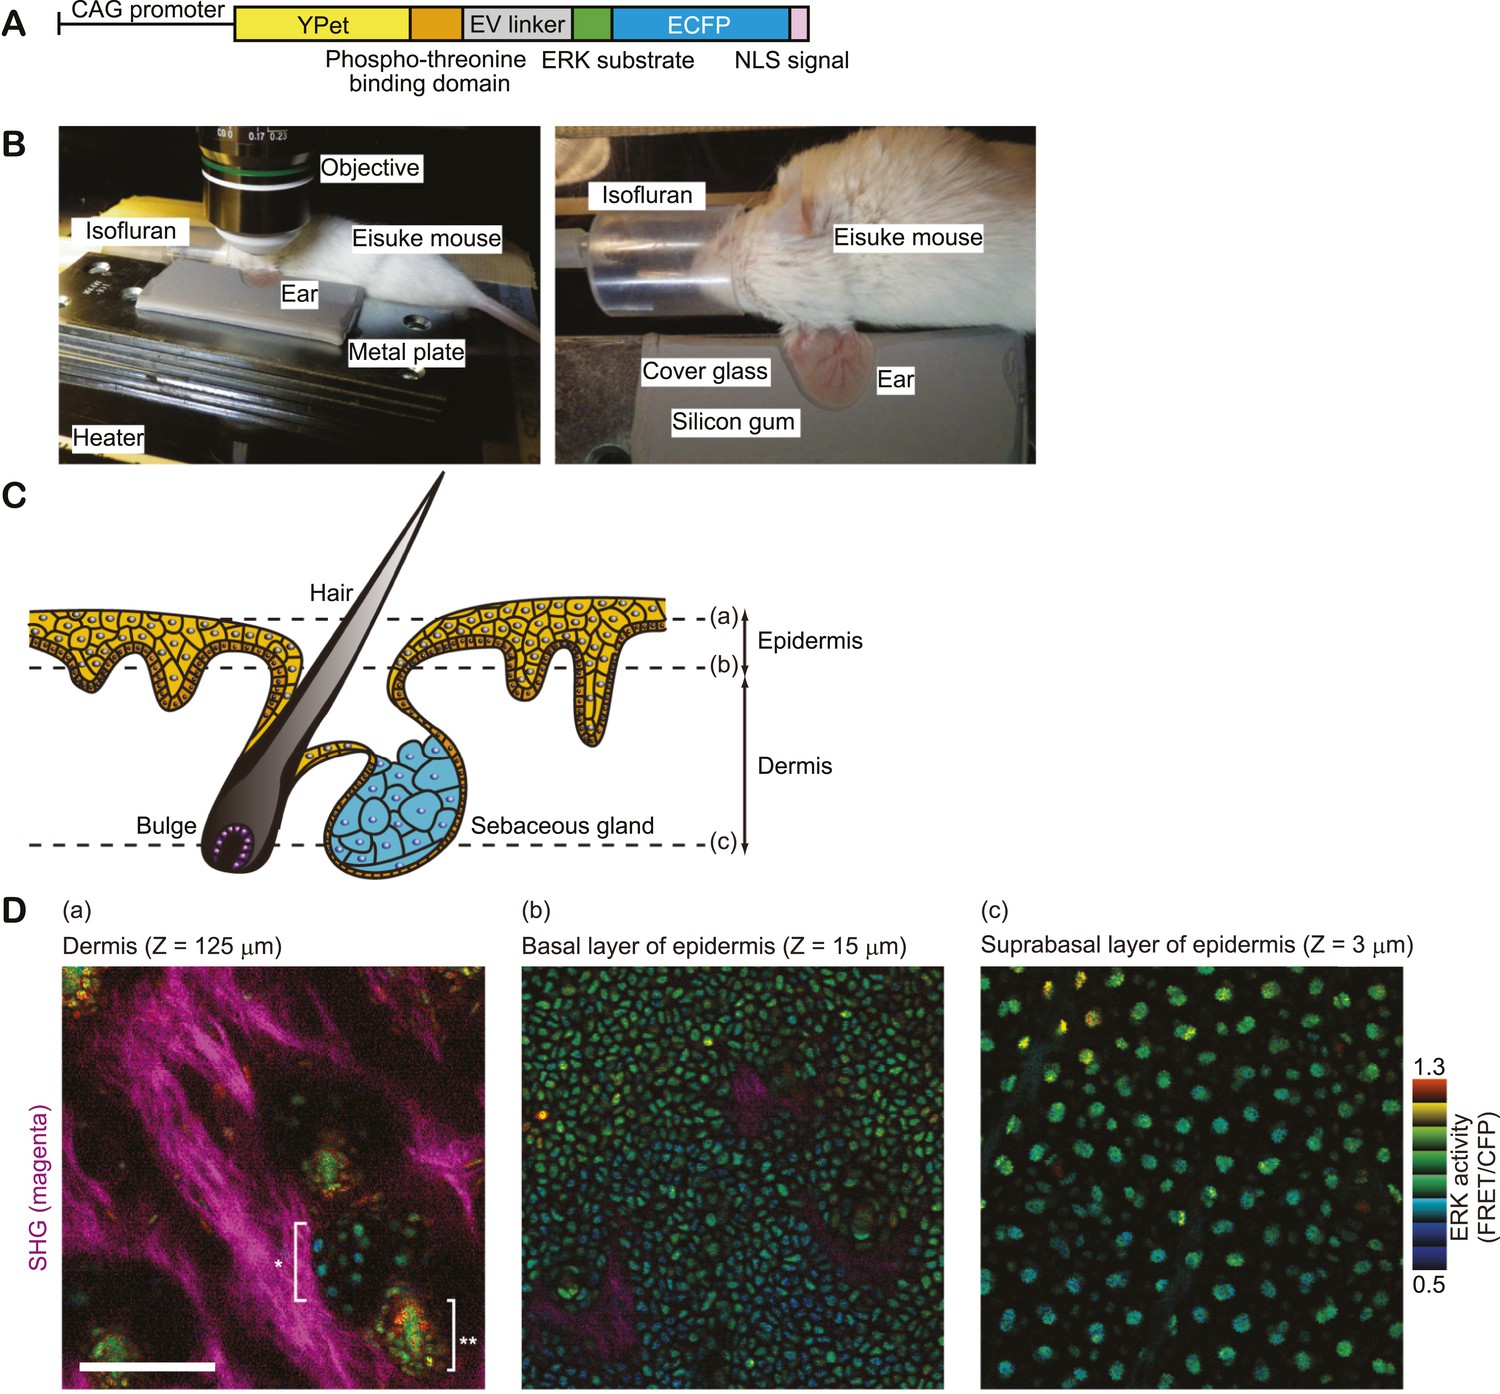
In vivo imaging of ERK activity in ear skin.
(A) Structure of ERK biosensor (EKAREV-NLS) expressed in Eisuke mice. (B) Experimental set-up of in vivo imaging of ear skin with a two-photon microscope. (C) Schematic of skin structure. (D) ERK activity maps in three different skin layers indicated in (C). ERK activity in the nuclei is represented by intensity modulated display (IMD) mode. The warm and cold colours indicate high and low ERK activities, respectively. Collagen fibres (magenta) were detected by second harmonic generation microscopy. *indicates sebaceous gland and **indicates hair bulge. Scale bar, 100 μm.
Figure 1—figure supplement 1
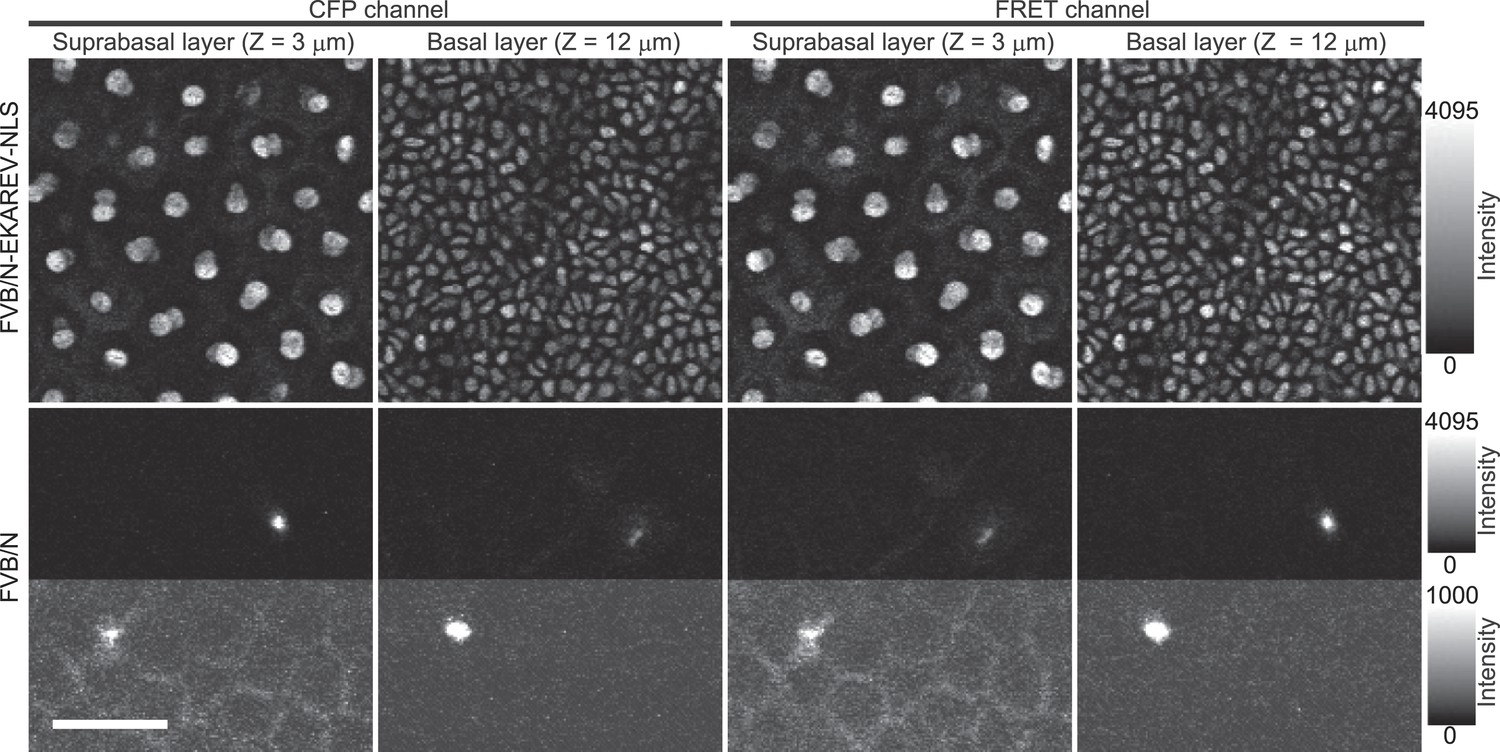
Autofluorescence in background FVB/N mouse.
Images of CFP channel (ex 840 nm/em 480 nm) and FRET channels (ex 840 nm/em 530 nm) of an Eisuke mouse (FVB/NEKAREV−NLS) and a control FVB/N mouse. Images were acquired under the same condition and were presented with the same upper- and lower-threshold ranges to show the background fluorescence in the control FVB mouse (upper halves). In the bottom halves of the panels for the FVB/N mouse, the upper-threshold intensity is lowered to show the autofluorescence.
Figure 1—figure supplement 2
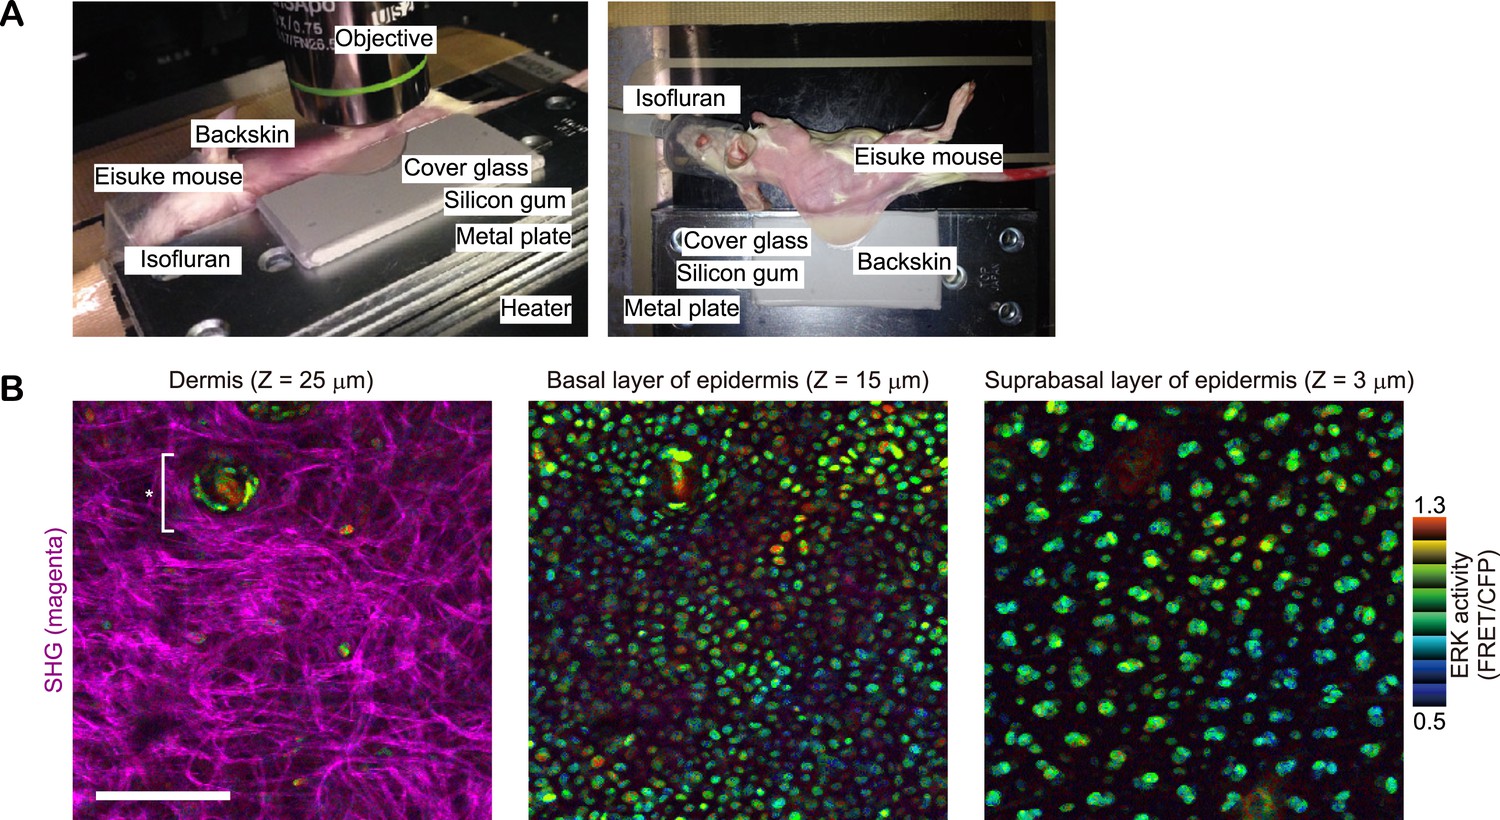
In vivo imaging of ERK activity in backskin.
(A) Experimental set-up of in vivo imaging of backskin with a two-photon microscope. (B) ERK activity maps in dermis (left), basal layer (middle), and suprabasal layer (right) of epidermis. ERK activity in the nuclei is represented by intensity modulated display (IMD) mode. The warm and cold colours indicate high and low ERK activities, respectively. Collagen fibres (magenta) were detected by second harmonic generation microscopy. *indicates hair follicle. Scale bar, 100 μm.
Figure 2 with 1 supplement
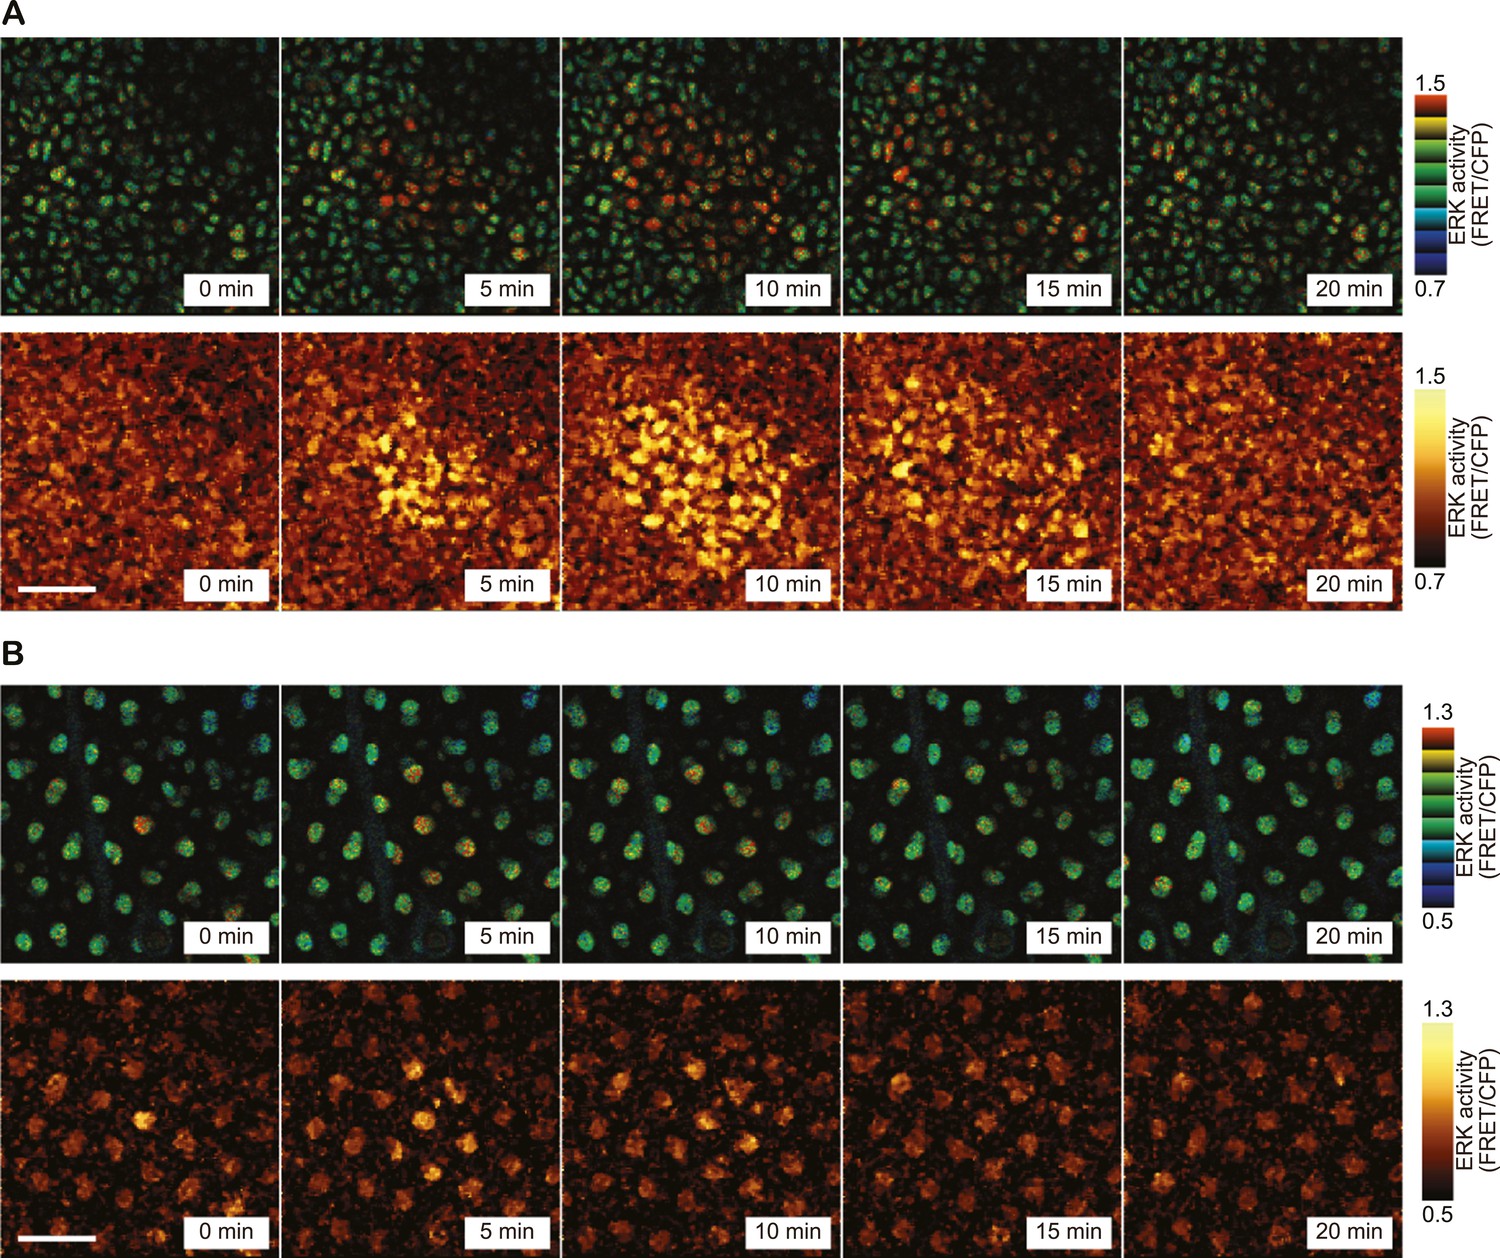
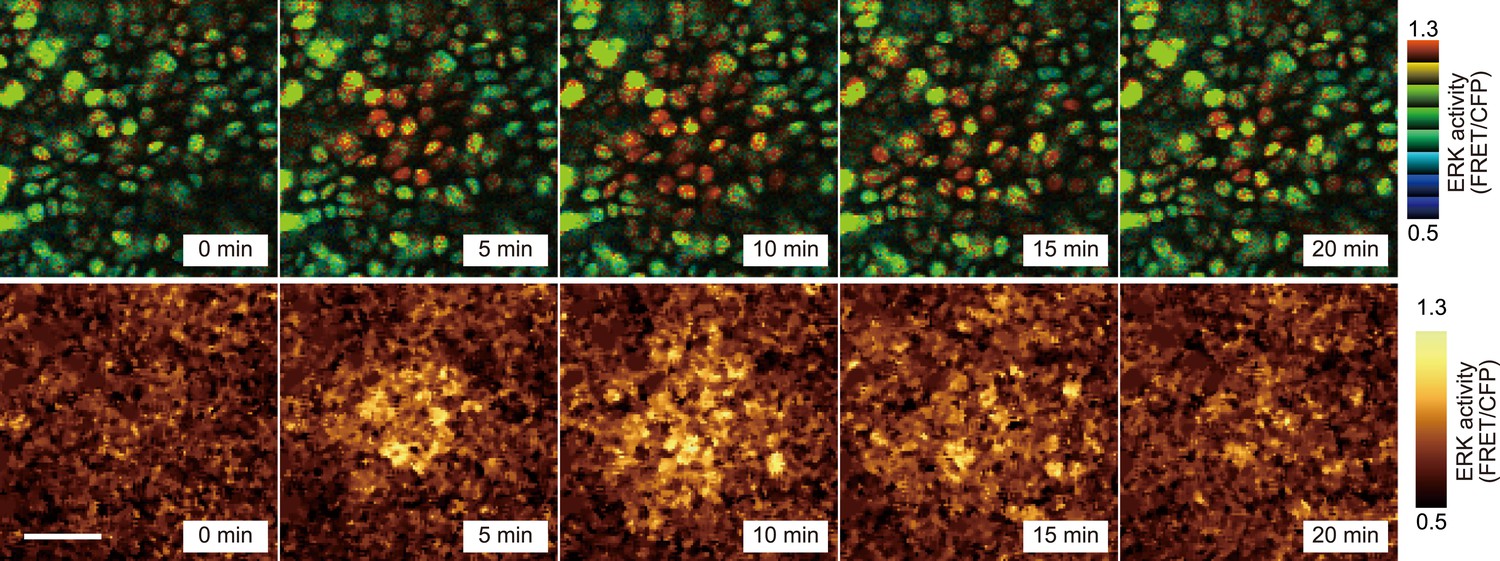
SPREAD in ear epidermis.
(A) Representative time-lapse images of SPREAD in the basal layer of ear epidermis. FRET/CFP ratio is represented in IMD mode (upper panels) and gold pseudo-colours (lower panels). The images are cropped from Video 1. Scale bar, 30 μm. (B) Suprabasal layer of ear epidermis in the same area shown in (A). FRET/CFP ratio is represented in IMD mode (upper panels) and gold pseudo-colours (lower panels). Scale bar, 30 μm.
Figure 2—figure supplement 1
SPREAD in backskin epidermis.
Representative time-lapse images of SPREAD in the basal layer of backskin. FRET/CFP ratio is represented in IMD mode (upper panels) and gold pseudo-colours (lower panels). Scale bar, 30 μm.
Figure 3 with 2 supplements

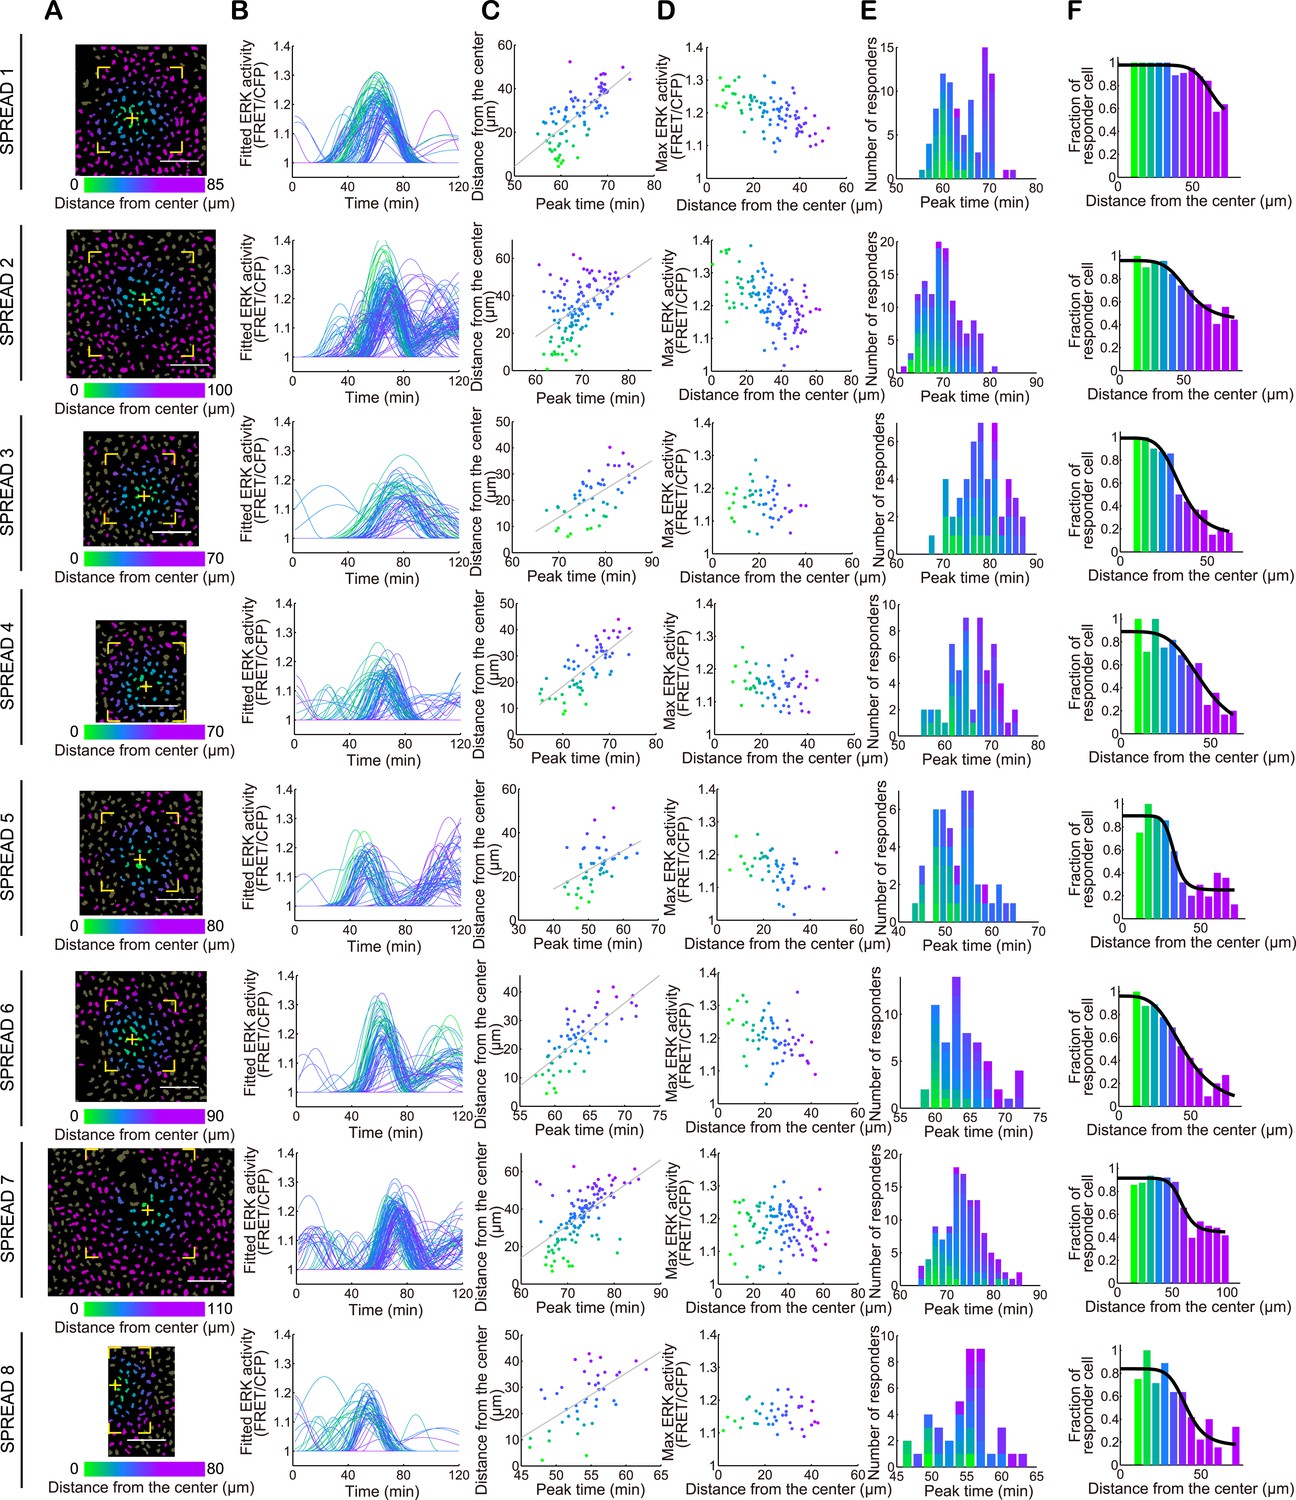
Single cell analysis of SPREAD.
Detailed analysis of SPREADs was performed with a time-lapse images acquired at 90-s-interval. (A) Binarized CFP image of the SPREAD area. The nucleus of each cell was identified and classified as a non-responder (grey) or a responder (coloured) as described in the ‘Materials and methods’ section. Cells within the region marked by yellow corners were analysed in (C–F). All cells in the viewfield were analysed in (G). The yellow cross indicates the origin of the SPREAD. (B) Time series of raw ERK activity (FRET/CFP) (black dotted lines) were approximated with a flat line (left) or sine curve(s) (right). (C) Raw (left) and fitted (right) time series of ERK activity (FRET/CFP) of responders. (D) The distance from the centre of SPREAD to each cell was plotted against the peak time to determine the velocity of ERK propagation. (E) The Max ERK activity of each cell plotted against the distance from the centre of the SPREAD. (F) Peak time histogram of responder cells. (G) The fraction of responder cells in each class of distance from the centre. Cells in the most central class were not analysed because there were only three cells. (H and I) Eight SPREADs were analysed to examine the correlation between the radius with the velocity of ERK activation propagation (H) and the Max amplitude of the ERK activity (I) of each SPREAD.
Figure 3—figure supplement 1
Single cell analysis of individual SPREADs.
(A) Binarized CFP image of the SPREAD area. The nucleus of each cell was identified and classified as a non-responder (grey) or a responder (coloured). Cells within the region marked by yellow corners were analysed in (B–E). All cells in the viewfield were analysed in (F). The yellow cross indicates the origin of the SPREAD. (B) Fitted time series of ERK activity (FRET/CFP) of responders. (C) The distance from the centre of SPREAD to each cell was plotted against the peak time to determine the velocity of ERK propagation. (D) The Max ERK activity of each cell plotted against the distance from the centre of the SPREAD. (E) Peak time histogram of responder cells. (F) The fraction of responder cells in each class of distance from the centre. Cells in the most central class were not analysed due to scarcity of cells.
Figure 3—figure supplement 2
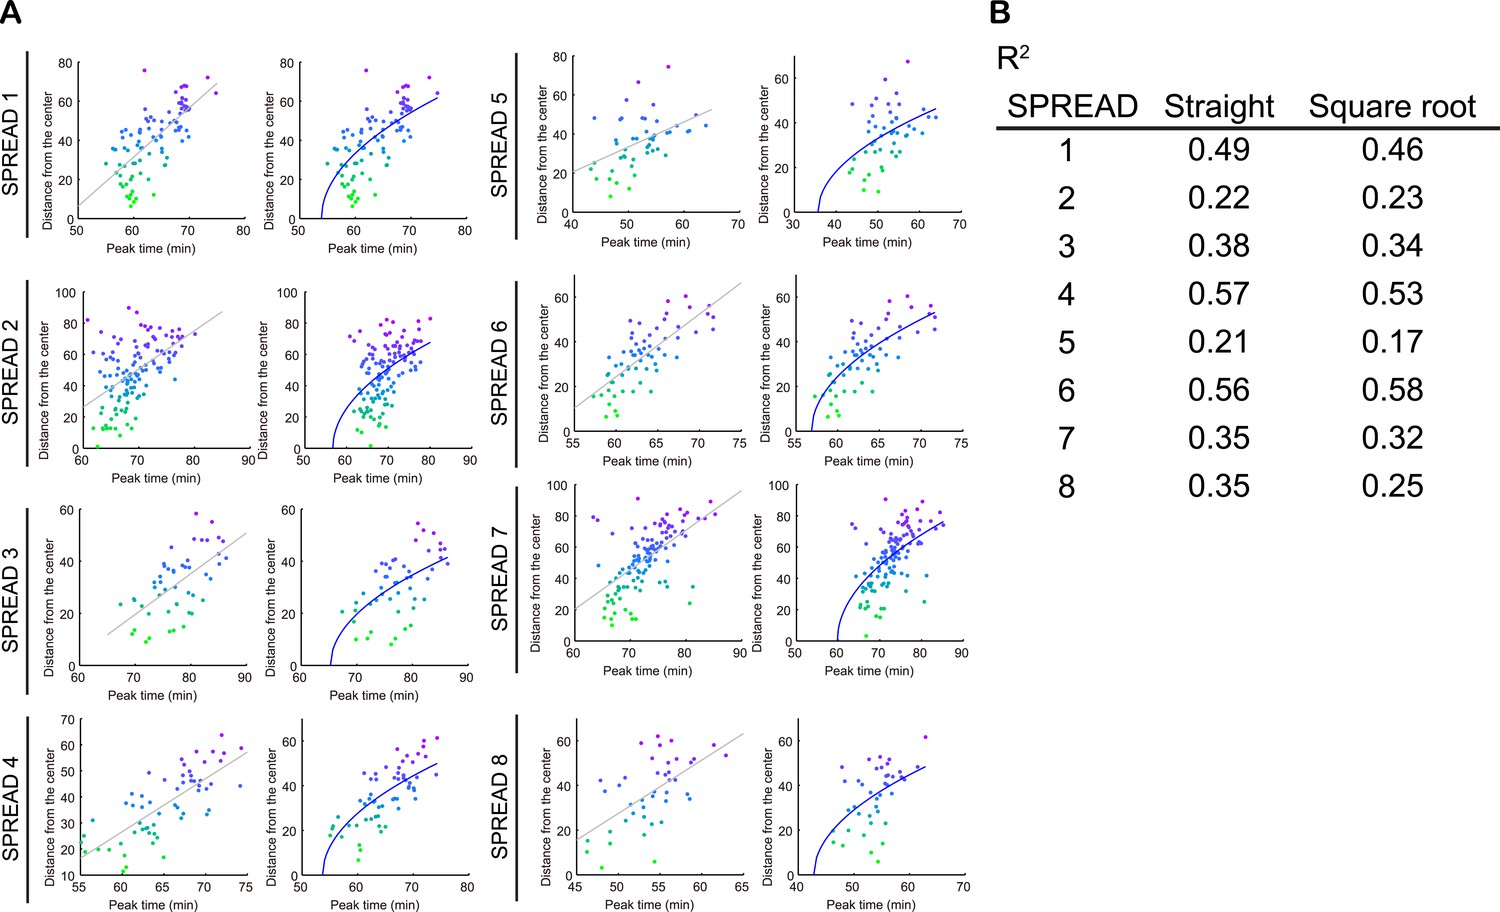
Straight and square root line fitting of distance-time plot of SPREAD.
(A) Comparison of straight line fittings (left) and square root (right) fittings of 8 SPREADs analysed in Figure 3—figure supplement 1. (B) Coefficient of determination of fittings in (A).
Figure 4 with 3 supplements
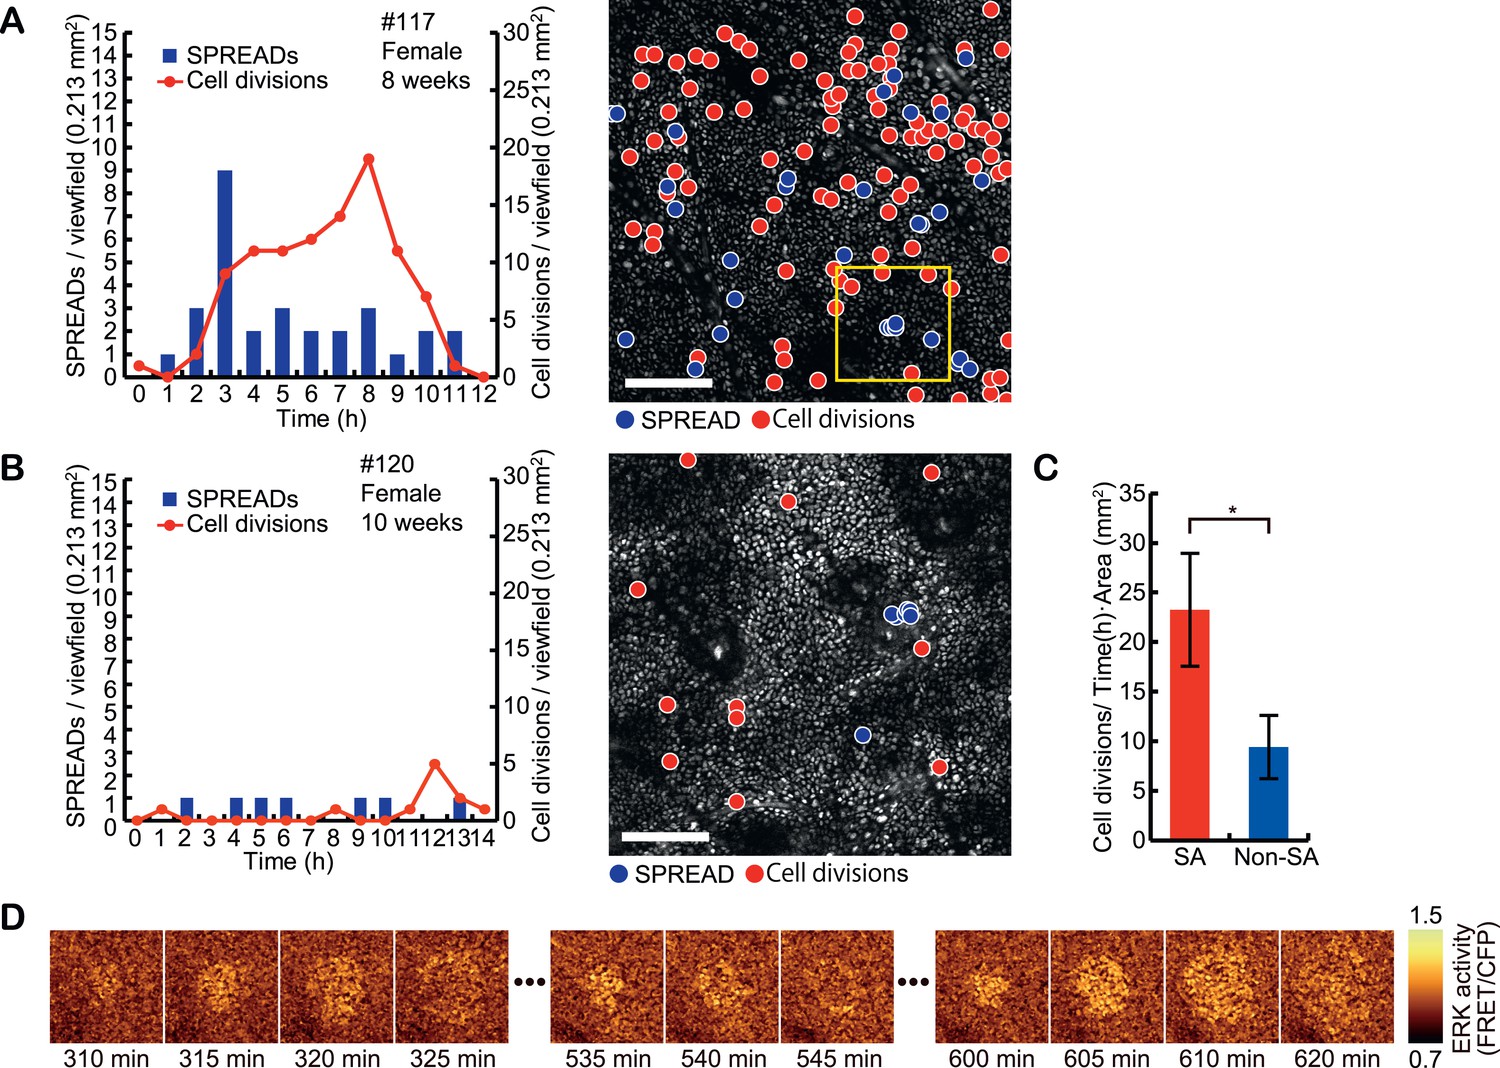
Spatio-temporal association of SPREADs with cell divisions.
(A and B) Left panels show frequencies of SPREADs (blue) and cell divisions (red) during periods with frequent SPREADs (A) and less frequent SPREADs (B). Right panels show mapping of the centres of SPREADs (blue circle) and cell divisions (red circle) observed during each imaging period. Shown are single frames of CFP images of a 0.213 mm2 viewfield. Individual mouse identification numbers, sex and age are shown on the top of the left panels. Scale bar, 100 μm. (C) The frequency of cell division in and out of the SPREAD area. SPREAD area was defined as the area within 100 μm from the origin and within 1 hr of the onset of the SPREAD. *p < 0.05 (paired Student's t test). (D) Time-lapse images of the yellow square region in (A), showing three SPREADs emerging from the same spot.
Figure 4—figure supplement 1
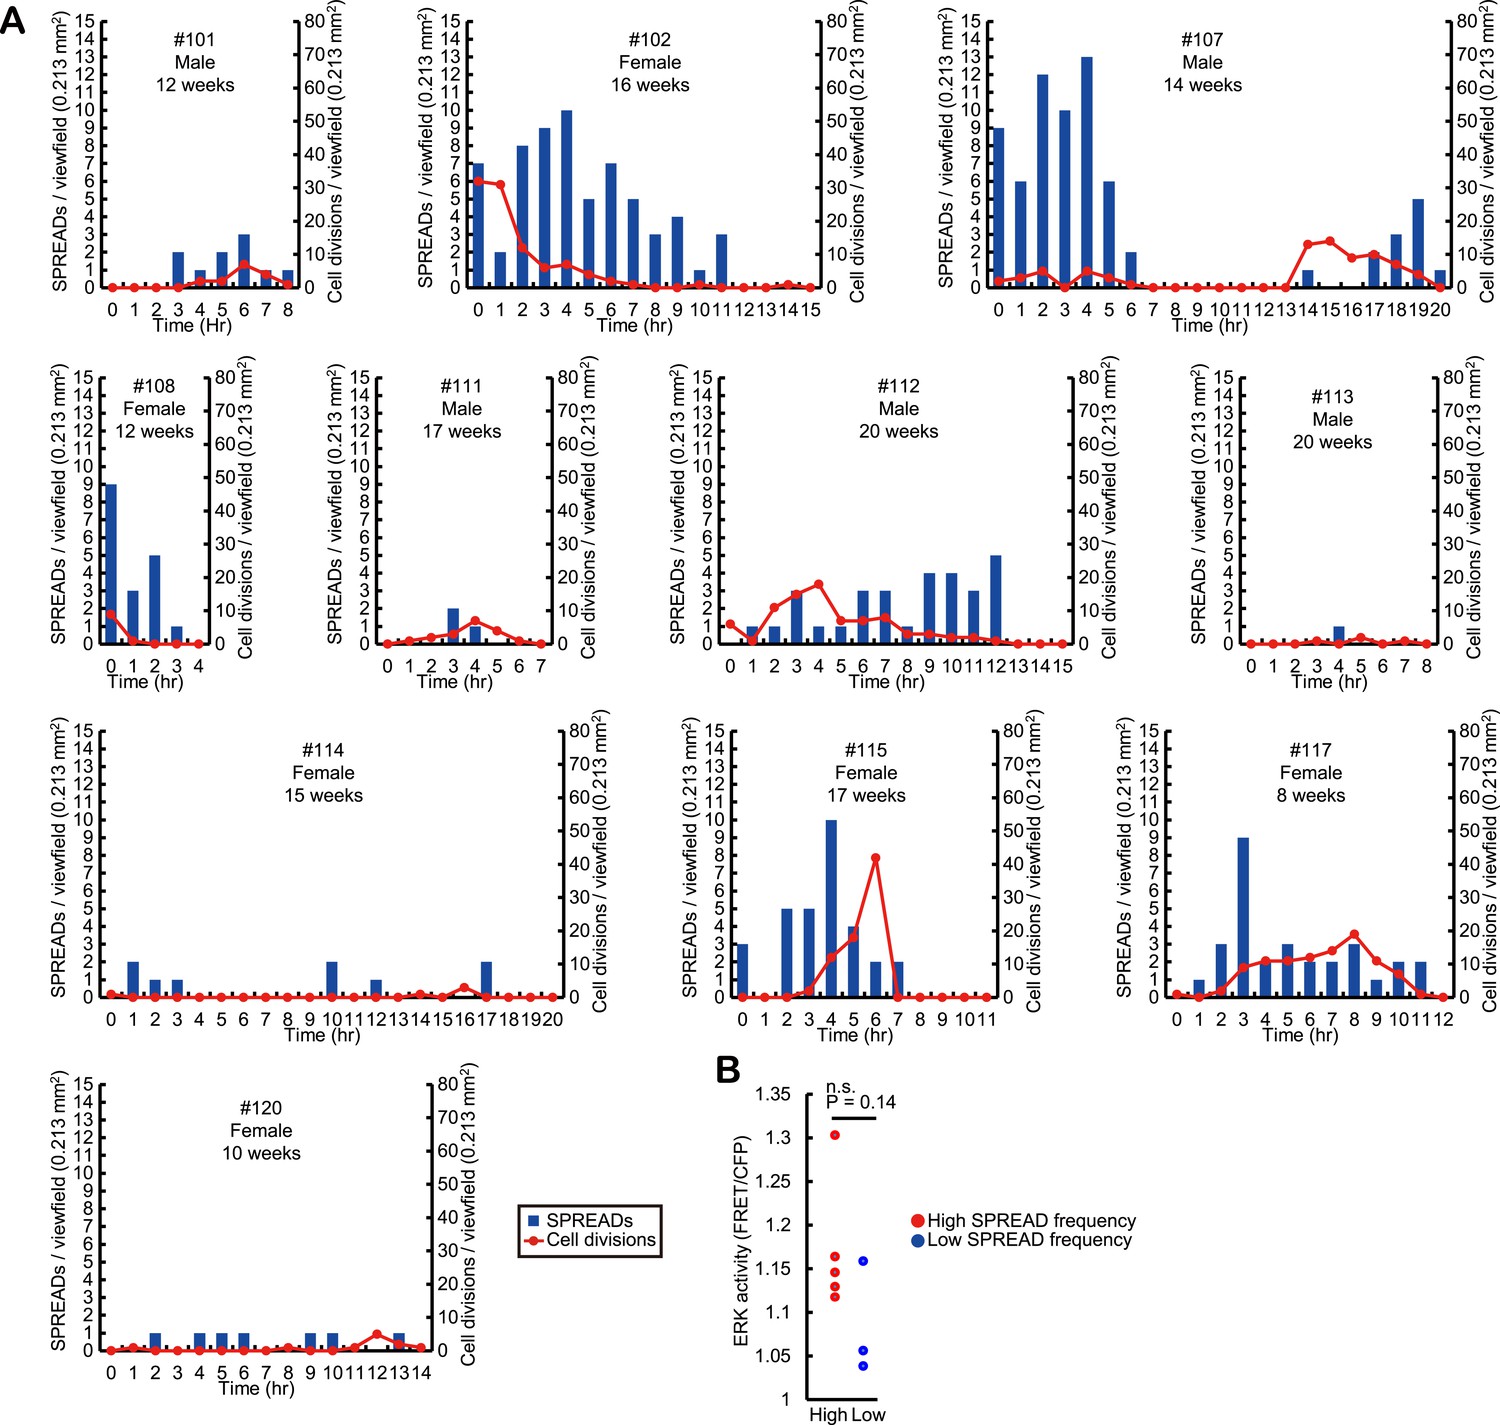
Frequencies of SPREAD and cell division in the steady-state ear skin of eleven mice.
(A) Ear skin of eleven Eisuke mice were subjected to imaging as described in Figure 1. Time-lapse imaging was aborted when the body temperature and breathing conditions of mice deteriorated. Frequencies of SPREADs (bars) and cell divisions (lines) during imaging are shown with the individual mouse identification numbers, sex and age on the top. (B) Basal ERK activity in mice with frequent SPREAD (mice #102, 107, 112, 115, and 117) and infrequent SPREAD (mice #113, 114, and 120).
Figure 4—figure supplement 2
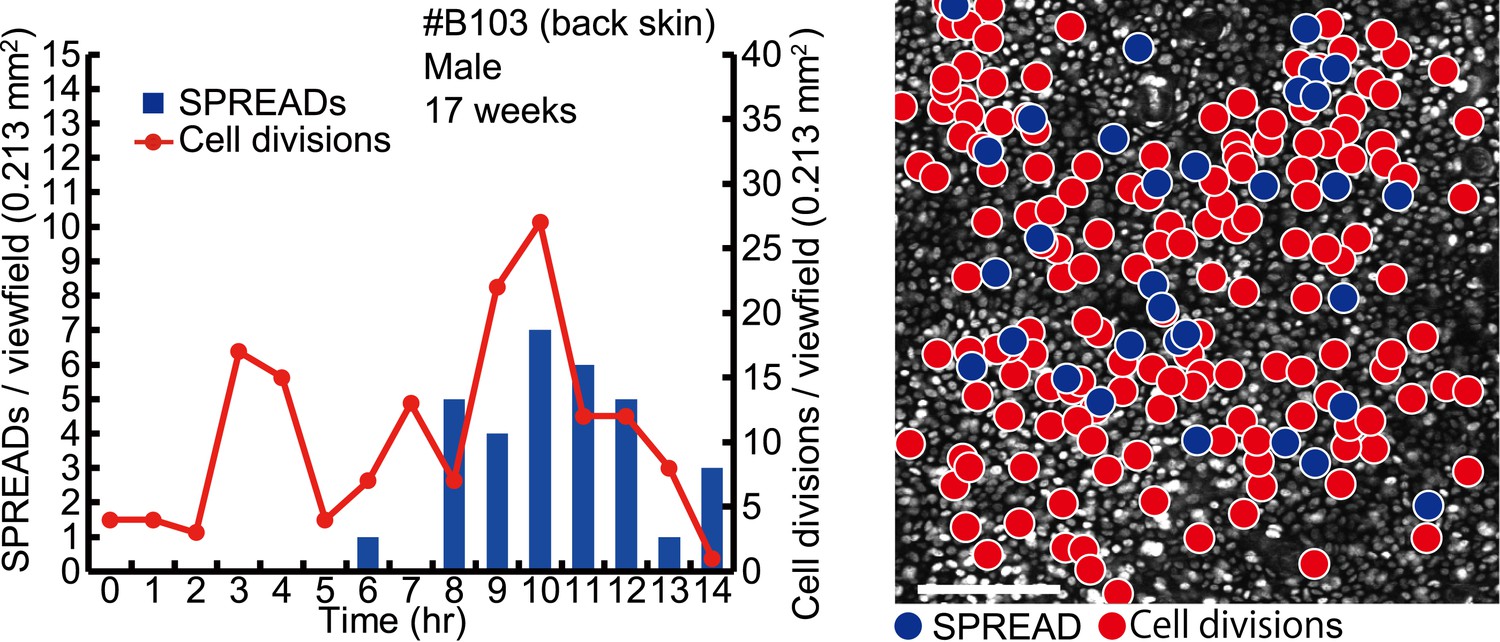
Steady-state backskin with frequent SPREADs and cell divisions.
Left panel shows the frequencies of SPREADs (bars) and cell divisions (lines) during imaging. Mouse identification number, sex and age are shown on the top. Right panel shows mapping of SPREADs (blue circles) and cell divisions (red circles) observed during 14-hr imaging period in the viewfield of 0.213 mm2. Scale bar, 100 μm.
Figure 4—figure supplement 3
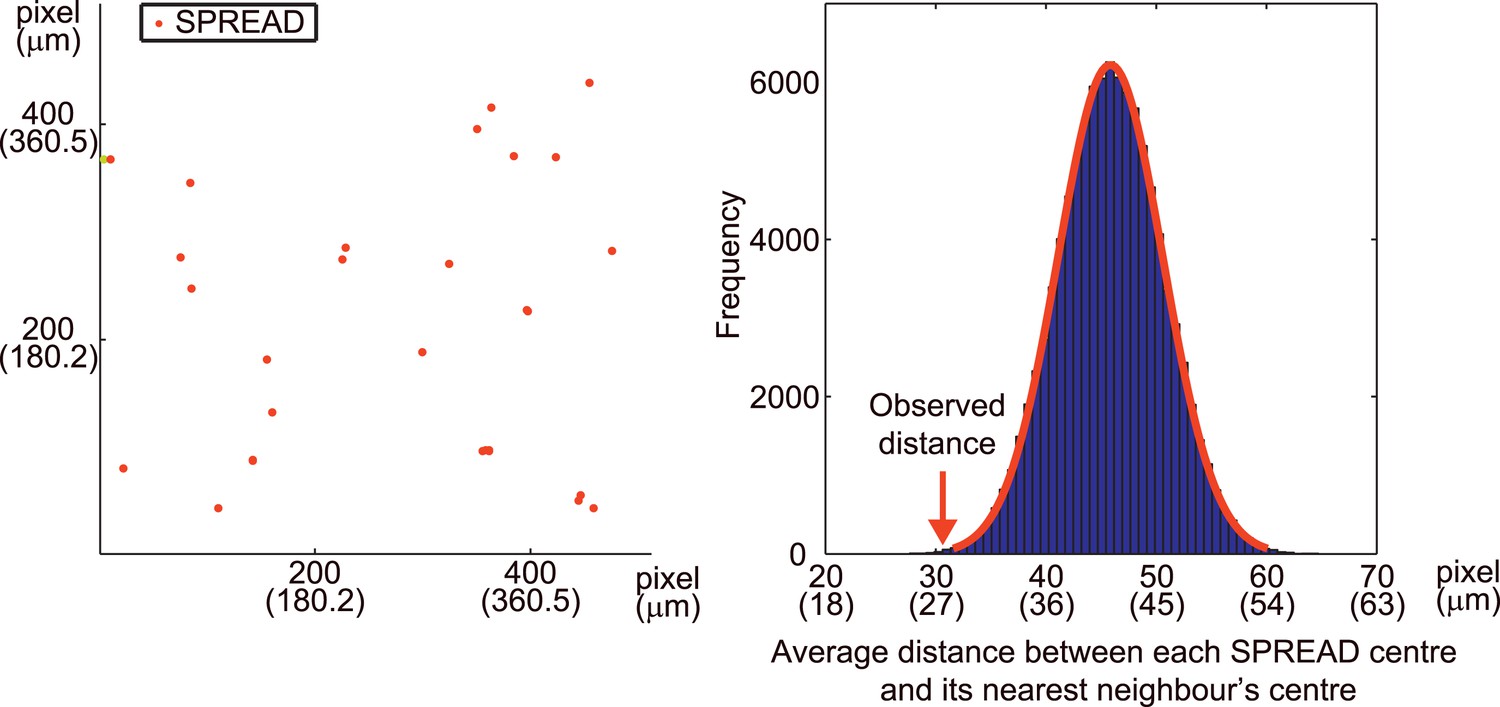
Monte Carlo simulation of SPREAD distribution.
Left panel, the distribution of SPREADs in the viewfield of mouse #102. Right panel, the histogram of average nearest neighbor distance between each SPREAD centre and its nearest neighbor's centre obtained by 100,000 trials of Monte Carlo simulations of SPREAD distributions.
Figure 5
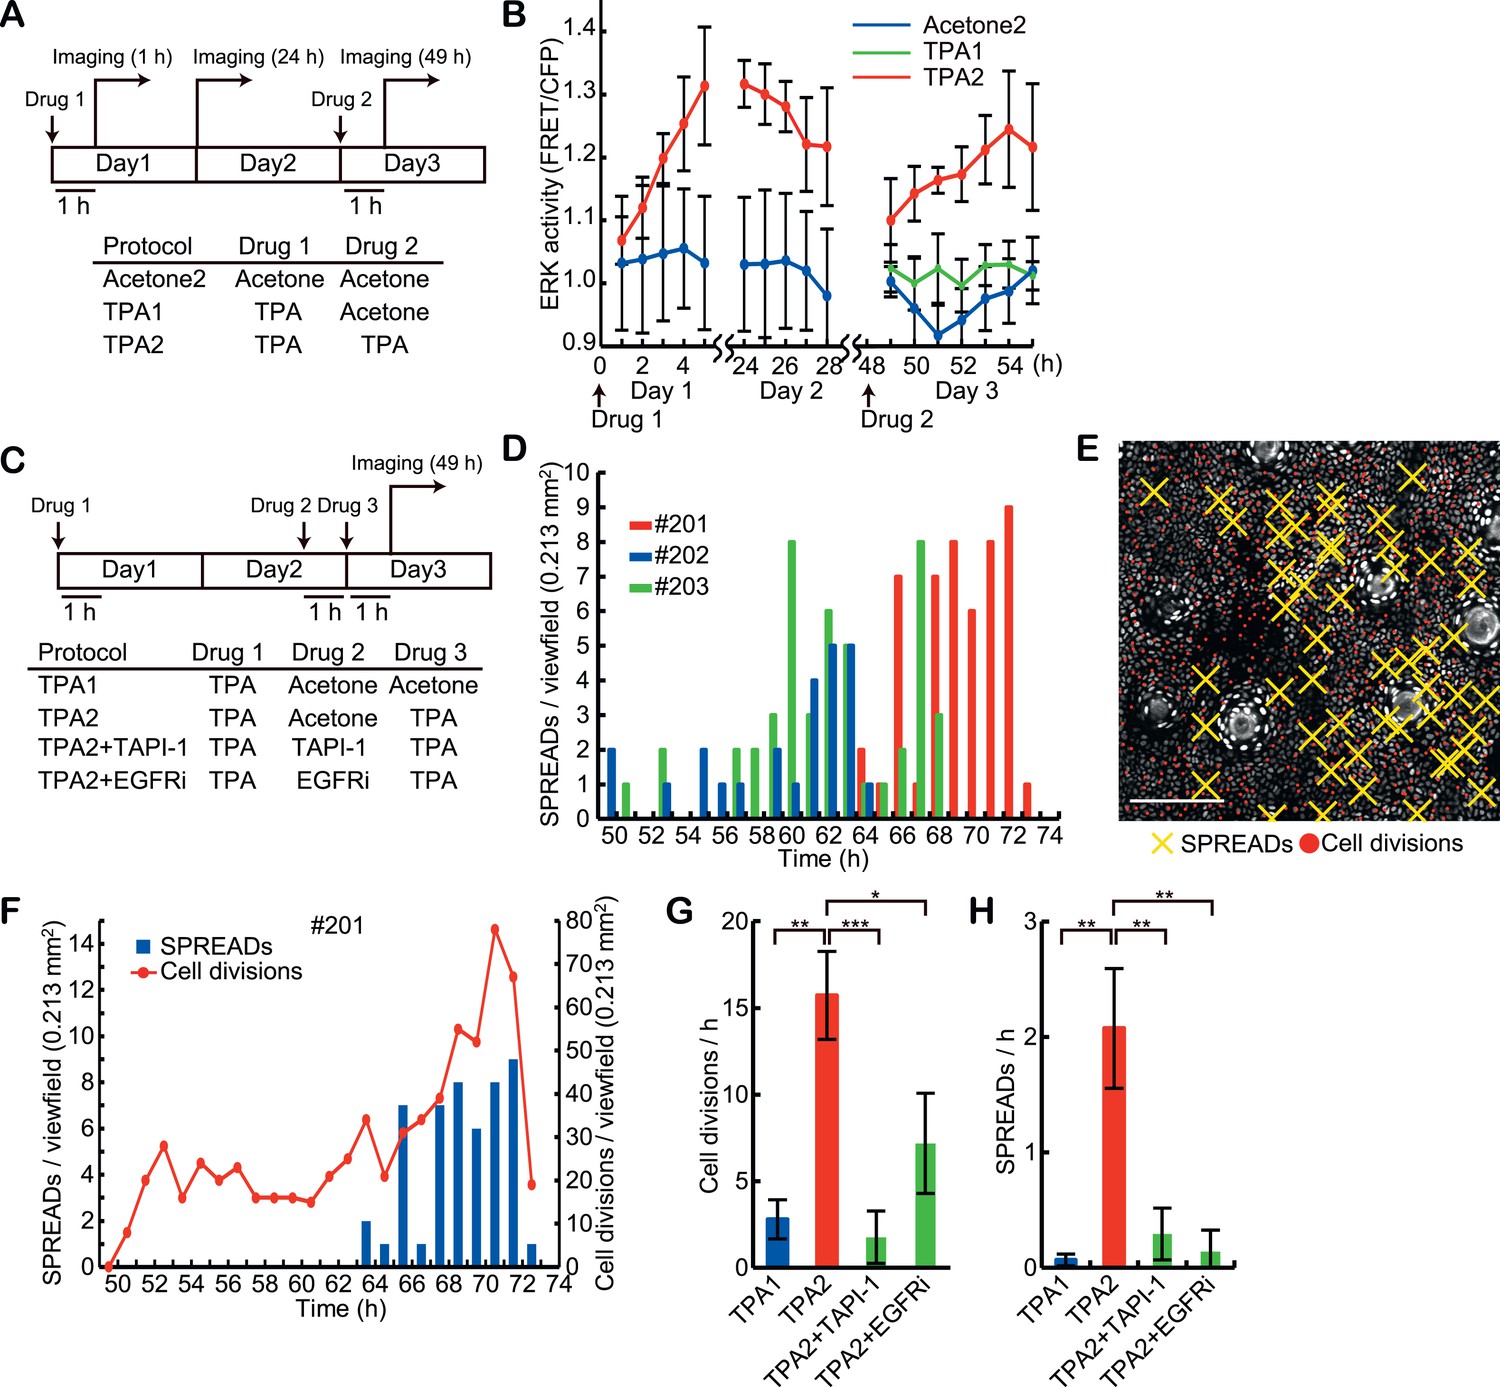
Induction of SPREADs by the double TPA treatments.
(A) Eisuke mice were subjected to topical application of 20 μl acetone with or without 0.5 nanomole TPA and imaged according to the protocols. Images were acquired every 1 hr during 5- to –7-hr imaging periods. Mice were returned to the cage after the imaging and the same area of the skin was revisited on the next day. (B) ERK activity in the basal epidermal cells was monitored in FVBEKAREV−NES mice. Average FRET/CFP ratio and S.E.M. of three mice are shown for each. Error bars indicate S.E.M. of the three mice. (C) Protocols for the double TPA application in the presence of inhibitors. Drugs were used as follows: 0.5 nanomole TPA, 207 nanomole PD0329105, 2.0 nanomole TAPI-1, and 0.2 nanomole PD153035 in 20 μl acetone, or vehicle alone. (D) A histogram of SPREADs of the three mice, #201, #202, and #203, which were treated twice with TPA2 in (C). (E) A map of SPREADs (yellow cross) and cell divisions (red dot) observed during 48–72 hr in the mouse #201. (F) The numbers of SPREADs and cell divisions observed in each period. Data are from mouse #201. (G and H) Numbers of cell divisions (G) and SPREADs (H) observed in a 0.213 mm2 viewfield per hour during the observation. Average and S.E.M. are shown. At least three mice were analysed for each protocol. *p < 0.05; **p < 0.01; ***p < 0.001 (paired Student's t test).
Figure 6
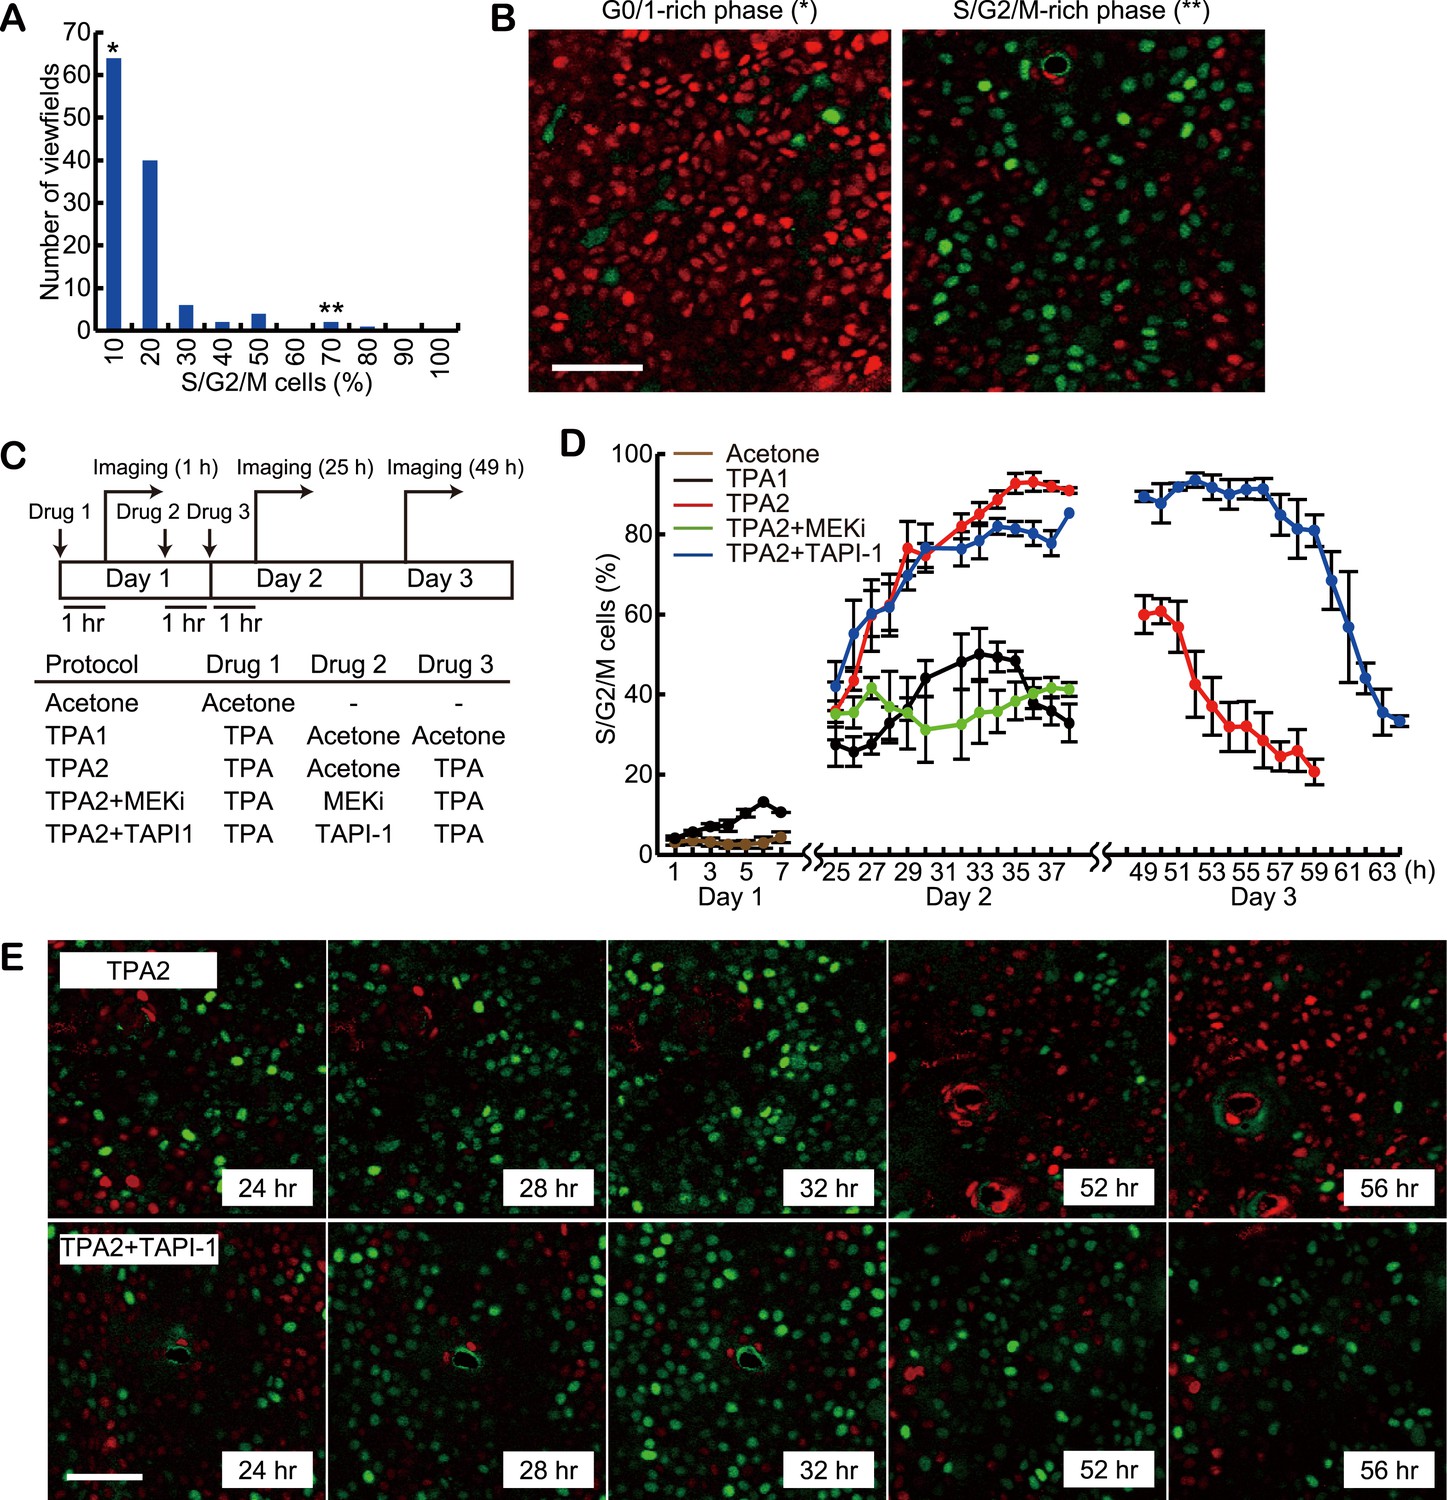
Delayed exit from S/G2/M phase by MMP inhibitor treatment.
(A) Histogram of the percentage of S/G2/M cells in 120 viewfields (0.213 mm2 each) of steady-state Fucci mice. About 700 cells were analysed for each viewfield. (B) Representative images of viewfields, where S/G2/M cells (green) were less than 10% (left, indicated by * in [A]) or more than 50% (right, indicated by ** in [A]). Red and green cells indicate G0/G1 and S/G2/M cells, respectively. Scale bar, 50 μm. (C) Protocols of double TPA treatments with or without inhibitors. Drugs were applied in the following concentrations: 0.5 nanomole TPA, 207 nanomole PD0329105, 2.0 nanomole TAPI-1, and 0.2 nanomole PD153035 in 20 μl acetone, or vehicle alone. For each protocol, at least three mice were observed. Images were acquired every 1 hr during 7- to 16-hr-imaging periods. Mice were returned to the cage after the imaging and the same area of the skin was revisited on the next day. (D) The proportion of S/G2/M cells. Average and S.E.M. are shown. At least three mice were used for each drug protocol. (E) Representative time lapse images of protocol TPA2 and TPA2 + TAPI-1. Note that the fraction of S/G2/M cells (green) was maintained at high level by TAPI-1 treatment (52 hr, 56 hr). Scale bar, 50 μm.
Figure 7
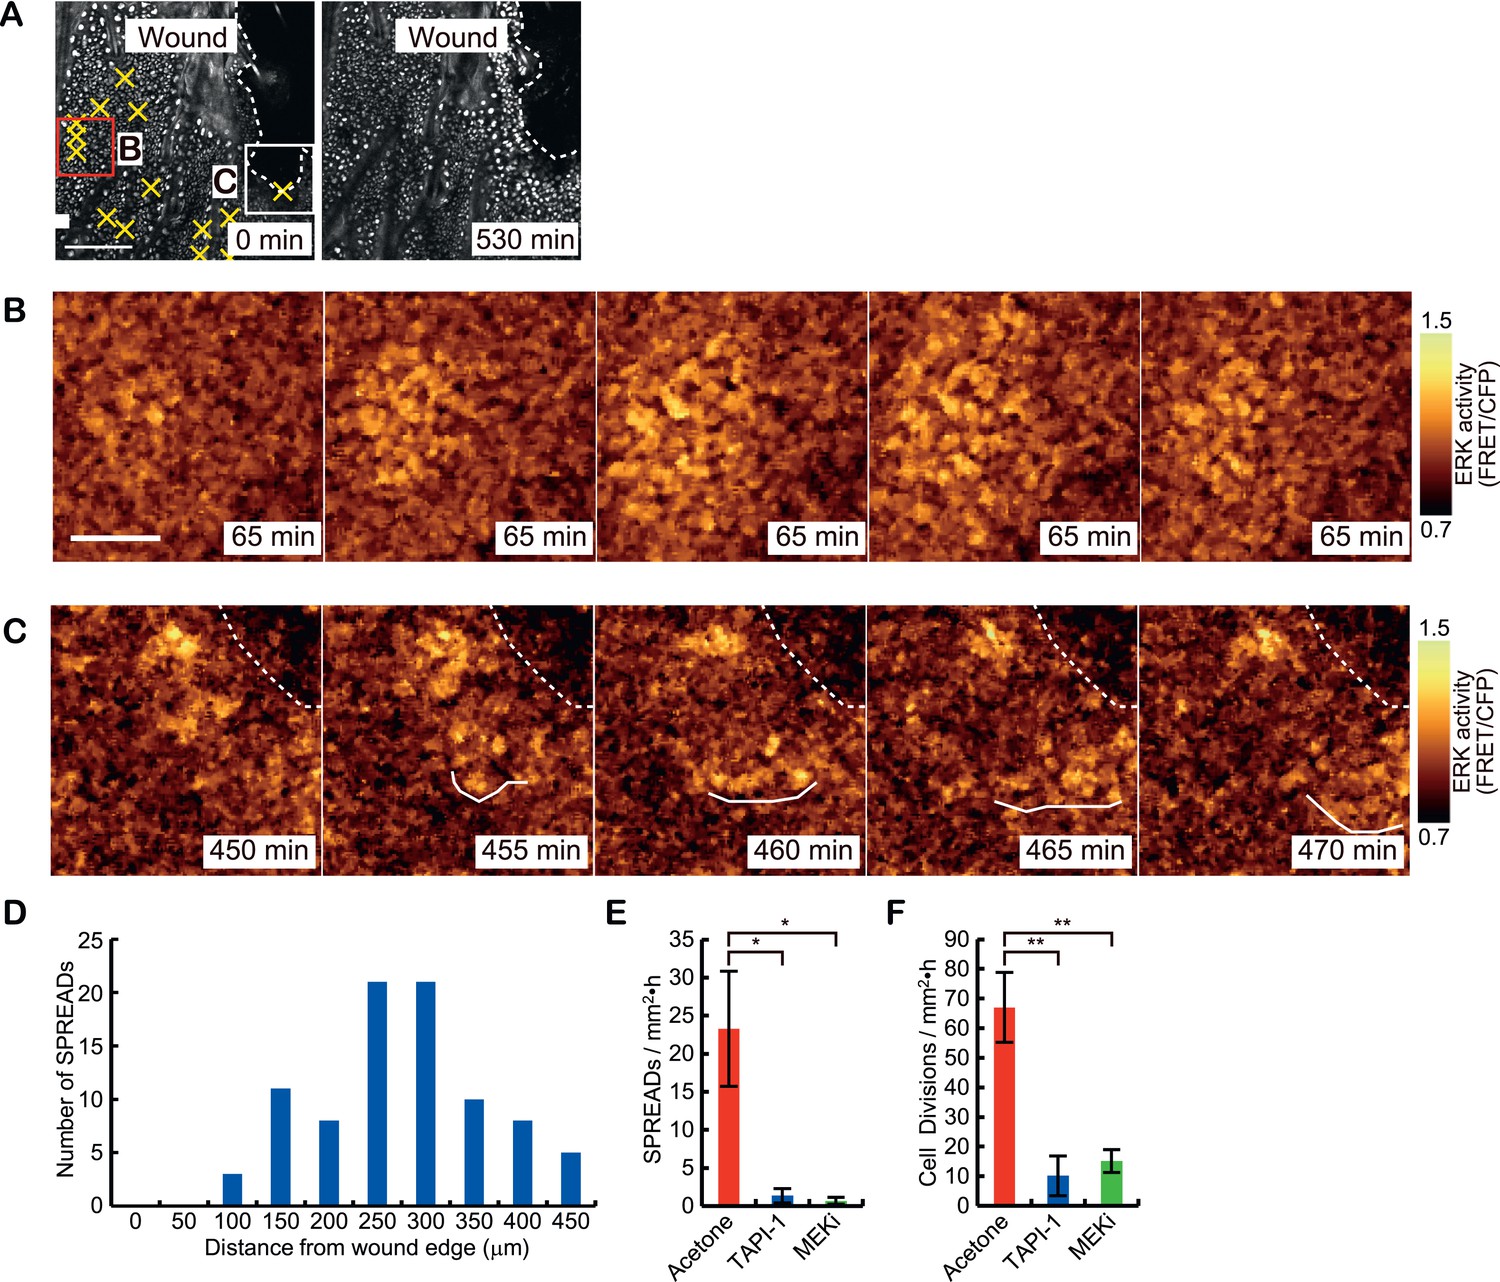
Two types of ERK activity propagation patterns during epithelial wound healing.
(A) CFP images of the wounded ear skin of an Eisuke mouse. An epithelial wound was created on the ear skin of an Eisuke mouse 12 hr before observation. The wound edge and location of SPREADs observed during 9 hr of observation are shown by white dashed line and yellow crosses, respectively. (B) Time-lapse images of a representative SPREAD observed in the red-square region in (A). (C) Time-lapse images of a representative ERK propagation wave from the wound edge observed in the white-square region in (A). The images are cropped from Video 3. Scale bars are100 μm (A) and 30 μm (B and C). (D) Histogram of the number of SPREADs classified by the distance from the wound edge. In total, 123 SPREADs were analysed from four independent experiments. (E and F) The frequencies of SPREAD (E) and cell division (F) per 1 hr in 1 mm2. Eisuke mice were topically applied with the indicated drug at the time of wounding. Average and S.E.M. are shown. At least three mice were observed for each drug treatment. *p < 0.05; **p < 0.01 (paired Student's t test).
Figure 8
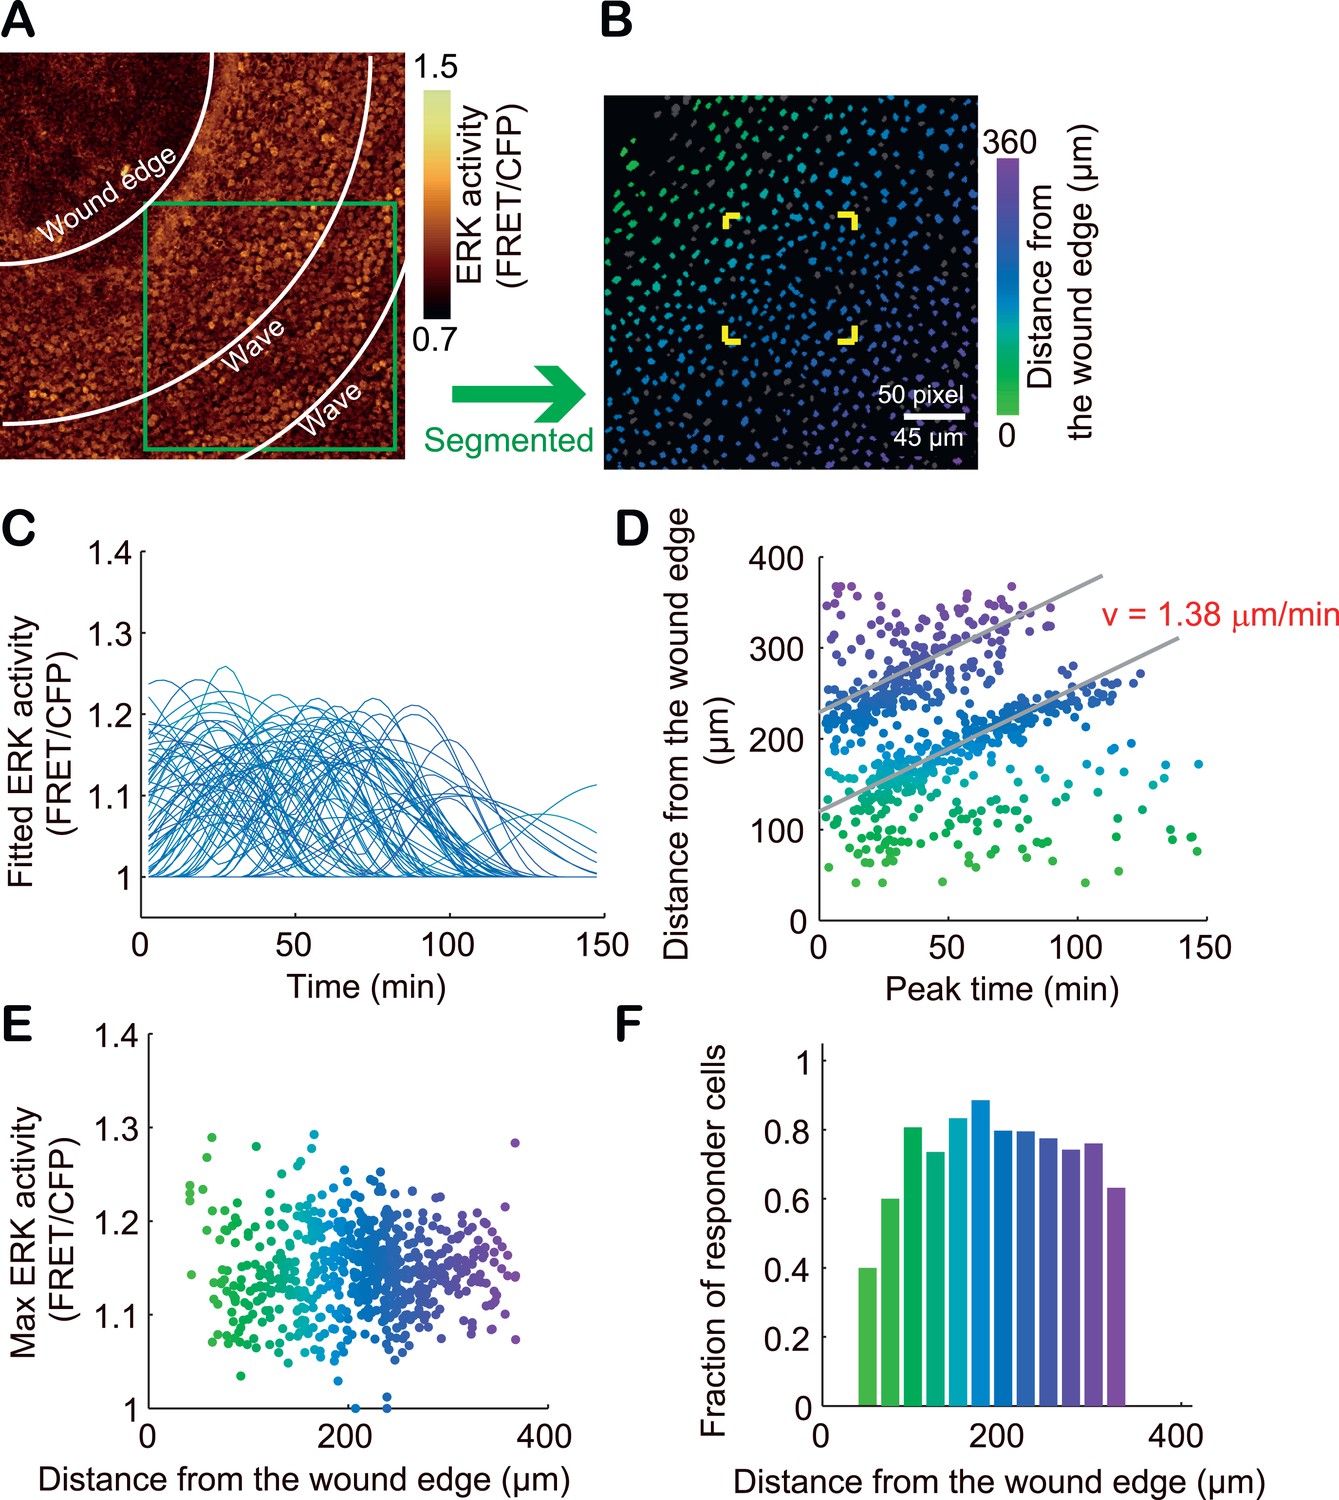
Single cell analysis of ERK propagation waves from the wound edge.
(A) A gold pseudo-colour image of FRET/CFP ratio in an Eisuke mouse wounded 12 hr before observation. The image is cropped from Video 5. (B) The green-square region in (A) is magnified. The colours of segmented nuclei indicate the distance from the wound edge. Grey nuclei indicate non-responder cells. (C) With each nucleus, the time course of FRET/CFP values was approximated with a flat line or one to three sine curves as performed in Figure 3. (D) The distance from the wound edge to each cell was plotted against the peak ERK activation time to determine the velocity of ERK activation propagation. (E) The Max ERK activity of each cell was plotted against the distance from the wound edge. (F) The fraction of responder cells in each distance.
Videos
Video 1
SPREADs detected by in vivo imaging of an Eisuke mouse.
A time-lapse video of steady-state basal epidermis of an Eisuke mouse for 12 hr. The skin shows localized ERK activations that concentrically propagate. The FRET/CFP ratio is shown by gold pseudo-colours (right). Images were acquired every 5 min. The area of the viewfield is 0.213 mm2. HF: hair follicle.
Video 2
SPREAD induction by topical applications of TPA.
A Time-lapse video of an Eisuke mouse topically treated with TPA twice as described in Figure 5C (TPA2). The video starts from 12 hr after the second TPA treatment (60 hr after the first TPA treatment). The video length is about 12 hr (735 min). SPREADs appeared from about 300 min indicated in the video. The FRET/CFP ratio is shown by gold pseudo-colours (right). Images were acquired every 5 min. The area of the viewfield is 0.213 mm2. HF: hair follicle.
Video 3
SPREADs and ERK propagation waves in a wounded skin.
A Time-lapse video of epidermis of an Eisuke mouse subjected to epithelial wounding 12 hr before imaging. The video length is about 9 hr (545 min). The video is shown by projection of five serial Z-stack images. SPREADs were observed at relatively distant areas from the wound edge while ERK activation waves are observed at the proximity of the wound edge. The FRET/CFP ratio is shown by gold pseudo-colours (right). Images were acquired every 5 min. The area of the viewfield is 0.213 mm2. HF: hair follicle.
Video 4
ERK activation waves under MMP inhibitor treatment.
A Time-lapse video of an Eisuke mouse subjected to epithelial wounding and 2.0 nanomole TAPI-1 treatment 12 hr before imaging. The FRET/CFP ratio is shown by gold pseudo-colours (right). Images were acquired every 5 min. The area of the viewfield is 0.213 mm2.
Video 5
ERK activation waves from the wound edge.
A Time-lapse video of an Eisuke mouse subjected to epithelial wounding 12 hr before imaging. The video length is 87.5 min. This video was used for the analysis of ERK activation waves from the wound edge in Figure 7. The FRET/CFP ratio is shown by gold pseudo-colours (right). Images were acquired every 2.5 min. The area of the viewfield is 0.213 mm2.
Download links
A two-part list of links to download the article, or parts of the article, in various formats.
Downloads (link to download the article as PDF)
Open citations (links to open the citations from this article in various online reference manager services)
Cite this article (links to download the citations from this article in formats compatible with various reference manager tools)
Intercellular propagation of extracellular signal-regulated kinase activation revealed by in vivo imaging of mouse skin
eLife 4:e05178.
https://doi.org/10.7554/eLife.05178


