VTA neurons coordinate with the hippocampal reactivation of spatial experience
- MassGeneral Institute for Neurodegenerative Disease, Massachusetts General Hospital, United States
- Massachusetts Institute of Technology, United States
- Neuro-Electronics Research Flanders (NERF), Belgium
- IMEC, Belgium
- Laboratory of Biological Psychology, Belgium
Figures
Figure 1
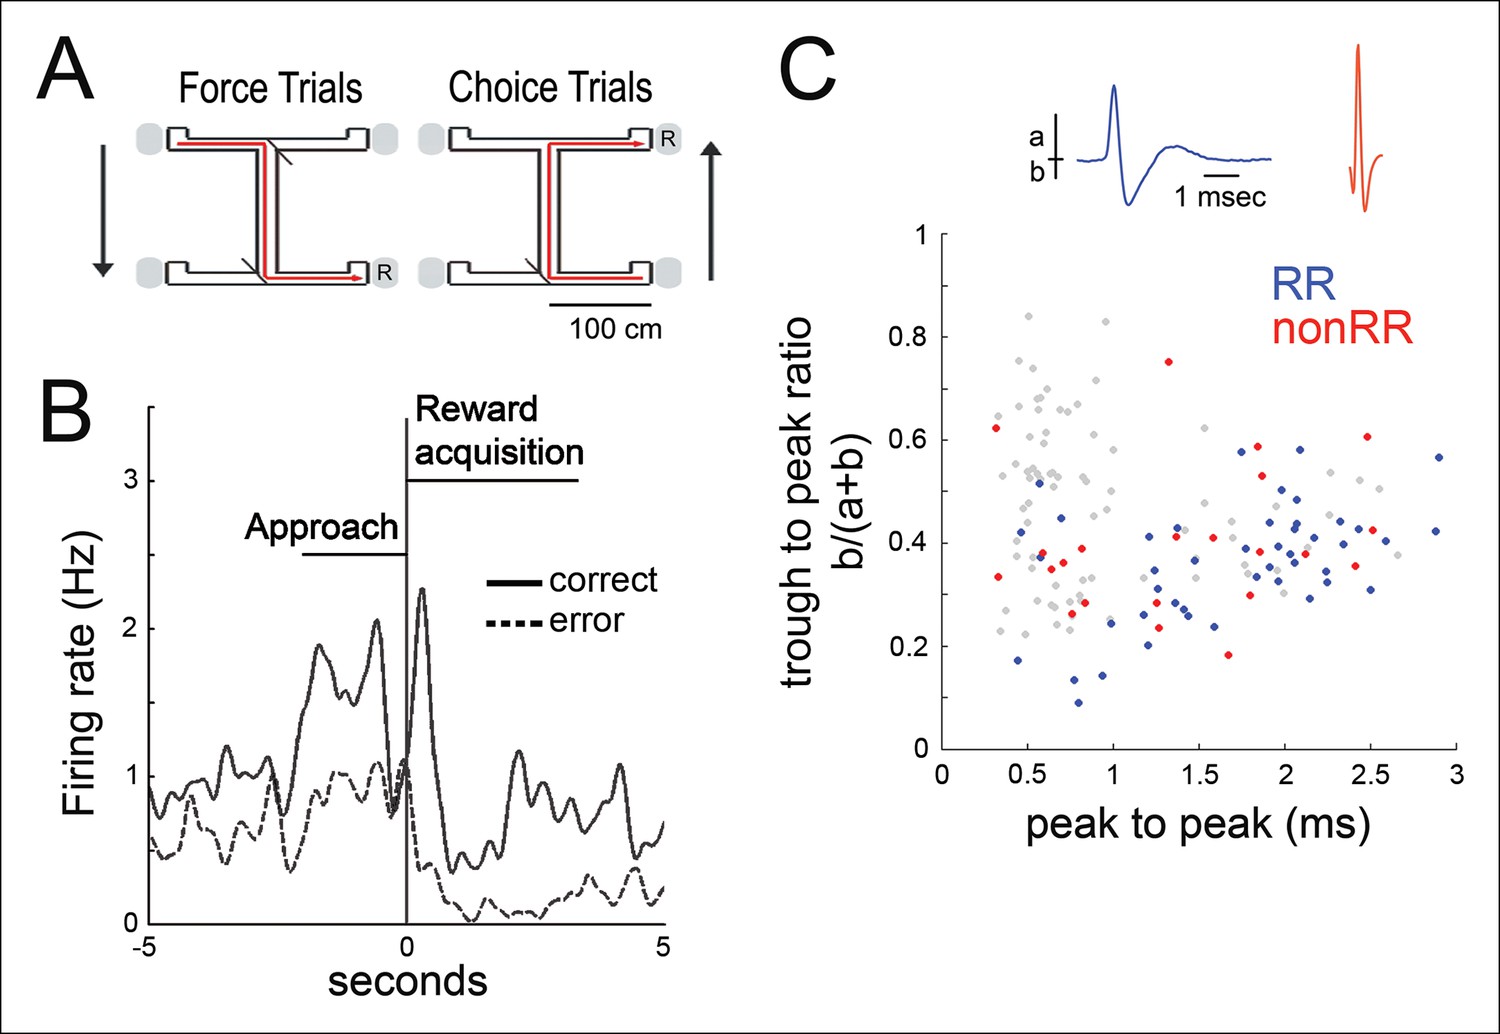
Spatial working memory task and VTA unit properties.
(A) Spatial working memory task. In the force direction (sample phase), rats traverse the central arm for reward (R) at either of two pseudorandomly selected left or right force-reward locations. The reward contingency in the choice direction (test phase) required that if the rat had been forced to turn left (or right) in the sample phase, then the correct response in the test phase was to turn right (or left, respectively). (B) Example VTA unit’s average reward site responses for correct trials (solid line) and error trials (dashed line). The nosepoke occurs at 0 s. The profile of reward-site associated activity, including differential activity on correct versus error trials during reward approach and during reward acquisition, is consistent with prior observations in instrumental tasks (Morris et al., 2006; Roesch et al., 2007; Totah et al., 2013). (C) Waveform features of 145 VTA units recorded in the sleep box, using the waveform criteria described in (Fujisawa and Buzsáki, 2011). The waveform duration is defined as the time from waveform major peak to final peak. The trough to peak ratio is defined as the ratio of the waveform trough amplitude to the full amplitude. 84 units that were acquired with adequate task behavior and co-recorded hippocampal activity underwent further analysis. Reward responsive (RR) units are shown in blue, and non-reward responsive units (nonRR) are shown in red. Waveforms of two units are displayed.
Figure 2 with 1 supplement
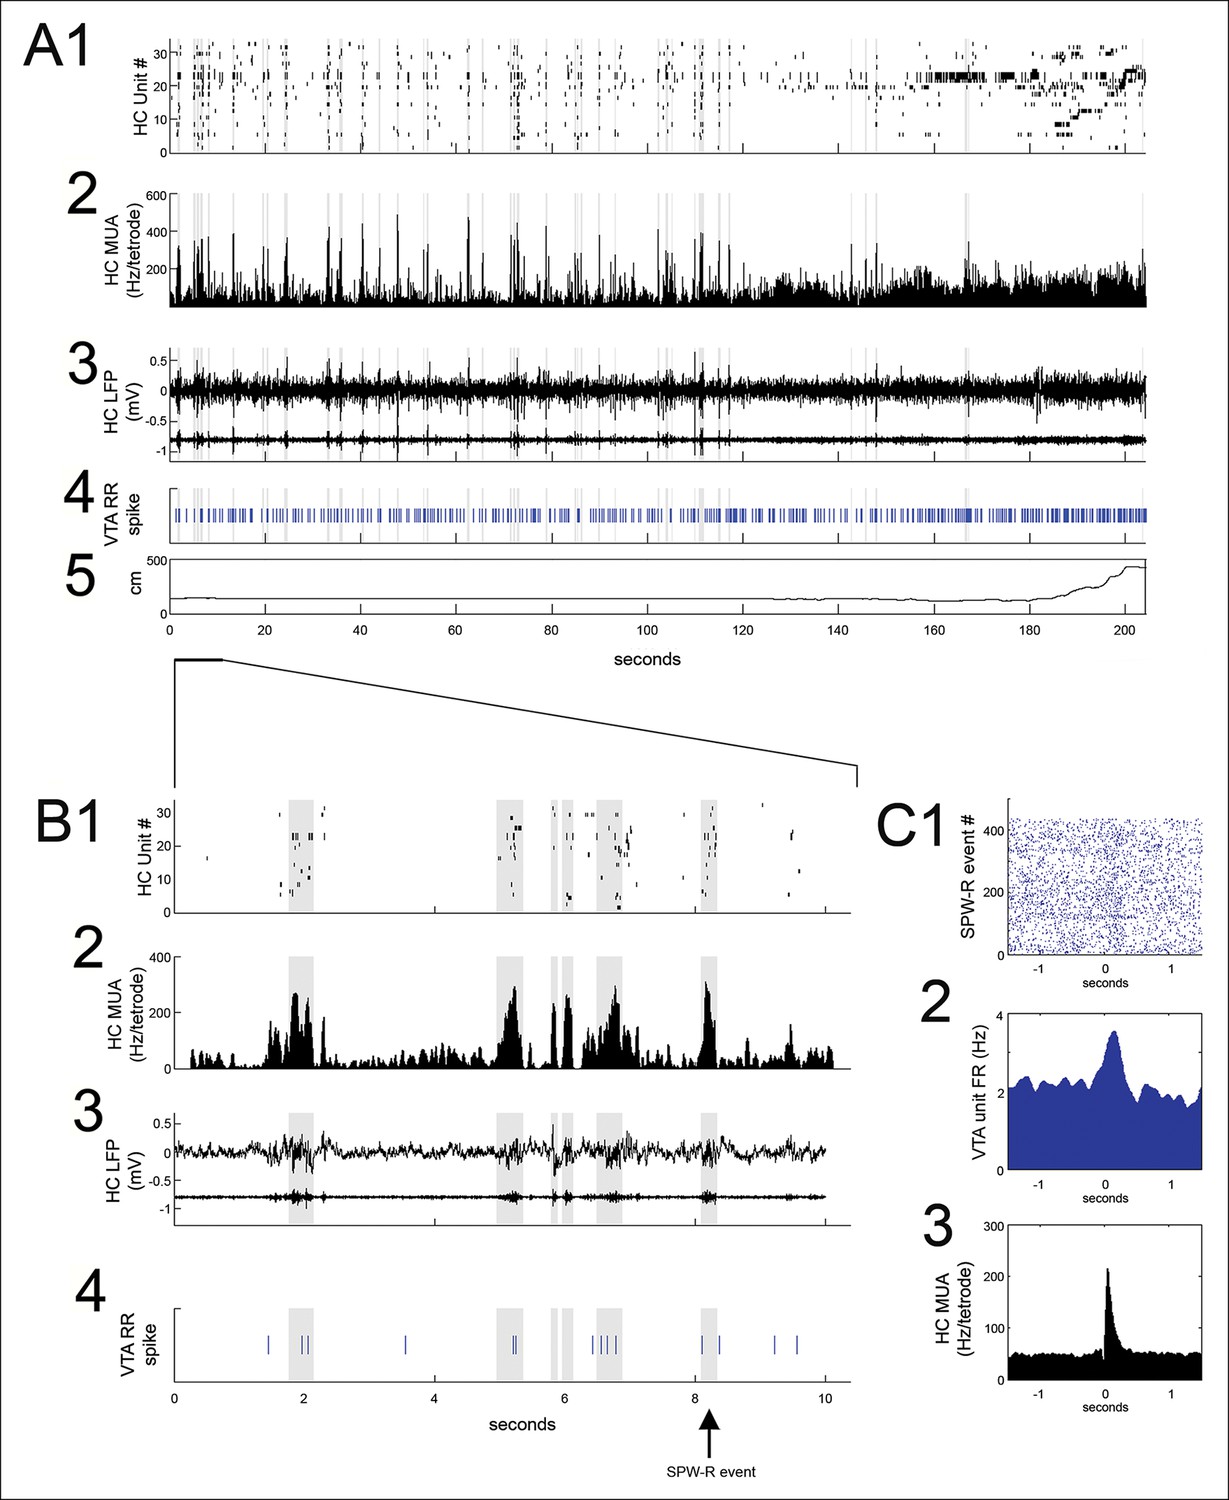
VTA unit coordination with hippocampal sharp-wave ripples.
(A) Continuous recordings of hippocampal (HC) (1) single unit activity, (2) multiunit activity (MUA, average spike rate per tetrode), (3) local field potential and ripple band, (4) a simultaneously recorded reward-responsive (RR) VTA unit, and (5) the animal’s position on the track. The hippocampal units are ordered by the position of their place fields on the spatial working memory task. Sharp-wave ripple events (SPW-R) are shown in gray. (B) A magnified view of 10 s of continuous data. (C1) Rastered RR VTA unit action potentials, (2) RR VTA unit peri-event time histogram (PETH; smoothing with a 50ms Gaussian window), and (3) HC multiunit PETH (10 ms Gaussian smoothing), aligned to the start of SPW-R-associated HC multiunit events.
Figure 2—figure supplement 1
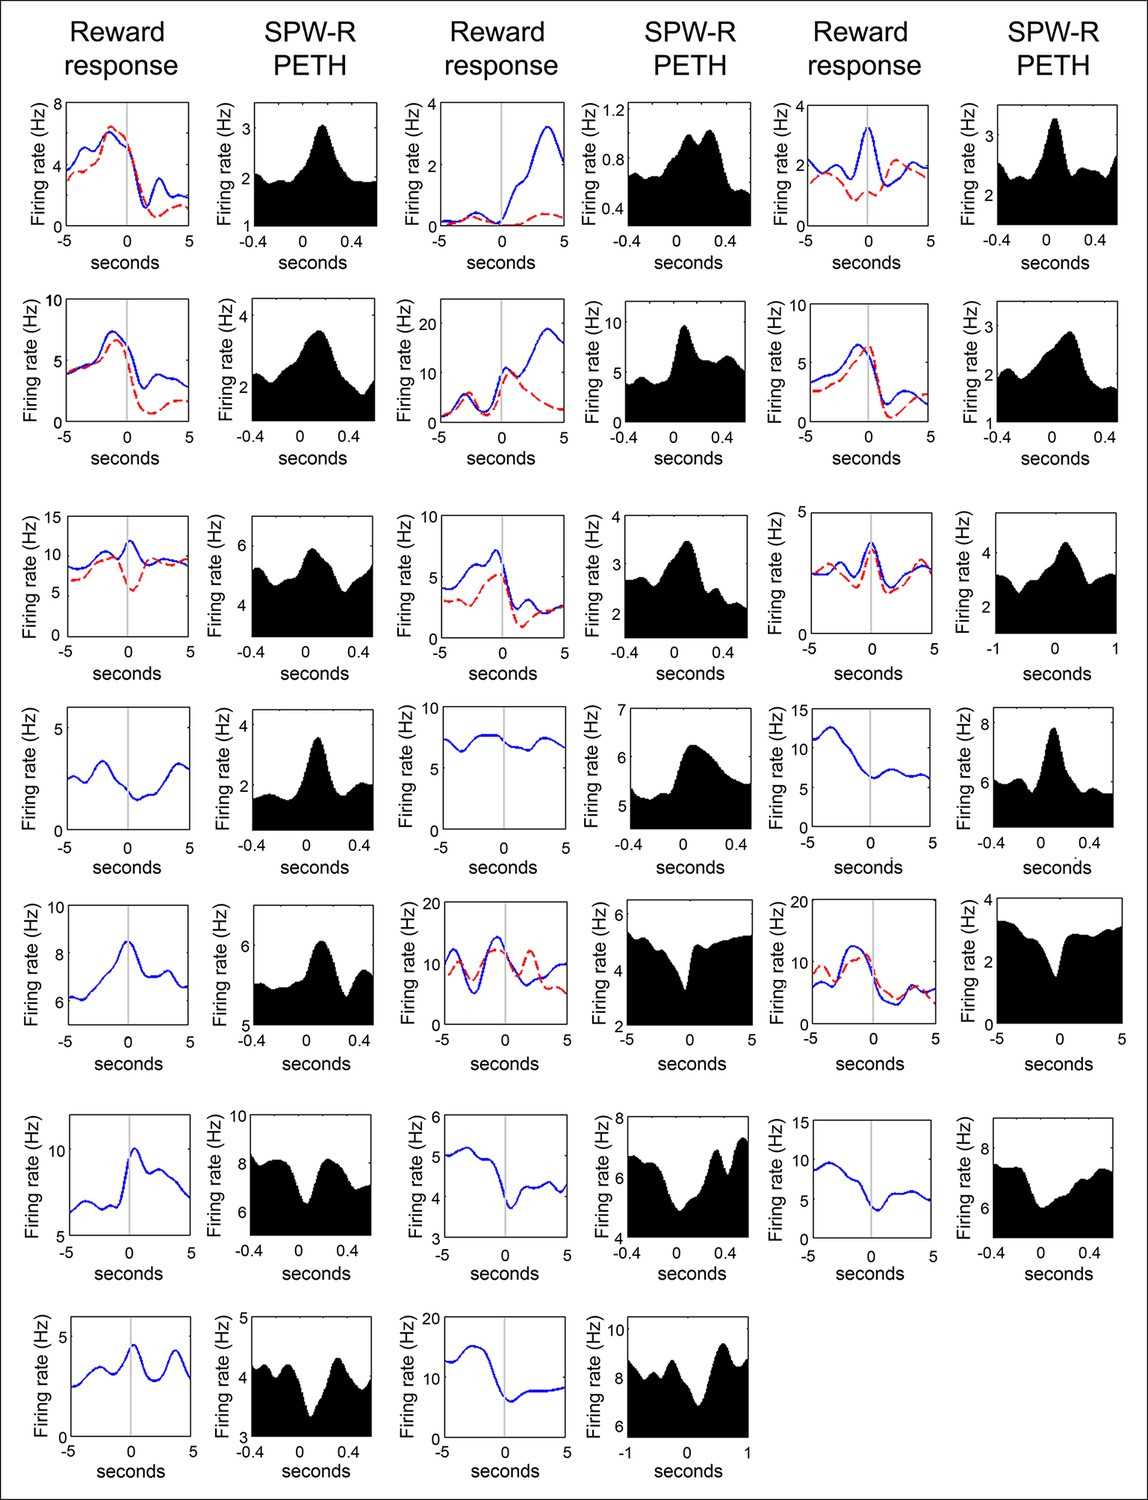
Firing rate distributions of SPW-R modulated VTA units at reward acquisition and at SPW-R events of quiet wakefulness.
For units recorded on the SWM task, the average nosepoke triggered PETH for correct trials (solid blue lines) and for error trials (red dashed lines) are shown. Units acquired on the linear maze have a single nosepoke triggered PETH. Data are aligned to the time of nosepoke (vertical line). For the SPW-R event triggered PETH plots, data are aligned to the start of SPW-R events. Note that VTA unit activity often increases during reward approach and reward acquisition, and that VTA unit activity can be both positively and negatively modulated at SPW-R events.
Figure 3 with 2 supplements
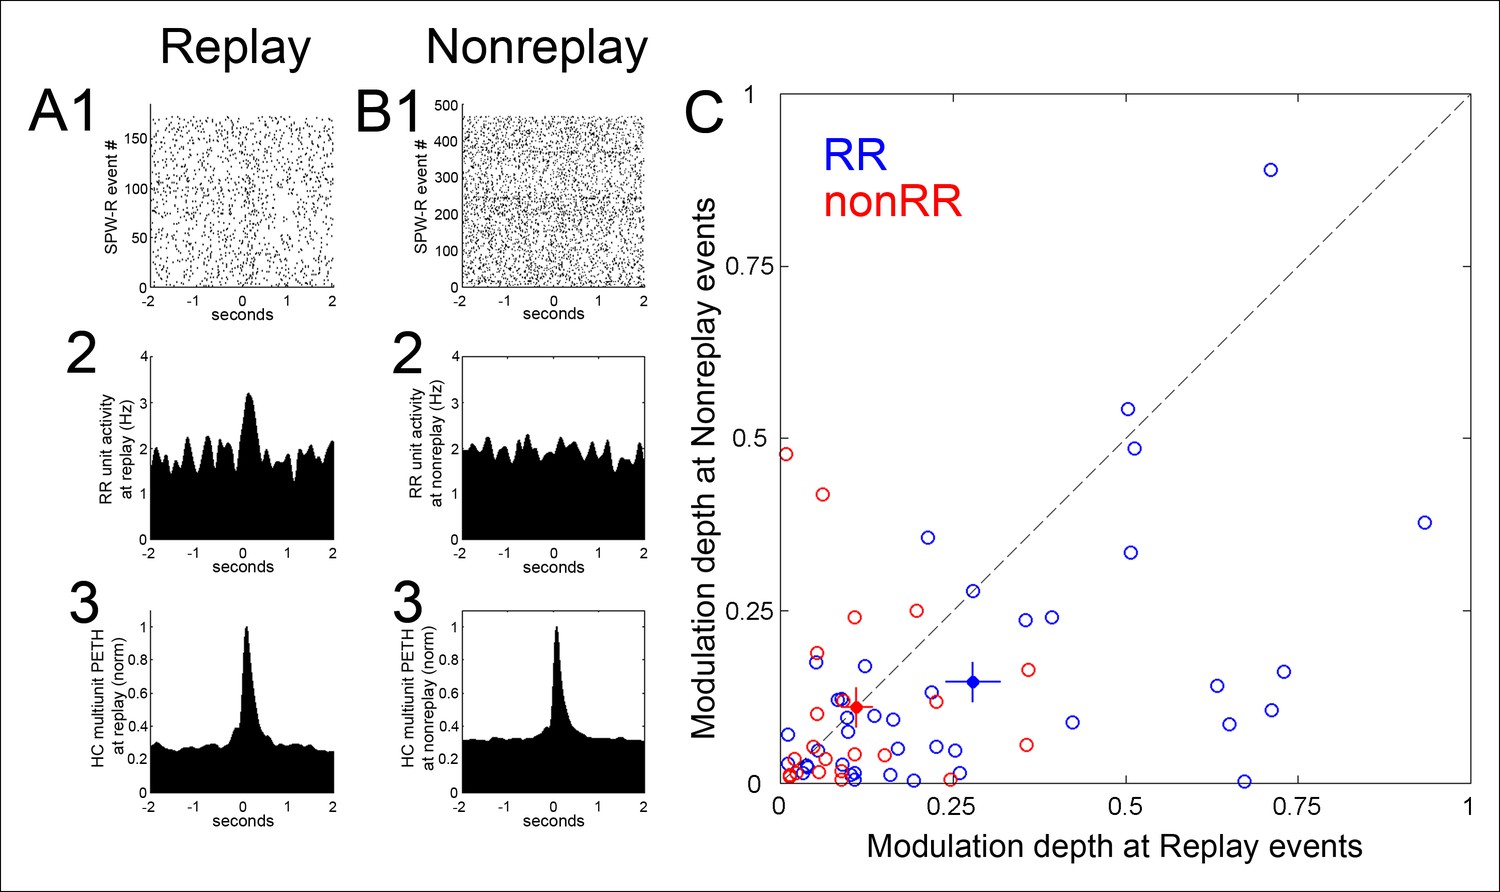
Modulation depth of VTA reward responsive units at hippocampal SPW-R events depends on SPW-R spatial content.
(A) Rastered reward responsive (RR) unit spikes (1) and RR unit and hippocampal (HC) multiunit PETHs (2,3), aligned to the start of SPW-R events encoding replay sequences. (B) As in A, for SPW-R events not encoding replay. (C) PETH modulation depth of RR units (blue) is greater for replay than nonreplay events; p=4.5 × 10⁻⁴, signed-rank test). NonRR unit data are shown in red (p=0.6). Solid circles with error bars designate the mean and s.e.m. for RR and nonRR units.
Figure 3—figure supplement 1

Position reconstruction using clusterless hippocampal decoding.
(A) Bayesian reconstruction of run behavior on the spatial working memory task (500 ms time bins). The track has been linearized. (B) Decomposition of the track into segments for linearization. Maze segments were apposed in the direction of run in the choice direction: from force reward sites (R3, R4) to force point (fp) to choice point (cp) to choice reward sites (R1, R2). (C) Confusion plot for this recording session, using alternating 1 s epochs for training and testing the reconstruction algorithm. (D1) Bayesian reconstruction of a SPW-R event reveals spatial sequence reactivation (25 ms time bins). (D2) The associated hippocampal multiunit activity. (D3) The action potentials of two simultaneously recorded reward responsive VTA units.
Figure 3—figure supplement 2
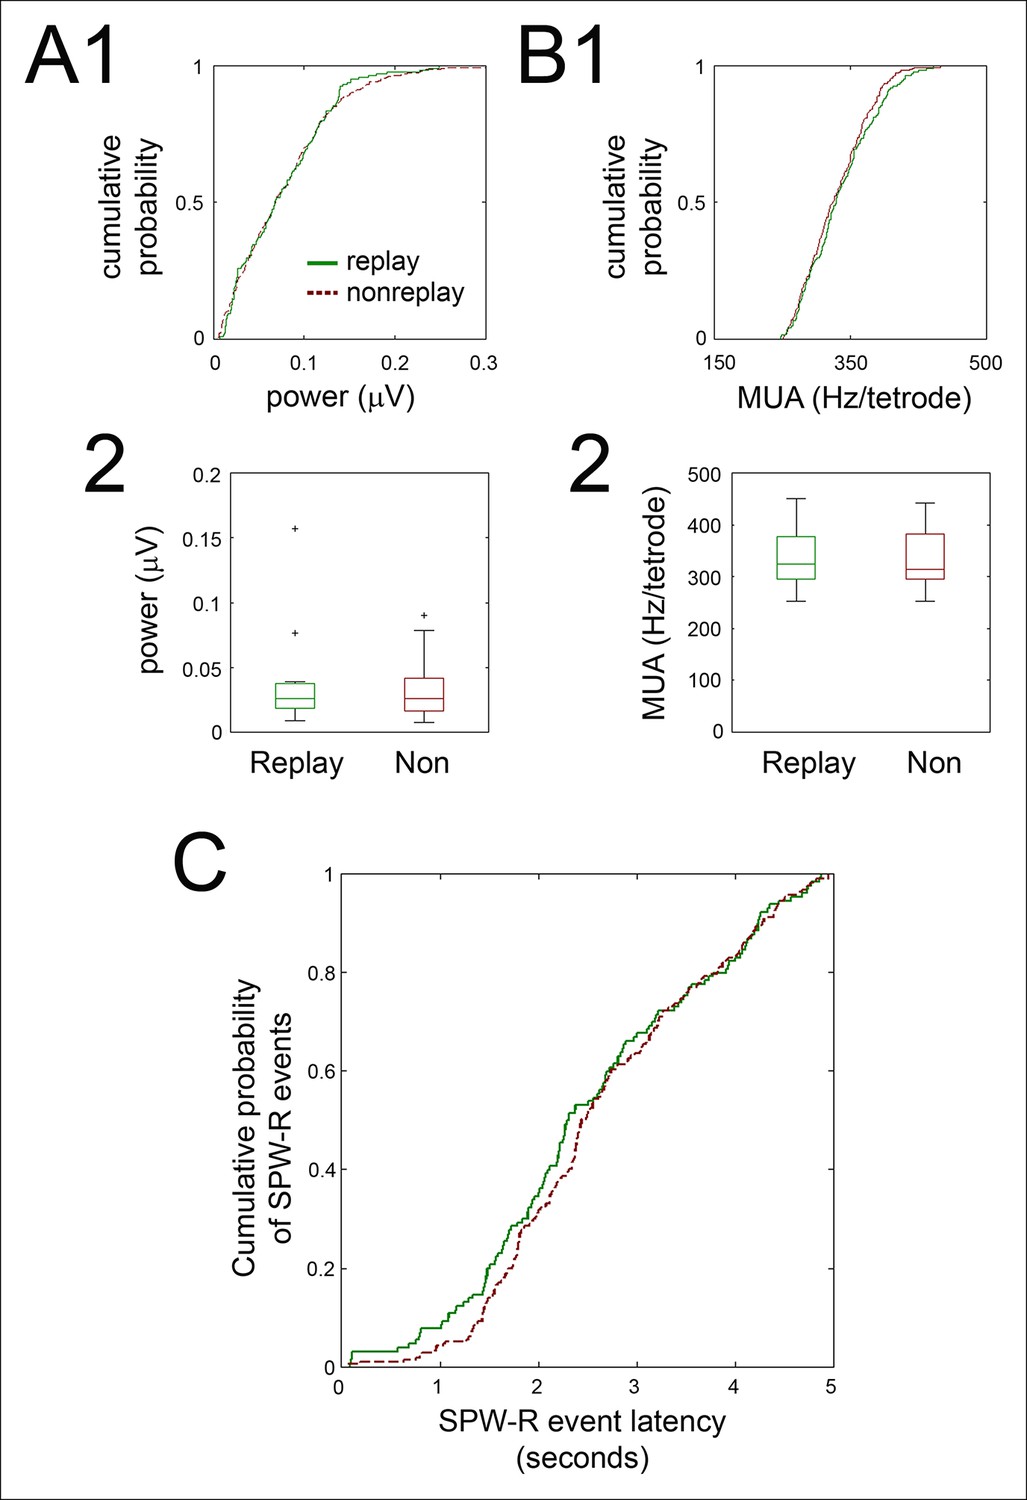
Ripple power, SPW-R associated hippocampal activity, and SPW-R event latency in the immediate post-reward period were similar for replay and non-replay events.
(A1) For the recording shown in Figure 3A,B, cumulative ripple-band power of replay (green solid line) and non-replay (brown dashed line) events are displayed. (A2) Across recordings, replay and nonreplay events have similar ripple power (box and whisker plots, medians with interquartile range; p=1, sign-rank test). (B1) Cumulative SPW-R event peak multiunit activity (MUA; Hz/tetrode) for the same example, for replay (green solid) and non-replay (brown dashed) events. (B2) Across recordings, SPW-R event peak MUA is similar for replay and non-replay events (medians with interquartile range; p=0.6, sign-rank test). (C) Cumulative distributions of SPW-R event latencies relative to nosepoke for reward delivery were similar for replay (green solid line) and nonreplay (brown dashed line) SPW-R events (p=0.2, Kolmogorov-Smirnov test).
Figure 4
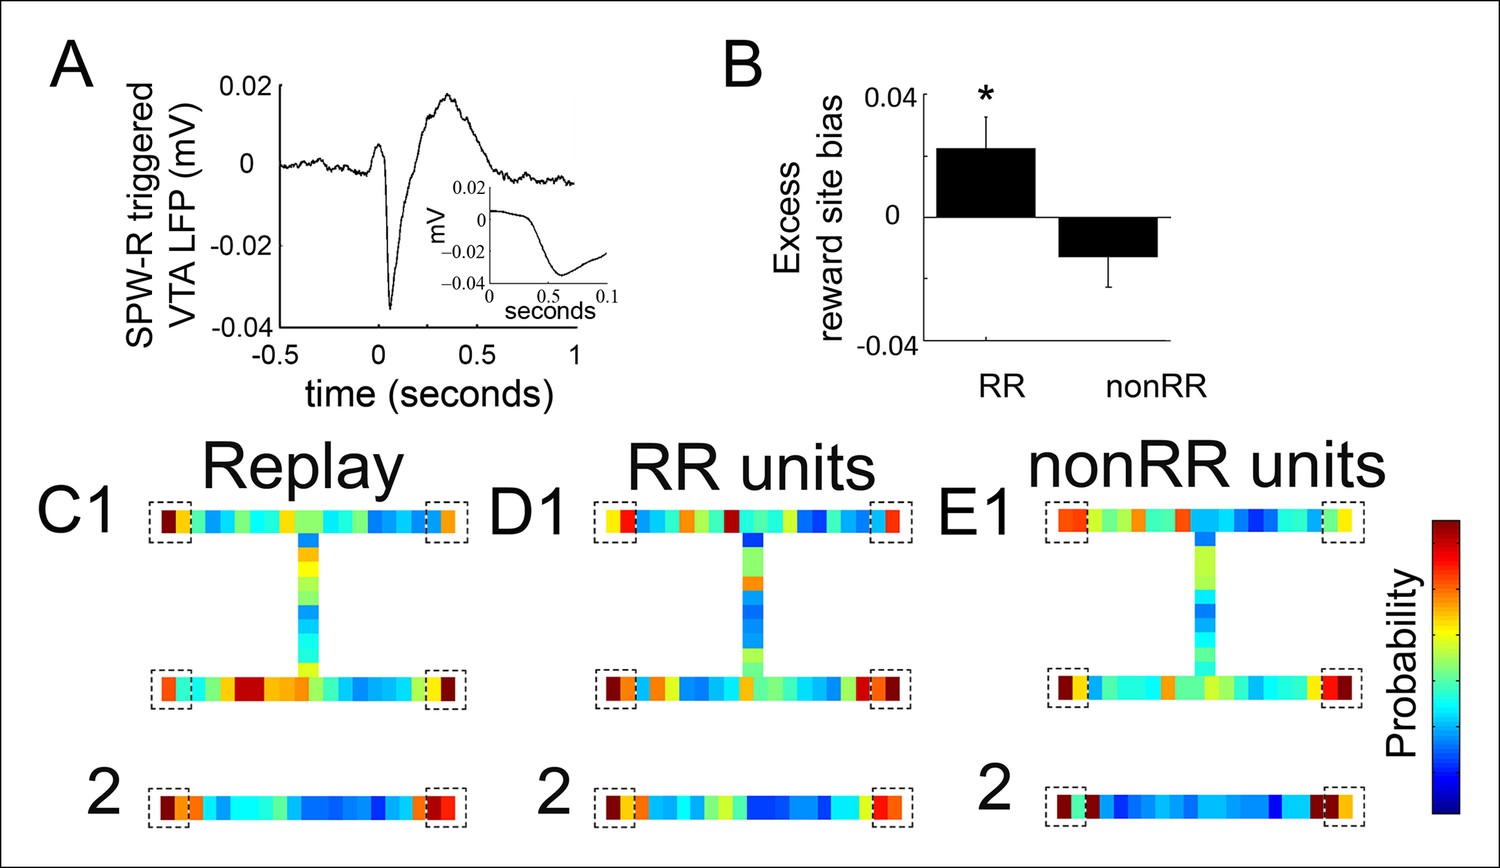
Reward responsive VTA units coordinate with replayed reward locations.
(A) The SPW-R triggered VTA local field potential (LFP) shows a delayed potential. Time 0 reflects the start of SPW-R events. (B) Incorporating this delay between the hippocampus and VTA, across replay events occurring at the forced reward sites, RR unit spikes preferentially coordinated with replayed reward locations compared to SPW-R replay content in general (p=0.048, chi = 3.9, Chi-square test) and compared to nonRR units (p=0.016, nonparametric permutation test). Error bars represent s.d. (C) Probability distribution of replayed spatial locations for replay events occurring at the forced reward sites on the spatial working memory (SWM) (1) and linear tasks (2) (10 cm bins), accumulated across recordings. Dashed boxes designate reward sites. (D,E) Distribution of replayed locations coinciding with RR unit spikes (D1,2) and nonRR unit spikes (E1,2) adjusting for the latency between SPW-R onset and the VTA delayed potential. The probability colorbar for the SWM task ranges from 0 to 0.04 and for the linear track ranges from 0 to 0.1.
Figure 5 with 1 supplement
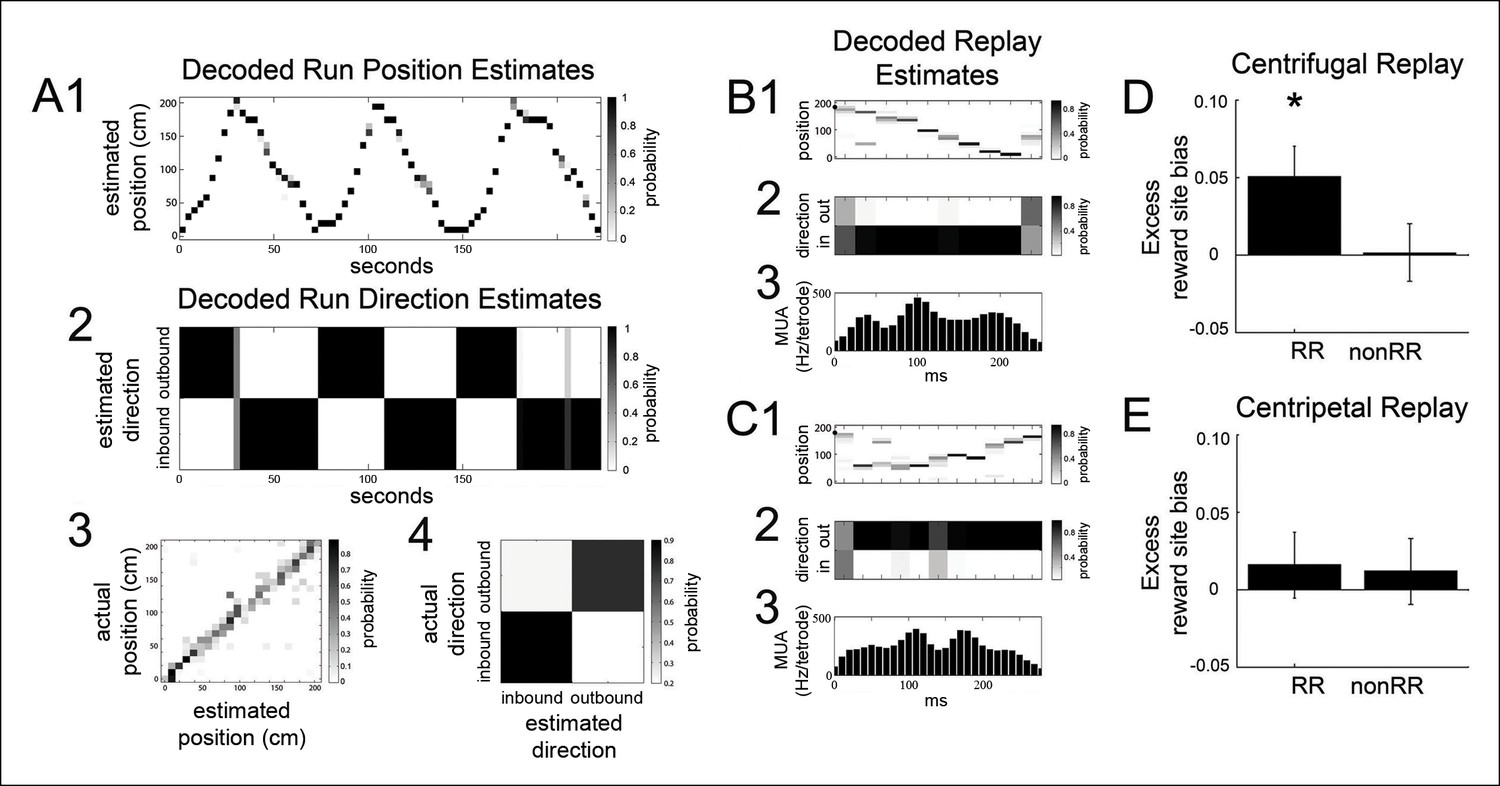
The bias of reward responsive VTA unit activity towards the replay of reward locations is greater for centrifugal than centripetal replay.
(A1,2) Bayesian reconstruction of run position and run direction on the linear track (500 ms time bins). Outbound refers to run direction from 0 to 200 cm. (A3) Position confusion plot for this recording session, using alternating 1 s epochs for training and testing the reconstruction algorithm. (A4) Run direction confusion plot. (B) Centrifugal, forward replay event occurring while the rat paused at the far reward site (190 cm; black circle indicates the rat’s position). (B1) Position reconstruction (25 ms time bins). (B2) direction reconstruction). (B3) The associated hippocampal multiunit activity. (C) Centripetal, forward replay event occurring while the rat paused at the far reward site. (C1) Position reconstruction. (C2) Direction reconstruction. (C3) Associated hippocampal multiunit activity. (D) Across centrifugal replay time bins, RR unit spikes preferentially coordinated with replay of reward locations compared to centrifugal replay content in general (p=0.014, chi=6.0, Chi-square test) and compared to nonRR units at centrifugal replay (p=0.05, nonparametric permutation test). Error bars represent s.d. (E) Across centripetal replay time bins, RR unit spikes showed no increase in coordination with replay of reward locations compared to centripetal replay content in general (p=0.5, chi=0.5, Chi-square test). Error bars represent s.d.
Figure 5—figure supplement 1

Centrifugal and centripetal replayed locations associated with RR unit activity on the SWM task and the linear track.
(A) On the SWM task, the distribution of centrifugal replayed locations (green) is less concentrated at reward sites (marked by vertical lines) than the distribution of RR unit-associated centrifugal replayed locations (blue). See Figure 5 for statistics. Maze segments were aggregated by apposing them in the direction of run in the choice direction: from force reward sites (R3, R4) to force point (fp) to choice point (cp) to choice reward sites (R1, R2). Spatial bins 1–10 show the average of the force arms of the task (arms 3 and 4), spatial bins 11–20 show the central arm, and spatial bins 21–30 show the average of the choice arms (arms 1 and 2). (B) The distribution of centripetal replayed locations (green) on the SWM task is similar to the distribution of RR unit-associated centripetal replayed locations (blue). (C) On the linear track, the distributions of centrifugal replayed locations (green) and RR unit-associated centrifugal replayed locations (blue) are similar. (D) On the linear track, the distribution of centripetal replayed locations (green) and the distribution of RR unit-associated centripetal replayed locations (blue) are also similar.
Figure 6
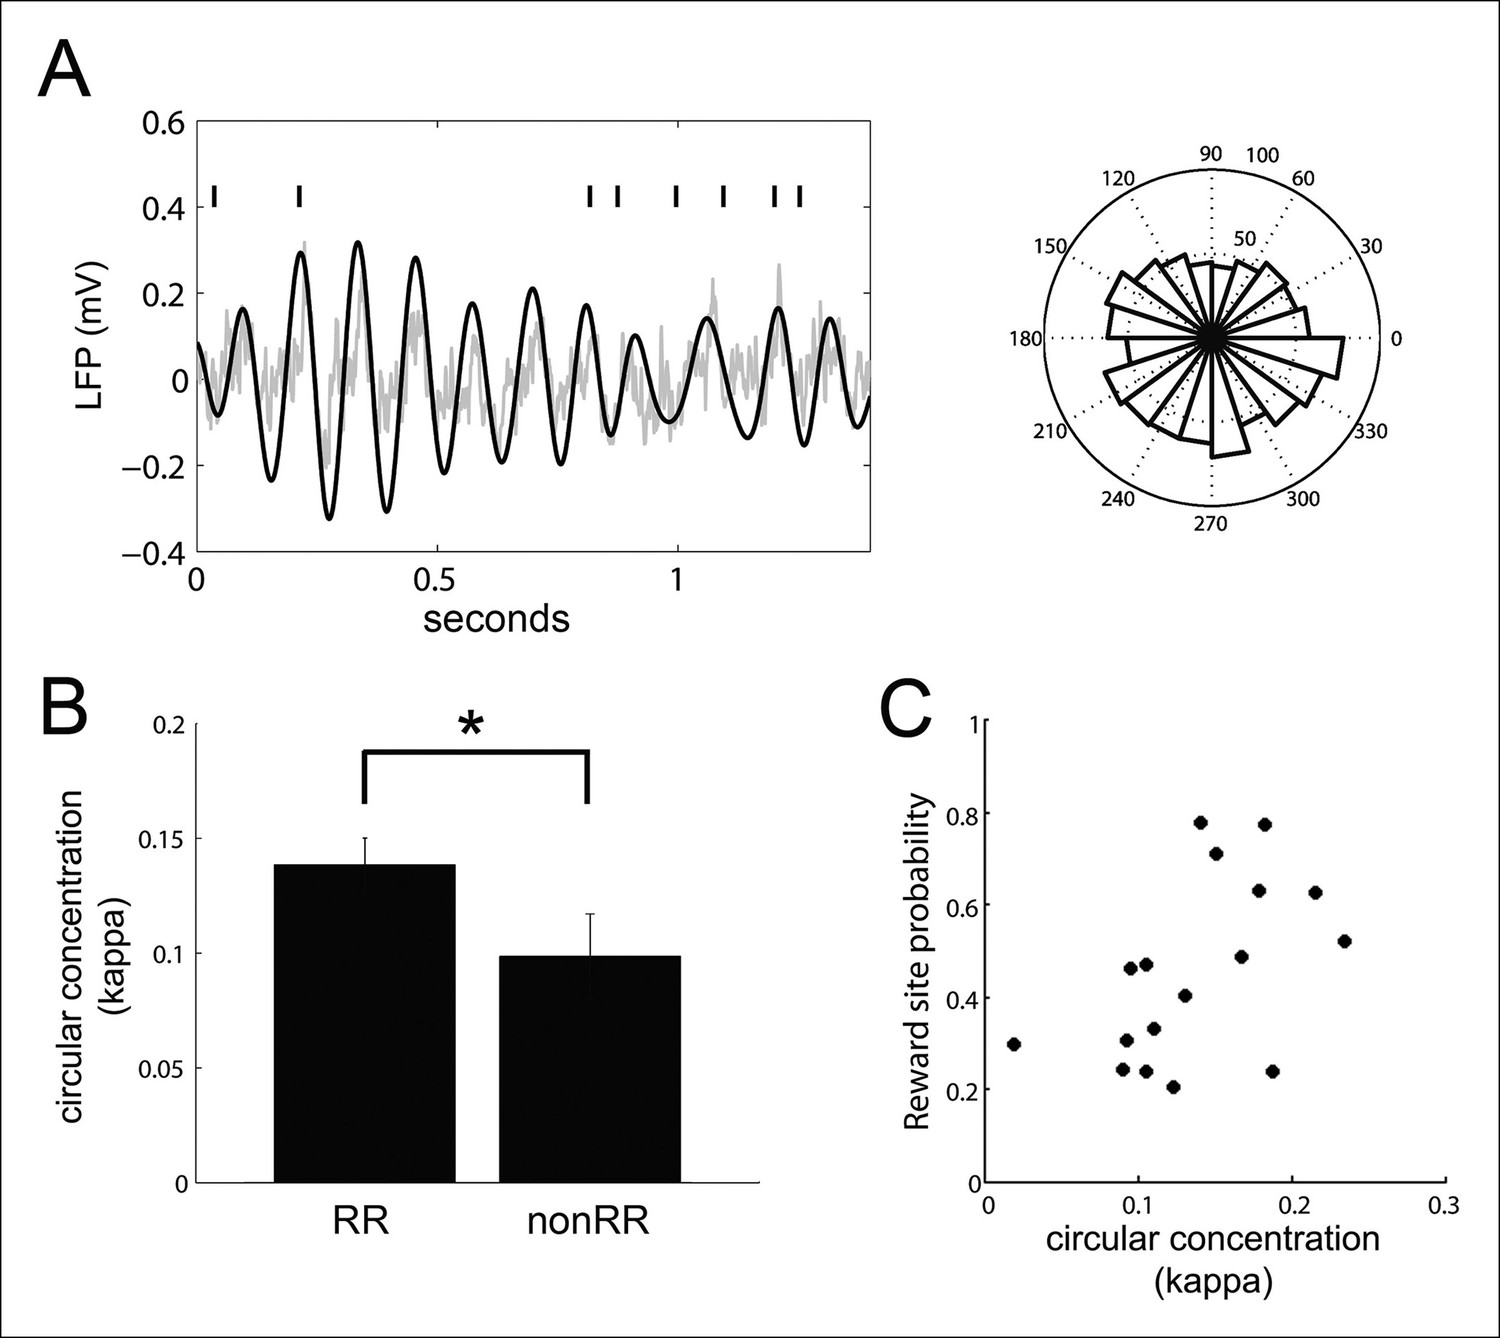
VTA units coordinate with hippocampal theta.
(A) Spike times of a reward responsive (RR) VTA unit relative to hippocampal theta and raw LFP during running behavior, and spike phase distribution (circular concentration coefficient, kappa = 0.14; Rayleigh statistic p value = 0.002). (B) Circular concentration at hippocampal theta is greater for RR units than nonRR units (p=0.031, rank-sum test). Error bars represent s.e.m. (C) The probability of replayed reward locations coinciding with the spikes of theta-modulated RR units correlates with the circular concentration of those units at hippocampal theta (r = 0.51, p=0.038).
Figure 7
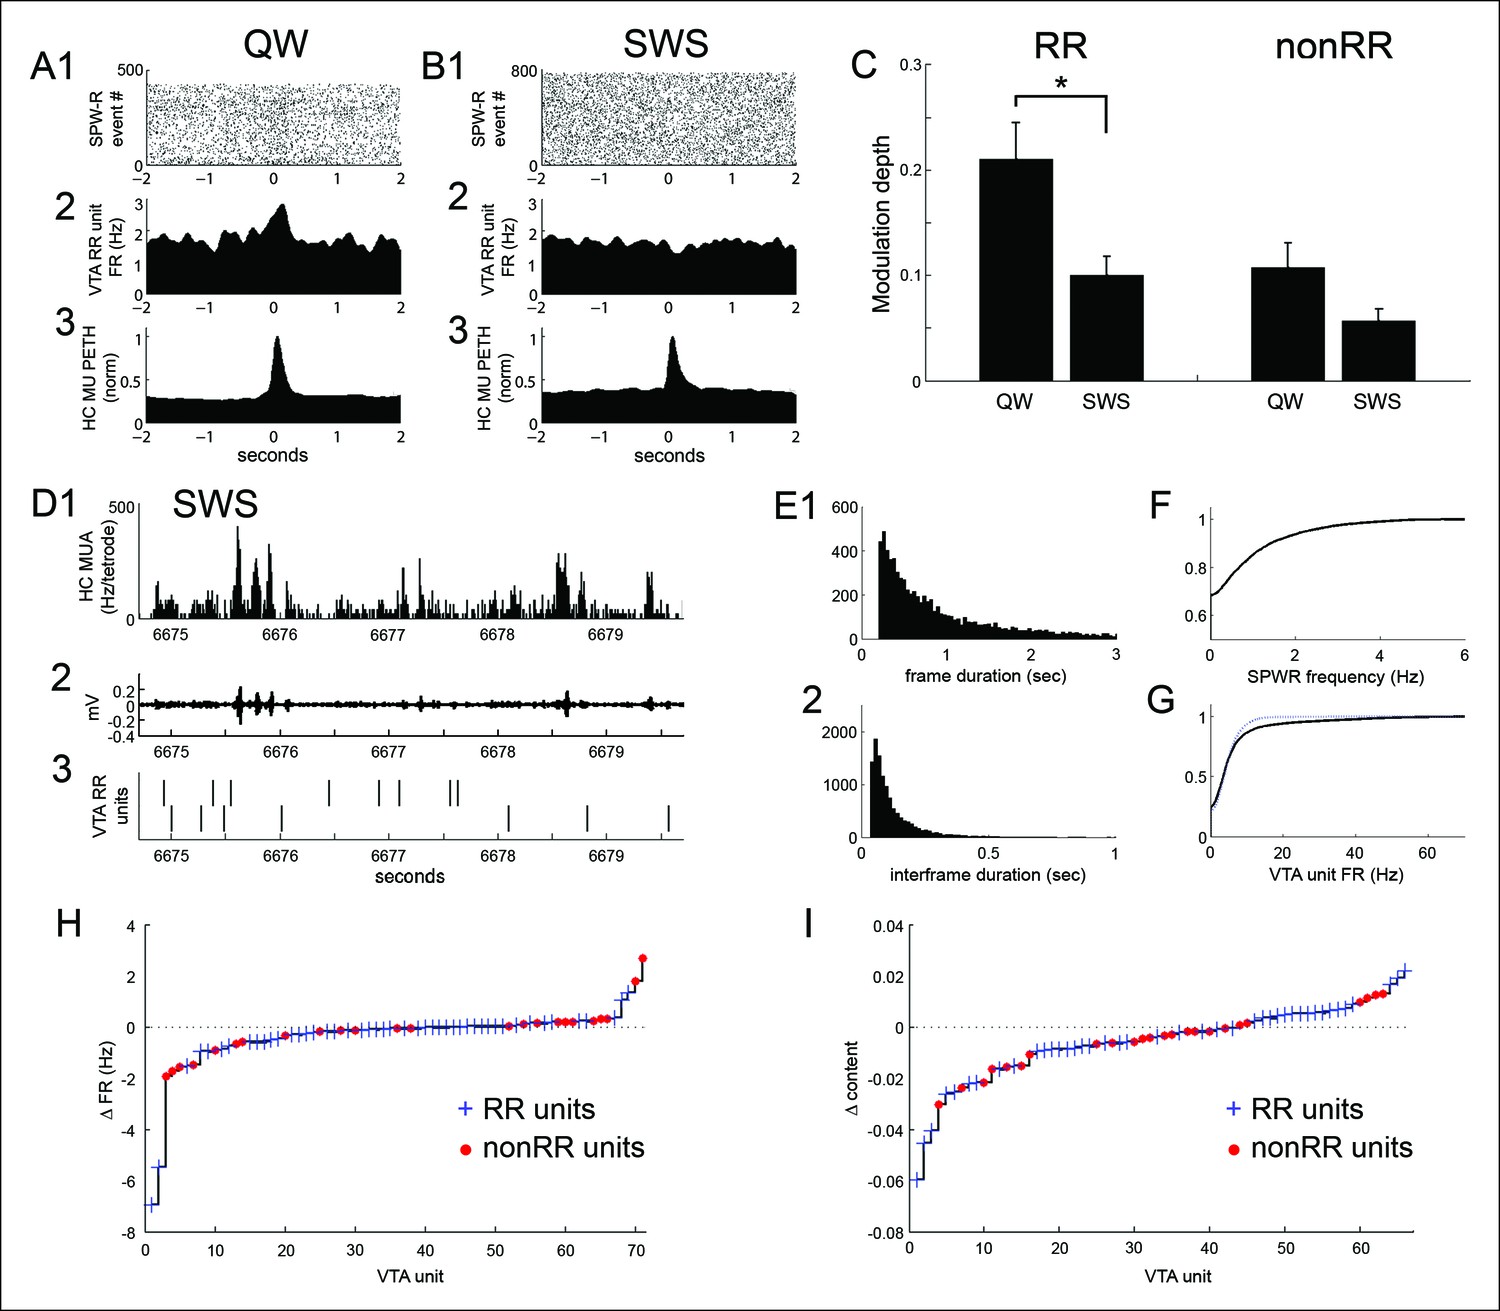
SPW-R-associated modulation of VTA units during periods of quiet wakefulness (QW) on the task and during subsequent slow wave sleep (SWS).
(A) Rastered QW-associated reward responsive (RR) VTA unit spikes (1) and RR unit and hippocampal (HC) multiunit PETHs (2,3), aligned to SPW-R events. (B) SWS-associated data for the same RR unit. (C) SPW-R event modulation depth of RR and nonRR unit activity in QW and SWS (RR units: QW vs SWS, p=0.003, rank-sum test; nonRR units: QW vs SWS, p=0.13, rank-sum test). Error bars represent s.e.m. (D1) Hippocampal multiunit activity, (2) ripple band, and (3) two RR VTA units in SWS. (E) Distributions of (1) SWS frame duration and (2) interframe duration across recordings. (F) Cumulative distribution of within-frame SPW-R frequency. (G) Within-frame VTA unit activity. RR units are shown separately in dashed line. (H) The difference in each VTA unit’s activity at frames of high and low SPW-R rate, defined relative to the mean (RR units: p=0.003, signed-rank test; nonRR units: p=0.5). (I) The difference in mean spatial content of frames with high and low VTA unit activity, relative to the mean (RR units: p=0.045, signed-rank test).
Figure 8
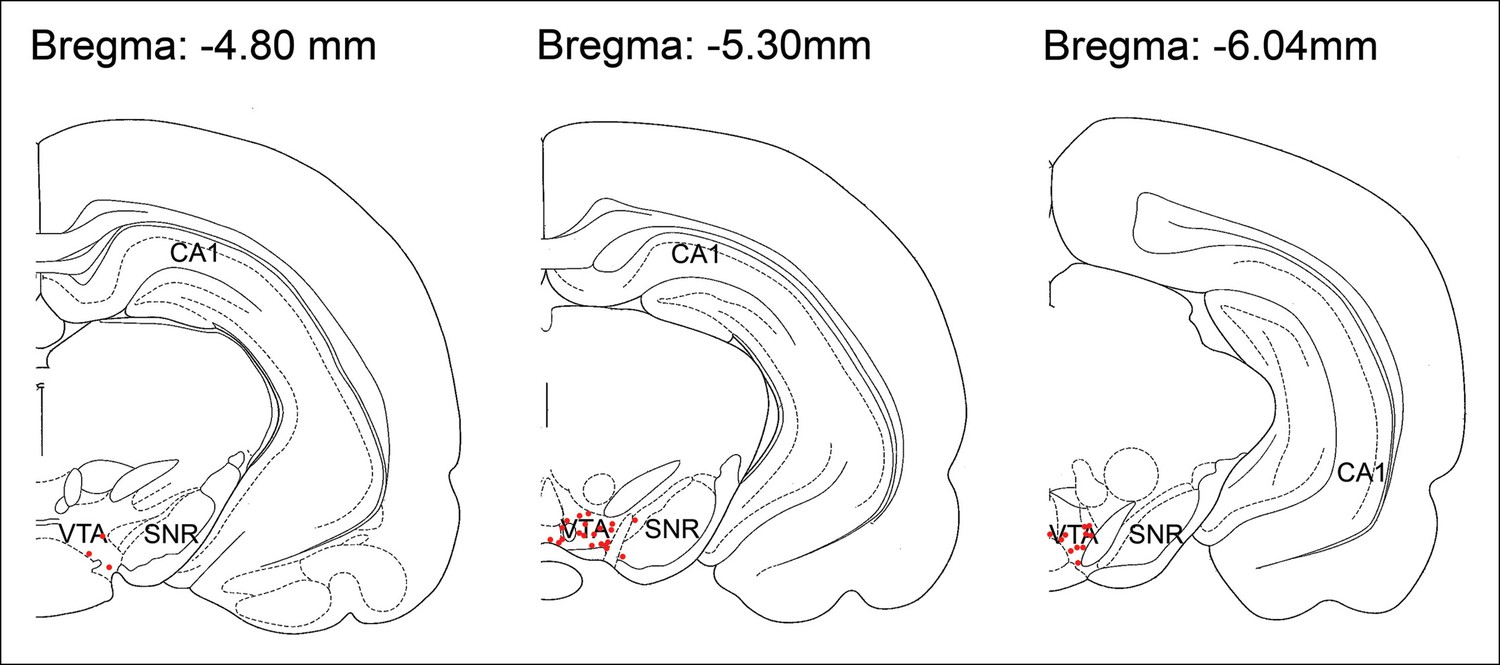
Histological location of tetrode tips targeting the VTA.
For each rat, electrolytic lesions marked the tetrode tip locations, and these were mapped onto the stereotaxic atlas of Paxinos and Watson (1998). Tetrode tips under-represent recording locations, which were acquired as electrodes were systematically lowered within the VTA along their tracks. SNR, substantia nigra reticulata.
Download links
A two-part list of links to download the article, or parts of the article, in various formats.
Downloads (link to download the article as PDF)
Open citations (links to open the citations from this article in various online reference manager services)
Cite this article (links to download the citations from this article in formats compatible with various reference manager tools)
VTA neurons coordinate with the hippocampal reactivation of spatial experience
eLife 4:e05360.
https://doi.org/10.7554/eLife.05360


