Gut bacteria are rarely shared by co-hospitalized premature infants, regardless of necrotizing enterocolitis development
- University of California, Berkeley, United States
- University of Pittsburgh School of Medicine, United States
- Children's Hospital of Pittsburgh and Magee-Womens Hospital of UPMC, United States
Figures
Figure 1
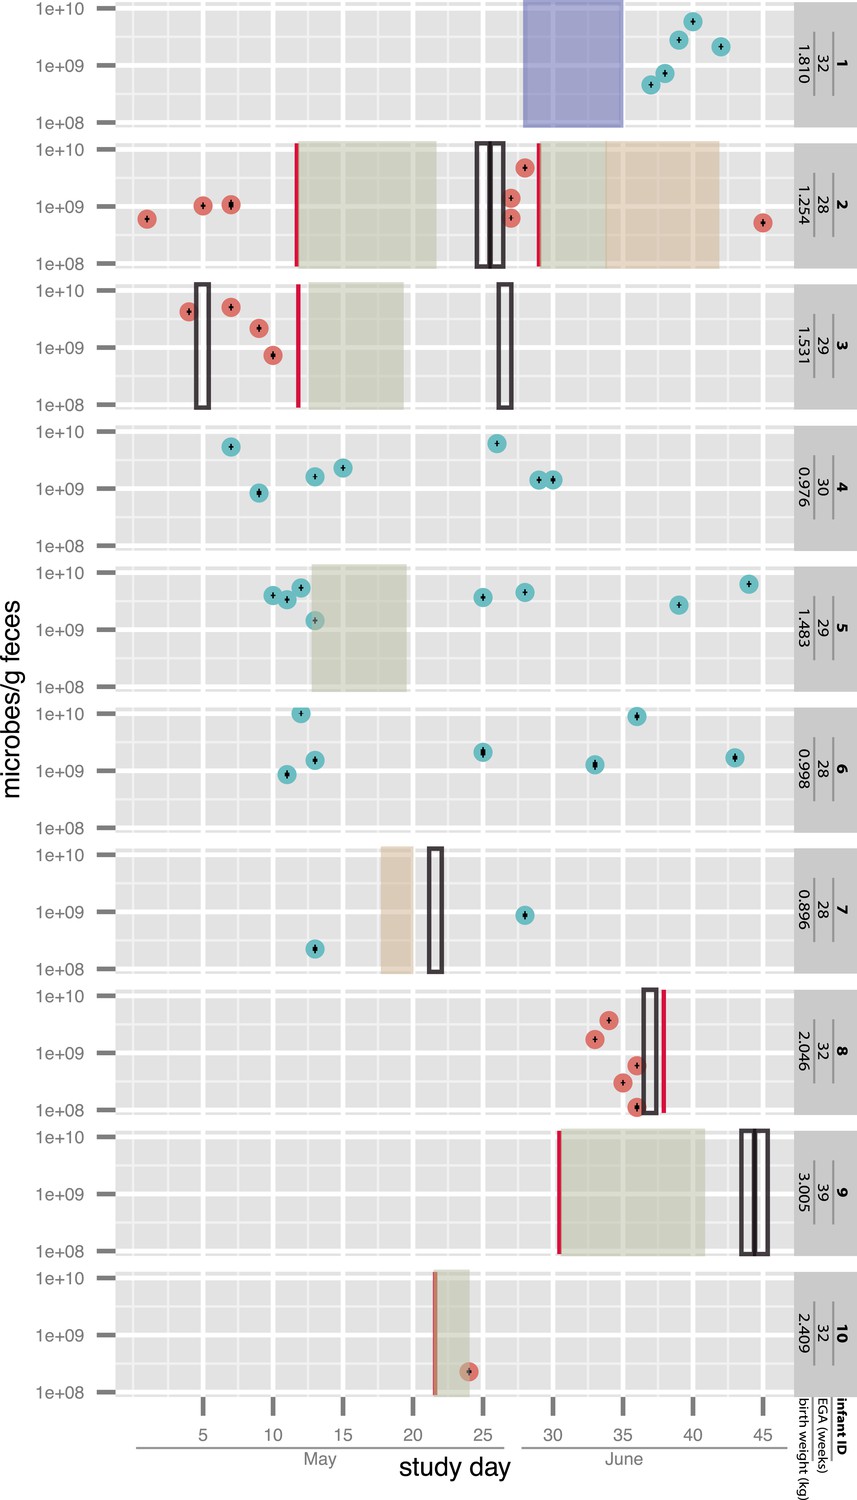
Overview of the sampling of infants affected by necrotizing enterocolitis (red) and controls (blue) and microbial cell loads based on droplet digital PCR (ddPCR) quantification of fecal samples.
For ddPCR, standard deviations for triplicates are plotted within each data point. Also shown are necrotizing enterocolitis (NEC) diagnosis times (vertical red lines) and periods of antibiotic administration: green: ampicillin + cefotaxime, orange: vancomycin + cefotaxime, and blue: ampicillin + gentamycin (see Supplementary file 1). Black boxes indicate metagenomic samples for which insufficient sample remained for ddPCR. EGA: estimated gestational age.
Figure 2
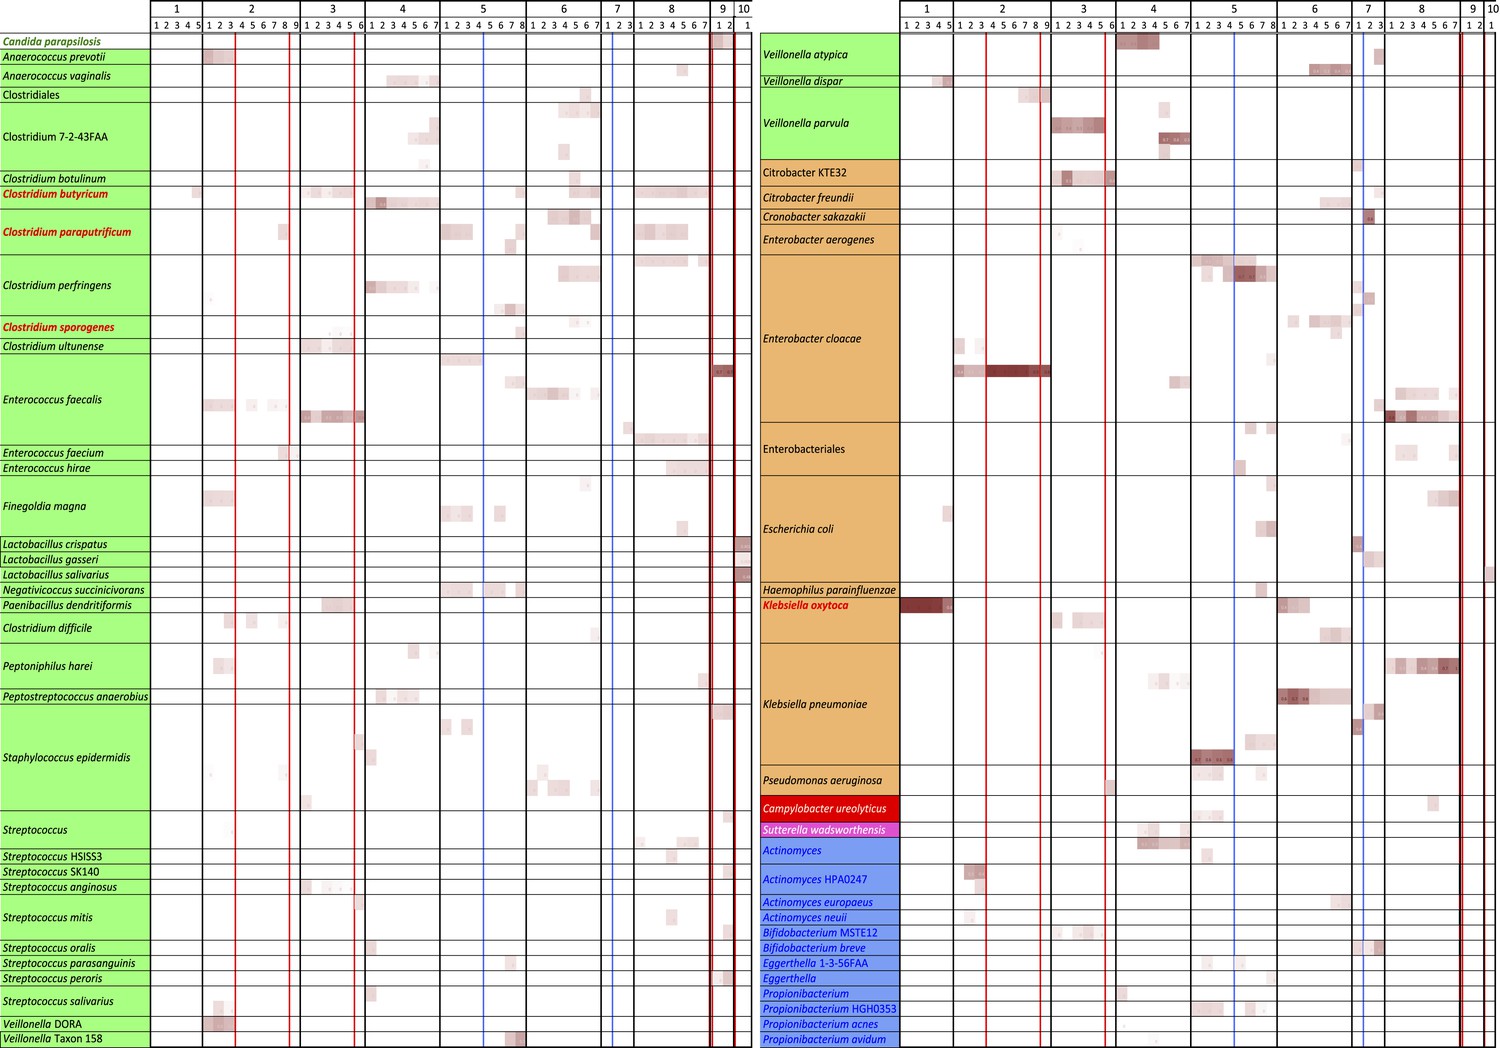
An overview of the distribution of 144 of the 149 tracked strains in the 55 samples from 10 infants (five rare organisms were not included for space reasons).
White boxes indicate that the strain was absent; shading intensity increases with increased organism abundance. Note the persistence of specific genotypes within infants and the almost complete lack of overlap in strains between infants. The few strains shared between infants are highlighted in red. Colors associated with organism names indicate the broader organism classification: green are Firmicutes, orange are Gammaproteobacteria, red are Epsilonproteobacteria, pink are Betaproteobacteria, and blue are Actinobacteria. Red lines indicate antibiotic administration associated with necrotizing enterocolitis diagnoses, blue lines indicate antibiotic administration for other reasons.
Figure 3

A phylogenetic tree (RAXML; black dots indicate bootstrap values of ≥80%) for predicted RuBisCO Form IV (RuBisCO-like) proteins involved in methionine salvage.
This protein was chosen for analysis because it is well studied and is not one of the 51 single copy (and generally highly conserved) genes used in other analyses. Colored dots identify the infant, while the number indicates the sample of origin. Red boxes highlight infants who developed necrotizing enterocolitis (NEC). Although Veillonella were prominent in many samples, sequence analysis revealed many distinct strains/species over the study cohort. Strain shifts occurred following antibiotic administration (e.g. in infant #2), but identical sequences were often detected in series of samples from the same infant. Note infants affected by NEC do not share the same strains/species.
Figure 4 with 2 supplements

Strain differences in recovered Enterococcus faecalis genomes.
(A) Alignment of the ∼2500 Enterococcus faecalis gyrA nucleotide sequences from all infants to that from infant #3, sample 1 revealing five distinct types (gray bars are scaffolds; SNPs are vertical black lines). Shown below are a tiny subset of reads from infant #3, sample 4 with SNPs that match nucleotides in the gyrA sequences from E. faecalis in another infant; all SNPs are consistent with a strain very similar to that in infants #2 and #7 (although derivation of some reads from other strains cannot be ruled out). (B) Phylogenetic representation illustrating two distinct Cas1 sequence types. (C) Inventory of 51 single copy genes showing that the 30 E. faecalis genomes are near-complete and providing information about encoded CRISPR and Cas.
Figure 4—figure supplement 1
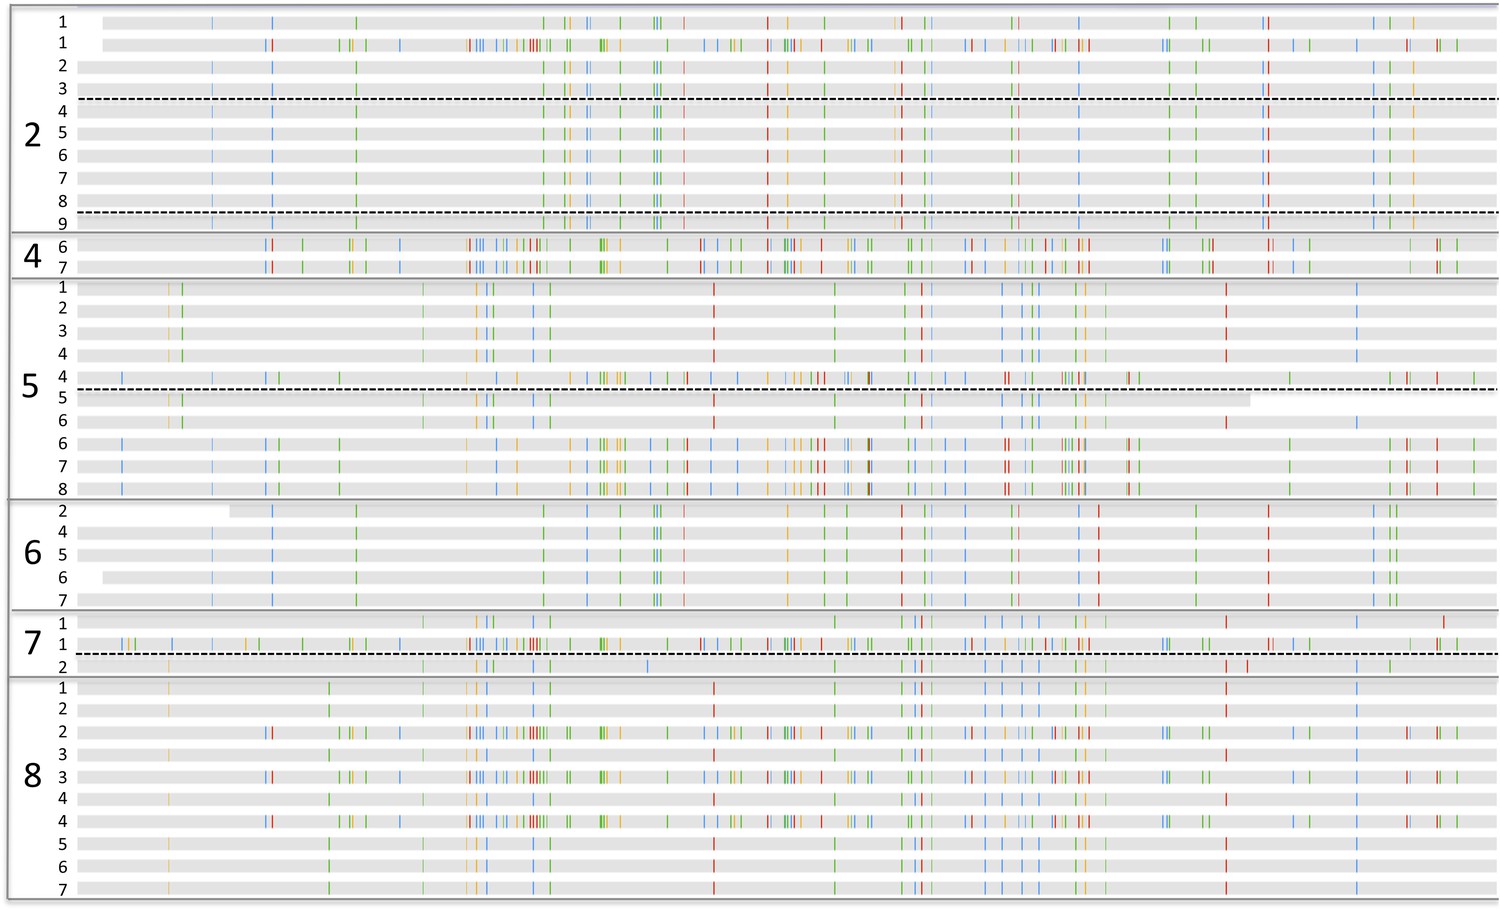
Alignments showing single nucleotide polymorphisms (vertical colored lines on gray bars that represent the sequences) in the Histidyl-tRNA synthetase genes that distinguish from Enterobacter cloacae strains across samples and infants.
Small numbers to the left of each gray bar indicate the samples of origin. Dashed black lines separate samples from before and after antibiotic administration in infants #2, #5, and #7. Note the presence of different (although often closely related) strains in different infants and the presence of two distinct Enterobacter cloacae genotypes in most infants. Also note the persistence of strains in infants #2 and #5, through antibiotic administration.
Figure 4—figure supplement 2
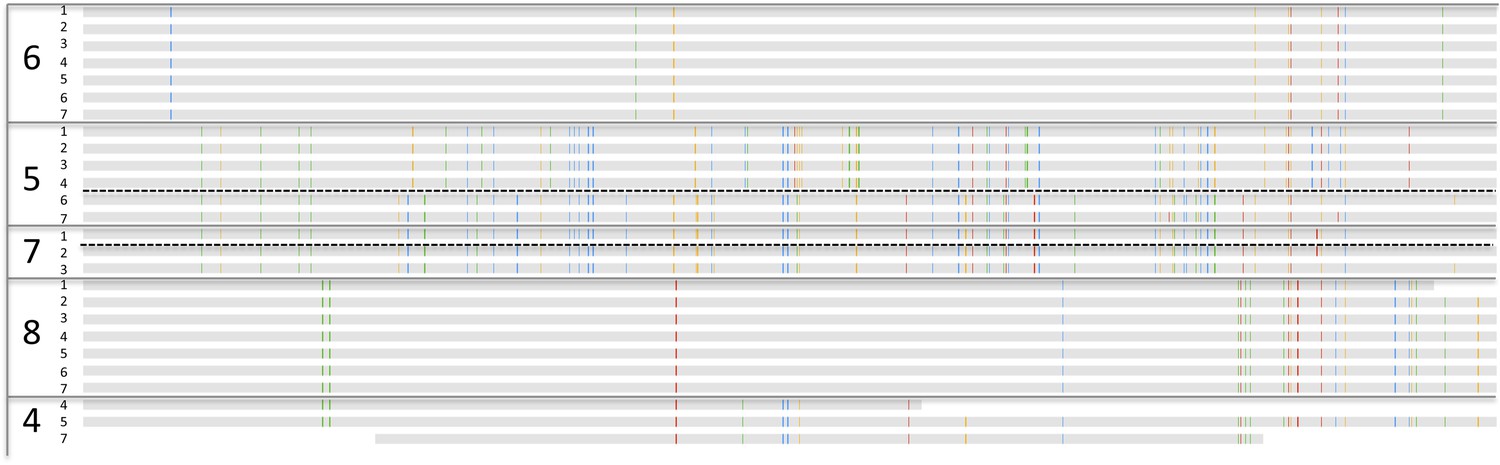
Aspartyl-tRNA synthetase from Klebsiella pneumoniae strains in samples from infants #4, #5, #6, #7, and #8.
Note the strain switch in Klebsiella pneumoniae following treatment of infant #5.
Figure 5
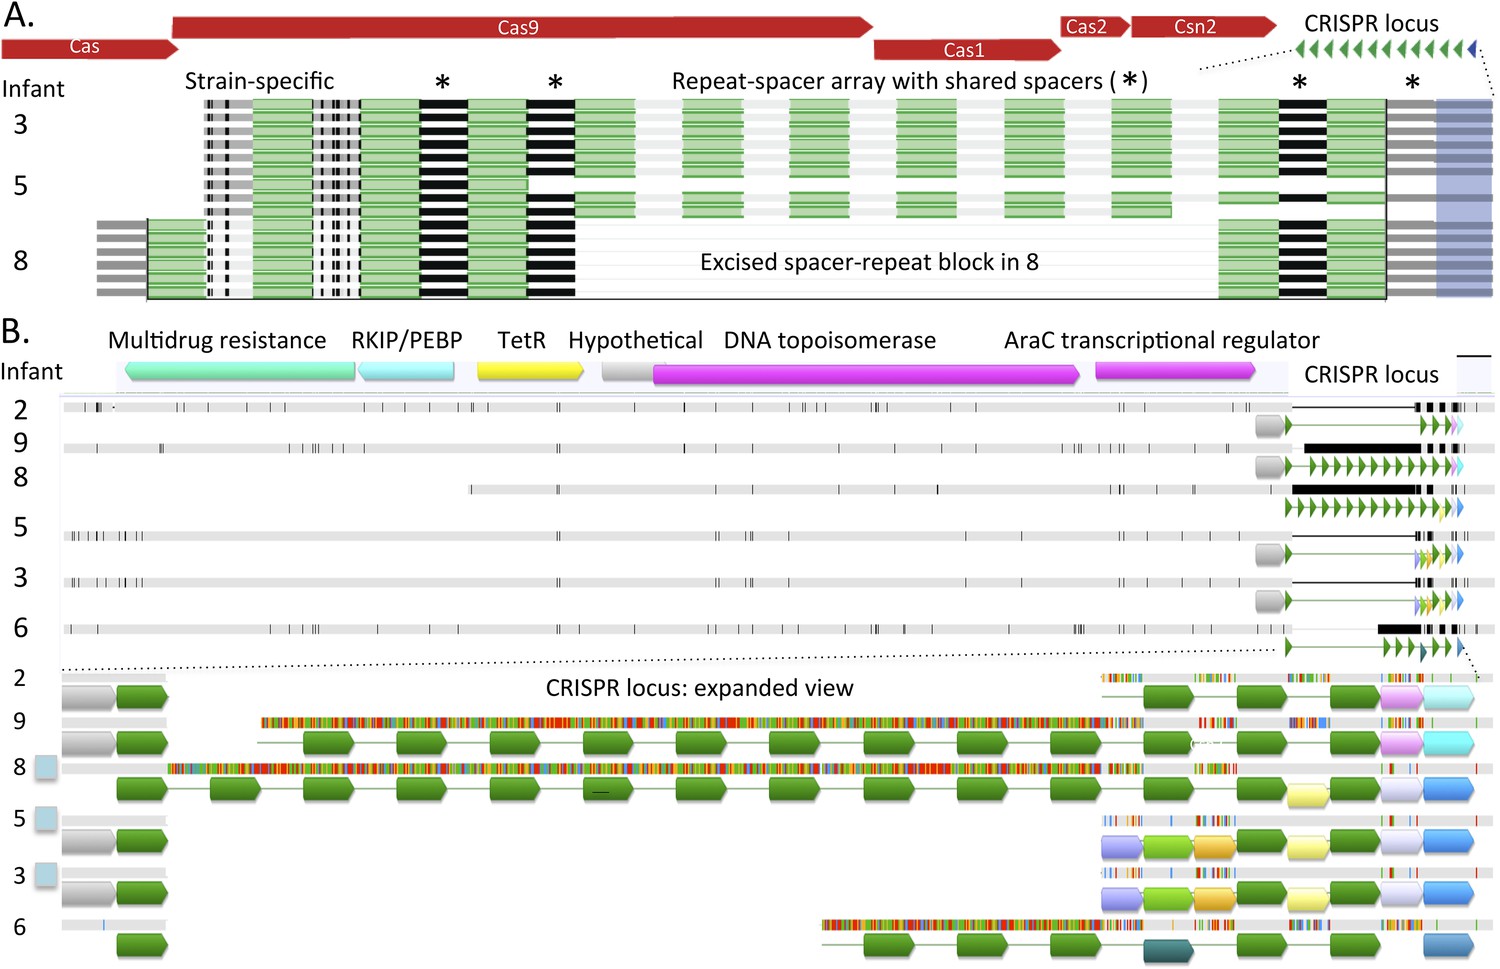
Comparison of CRISPR loci in Enterococcus faecalis genomes.
(A) The CRISPR-Cas loci in infants #3, #5 (early strain), and #8 and (B) the CRISPR locus lacking adjacent Cas proteins. The first defective repeats are shown in blue, other repeats are in green. The CRISPR loci are expanded below. In A, two versus three spacers have been added to the young end of the loci (left side, adjacent to Cas) in infants #3, #5 versus #8, respectively. In B, scaffolds encoding the loci are shown as horizontal gray bars (polymorphisms in the multi-sequence alignment are small vertical tic marks). The same color indicates shared sequences. Blue boxes to the left indicate that the genome encodes Cas proteins. Both loci (A and B) are identical in infants #3 and #5.
Figure 6 with 1 supplement
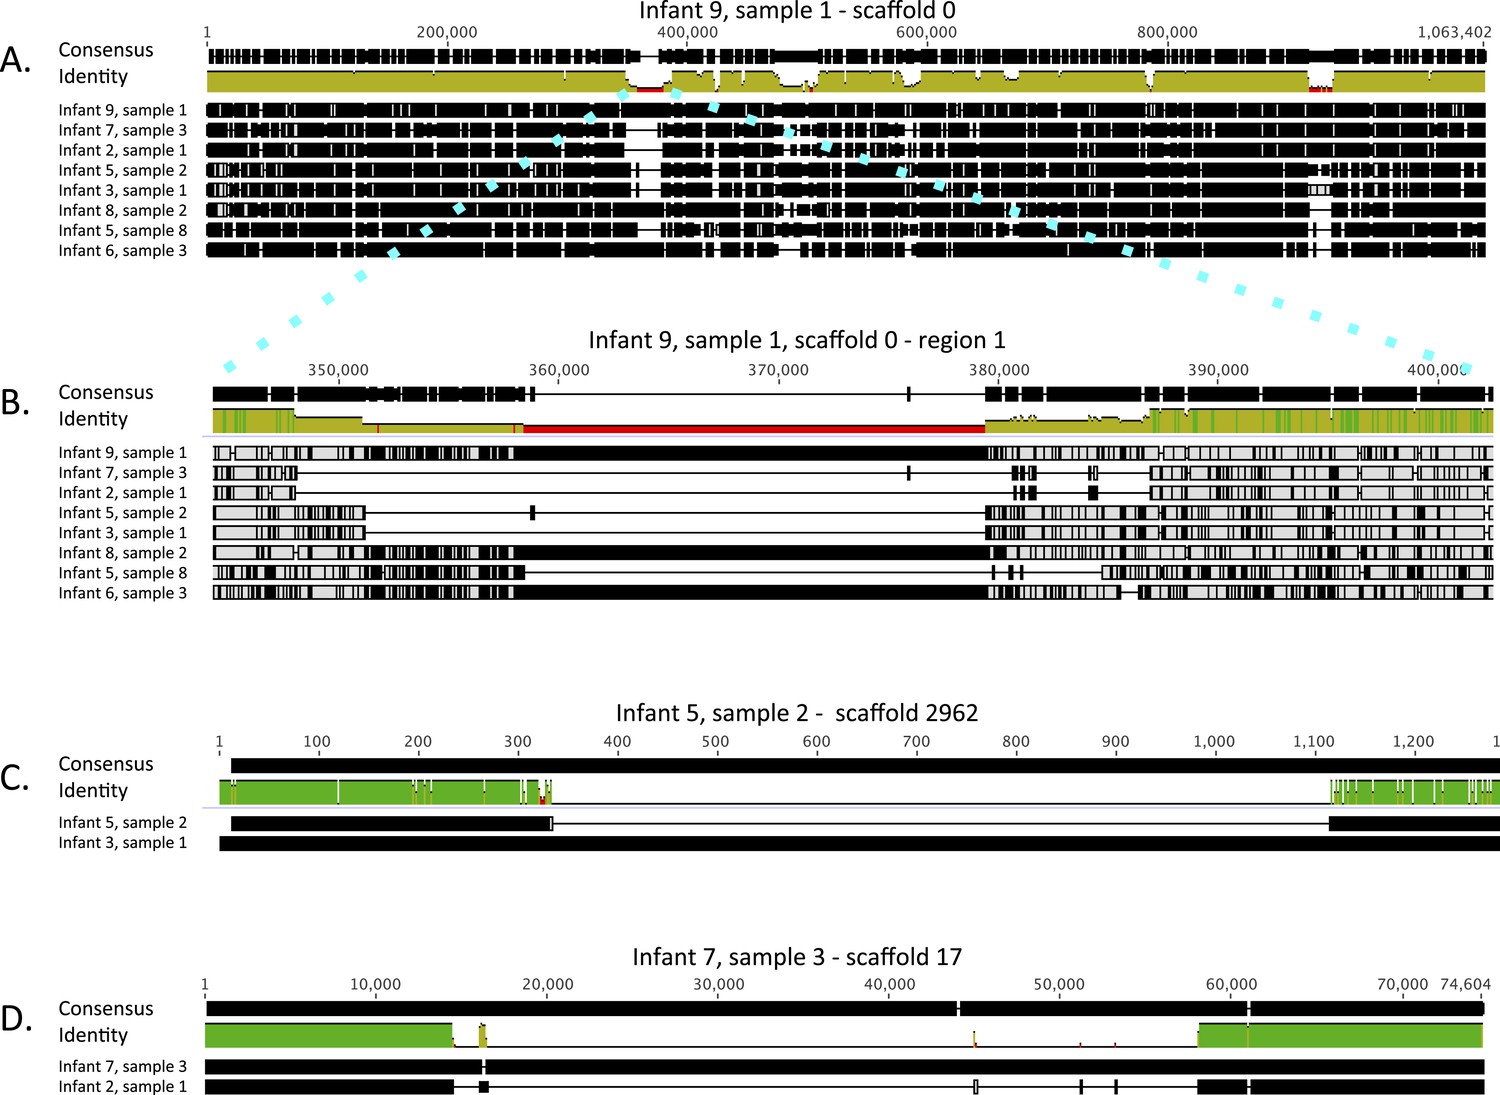
Alignment view of genome-wide differences in Enterococcus faecalis strains.
Consensus sequence for the alignments (shown at the top of each alignment) represents the calculated order of the most frequent nucleotide residues. Alignments were done in Geneious v7.1.7 (Kearse et al., 2012), using MAFFT v7.017 (Katoh et al., 2002) with default parameters. Samples are ordered by similarity. For each sample, SNPs and indel locations relative to the multiple alignment are marked by black lines or boxes. (A) Reads from eight samples, from which different Enterococcus faecalis strains were recovered, were mapped to a 1 Mbp E. faecalis scaffold (scaffold 0) recovered from infant #9, sample 1. Shown is a multiple alignment of the consensus sequences derived for each sample from these mappings. Multiple SNPs and short indels are detected throughout the sequence. Several larger indels are also detected. (B) Enlarged view of a region in A showing a large indel locus. This view distinguishes sets of extremely closely related strains (i.e. strains in infants #7 and #2; strains in infants #3 and #5 [early samples]) from more distant strains. (C) Pairwise alignment of consensus sequences derived from read mapping to an E. faecalis scaffold (scaffold 2962) recovered from infant #5, sample 2 distinguishes closely related strains in infants #3 and #5 (early samples). (D) Pairwise alignment of consensus sequences derived from read mapping to an E. faecalis scaffold (scaffold 17) recovered from infant #7, sample 3 distinguishes closely related strains in infants #2 and #7. The region missing in the assembly from the other infants corresponds to a mobile element.
Figure 6—figure supplement 1

Alignment view of genome-wide differences in Clostridium paraputrificum strains.
This organism is one of the very few for which a single strain (found for example in infant #5, sample 1 shown here) was detected in multiple infants. Consensus sequence for the alignments (shown at the top of each alignment) represents the calculated order of the most frequent nucleotide residues. Alignments were done in Geneious v7.1.7 (Kearse et al., 2012), using MAFFT v7.017 (Katoh et al., 2002) with default parameters. Samples are ordered by similarity. For each sample, SNPs and indel locations relative to the multiple alignment are marked by black lines or boxes. Reads from three samples, from which different Clostridium paraputrificum strains were recovered (infant #5 samples 1 and 7, infant #6 sample 3) were mapped to three 100–200 Kbp scaffolds (infant #5 sample 1, scaffolds 3 and 8, and infant #5 sample 7, scaffold 41). Shown is a multiple alignment of the consensus sequences derived for each sample from these mappings. The different strains are very closely related, yet multiple SNPs and short indels are detected throughout the sequence. Large indels shown in the bottom panels are both associated with mobile elements.
Figure 7

Stacked bar plot of community composition across samples and infants after organism identifications were collapsed to the phylum level to allow comparison to prior studies.
Red lines indicate necrotizing enterocolitis diagnoses.
Figure 8 with 3 supplements
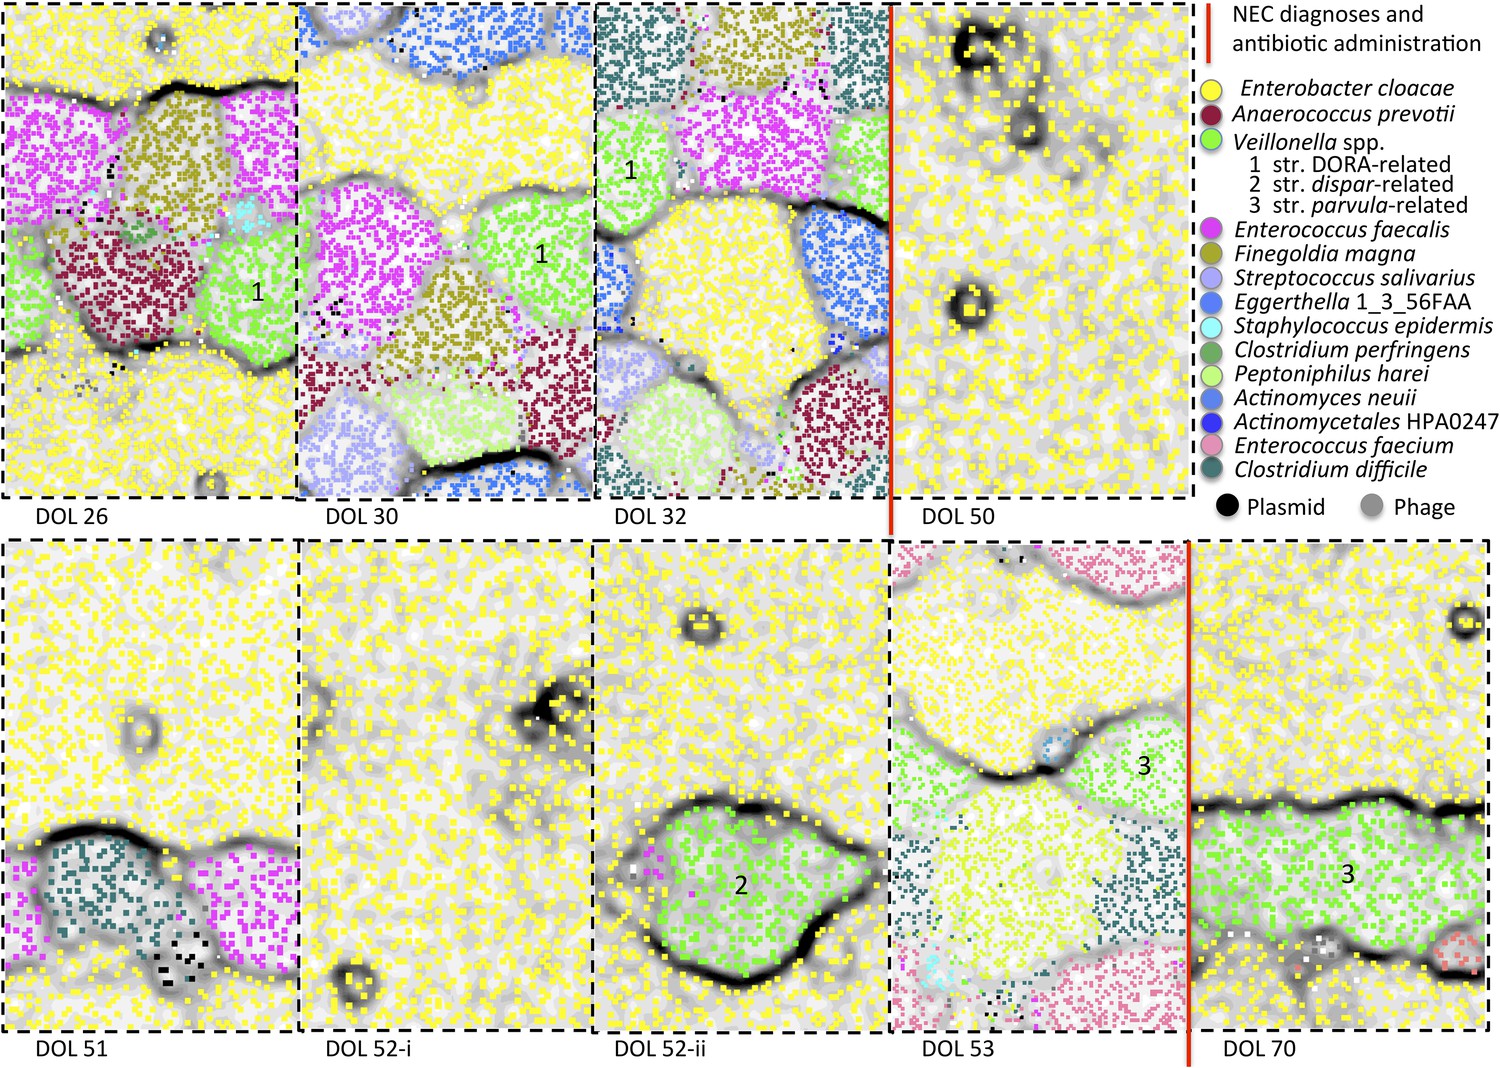
Microbial community composition, community complexity, and an overview of binning for samples from infant #2.
The diagrams are unit repeats of a tetranucleotide emergent self organizing map; points coded to reflect the bin assignment of the scaffold verify the binning (see ‘Materials and methods’ section). Vertical red lines separate samples before and after antibiotic administration to treat necrotizing enterocolitis (NEC) (two instances). Organisms are listed primarily in order of abundance in the first sample. Note that, with the exception of the dominant member, Enterobacter cloacae, species representation changed dramatically following antibiotic administration. The Veillonella strain varied (numbers differentiate areas that represent different populations).
Figure 8—figure supplement 1
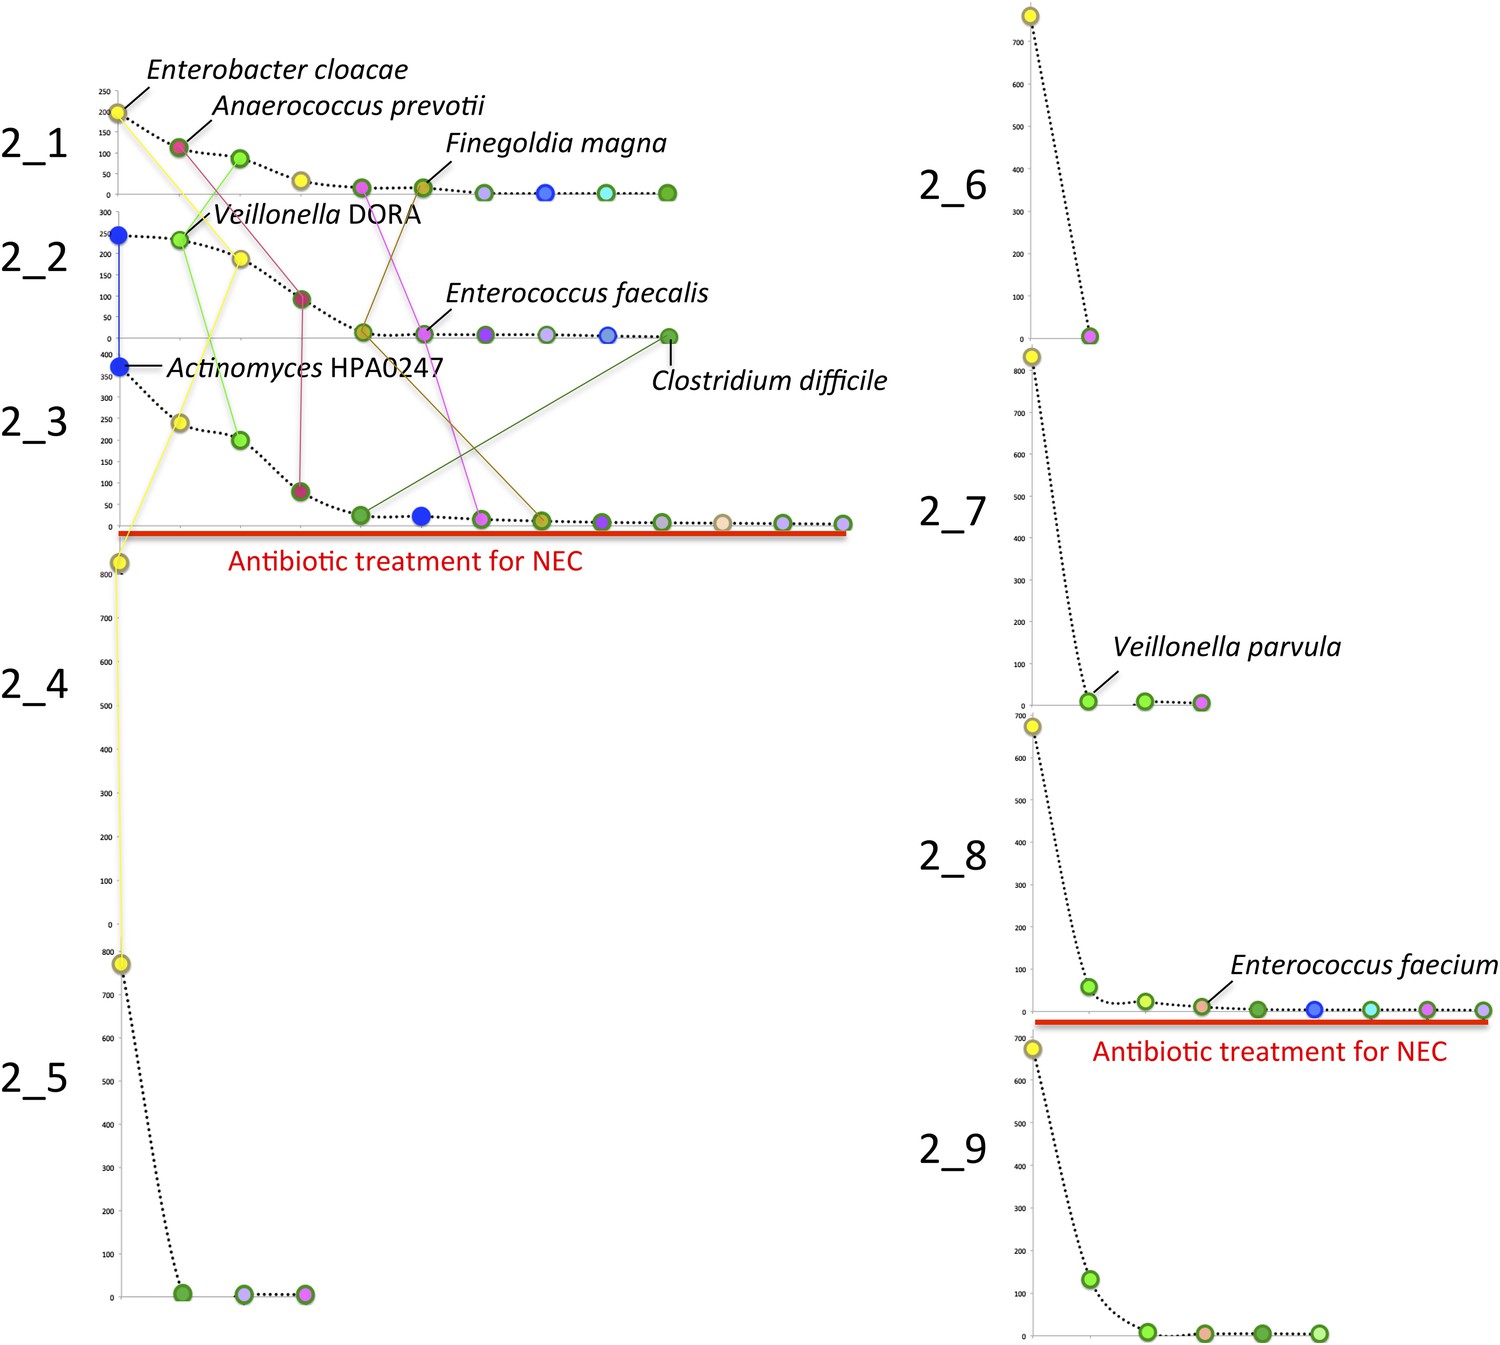
Rank abundance curves describing the microbial community (exclusive of phage and plasmids) in infant #2.
Colors correspond with those used in emergent self organizing maps (see Figure 8 and Supplementary file 3). Details are available in Supplementary file 3. NEC: necrotizing enterocolitis.
Figure 8—figure supplement 2

An overview of the microbial communities from infant #3.
The red line separates samples collected before and after antibiotic treatment for necrotizing enterocolitis. Shown are rank abundance curves for all samples and time series emergent self organizing maps for two samples, which were used to refine the binning (see ‘Materials and methods’ section). Note the prominence of Veillonella parvula, Enterococcus faecalis, and Citrobacter KTE32 in samples prior to diagnosis, and the loss of Veillonella and other less abundant species following antibiotic administration. E. faecalis and Citrobacter KTE32 strains persist through treatment, but the Staphylococcus epidermidis-related strains before (7) and after treatment (7′) are distinct. DOL: day of life.
Figure 8—figure supplement 3
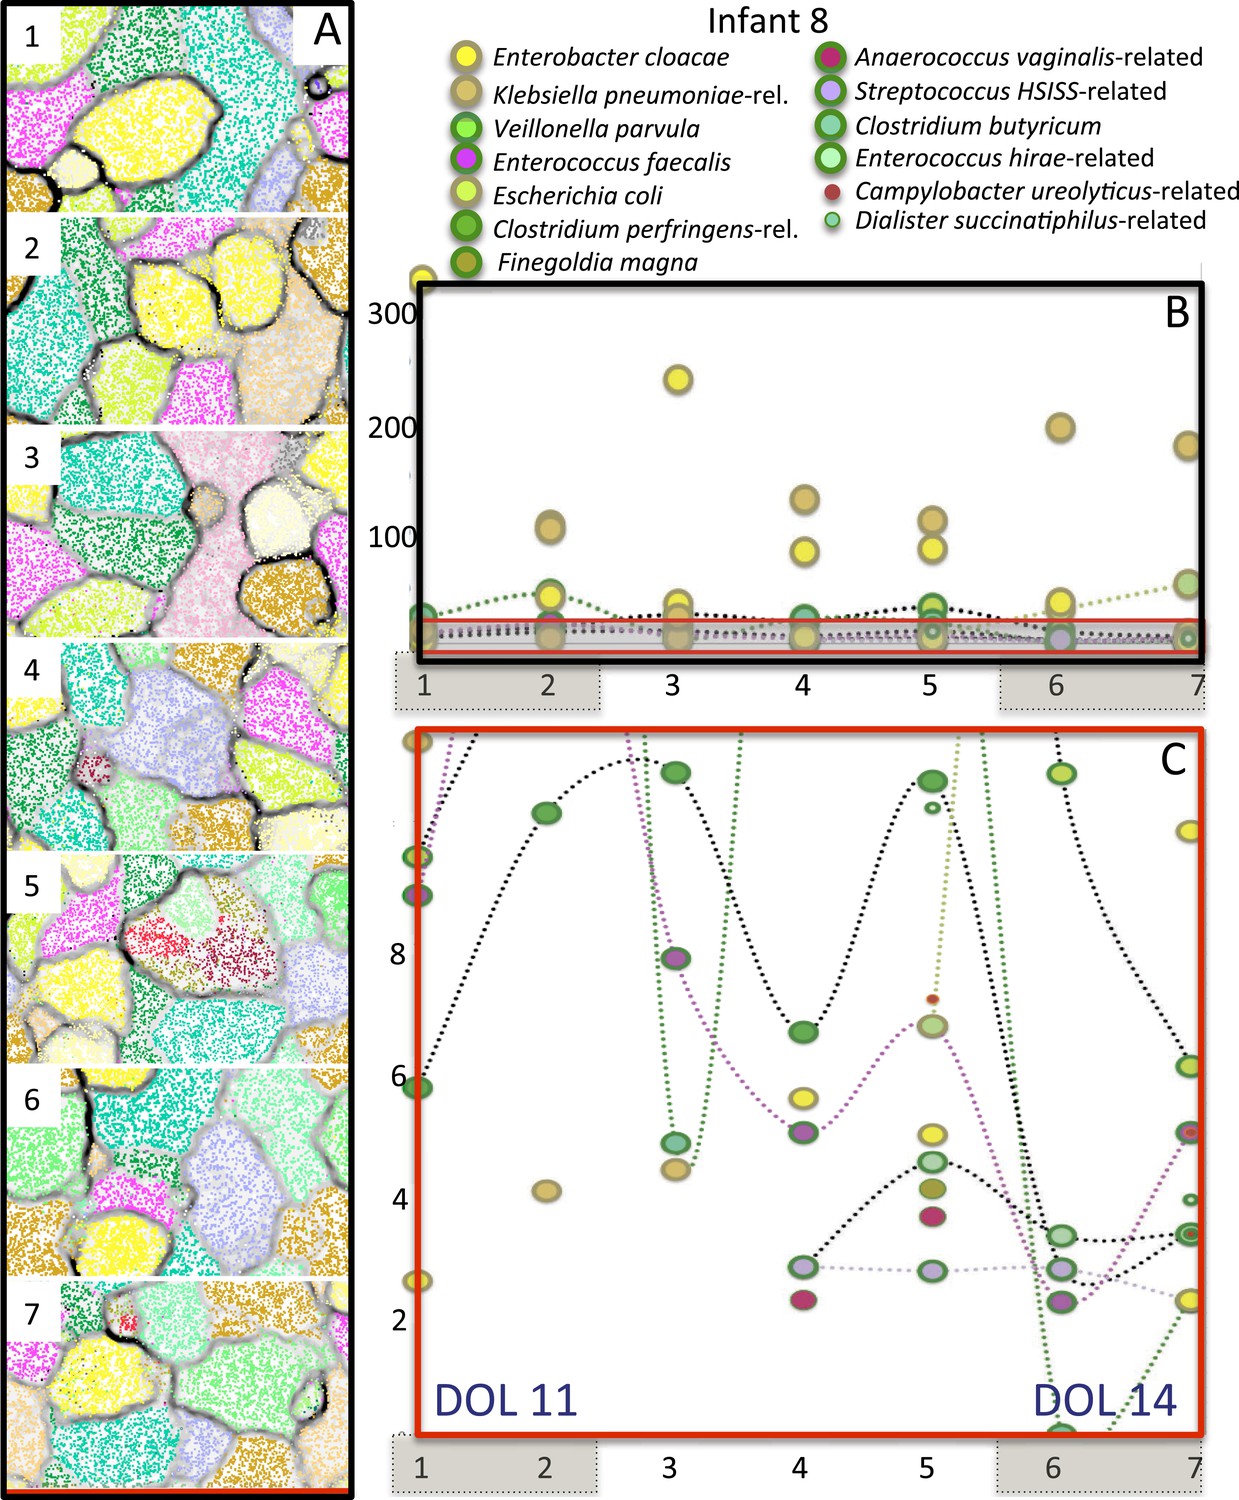
Overview community composition for infant #8, who developed necrotizing enterocolitis 1 day after collection of the last sample.
(A) Time series + GC content emergent self organizing maps (ESOMs) were used to fine-tune binning and provide an overview of community composition. Points in the ESOM are color coded to indicate genome bin, the name for which is given to the right. (B) Time series abundance patterns for the relatively well-sampled bacteria; brown shading over numbers indicates sample pairs collected on the same day. The communities were dominated by bacteria closely related to Enterobacter cloacae (yellow) and Klebsiella pneumoniae (brown). (C) Expanded view of the low abundance part of B. Several organisms were present at low abundance; some appeared a few days prior to the necrotizing enterocolitis diagnosis. Clostridium was detected but the genome sampling was so low that it was not included in the figure (see Supplementary file 3). DOL: day of life.
Figure 9

Statistical evaluation of the clustering of necrotizing enterocolitis cases during 2009–2014.
(A) The number of diagnosed necrotizing enterocolitis (NEC) cases meeting the stringent Vermont Oxford Network (VON) criteria over 67 months. Gray shading highlights the studied period. (B) Observed frequency of each value of monthly NEC cases in collected data (blue); expected frequency from a Poisson (red) and negative binomial (NB; green) distributions that were fit to the observed data using maximum likelihood parameter estimation (Poisson: λ = 1.90, NB: r = 5.81, p = 0.75).
Figure 10 with 1 supplement
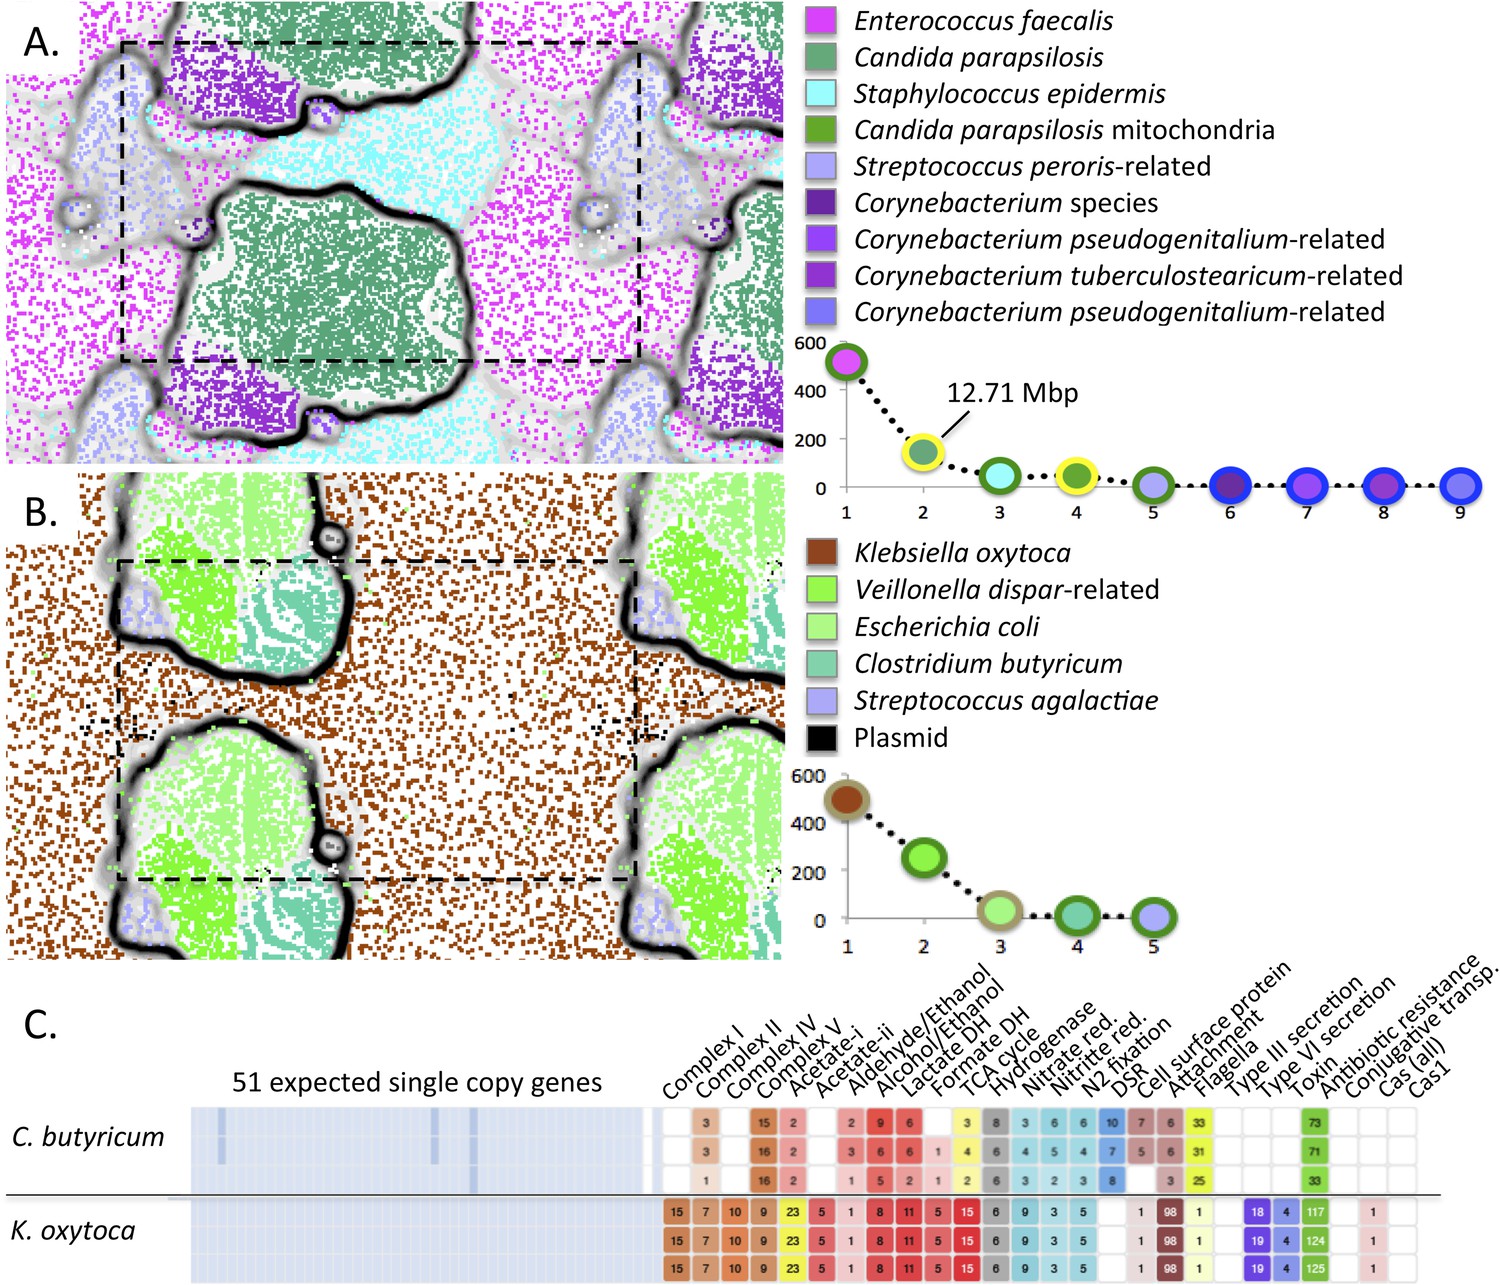
Medically important organisms were revealed by genome-resolved analyses.
The emergent self organizing maps illustrate bin accuracy (dashed boxes show the periodicity of the maps) and rank abundance curves (lower right) indicate community structure. (A) Candida parapsilosis was present in infant #9 after treatment for necrotizing enterocolitis. Due to the large genome size, Candida parapsilosis accounts for the majority of DNA in this sample. (B) Streptococcus agalactiae (also known as group B streptococcus, GBS) was detected, albeit at low abundance, in infant #1. It is likely that the GBS caused the septic episode. (C) Overview of the metabolic potential for two organisms showing very different inventories of type III, VI secretion system, toxin, and antibiotic resistance genes.
Figure 10—figure supplement 1
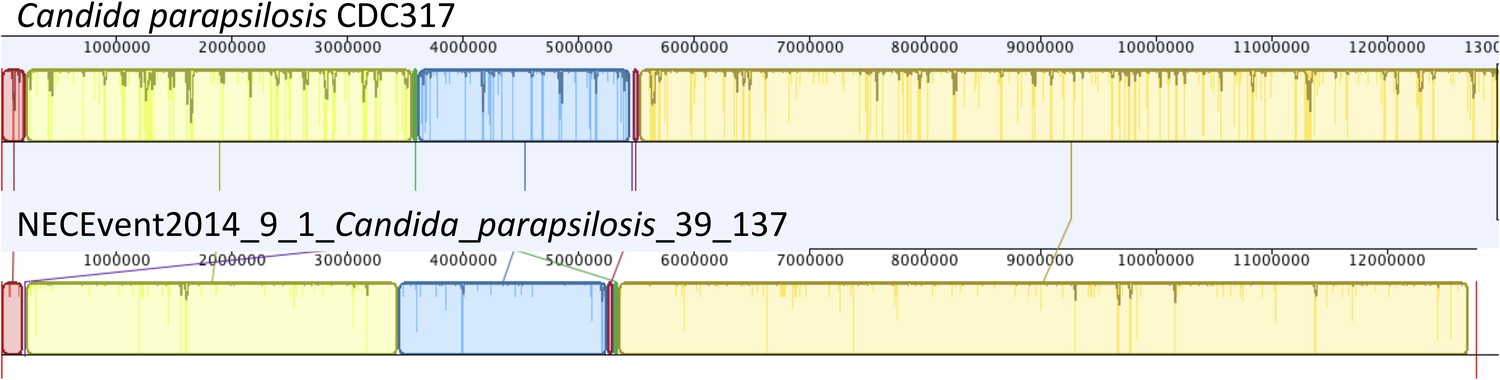
Mauve genome alignment (Darling et al., 2010) of the CDC317 Candida parapsilosis genome and the genome reconstructed in the current study from infant #9, sample 1 showing overall synteny and high sequence identity.
https://doi.org/10.7554/eLife.05477.019Additional files
-
Supplementary file 1
Clinical characteristics of infants in this study. Necrotizing enterocolitis (NEC) was defined as definite NEC (Bell's stage II or III). CS: caesarean section; V: vaginal delivery; BM: breast milk; combination indicates a combination of breast milk and infant formula.
- https://doi.org/10.7554/eLife.05477.020
-
Supplementary file 2
Overview of samples, the day of life on which each sample was collected, the original internal database sample number, the amount of data that was generated per sample after trimming to remove low quality bases, the amount of data that went into genome bins, percentage of all data that went into assemblies that ended up in bins, the amount of data that remained unbinned, the number of genome bins per sample, and the number of features (genes) per sample. Red lines indicate timing of necrotizing enterocolitis diagnosis. For two infants, samples were only available after diagnosis.
- https://doi.org/10.7554/eLife.05477.021
-
Supplementary file 3
Overview of the bins from each sample and each infant. UNK indicates a bin of unclassified sequences. Coloring of the bin names generally corresponds to colors used in emergent self organizing map and rank abundance curves in the figures. SCG is the number of single copy genes identified per bin out of 51 expected genes.
- https://doi.org/10.7554/eLife.05477.022
-
Supplementary file 4
Overview of predicted metabolic potential and genome completeness indicators for all moderately to well sampled genomes from all infants. Note that the single copy gene inventory underestimates genome completeness for Gammaproteobacteria when multiple species were present (see main text). Each line represents a genome bin. The bin name provides information about the sample of origin: the first digit is the infant number, the second is the sample number (e.g. 1_2 is the second sample from infant #1) and the organism type. Lists to the right profile the electron transport chain in which the presence of a terminal oxidase, in combination with a TCA cycle, indicate aerobic metabolism. Information about pathways involved in fermentation processes, nitrogen metabolism, the cell surface and secretion, motility, toxicity and pathogenicity, mobile elements, and CRISPR-based virus defense and antibiotic resistance is also shown. Note that Peptoclostridium difficile and Clostridium difficile are equivalent.
- https://doi.org/10.7554/eLife.05477.023
-
Supplementary file 5
Analysis of deeply sampled Enterococcus faecalis populations to detect sequencing reads with SNPs consistent with their derivation from populations present in other infants. Less deeply sampled populations typically had no SNPs consistent with derivation from a population present in another infant.
- https://doi.org/10.7554/eLife.05477.024
-
Supplementary file 6
In no case does Enterococcus faecalis have a spacer that can silence a phage present in the same community. Green text highlights cases where mutations likely prevent silencing.
- https://doi.org/10.7554/eLife.05477.025
Download links
A two-part list of links to download the article, or parts of the article, in various formats.
Downloads (link to download the article as PDF)
Open citations (links to open the citations from this article in various online reference manager services)
Cite this article (links to download the citations from this article in formats compatible with various reference manager tools)
Gut bacteria are rarely shared by co-hospitalized premature infants, regardless of necrotizing enterocolitis development
eLife 4:e05477.
https://doi.org/10.7554/eLife.05477


