Flowering time and seed dormancy control use external coincidence to generate life history strategy
- University of York, United Kingdom
- John Innes Centre, United Kingdom
Figures
Figure 1 with 1 supplement
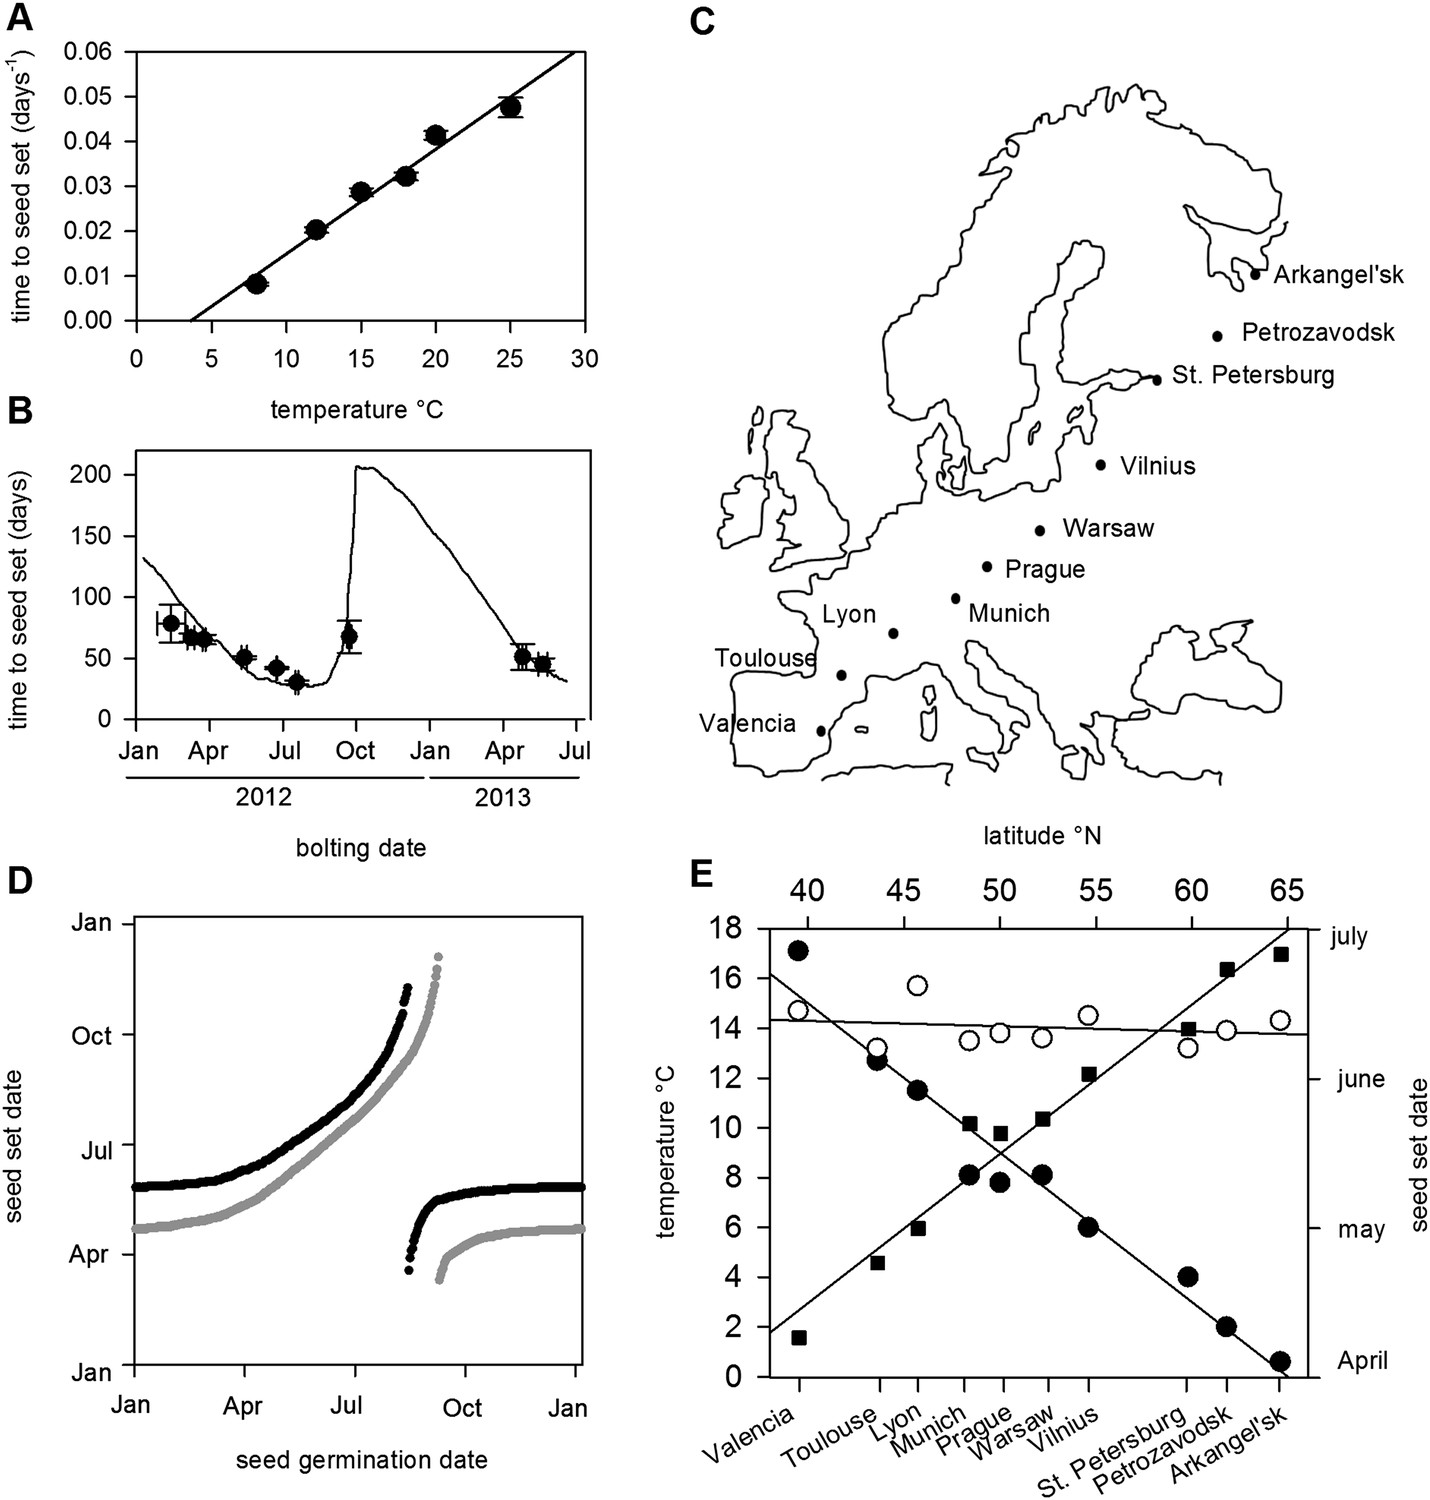
Flowering time and seed set control constrain mean temperature at seed shedding for winter and spring annuals.
(A) Laboratory experiments from bolting to first seed set at various constant temperatures used to constrain the seed set thermal time model. Data represent the mean and standard error of a minimum of five independent plants per treatment. (B) Field trial testing of the seed set model using nine growings of a minimum of five plants showing mean and standard error of bolting date and time to seed set. Closed circles show data while model prediction is shown by the continuous line. (C) Map of Central Europe showing the sites for which temperature data was gathered to simulate Col-0 behaviour. (D) Simulation of flowering time (grey) using the model from (Wilczek and et al., 2009) and first seed set model (black) using temperature data from Gorsow, Poland. Flowering and first seed set date (y-axis) can be determined for each possible germination date (x-axis). Note that seed set dates are similar for germination between September and April. (E) Predicted first seed set date (closed squares), predicted mean temperature at first seed set (open circles), and mean annual temperature (closed circles) for October/November germination dates at each site. Seed set is shown to be clustered around a mean daily temperature of 14.5°C.
Figure 1—figure supplement 1
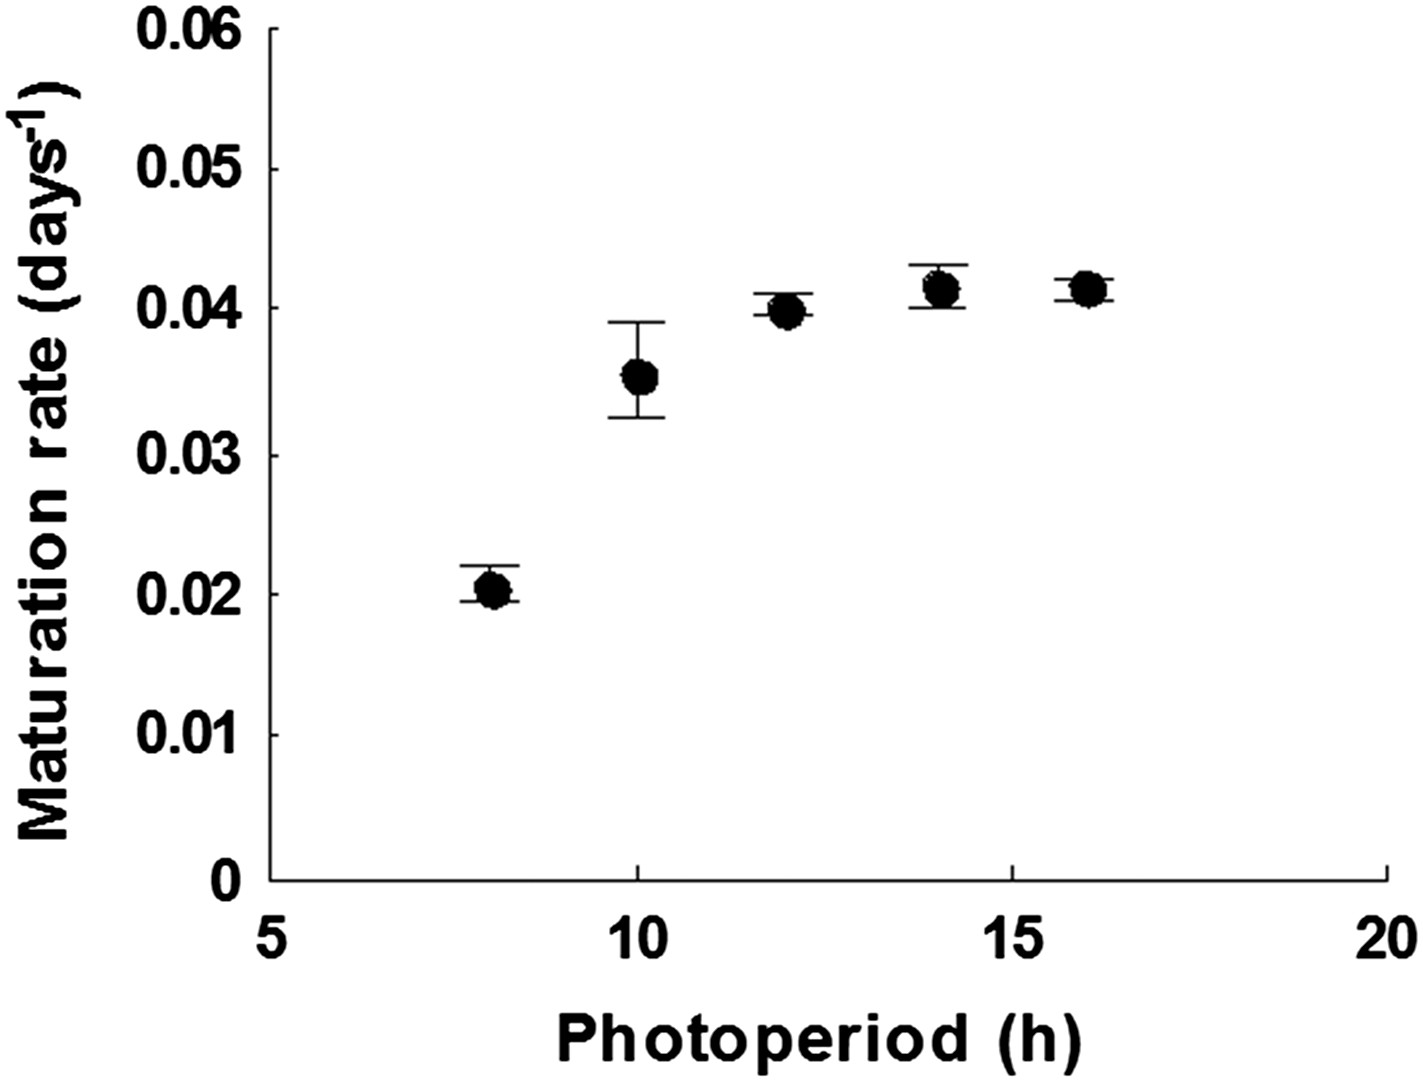
The growth rate of Arabidopsis Col-0 plant between first flowering and first seed set at photoperiods between 8 and 16 hr daylength at 22°C.
Data represent mean and standard error of five plants per treatment.
Figure 2 with 4 supplements
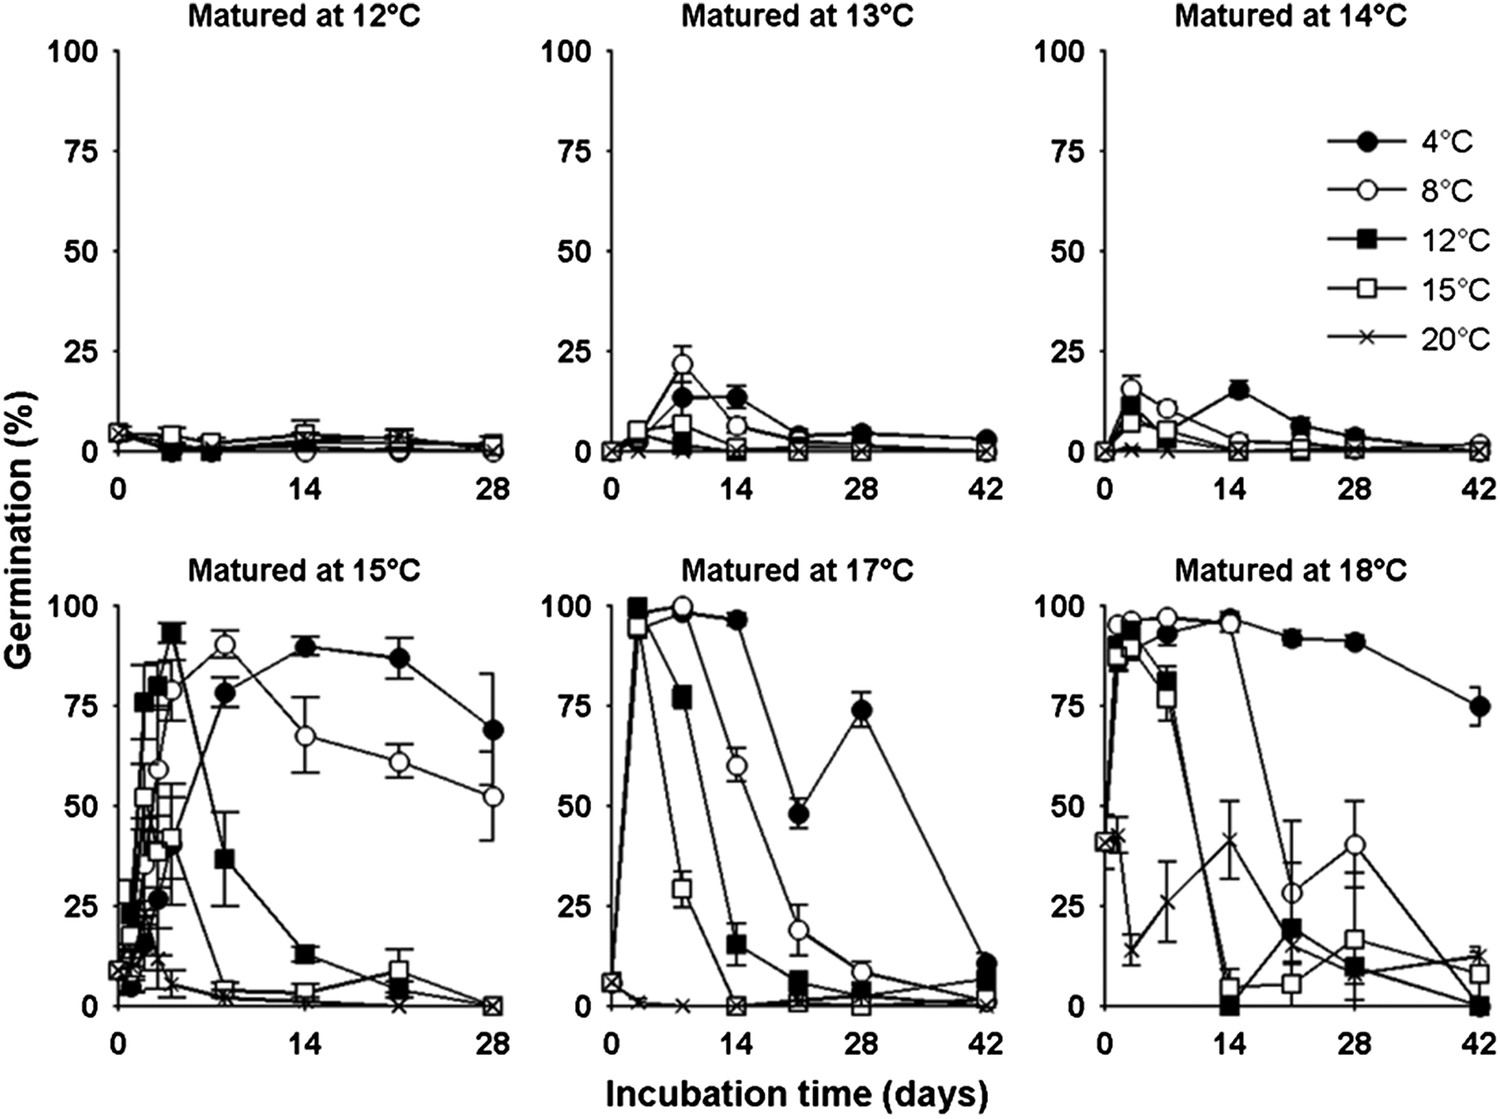
The germination physiology of Arabidopsis Col-0 in response to temperature during seed set and imbibition.
Germination of seed matured between 12°C and 18°C incubated in the dark between 4°C and 20°C (see legend) and placed to germinate in the light at 22°C after the indicated time periods. Data points represent mean and standard error of five seed batches.
Figure 2—figure supplement 1
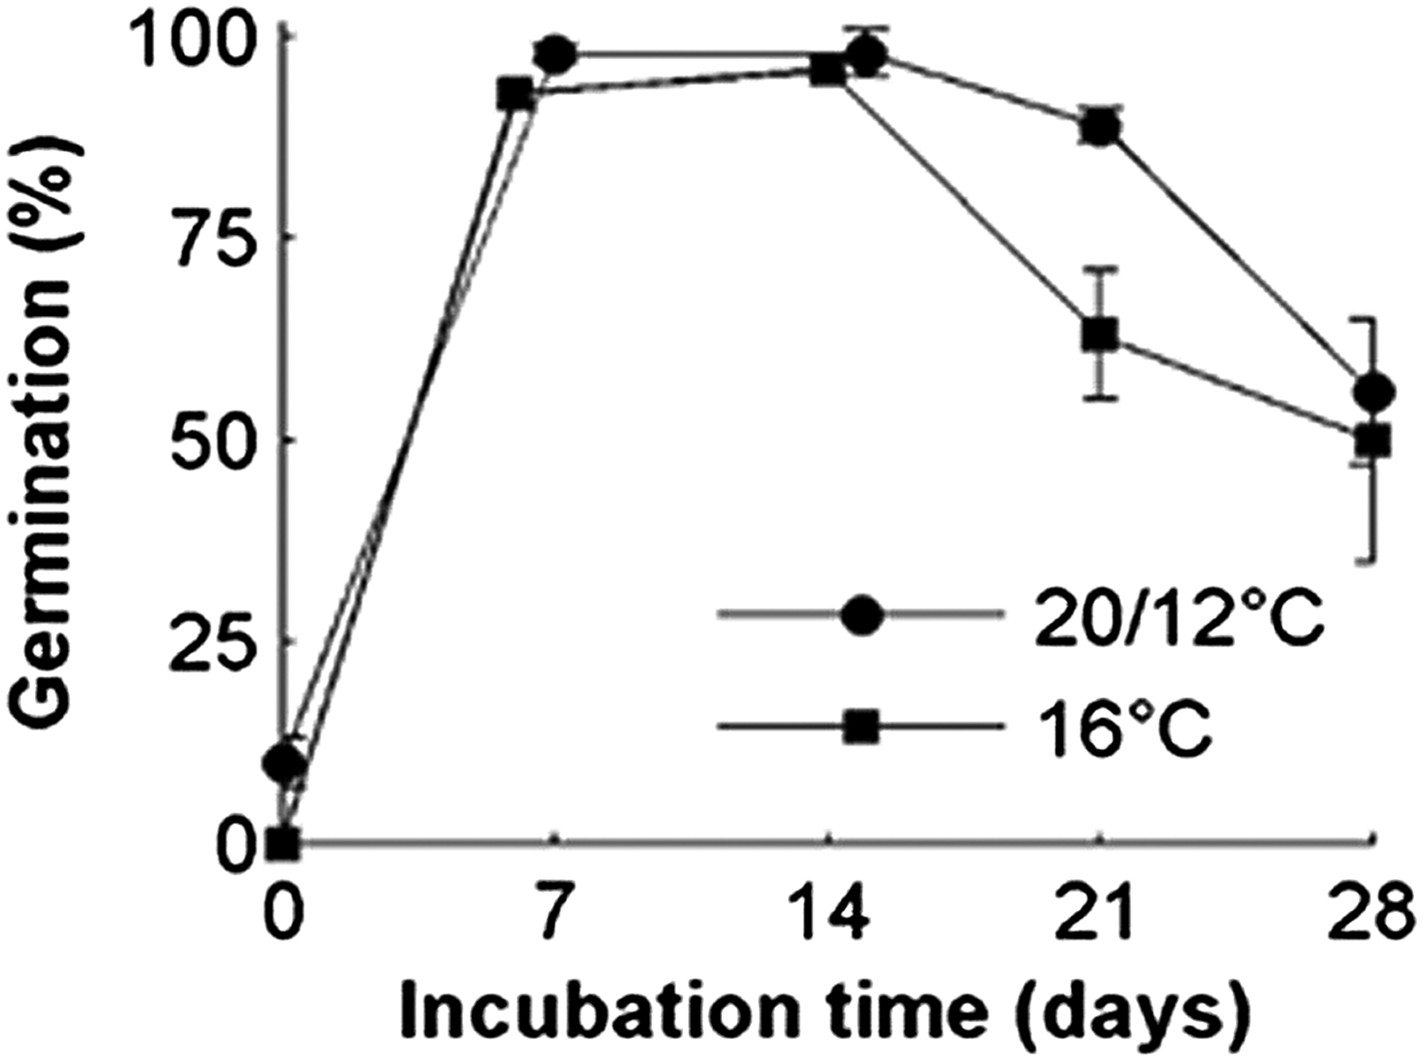
Comparison of the relative effects of constant 16°C vs a 24-hr temperature cycle with a mean of 16°C on Col-0 seed dormancy.
Dormancy levels of seed lots were revealed by cold stratification in the dark at 4°C (incubation time) followed by germination at 22°C in white light. Data points represent the mean and standard error of five biological replicate seed batches.
Figure 2—figure supplement 2

Global fit of the seed germination model output (red) with the time-series training data (blue) for all seed maturation temperatures (Tm) and imbibition temperatures (Ti).
Predicted decline in primary dormancy (green) and increase in secondary dormancy (black) are shown alongside germination data and model fit. The key feature of the model is that secondary dormancy varies with TI, but not with TM, and that primary dormancy varies with TM, but not with TI.
Figure 2—figure supplement 3
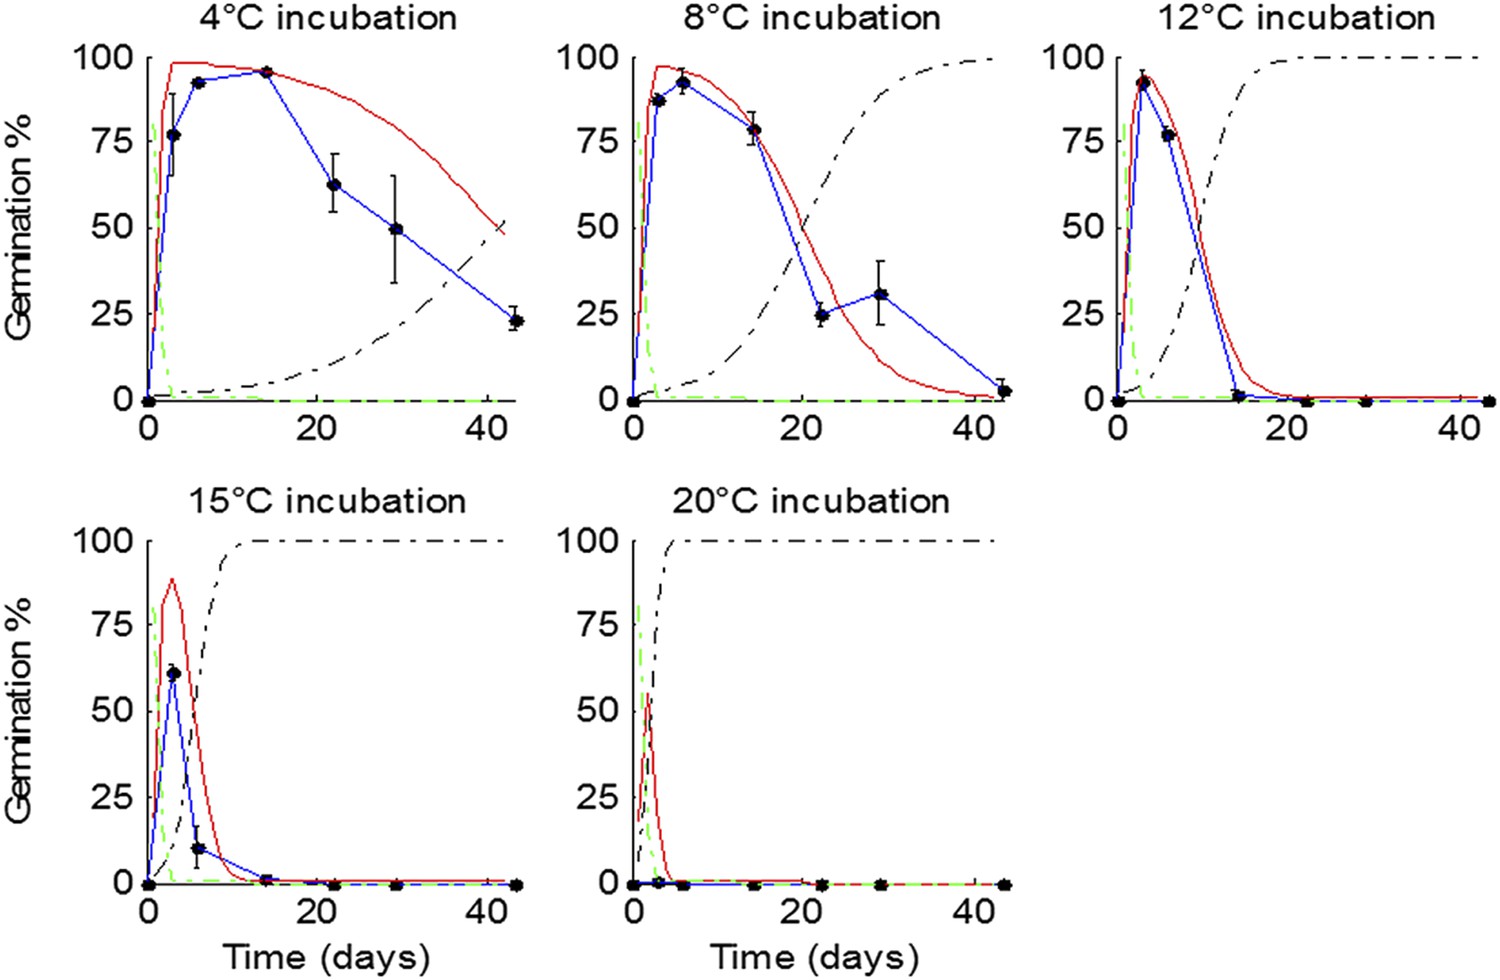
Fit of model to lab-generated data not used to train the model.
Data were collected using seed matured at 16°C and incubated at five indicated temperatures. Data represent the mean and standard error of five independent seed batches per test. Model predicted germination is shown in red, predicted primary dormancy in green, and predicted secondary dormancy in black.
Figure 2—figure supplement 4
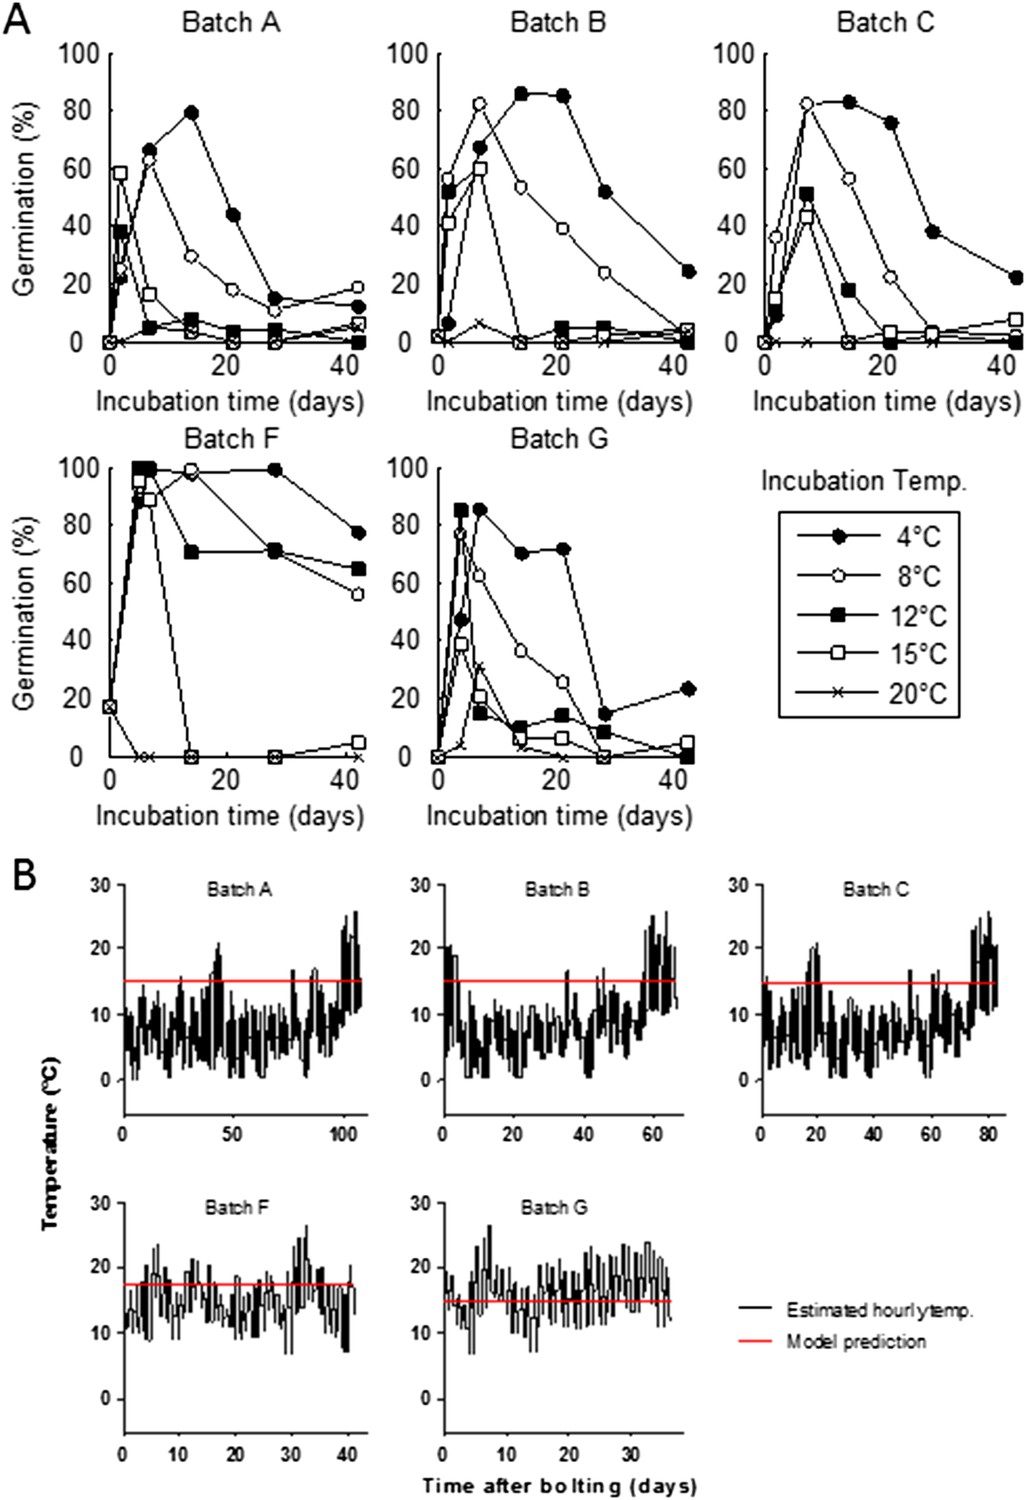
Germination kinetics of field-collected seed batches from 2012 and model prediction of temperature during seed maturation.
A) Seed from five independent growings was sown in the lab and dormancy was assayed as described previously for lab-grown seed at five incubation temperatures. Data represent the mean of at least five independent seed lots per growing. (B) The temperature history of five field-set seed lots (black), and the predicted mean seed maturation (red) temperature (red) by the seed germination model.
Figure 3 with 1 supplement
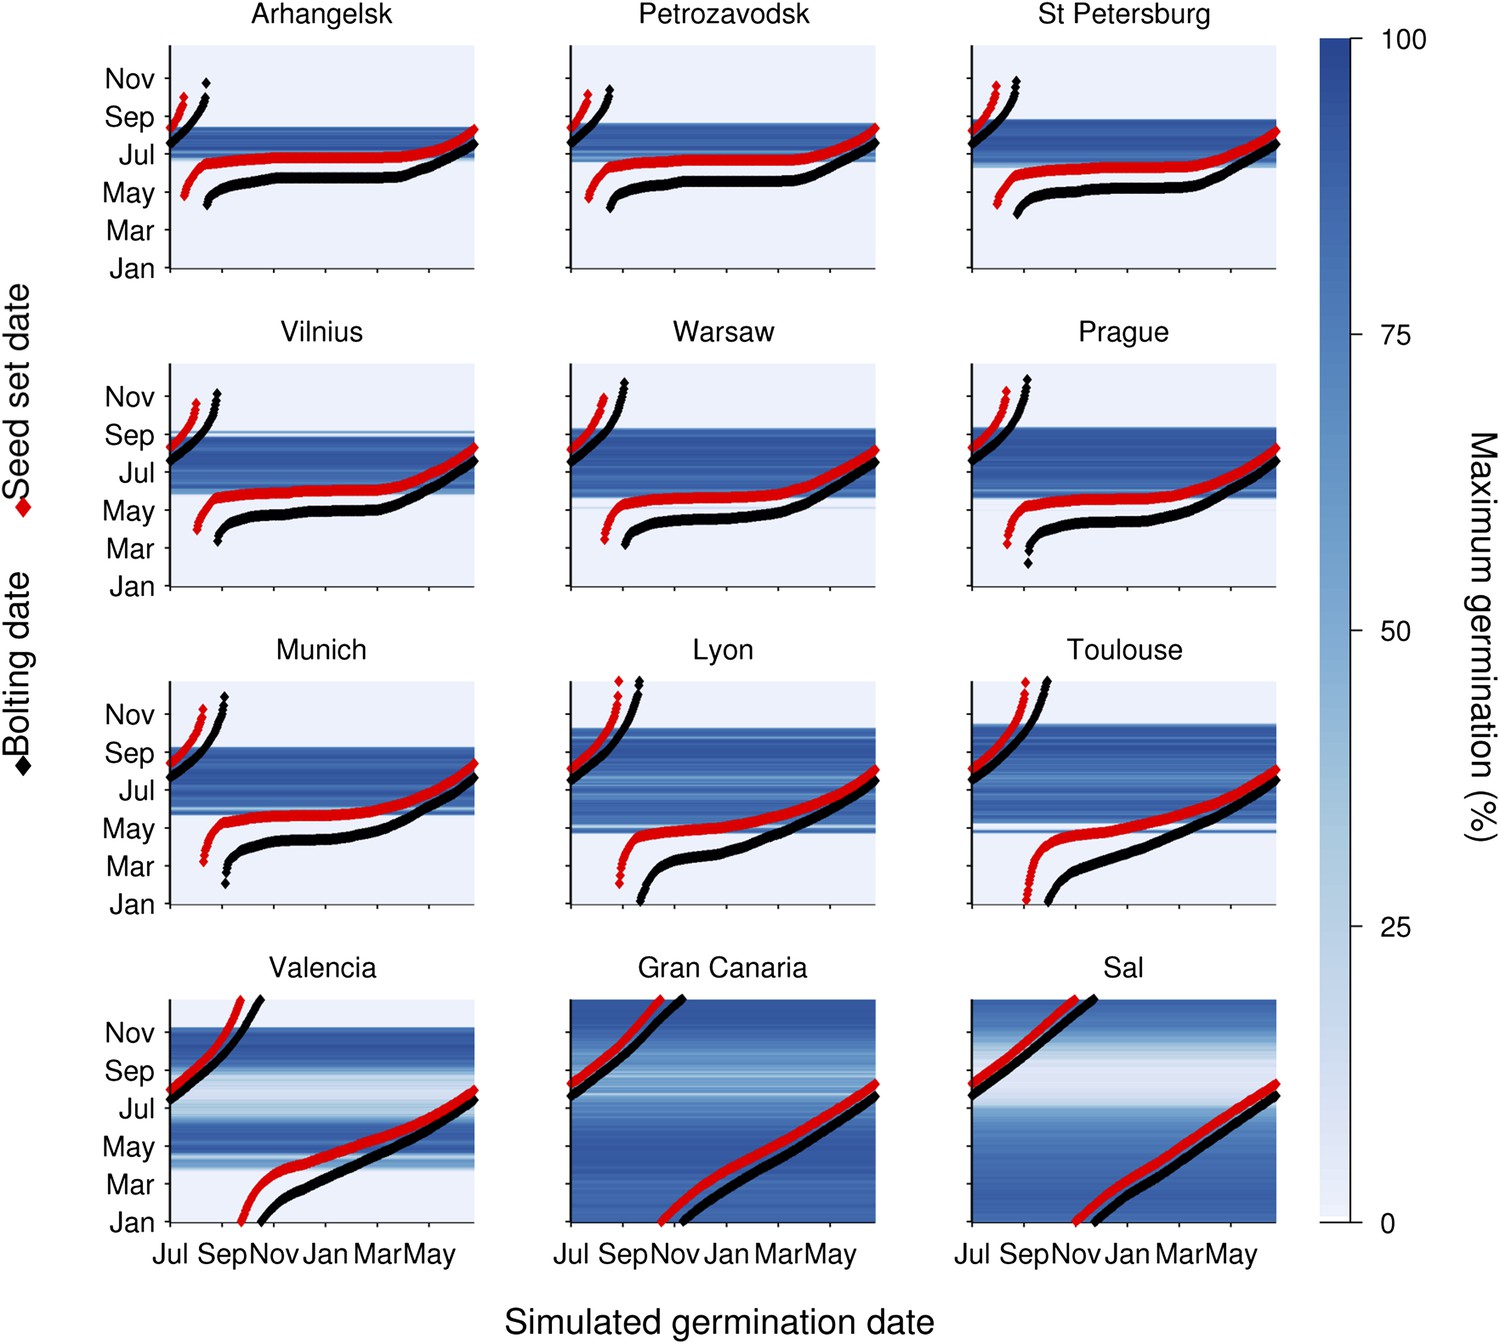
Simulation of the interaction of Col-0 life history stages at sub-arctic to sub-tropical sites.
Germination dates are given on the x-axis. On the y-axis flowering time (red line) and first seed set (black line) are shown alongside the simulated progeny germination frequency (blue-hued heat map) based on the mean temperature over 1 week before shedding (seed maturation temperature) and temperature after shedding (imbibition temperature). Behaviour of winter annuals can be observed using September–November germination dates, and ability to complete a summer rapid cycle can be ascertained by progression to seed set in the same year for summer germination dates. The model is simulated for European locations on the transect introduced in Figure 1, and for the more sub-tropical locations of the Canary Islands and Cape Verde (Sal), both locations at which Arabidopsis thaliana populations have been described.
Figure 3—figure supplement 1
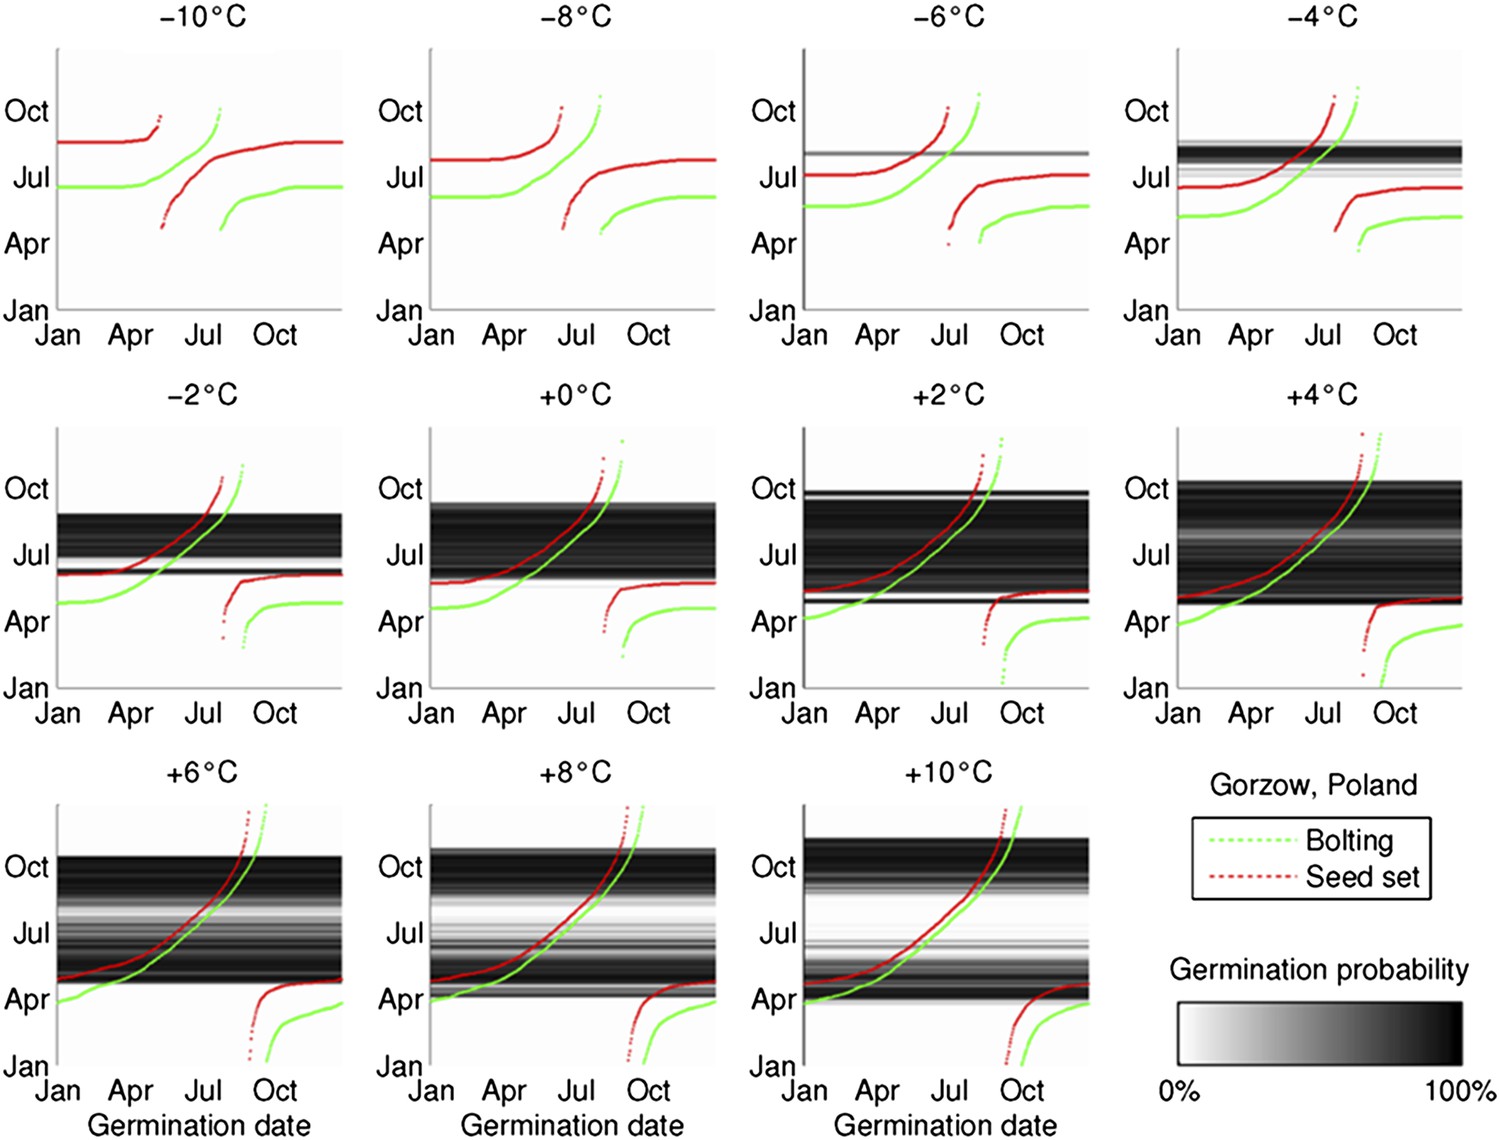
The coincidence between seed set timing and the dormancy state transition is preserved during artificial warming and cooling simulations, based on 2°C increments from the mean temperature series in Gorsow, Poland.
Predicted germination is shown in the greyscale heat-map, bolting and first seed set timing in green and red, respectively.
Figure 4
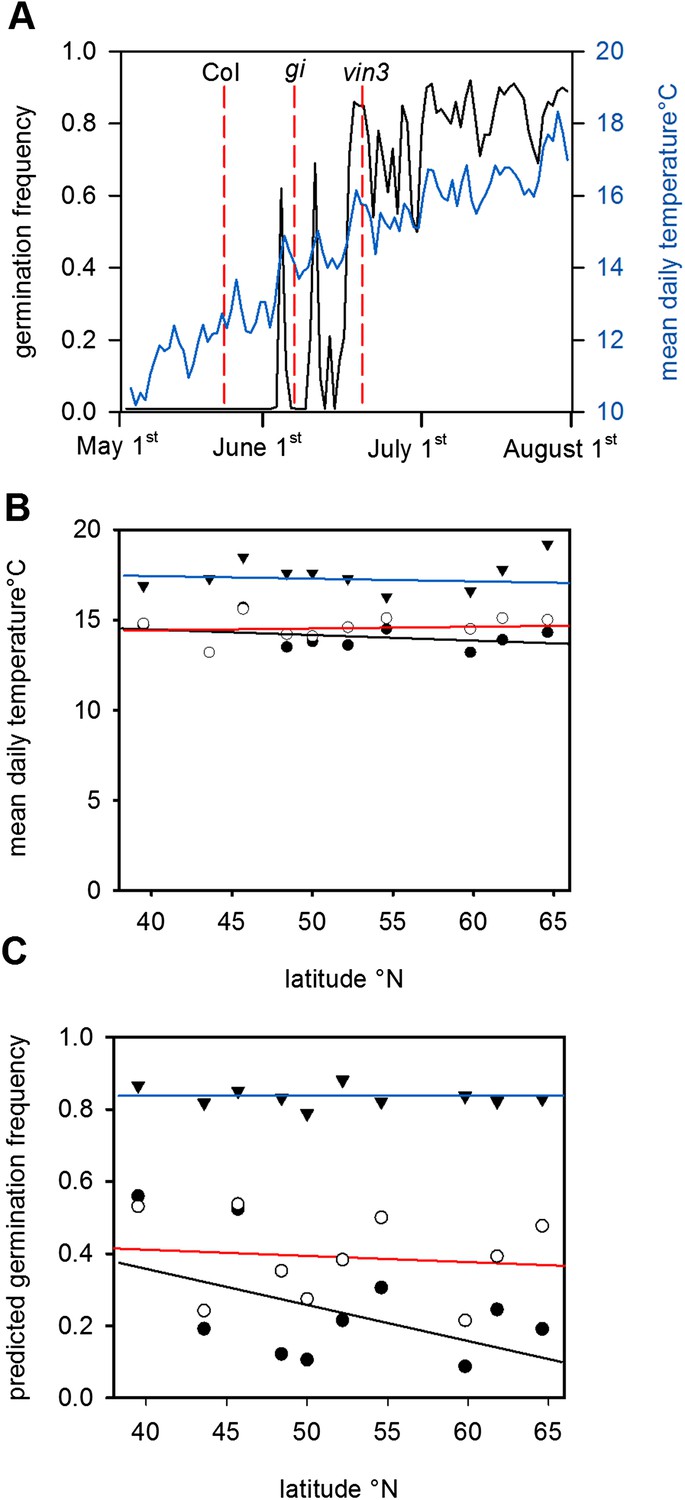
The predicted effect of genetic variation in flowering time on seed set temperature and progeny behaviour.
(A) Time to bolting for the gi-201 and vin3-1 mutants lines was calculated using previously published parameter sets (7) for Gorsow, Poland and overlayed on ten year average mean temperature (blue) and model-predicted germination (black), assuming that both GI and VIN3 affect germination only indirectly via flowering time. (B) Predicted mean daily temperature at first seed set for winter annual Col-0 (closed circles), gi (open circles), and vin3 (closed triangles) across the European climate transect (Figure 1D), using the flowering time and seed set models. Note that sensitivity of life history parameters to GI increases with increasing latitude with wider variation in annual photoperiod. (C) Assuming germination is spread evenly over 1 month after first seed set, predicated germination of the whole progeny of Col-0, gi and vin3-1 winter annual seeds across the transect. Later flowering has the potential to lead to large changes in the number of low-dormant seeds due to the extreme sensitivity of seed set to temperature in this range (Figure 2).
Figure 5
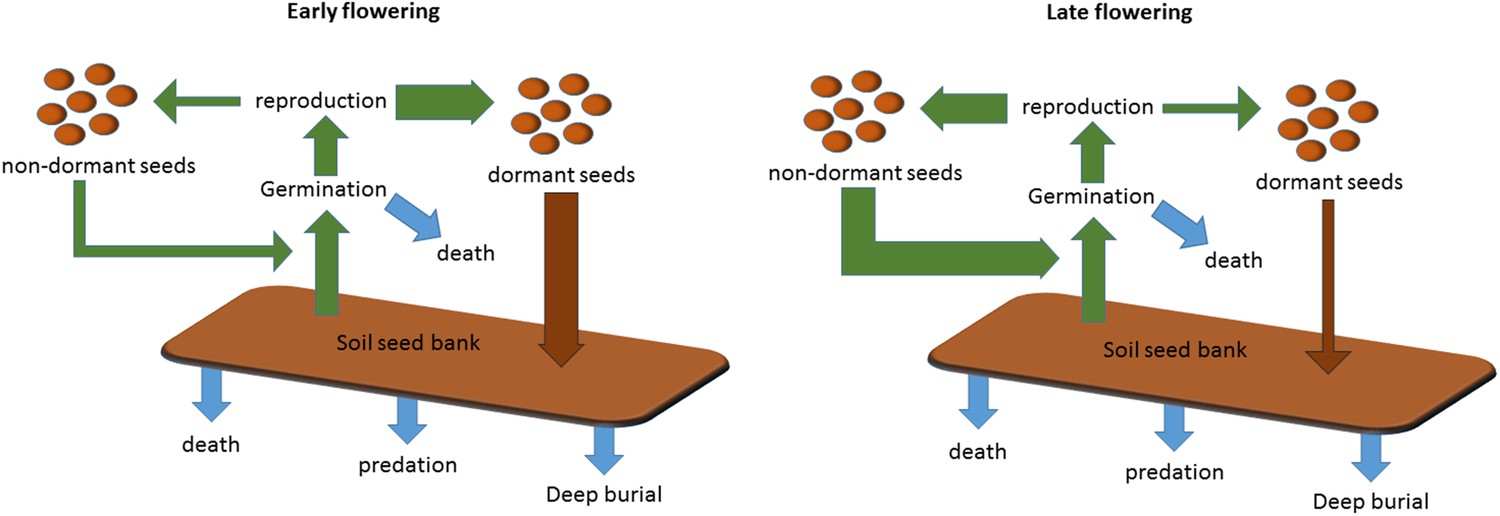
Scheme to show the role of winter annual flowering time control in soil seed bank formation.
Seed bank persistence requires that seed entry rate (production of dormant seeds) exceeds exit rate, the sum of germination, death or deep burial. Width or arrows indicates relative flux variation with flowering time. Early flowering plants produce larger proportions of dormant seeds, increasing seed bank size. Later flowering plants produce fewer dormant seeds but more rapid cyclers, potentially producing more seeds from the next generation.
Figure 6
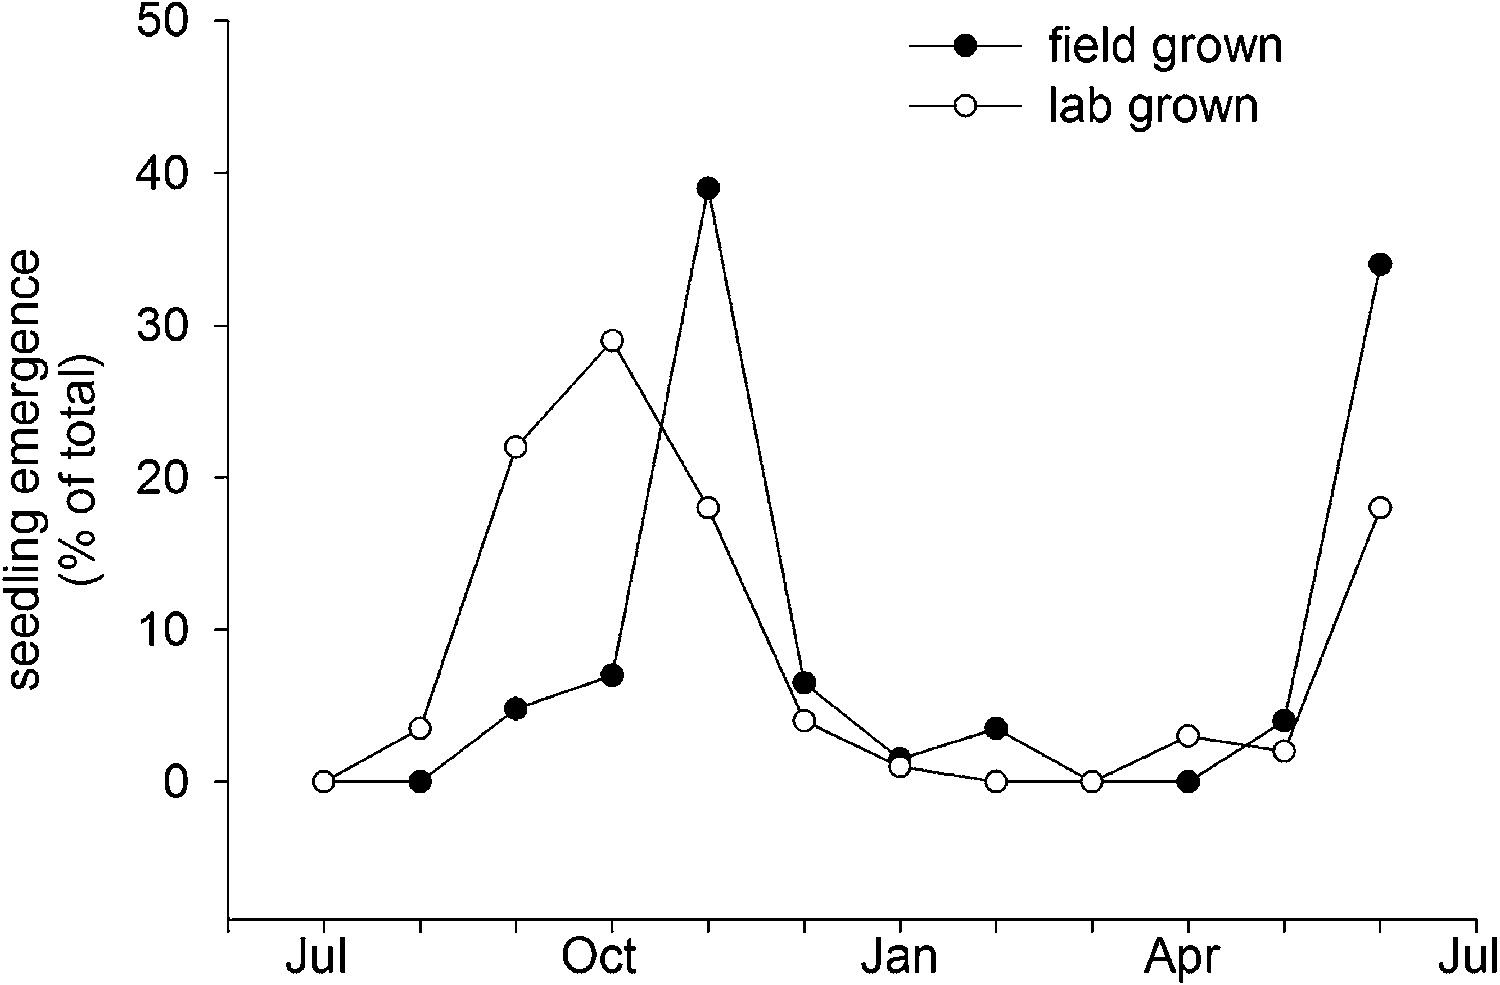
Field emergence time in 2013/14 of Col-0 seed set in the laboratory at 15°C or set in the field in York in spring 2013.
Data represent the total percentage emergence at 2 weekly intervals of 500 seeds sown for each experiment.
Tables
Table 1
Comparisons of R2 and parameter number of the nine germination models tested with linear, exponential or logistic relationship between Rp and Rs with temperature
| Rp model | Rs model | Number of parameters | Total R² |
|---|---|---|---|
| Exponential | Exponential | 4 | 0.71 |
| Exponential | Logistic | 5 | 0.62 |
| Exponential | Linear | 4 | 0.64 |
| Logistic | Exponential | 5 | 0.83 |
| Logistic | Logistic | 6 | 0.82 |
| Logistic | Linear | 5 | 0.75 |
| Linear | Exponential | 4 | 0.83 |
| Linear | Logistic | 5 | 0.81 |
| Linear | Linear | 4 | 0.73 |
Table 2
Optimised final parameter values for the germination and seed set models
| Parameter | Value |
|---|---|
| Germination model | |
| A | 1.56 |
| B | −21.79 |
| C | 0.05 |
| D | 0.18 |
| Seed set model | |
| Tb (base temperature) | 5.25 |
| Threshold | 5370 |
Download links
A two-part list of links to download the article, or parts of the article, in various formats.
Downloads (link to download the article as PDF)
Open citations (links to open the citations from this article in various online reference manager services)
Cite this article (links to download the citations from this article in formats compatible with various reference manager tools)
Flowering time and seed dormancy control use external coincidence to generate life history strategy
eLife 4:e05557.
https://doi.org/10.7554/eLife.05557


