Effectiveness of traveller screening for emerging pathogens is shaped by epidemiology and natural history of infection
- University of California, Los Angeles, United States
- London School of Tropical Hygiene and Medicine, United Kingdom
- Fogarty International Center, National Institutes of Health, United States
Figures
Figure 1 with 1 supplement
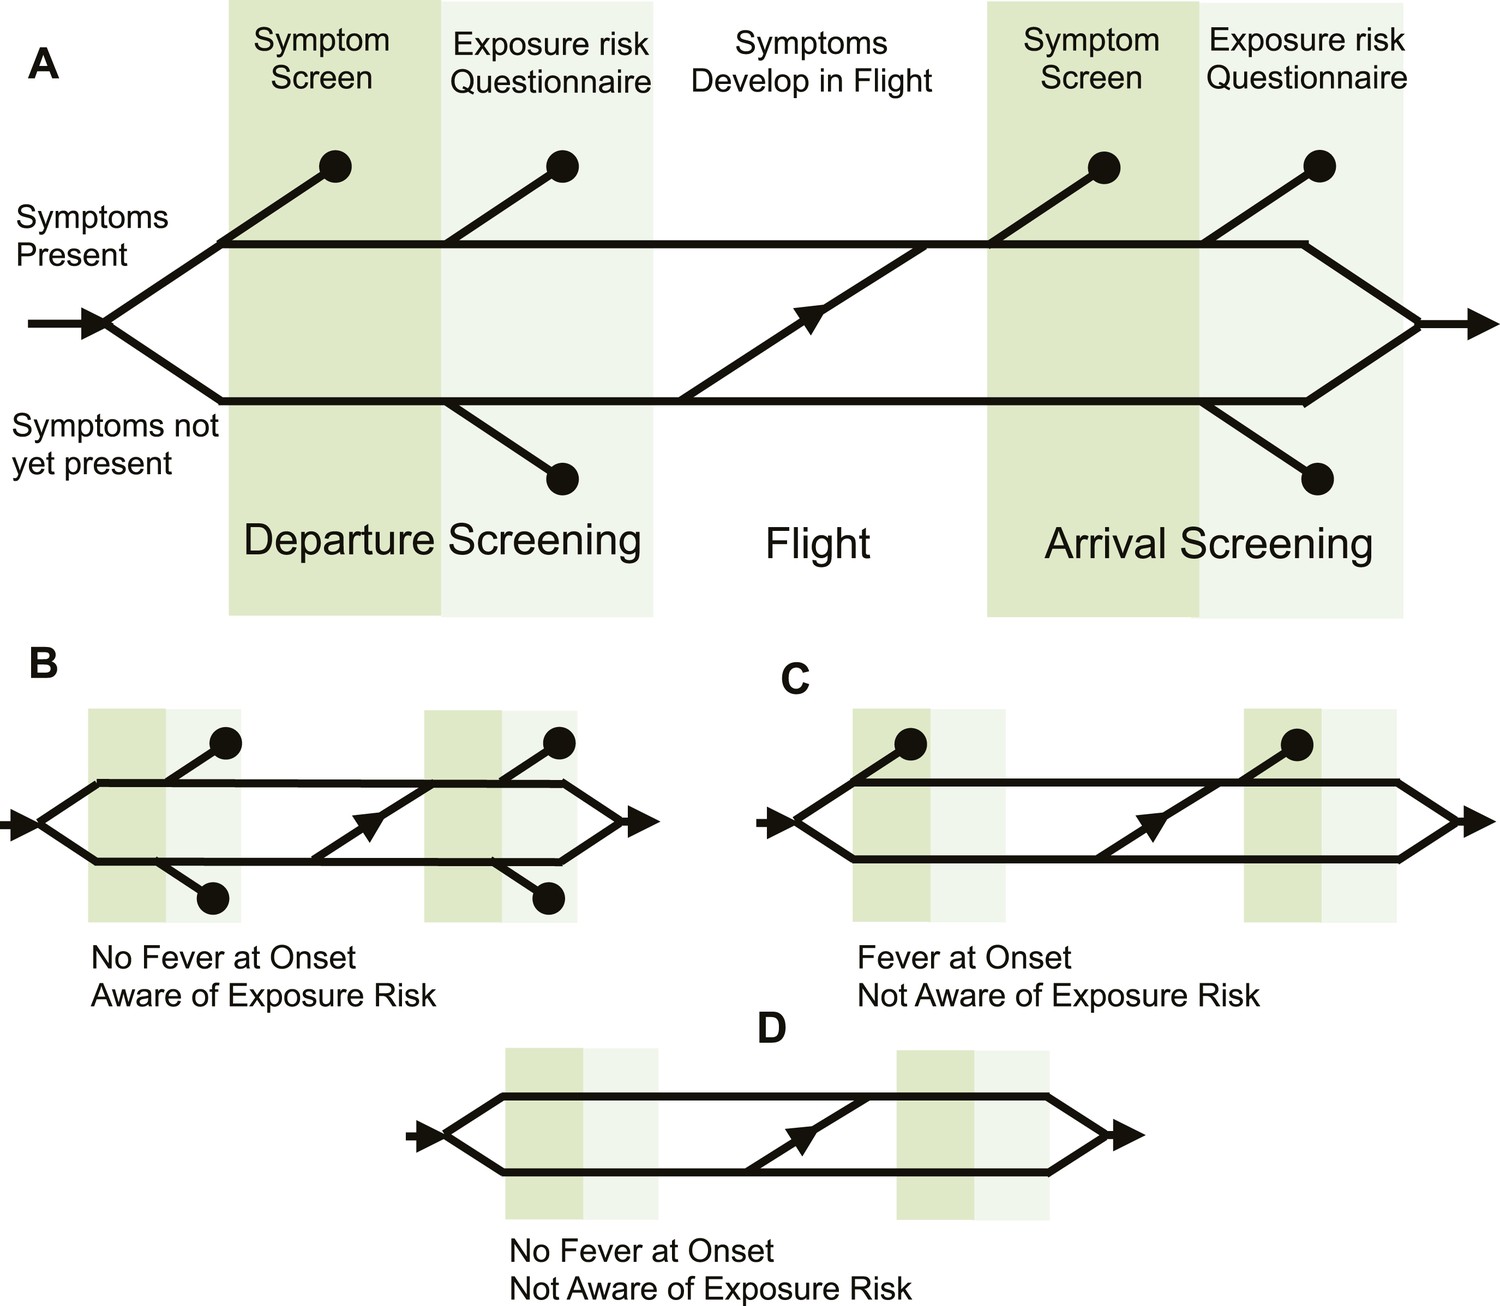
Model of traveller screening process.
(A) Upon airport arrival, passengers passed through screening for fever, followed by screening for risk factors. We assumed a one-strike policy: passengers identified as potentially infected by any single screening test were detained. (B) Passengers who did not present with fever would always pass through symptom screening, but could still be identified during questionnaire screening. (C) Passengers who were not aware of exposure risk would always pass through questionnaire screening. (D) Passengers with neither fever nor knowledge of exposure would go undetected.
Figure 1—figure supplement 1
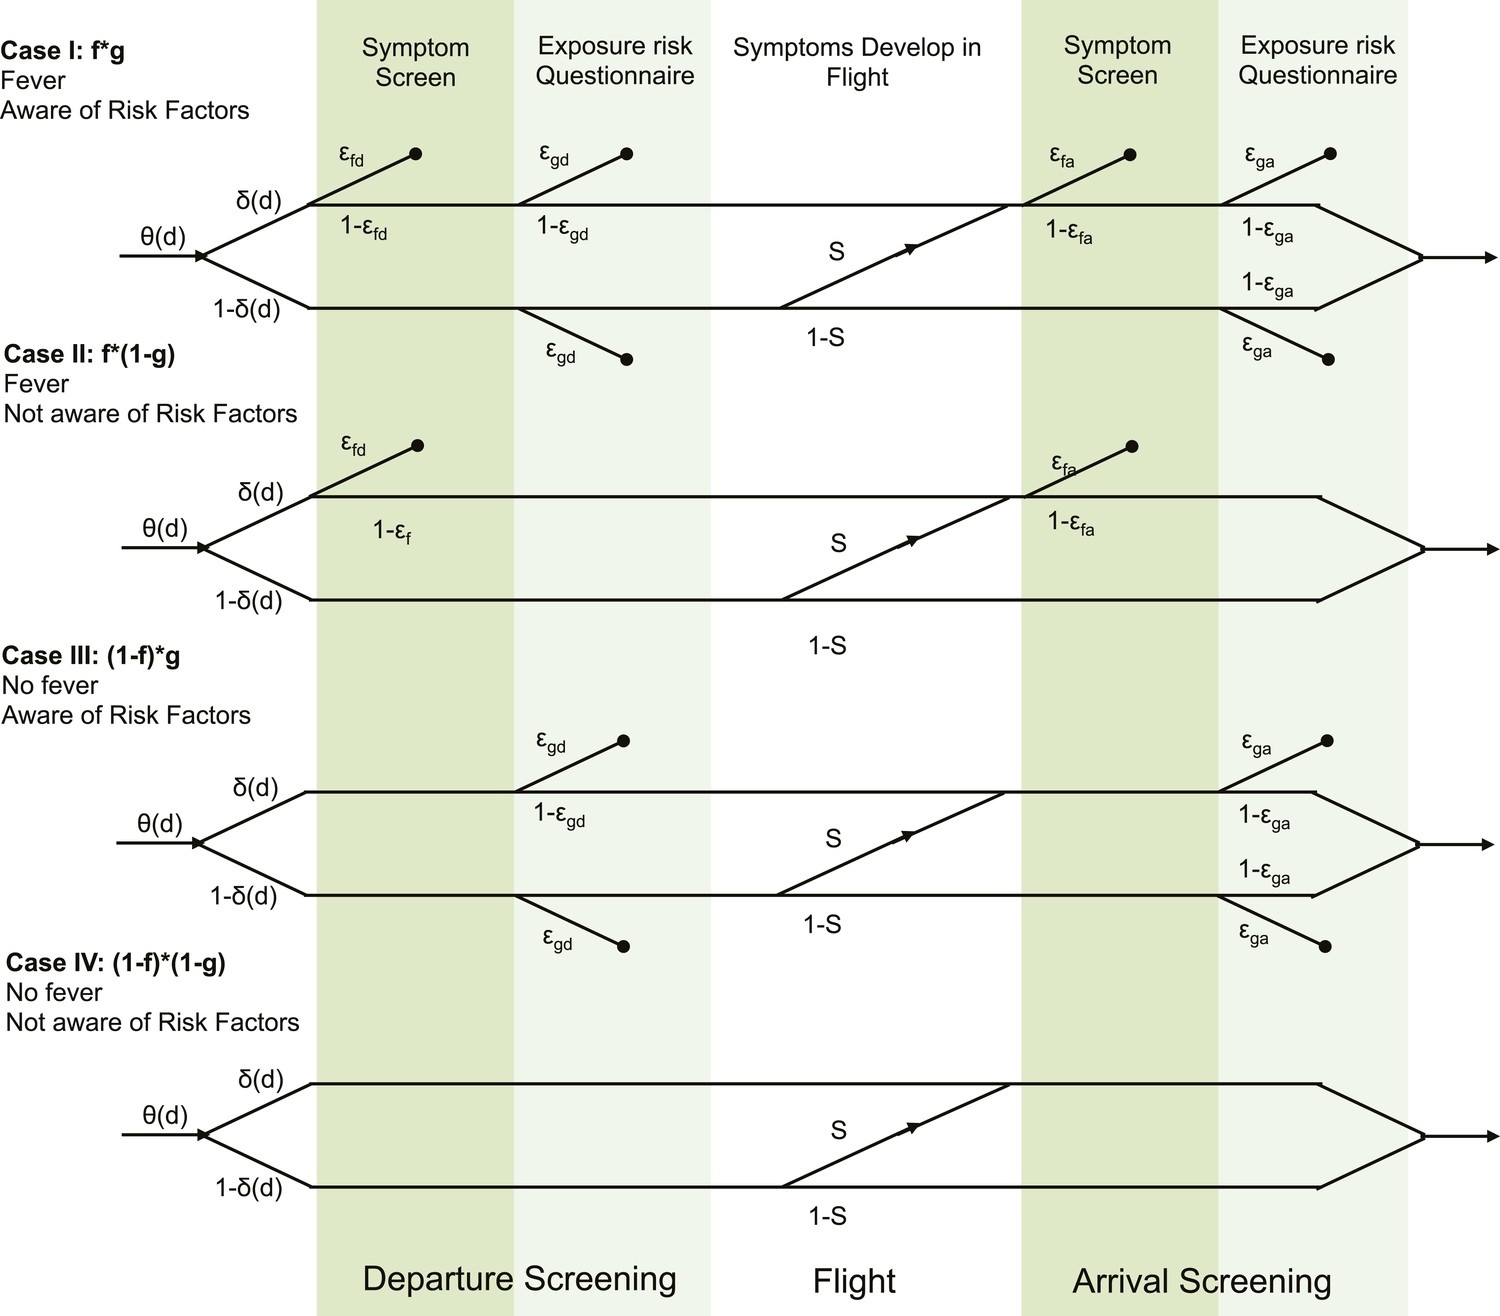
Detailed model formulation with parameters.
Each case represents a different detectability class. Travellers are assigned to detectability classes with probabilities f (presence of fever) and g (awareness of exposure risk). Values for f and g are given in Table 2. θ(d) describes the infection age distribution (times since exposure) in individuals attempting travel. δ(d) is the incubation period cumulative distribution function, which describes the probability that travellers have progressed to symptom onset at the time of attempted travel. ε describes the efficacy of each respective screening module. S is the probability that travellers develop symptoms in flight, given that they did not yet have symptoms at departure.
Figure 2

Parameters characterizing natural history of infection and epidemiological knowledge.
(A) Proportion of infected individuals who report known exposure risk and show fever at onset. Point shows median estimate, using data in Tables 2, 3; circle shows joint 95% binomial confidence interval. Red, influenza A/H7N9; purple influenza A/H1N1p; blue, MERS; green, SARS; orange, Ebola; black, Marburg. (B) Incubation period and fever at onset. Point shows median estimate, circle shows joint 95% CI, generated using a binomial distribution for fever symptoms and fitted parametric distributions given by references in Table 3 for incubation period.
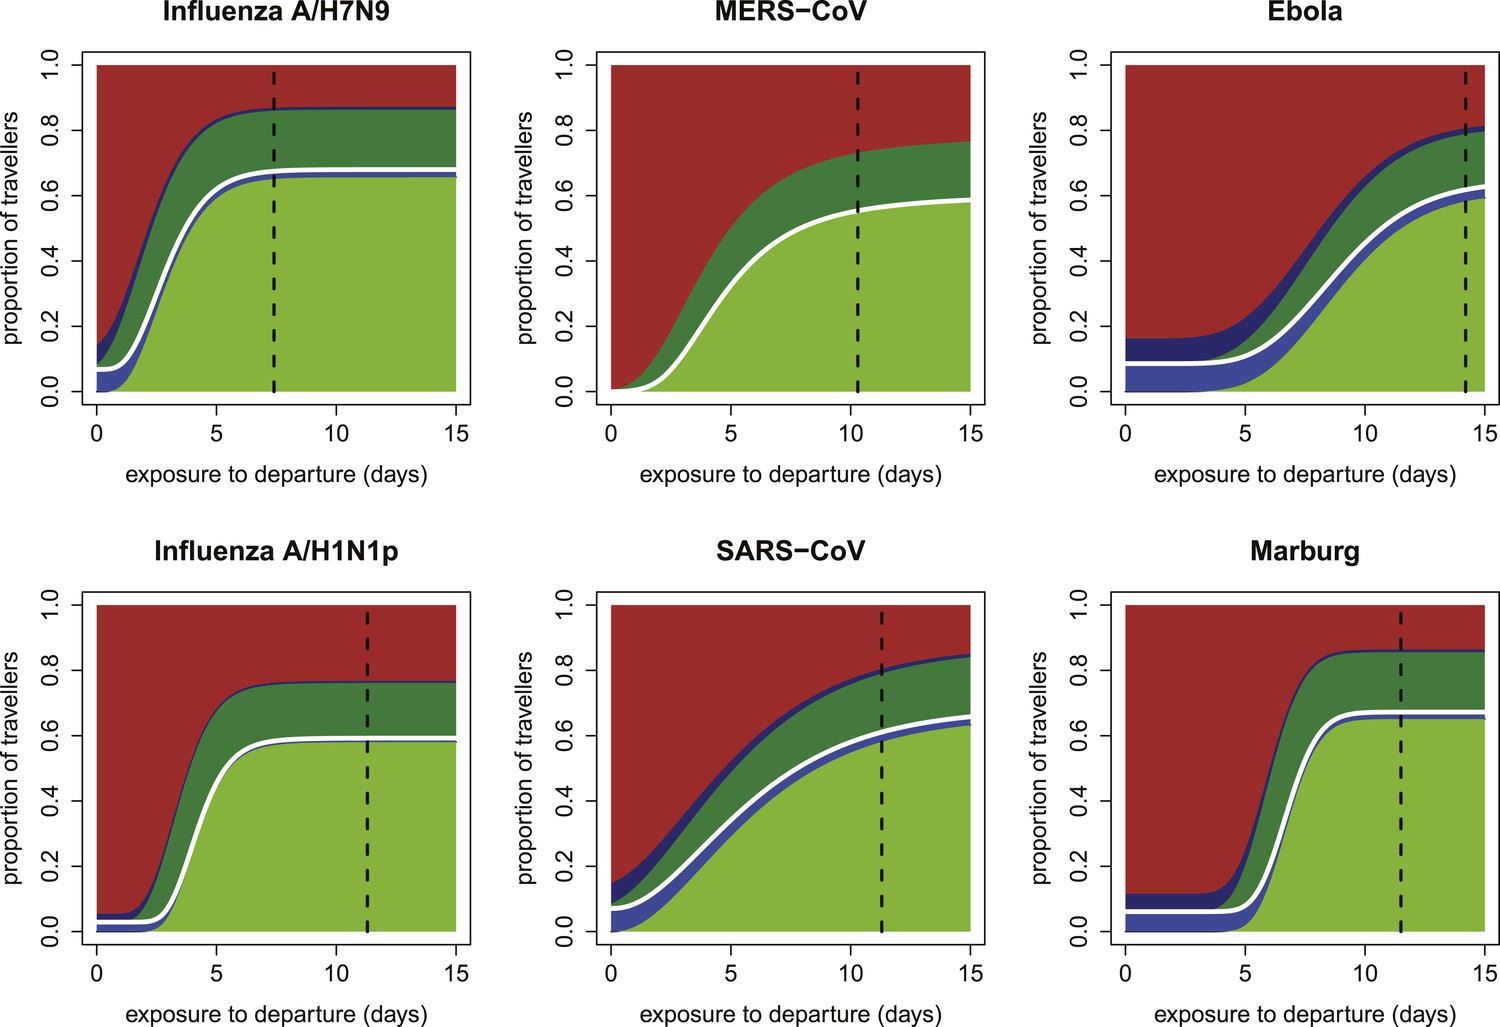
Figure 3 with 3 supplements
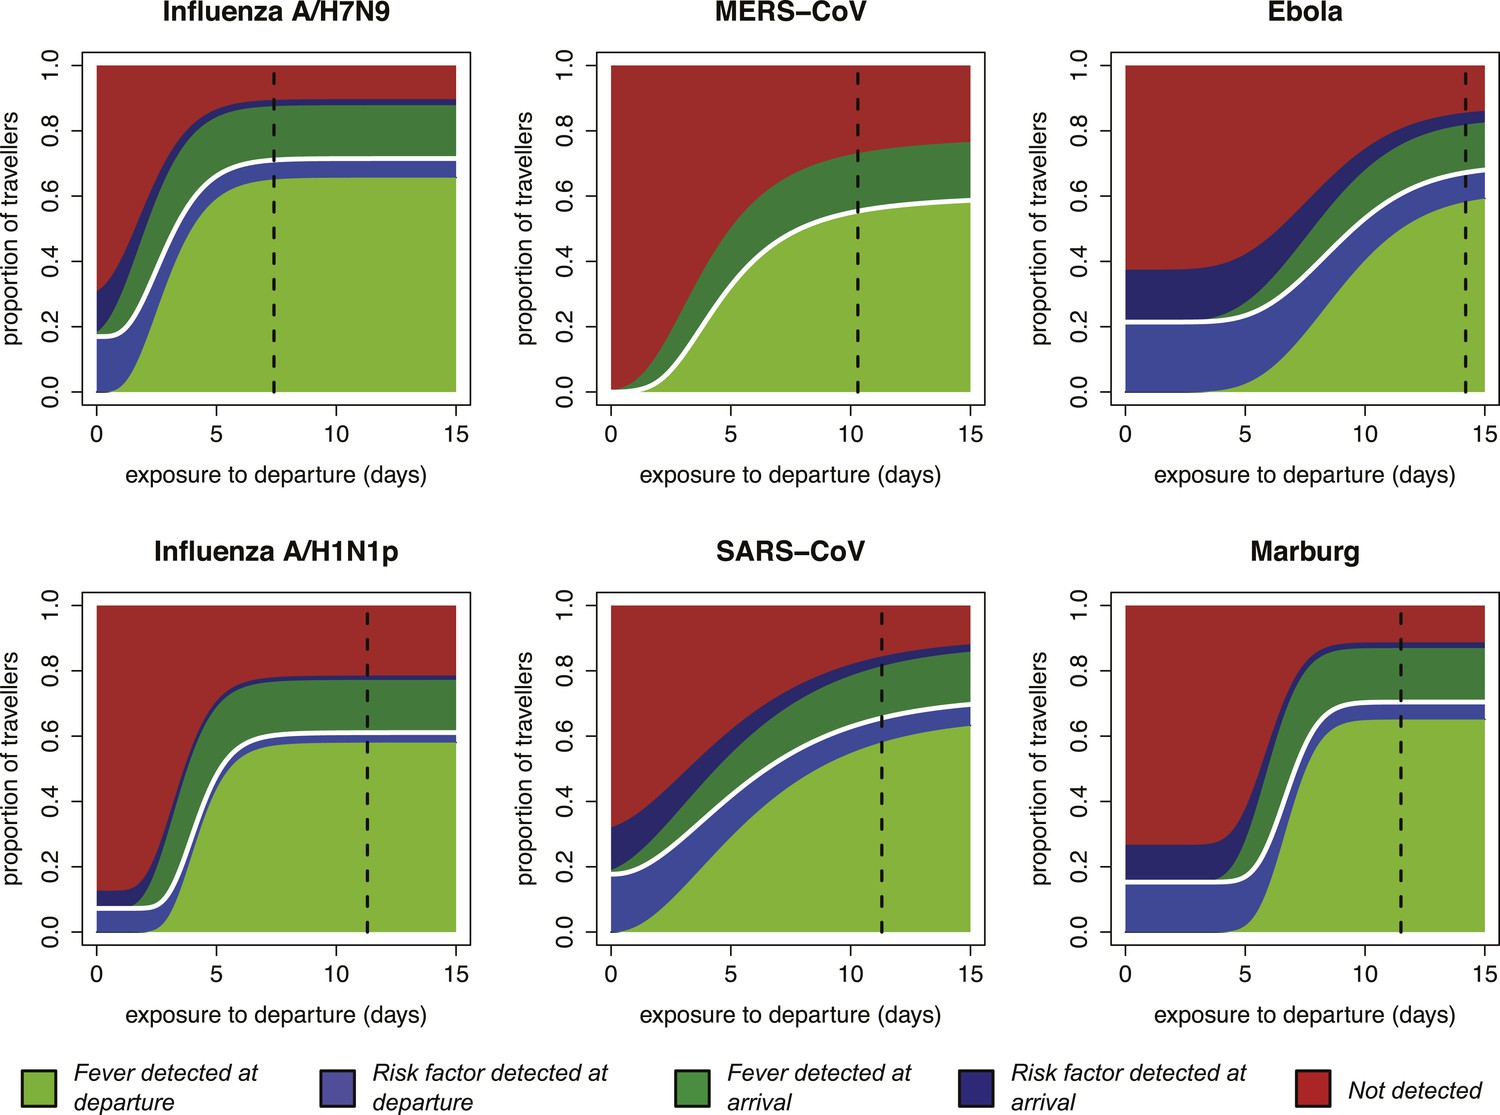
Impact of infection age on effectiveness of screening measures.
Expected fraction of passengers detected by fever and risk factor screening, at arrival and departure, as a function of the time between an individual’s exposure and the departure leg of their journey. We assume a 70% probability that fever screening will identify febrile patients, and a 25% probability that a traveller with a known history of risky exposure will report it on a questionnaire. We assume 24 hr travel time. The white lines denote the point at which travellers board their flight; the black dashed line shows the median time from exposure to hospitalization for each pathogen.
Figure 3—figure supplement 1
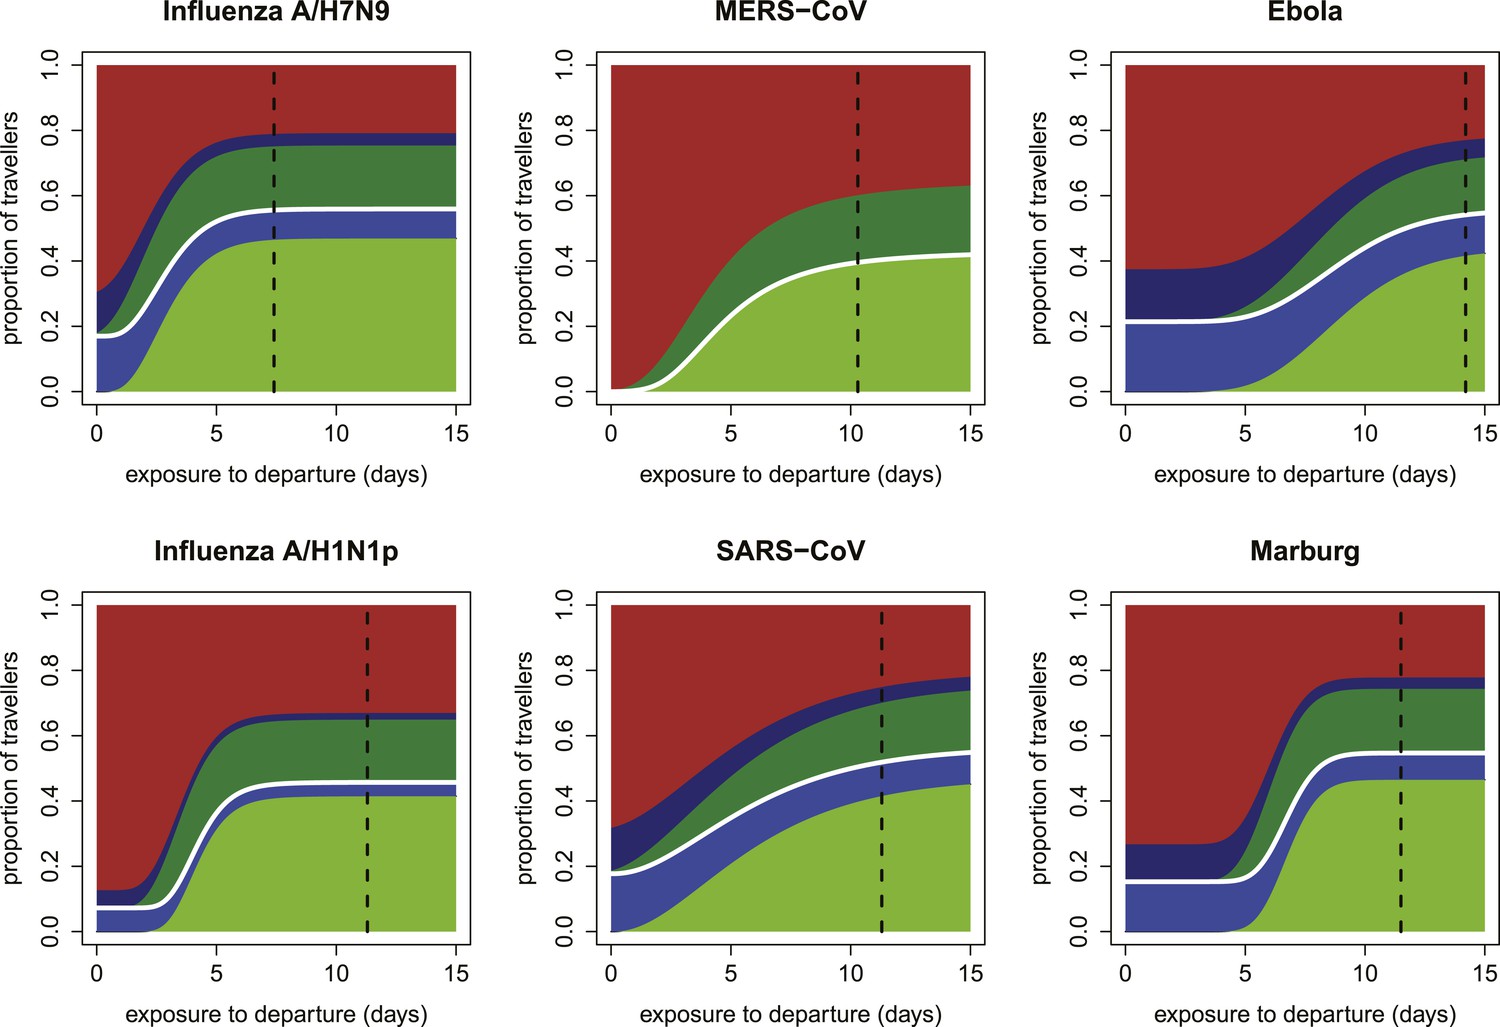
Expected proportions detected by screening when efficacy of fever screening is 50% and proportion of cases with known exposure history who report correctly is 0.25.
https://doi.org/10.7554/eLife.05564.006
Figure 3—figure supplement 2
Expected proportions detected by screening when efficacy of fever screening is 70% and proportion of cases with known exposure history who report correctly is 0.1.
https://doi.org/10.7554/eLife.05564.007
Figure 3—figure supplement 3

Expected proportions detected by screening when efficacy of fever screening is 50% and proportion of cases with known exposure history who report correctly is 0.1.
https://doi.org/10.7554/eLife.05564.008
Figure 4 with 1 supplement

Proportion of infected travellers that would be missed by each of four screening scenarios.
(A) Proportion of 50 infected travellers that would be missed by both departure and arrival screening in a growing epidemic. Figure shows three possible screening methods: fever screen, exposure risk questionnaire, or both. Lines show 95% bootstrapped CI. (B) Proportion of infected travellers missed by both departure and arrival screening in a stable epidemic. (C) Proportion of infected individuals who fly that are missed by arrival screening in a stable epidemic. (D) Proportion of infected arrivals missed by point of entry screening in a stable epidemic. We assume 25% probability traveller will report if they know exposure and 70% probability screening with identify visibly febrile patients. We assume R0 = 2 and a 24 hr travel time.
Figure 4—figure supplement 1
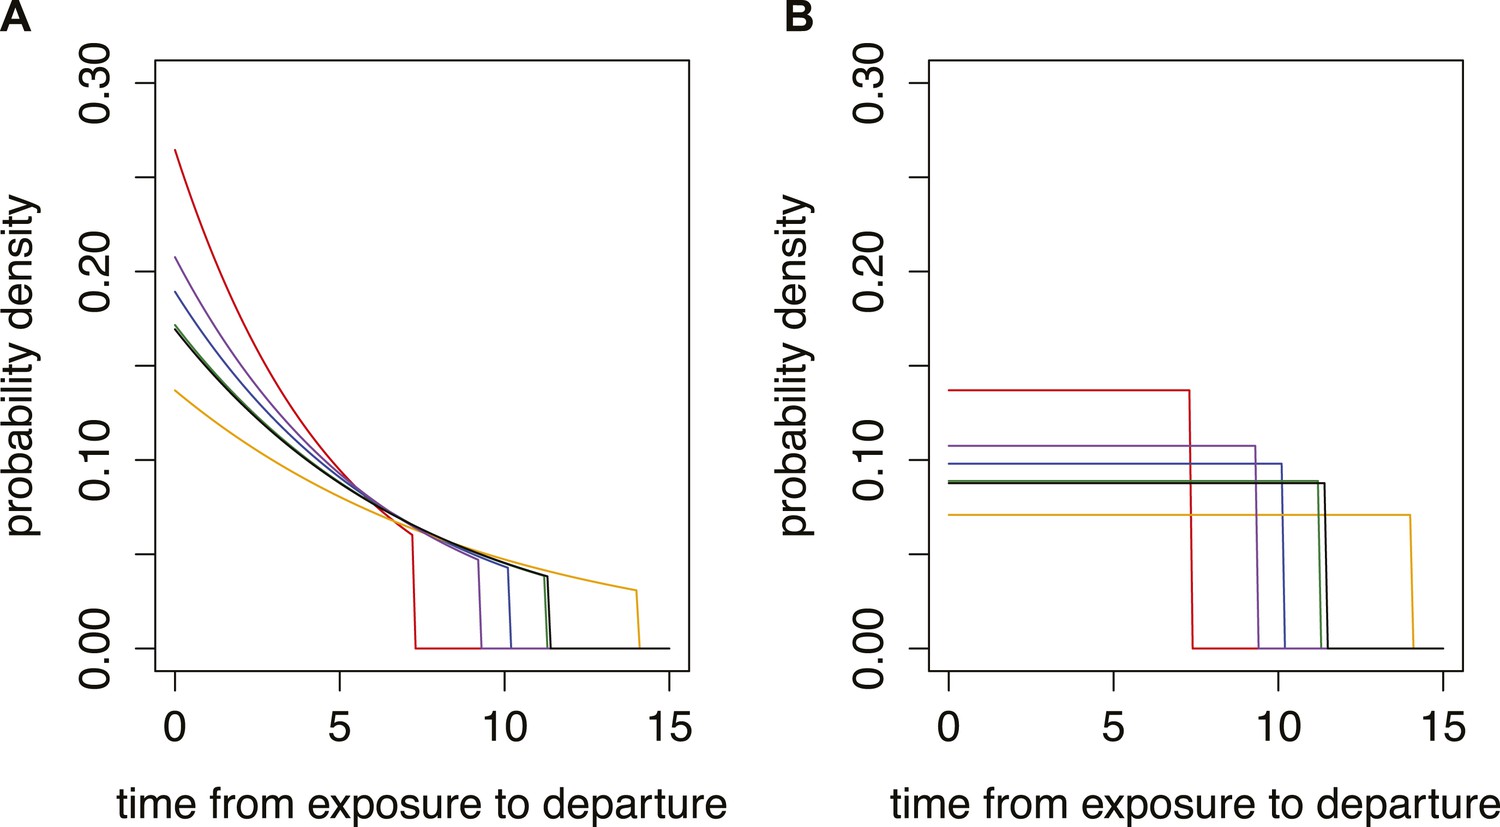
Different time from exposure to departure functions used in model.
Red, influenza A/H7N9; purple influenza A/H1N1p; blue, MERS; green, SARS; orange, Ebola; black, Marburg. (A) Growing epidemic with R0 = 1.5. (B) Stable situation.
Tables
Table 1
Airport screening measures during past disease outbreaks
| Pathogen | Date | Location | Direction | Screened | Detained | Positive | Source |
|---|---|---|---|---|---|---|---|
| Influenza A/H1N1p | 27 April–22 June 2009 | Auckland, New Zealand | Inbound | 456,518 | 406 | 4 | (Hale et al., 2012) |
| 28 April–18 June 2009 | Sydney, Australia | Inbound | 625,147 | 5845 | 3 | (Gunaratnam et al., 2014) | |
| 28 April–18 June 2009 | Tokyo, Japan | Inbound | 471,733 | 805 | 15 | (Nishiura and Kamiya, 2011) | |
| SARS Co-V | 5 April–16 June 2003 | Australia | Inbound | 1,840,000 | 794 | 0 | (Samaan et al., 2004) |
| 31 March–31 May 2003 | Singapore | Inbound | 442,973 | 176 | 0 | (Wilder-Smith et al., 2003) | |
| 14 May–5 July 2003 | Toronto, Canada | Inbound | 349,754 | 1264 | 0 | (St John et al., 2005) | |
| 14 May–5 July 2003 | Toronto, Canada | Outbound | 495,492 | 411 | 0 | (St John et al., 2005) | |
| MERS Co-V | 24 September 2012–15 October 2013 | England | Inbound | NR | 77 | 2 | (Thomas et al., 2014) |
| Ebola virus | August–September 2014 | Guinea, Liberia, Sierra Leone | Outbound | 36,000 | 77 | 0 | (Centers for Disease Control and Prevention, 2014a) |
| 11 October–22 October 2014 | United States | Inbound | 762 | 3 | 0 | (Apuzzo and Fernandez, 2014; CBS, 2014) |
Table 2
Natural history parameters: f is the proportion of cases with fever, g is the proportion of cases aware of exposure risk
| Pathogen | Parameter | Mean | Sample size | Reference |
|---|---|---|---|---|
| A/H7N9 | f | 0.79 | 85 | (Cowling et al., 2013) |
| f | 1.00 | 46 | (Gong et al., 2014; Sun et al., 2014) | |
| f | 1.00 | 111 | (Gao et al., 2013) | |
| g | 0.75 | 123 | (Cowling et al., 2013) | |
| g | 0.56 | 111 | (Gao et al., 2013) | |
| g | 0.78 | 46 | (Gong et al., 2014; Sun et al., 2014) | |
| A/H1N1 | f | 0.67 | 426 | (Cao et al., 2009) |
| f | 0.89 | 1088 | (Louie et al., 2009) | |
| g | 0.29 | 426 | (Cao et al., 2009) | |
| SARS | f | 0.94 | 1452 | (Donnelly et al., 2004) |
| g | 0.29 | 1192 | (Lau et al., 2004) | |
| MERS | f | 0.87 | 23 | (Assiri et al., 2013) |
| g | 0 | 10,000 | (Cauchemez et al., 2014) | |
| Ebola | f | 0.87 | 1151 | (WHO Ebola Response Team, 2014) |
| g | 0.86 | 142 | (Pattyn, 1978) | |
| Marburg | f | 0.93 | 129 | (Bausch et al., 2006) |
| f | 0.47 | 15 | (Bausch et al., 2003) | |
| g | 0.67 | 39 | (Roddy et al., 2010) |
Table 3
Time from exposure to onset (i.e., incubation period) and onset to hospitalization for different pathogens
| Pathogen | Time from | Mean (days) | Reference |
|---|---|---|---|
| Influenza A/H7N9 | Exposure-to-onset | 4.3 | (Cowling et al., 2013) |
| Onset-to-hospitalization | 5 | (Gao et al., 2013; Sun et al., 2014) | |
| Influenza A/H1N1 | Exposure-to-onset | 4.3 | (Tuite et al., 2010) |
| Exposure-to-onset | 2.05 | (Ghani et al., 2009) | |
| Onset-to-recovery | 7 | (Tuite et al., 2010) | |
| SARS-CoV | Exposure-to-onset | 6.4 | (Donnelly et al., 2003) |
| Onset-to-hospitalization | 4.85 | (Donnelly et al., 2003) | |
| MERS-CoV | Exposure-to-onset | 5.2 | (Assiri et al., 2013) |
| Exposure-to-onset | 5.5 | (Cauchemez et al., 2014) | |
| Onset-to-hospitalization | 5 | (Assiri et al., 2013) | |
| Ebola | Exposure-to-onset | 9.1 | (WHO Ebola Response Team, 2014) |
| Onset-to-hospitalization | 5 | (WHO Ebola Response Team, 2014) | |
| Marburg | Exposure-to-onset | 6.8 | (Martini, 1973) |
| Onset-to-hospitalization | 5* |
-
*
As there was limited data for onset-to-hospitalization for Marburg, we assumed the same value as for Ebola.
Additional files
-
Source code 1
(A) Internal Functions Filename—Code_distribution_functions.R. This script contains user-defined functions and distributions that are called by the master script. (B) Screening Model Filename—Code_Screening_model.R. This script defines the core probabilistic model described in this manuscript. This function is called by the master script. (C) Master Script Filename—Plot_results.R. This script integrates all the provided code to perform analyses and generate figures presented in this manuscript.
- https://doi.org/10.7554/eLife.05564.015
Download links
A two-part list of links to download the article, or parts of the article, in various formats.
Downloads (link to download the article as PDF)
Open citations (links to open the citations from this article in various online reference manager services)
Cite this article (links to download the citations from this article in formats compatible with various reference manager tools)
Effectiveness of traveller screening for emerging pathogens is shaped by epidemiology and natural history of infection
eLife 4:e05564.
https://doi.org/10.7554/eLife.05564


