Natural genetic variation in Arabidopsis thaliana defense metabolism genes modulates field fitness
- University of California, Davis, United States
- University of Utah, United States
- University of Wyoming, United States
- Cornell University, United States
- Misión Biológica de Galicia, Spain
- University of Copenhagen, Denmark
Figures
Figure 1 with 17 supplements
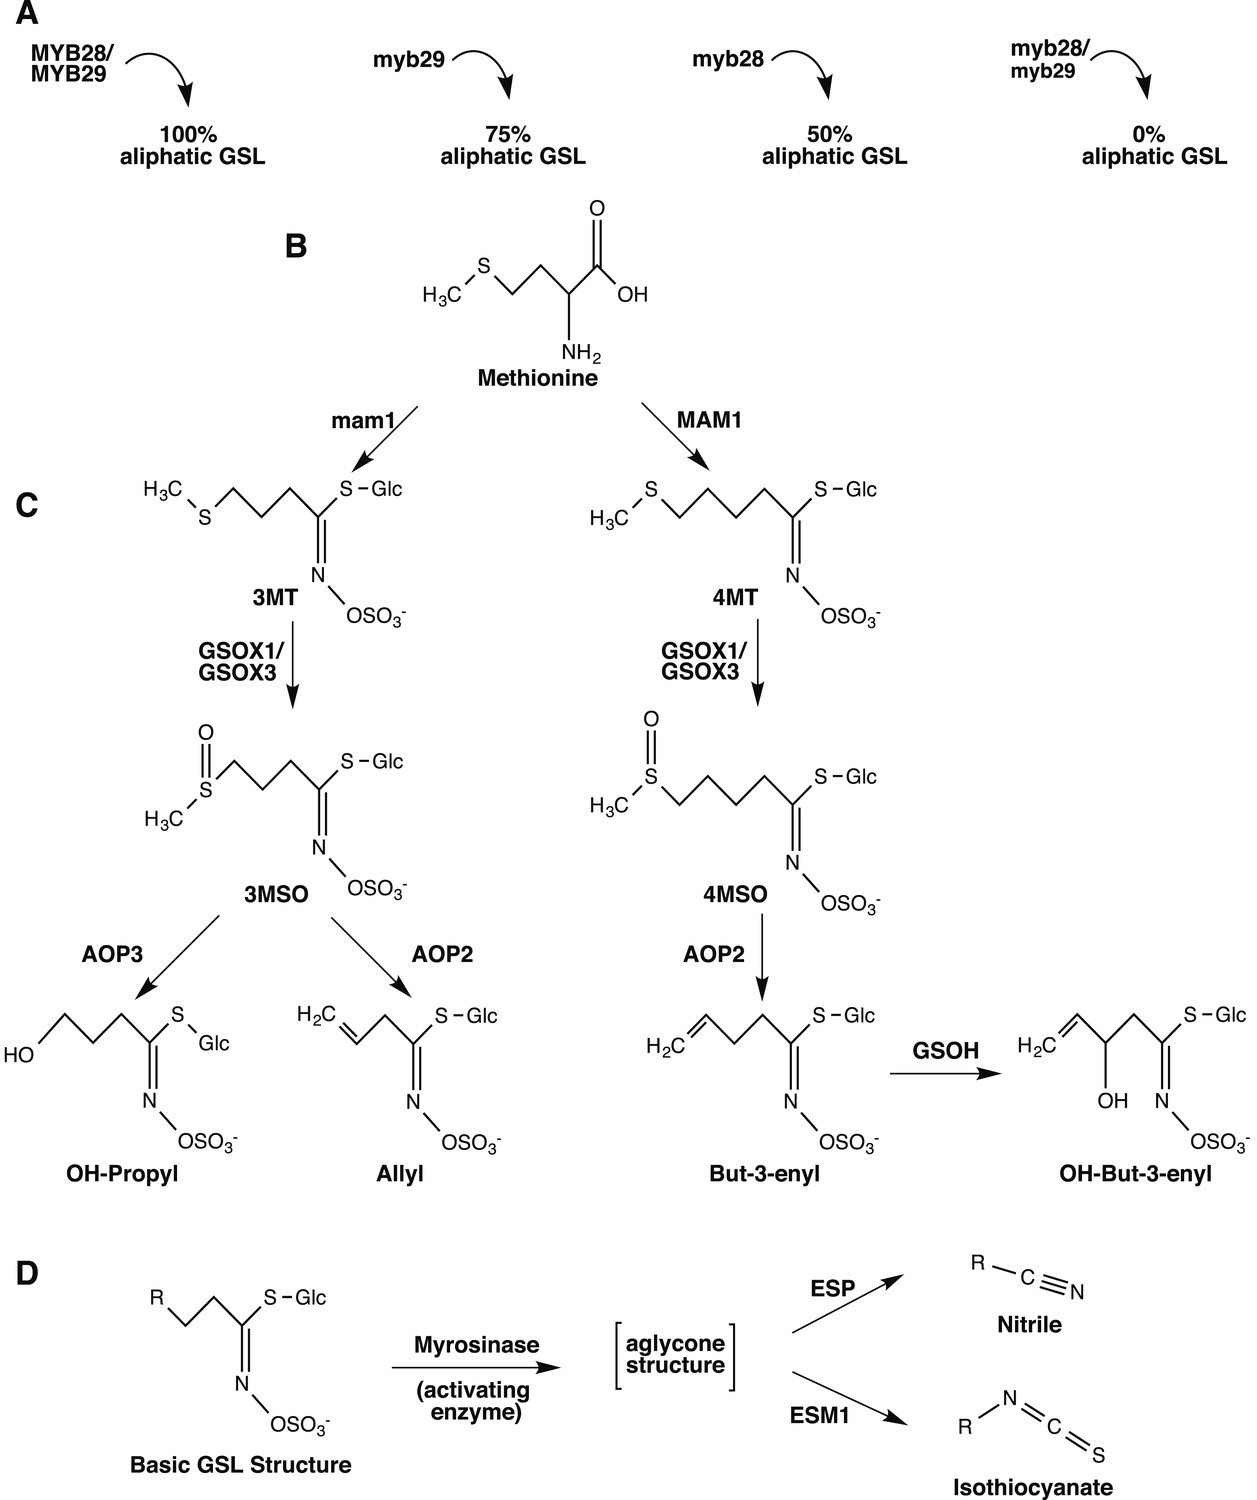
Overview of aliphatic GSL biosynthesis and activation in Arabidopsis thaliana.
Arrows represent the steps involved in aliphatic glucosinolate (GSL) biosynthesis that have been validated through laboratory experiments and are naturally variable within A. thaliana. Gene names are listed next to or above the arrows. (A) Regulation of aliphatic GSL biosynthesis. The transcription factors MYB28 and MYB29 control accumulation of aliphatic GLS. A double knockout in these genes results in no aliphatic GLS accumulation, while a single knockout in these genes leads to a 50% reduction in aliphatic GSL (myb28) or a 25% reduction in aliphatic GSL (myb29), compared to WT Col-0. The biosynthetic enzymes MAM1 and AOP2 also influence aliphatic GLS accumulation and a non-functional allele at either locus leads to decreased GSL accumulation. (B) Amino acid chain elongation. During chain elongation, carbons are added to a methionine precursor through a series of reactions producing an elongated amino acid. Variation at the Elong locus controls the number of carbons added to the amino acid precursor and therefore, the length of the GSL side chain, R. A functional allele at this locus, MAM1, leads primarily to accumulation of GSL with four carbon (4C) length side chains, whereas a non-functional allele, gsm1 leads to accumulation of GSL with three carbon (3C) length side chains. The elongated amino acid is subsequently converted into a GLS via the core pathway (not shown). (C) Side chain modification. The GSL compounds produced can then undergo a series of side chain modifications that lead to the suite of diverse GSL compounds found in Arabidopsis. Side chain modification is controlled by variation of GSOX1, GSOX3, AOP2, AOP3 and GSOH. GSOX1 & GSOX3 oxygenate a methylthio (MT) to methylsulfinyl (MSO) GSL. AOP2 converts MSO to alkenyl, such as allyl and but-3-enyl. AOP3, on the other hand converts only 3C length MSO to OH-propyl GSL and cannot act on the 4MSO GSL. GSOH oxygenates the 4C but-3-enyl to the OH-alkenyl GSL, OH-but-3-enyl. Since GSOH acts on but-3-enyl GSL, which is a product of AOP2, a functional AOP2 is necessary for GSOH to function and AOP2 is said to be epistatic to GSOH. Col-0 is functional for MAM1 and the GSOX's, null for both AOP2 and AOP3, and functional for GSOH, resulting in accumulation of primarily 4MSO GLS. See Figure 1—figure supplements 1–17 for images of GSL traces for each GSL genotypes in our mutant laboratory population. (D) GSL Activation. Once produced, GLS are stored in the vacuole in their stable, unreactive form until activation occurs. Upon cellular disruption, such as occurs during pathogen attack, insect herbivory or even wind damage, GLS come into contact with their own plant-made activating enzyme, myrosinase. After production, myrosinase is stored in vacuoles of idioblastic cells called myrosin bodies. Myrosinase activates the GSL compound by cleaving the glucose moiety, yielding an unstable aglycone structure that non-enzymatically rearranges to either nitriles or isothiocyanates, depending on the presence of the co-activators ESM1 and ESP.
Figure 1—figure supplement 1
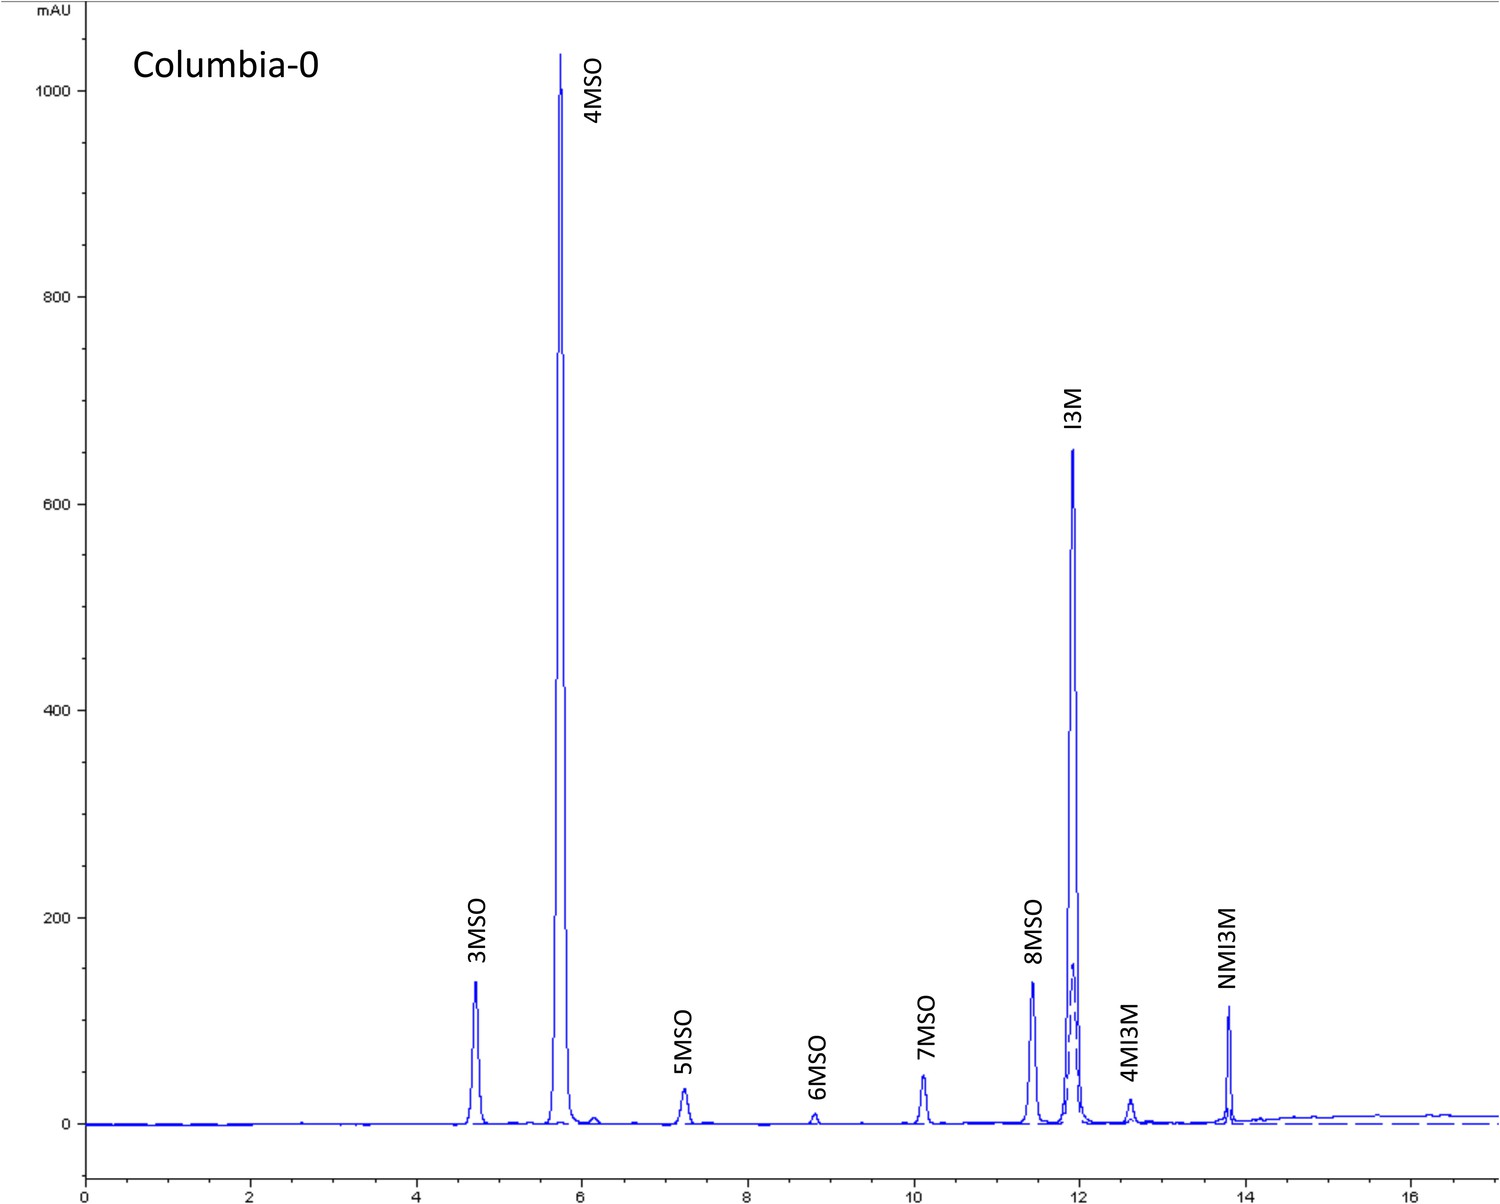
HPLC trace of Arabidopsis thaliana accession Columbia-0 wild-type genotype.
Shown is an HPLC trace from a representative individual of field-grown Col-0 that depicts the GSL profile found within the leaves of this genotype. The mixture of various GSL structures present within the leaf and the relative amounts of each constitute the GSL profile in an individual. 3MSO = 3-Methylsulfinylpropyl glucosinolate (GSL), 4MSO = 4-Methylsulfinylbutyl GSL, 5MSO = 5-Methylsulfinylpentyl GSL, 6MSO = 6-Methylsulfinylhexyl GSL, 7MSO = 7-Methylsulfinylheptyl GSL, 8MSO = 8-Methylsulfinyloctyl GSL, I3M = Indol-3-ylmethyl GSL, 4MI3M = 4-Methoxyindol-3-ylmethyl GSL, NMI3M = 1-Methoxyindol-3-ylmethyl GSL.
Figure 1—figure supplement 2
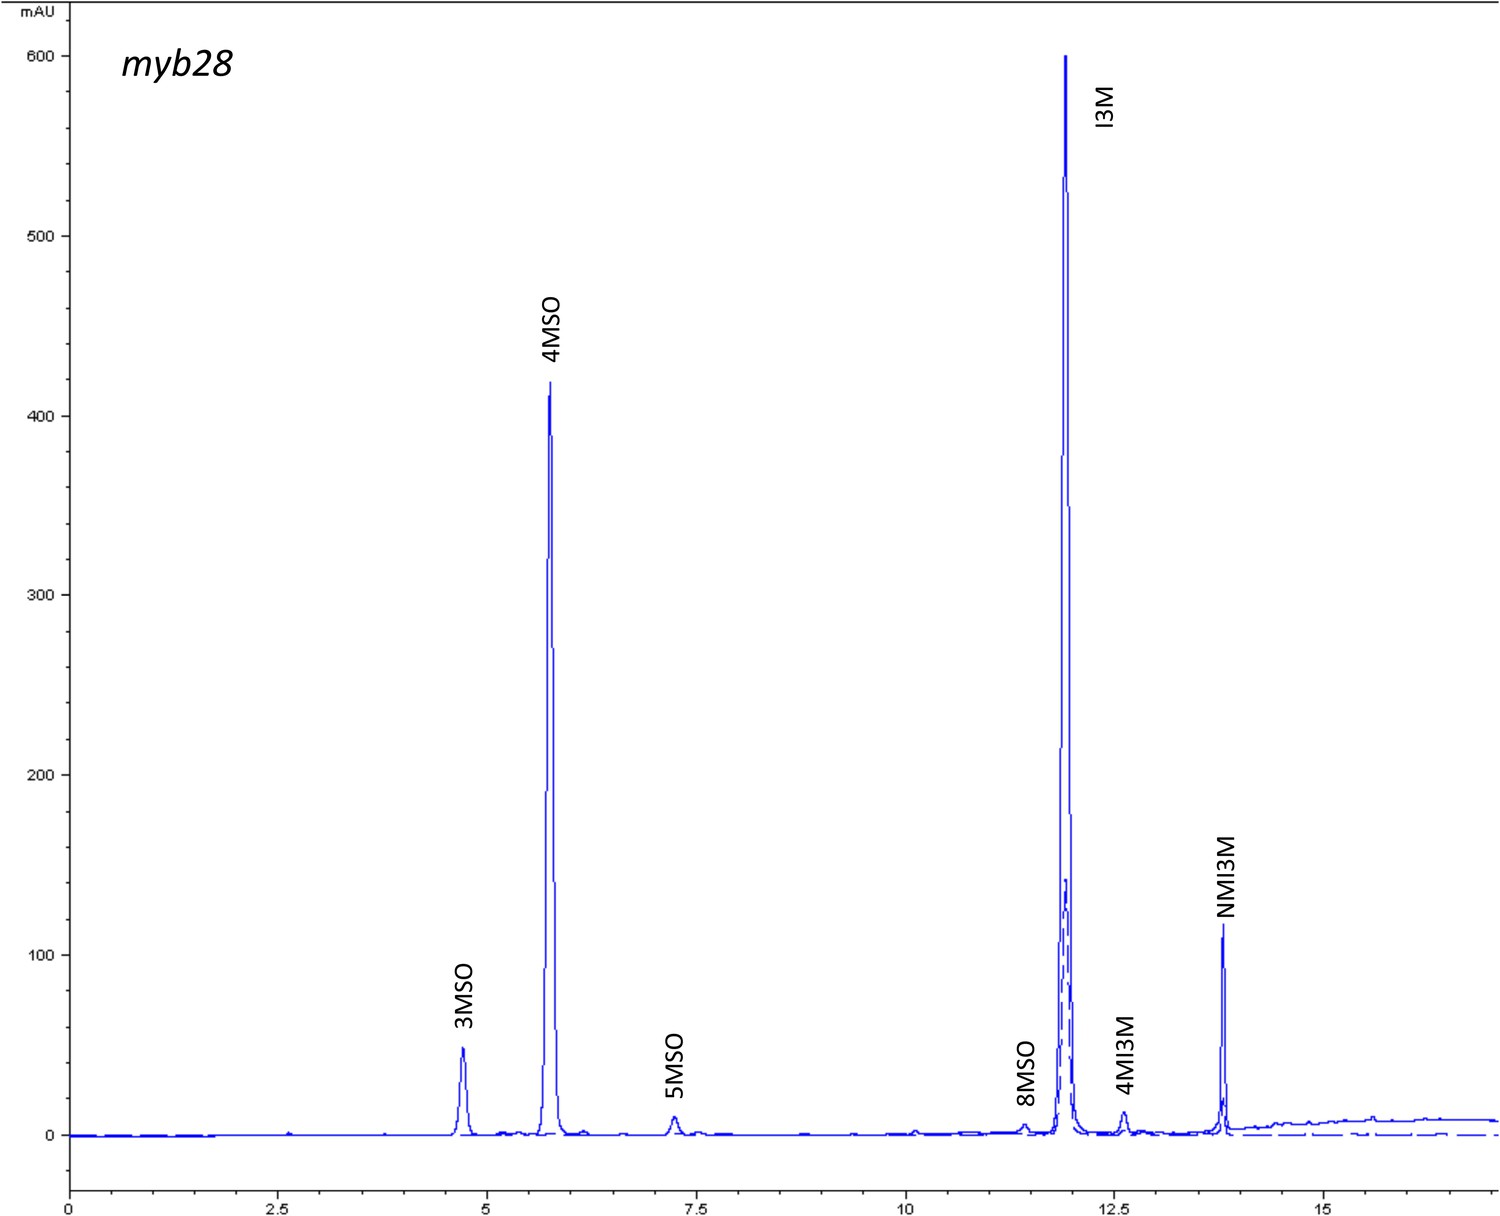
HPLC trace of Arabidopsis thaliana accession Columbia-0 myb28 genotype.
Shown is an HPLC trace from a representative individual of field-grown myb28 genotype that depicts the GSL profile found within the leaves of this genotype. The mixture of various GSL structures present within the leaf and the relative amounts of each constitute the GSL profile in an individual. 3MSO = 3-Methylsulfinylpropyl glucosinolate (GSL), 4MSO = 4-Methylsulfinylbutyl GSL, 5MSO = 5-Methylsulfinylpentyl GSL, 8MSO = 8-Methylsulfinyloctyl GSL, I3M = Indol-3-ylmethyl GSL, 4MI3M = 4-Methoxyindol-3-ylmethyl GSL, NMI3M = 1-Methoxyindol-3-ylmethyl GSL.
Figure 1—figure supplement 3
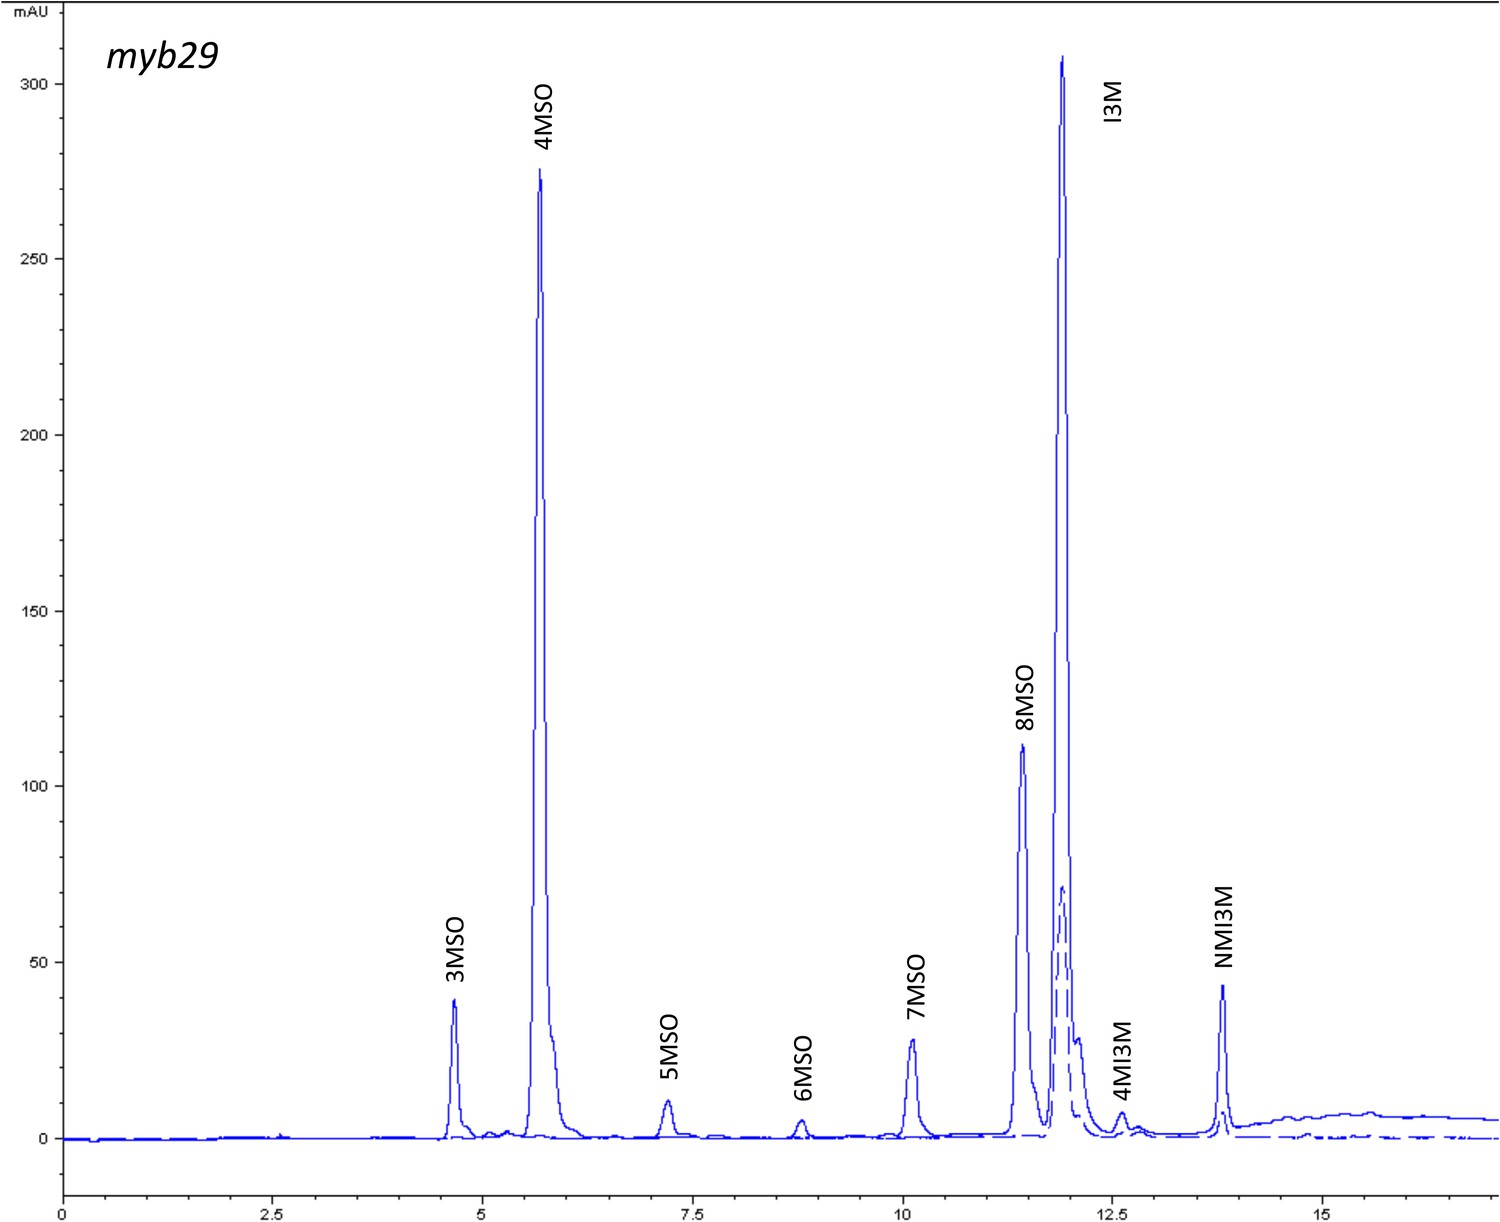
HPLC trace of Arabidopsis thaliana accession Columbia-0 myb29 genotype.
Shown is an HPLC trace from a representative individual of field-grown myb29 genotype that depicts the GSL profile found within the leaves of this genotype. The mixture of various GSL structures present within the leaf and the relative amounts of each constitute the GSL profile in an individual. 3MSO = 3-Methylsulfinylpropyl glucosinolate (GSL), 4MSO = 4-Methylsulfinylbutyl GSL, 5MSO = 5-Methylsulfinylpentyl GSL, 6MSO = 6-Methylsulfinylhexyl GSL, 7MSO = 7-Methylsulfinylheptyl GSL, 8MSO = 8-Methylsulfinyloctyl GSL, I3M = Indol-3-ylmethyl GSL, 4MI3M = 4-Methoxyindol-3-ylmethyl GSL, NMI3M = 1-Methoxyindol-3-ylmethyl GSL.
Figure 1—figure supplement 4
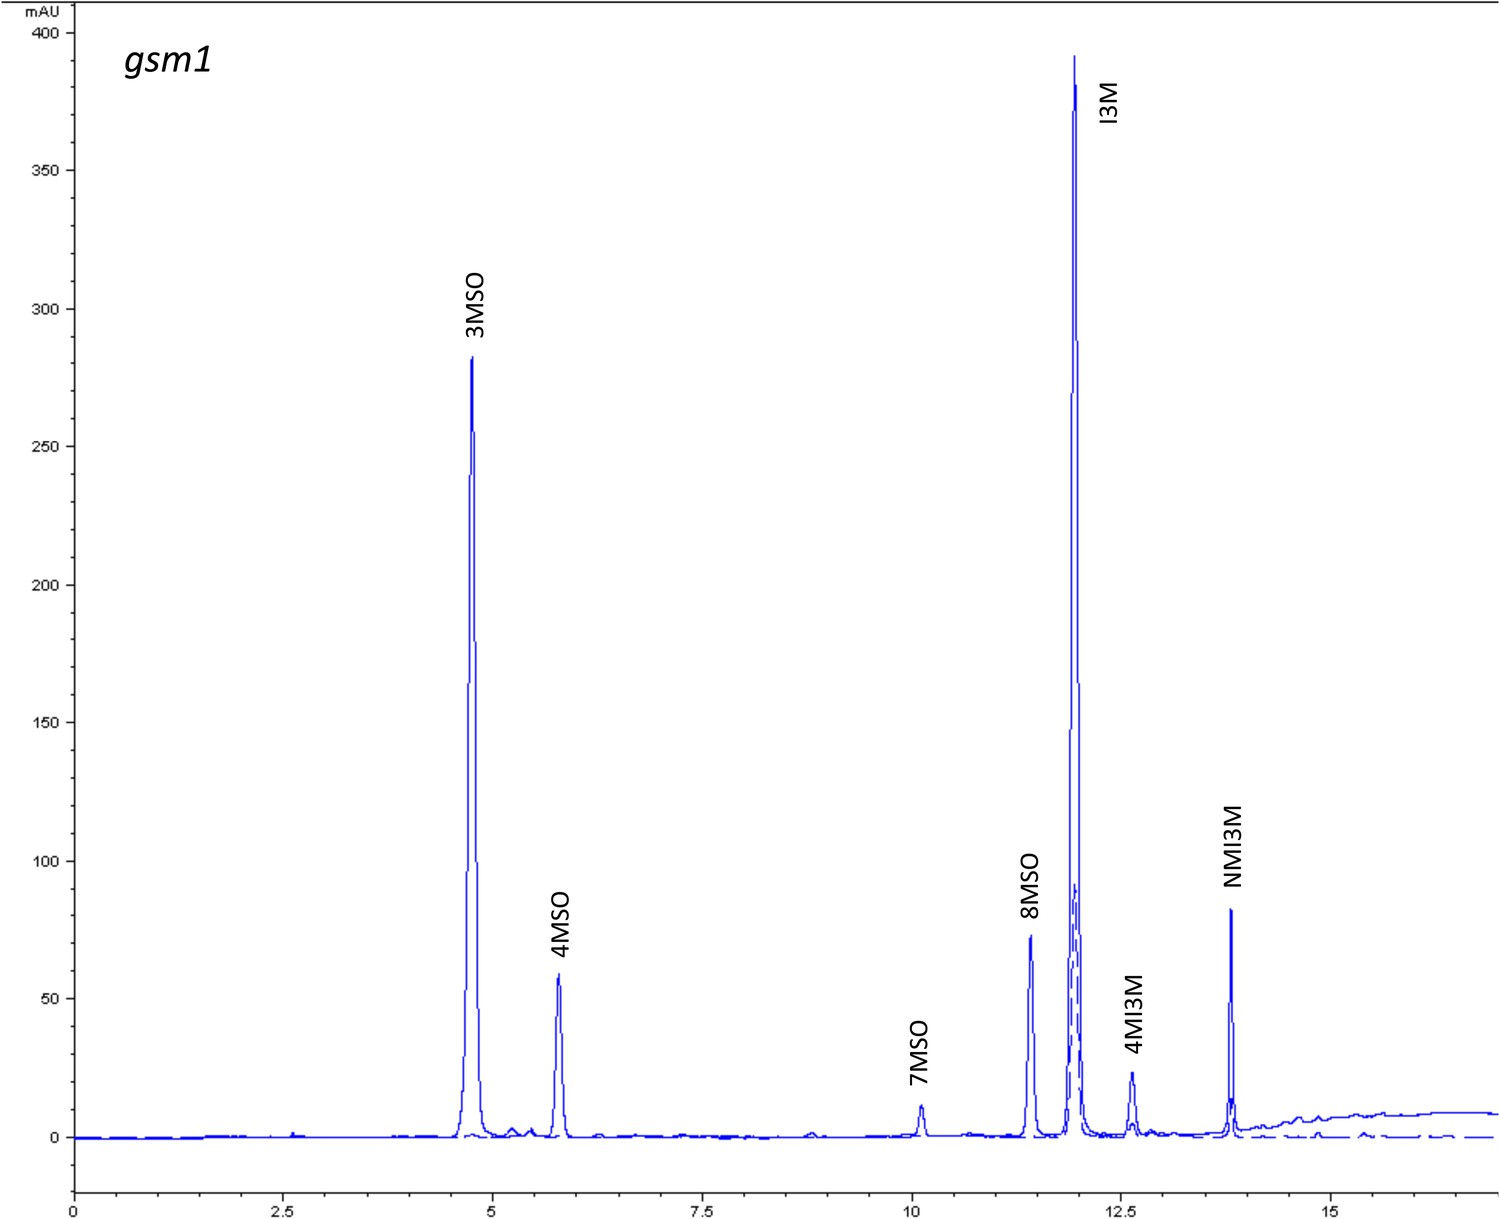
HPLC trace of Arabidopsis thaliana accession Columbia-0 gsm1 genotype.
Shown is an HPLC trace from a representative individual of field-grown gsm1 genotype that depicts the GSL profile found within the leaves of this genotype. The mixture of various GSL structures present within the leaf and the relative amounts of each constitute the GSL profile in an individual. 3MSO = 3-Methylsulfinylpropyl glucosinolate (GSL), 4MSO = 4-Methylsulfinylbutyl GSL, 7MSO = 7-Methylsulfinylheptyl GSL, 8MSO = 8-Methylsulfinyloctyl GSL, I3M = Indol-3-ylmethyl GSL, 4MI3M = 4-Methoxyindol-3-ylmethyl GSL, NMI3M = 1-Methoxyindol-3-ylmethyl GSL.
Figure 1—figure supplement 5
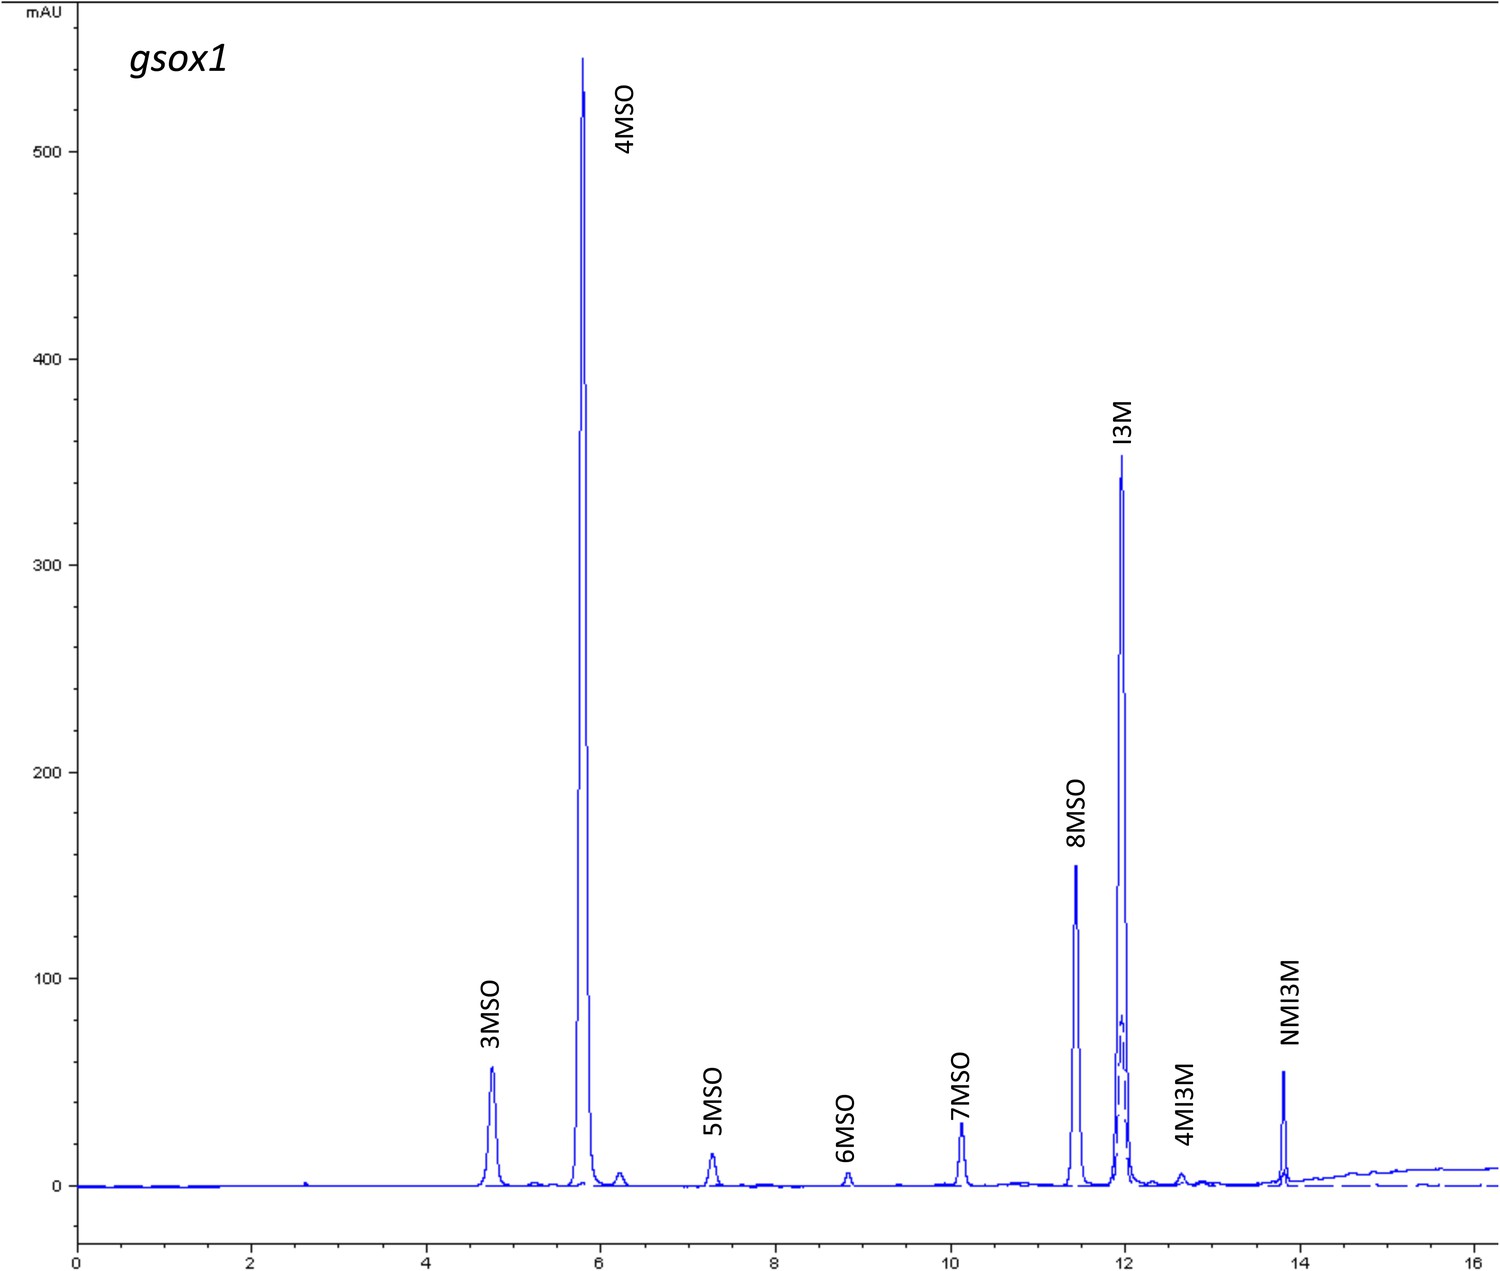
HPLC trace of Arabidopsis thaliana accession Columbia-0 gsox1 genotype.
Shown is an HPLC trace from a representative individual of field-grown gsox1 genotype that depicts the GSL profile found within the leaves of this genotype. The mixture of various GSL structures present within the leaf and the relative amounts of each constitute the GSL profile in an individual. 3MSO = 3-Methylsulfinylpropyl glucosinolate (GSL), 4MSO = 4-Methylsulfinylbutyl GSL, 5MSO = 5-Methylsulfinylpentyl GSL, 6MSO = 6-Methylsulfinylhexyl GSL, 7MSO = 7-Methylsulfinylheptyl GSL, 8MSO = 8-Methylsulfinyloctyl GSL, I3M = Indol-3-ylmethyl GSL, 4MI3M = 4-Methoxyindol-3-ylmethyl GSL, NMI3M = 1-Methoxyindol-3-ylmethyl GSL.
Figure 1—figure supplement 6
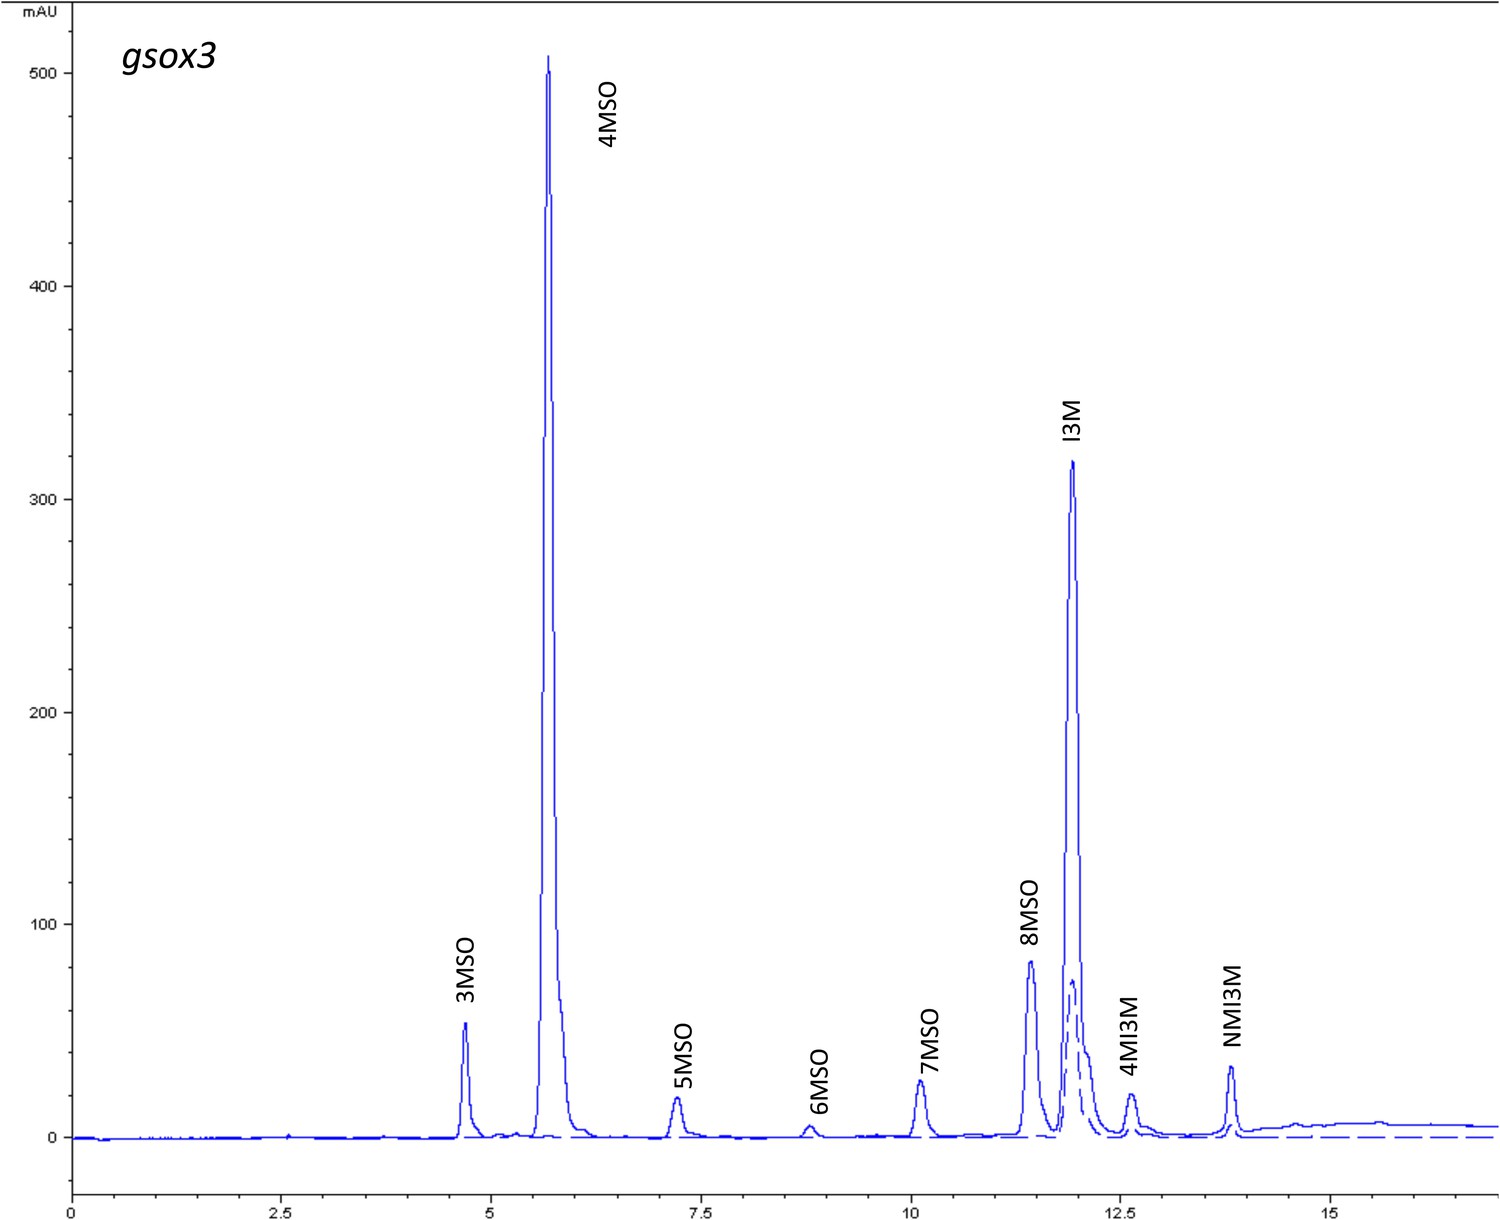
HPLC trace of Arabidopsis thaliana accession Columbia-0 gsox3 genotype.
Shown is an HPLC trace from a representative individual of field-grown gsox3 genotype that depicts the GSL profile found within the leaves of this genotype. The mixture of various GSL structures present within the leaf and the relative amounts of each constitute the GSL profile in an individual. 3MSO = 3-Methylsulfinylpropyl glucosinolate (GSL), 4MSO = 4-Methylsulfinylbutyl GSL, 5MSO = 5-Methylsulfinylpentyl GSL, 6MSO = 6-Methylsulfinylhexyl GSL, 7MSO = 7-Methylsulfinylheptyl GSL, 8MSO = 8-Methylsulfinyloctyl GSL, I3M = Indol-3-ylmethyl GSL, 4MI3M = 4-Methoxyindol-3-ylmethyl GSL, NMI3M = 1-Methoxyindol-3-ylmethyl GSL.
Figure 1—figure supplement 7
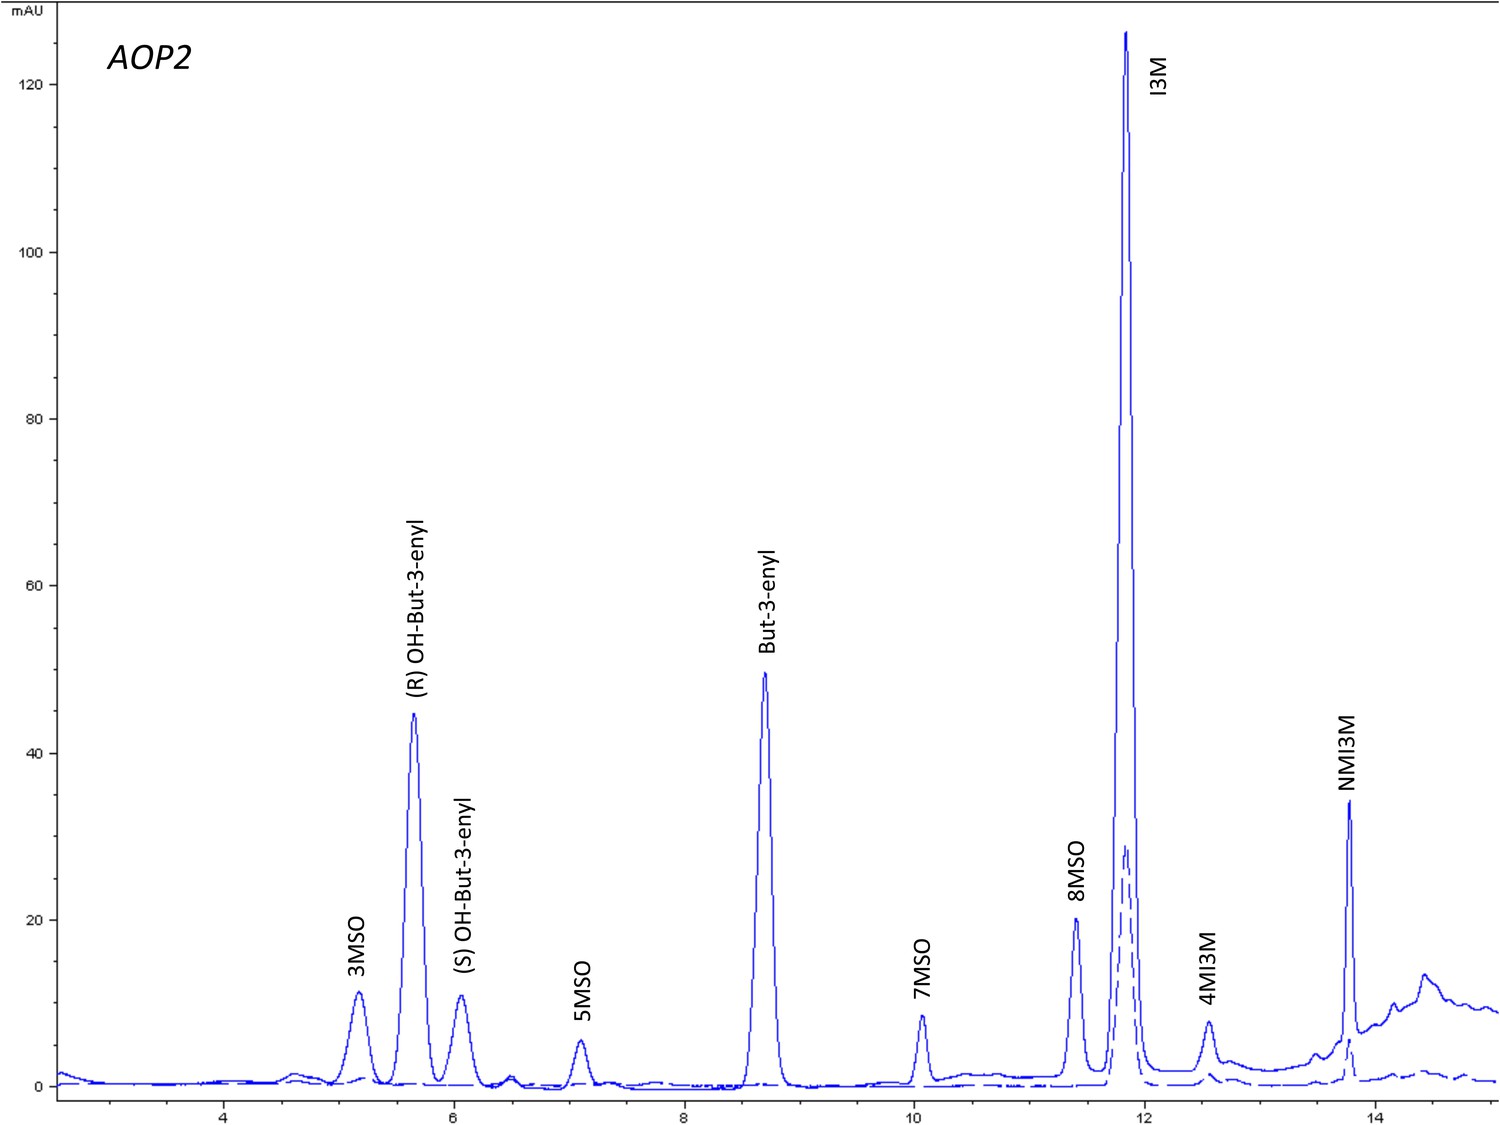
HPLC trace of Arabidopsis thaliana accession Columbia-0 AOP2 genotype.
Shown is an HPLC trace from a representative individual of field-grown AOP2 genotype that depicts the GSL profile found within the leaves of this genotype. The mixture of various GSL structures present within the leaf and the relative amounts of each constitute the GSL profile in an individual. 3MSO = 3-Methylsulfinylpropyl glucosinolate (GSL), (R) OH-But-3-enyl = (R) OH-But-3-enyl GSL, (S) OH-But-3-enyl = (S) OH-But-3-enyl GSL, 5MSO = 5-Methylsulfinylpentyl GSL, But-3-enyl = But-3-enyl GSL, 7MSO = 7-Methylsulfinylheptyl GSL, 8MSO = 8-Methylsulfinyloctyl GSL, I3M = Indol-3-ylmethyl GSL, 4MI3M = 4-Methoxyindol-3-ylmethyl GSL, NMI3M = 1-Methoxyindol-3-ylmethyl GSL.
Figure 1—figure supplement 8
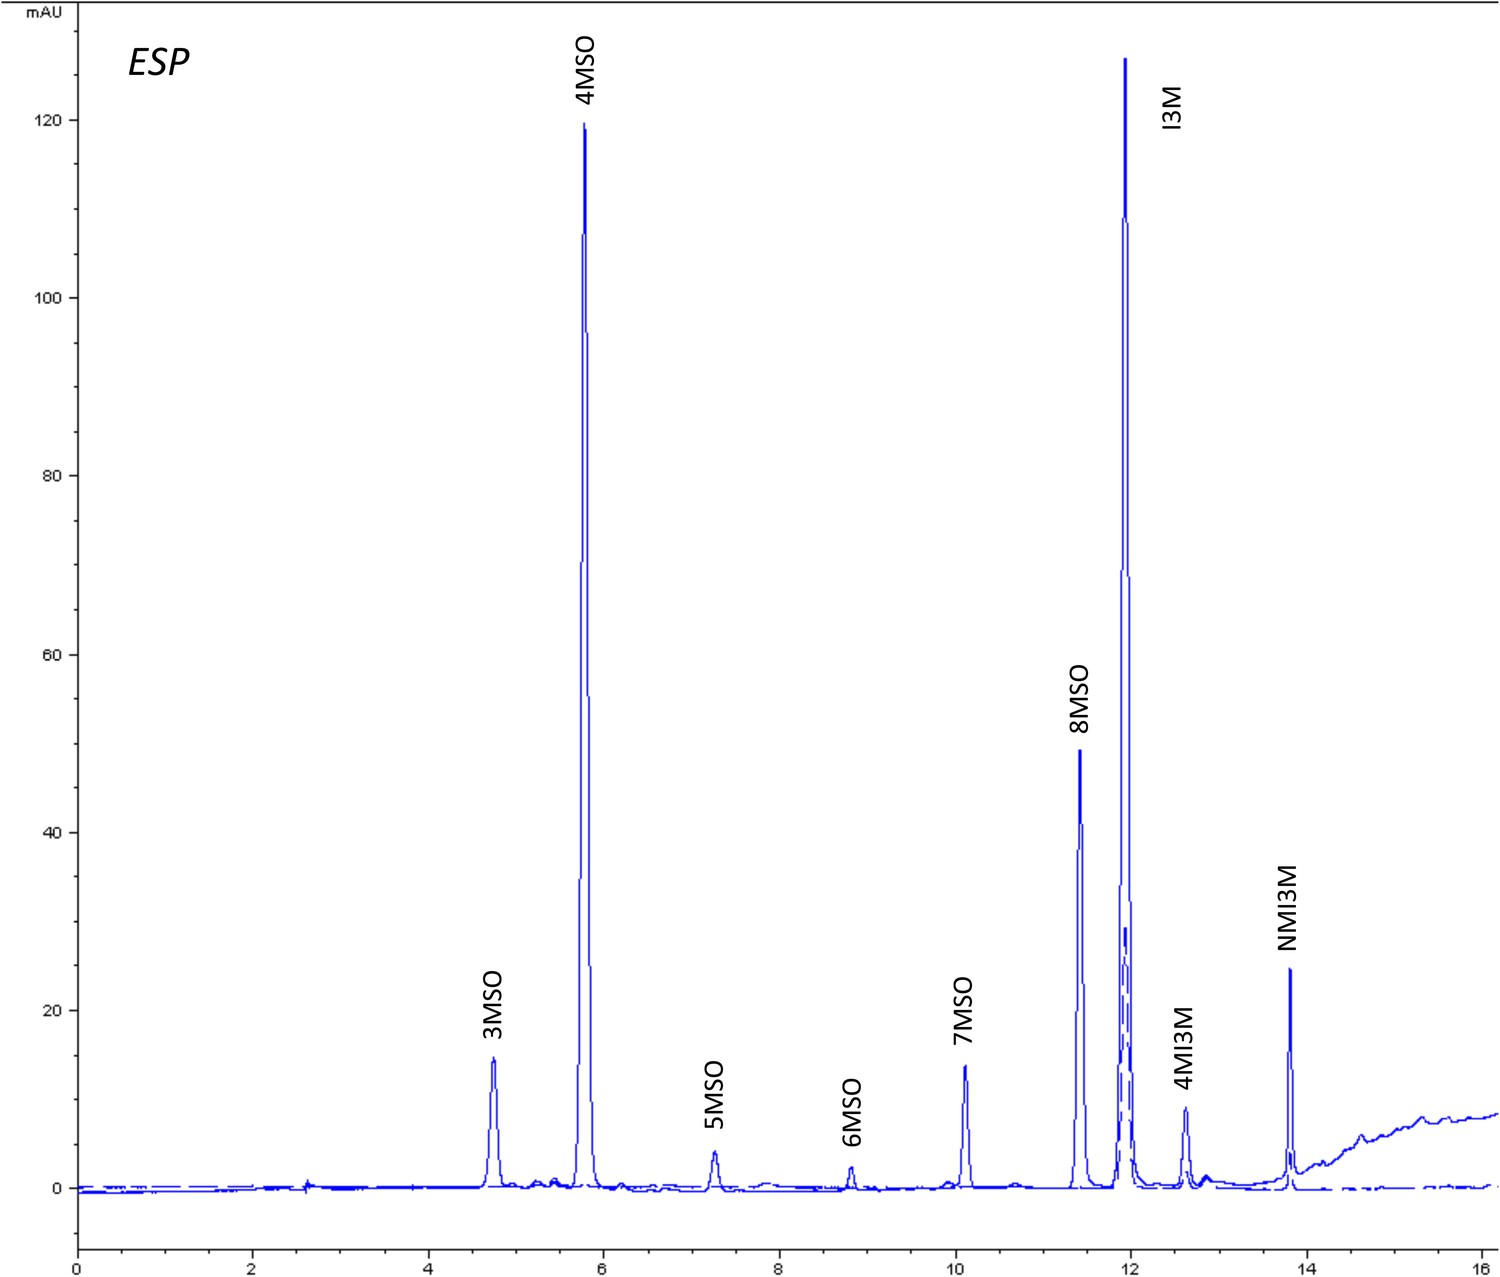
HPLC trace of Arabidopsis thaliana accession Columbia-0 ESP genotype.
Shown is an HPLC trace from a representative individual of field-grown ESP genotype that depicts the GSL profile found within the leaves of this genotype. The mixture of various GSL structures present within the leaf and the relative amounts of each constitute the GSL profile in an individual. 3MSO = 3-Methylsulfinylpropyl glucosinolate (GSL), 4MSO = 4-Methylsulfinylbutyl GSL, 5MSO = 5-Methylsulfinylpentyl GSL, 6MSO = 6-Methylsulfinylhexyl GSL, 7MSO = 7-Methylsulfinylheptyl GSL, 8MSO = 8-Methylsulfinyloctyl GSL, I3M = Indol-3-ylmethyl GSL, 4MI3M = 4-Methoxyindol-3-ylmethyl GSL, NMI3M = 1-Methoxyindol-3-ylmethyl GSL.
Figure 1—figure supplement 9
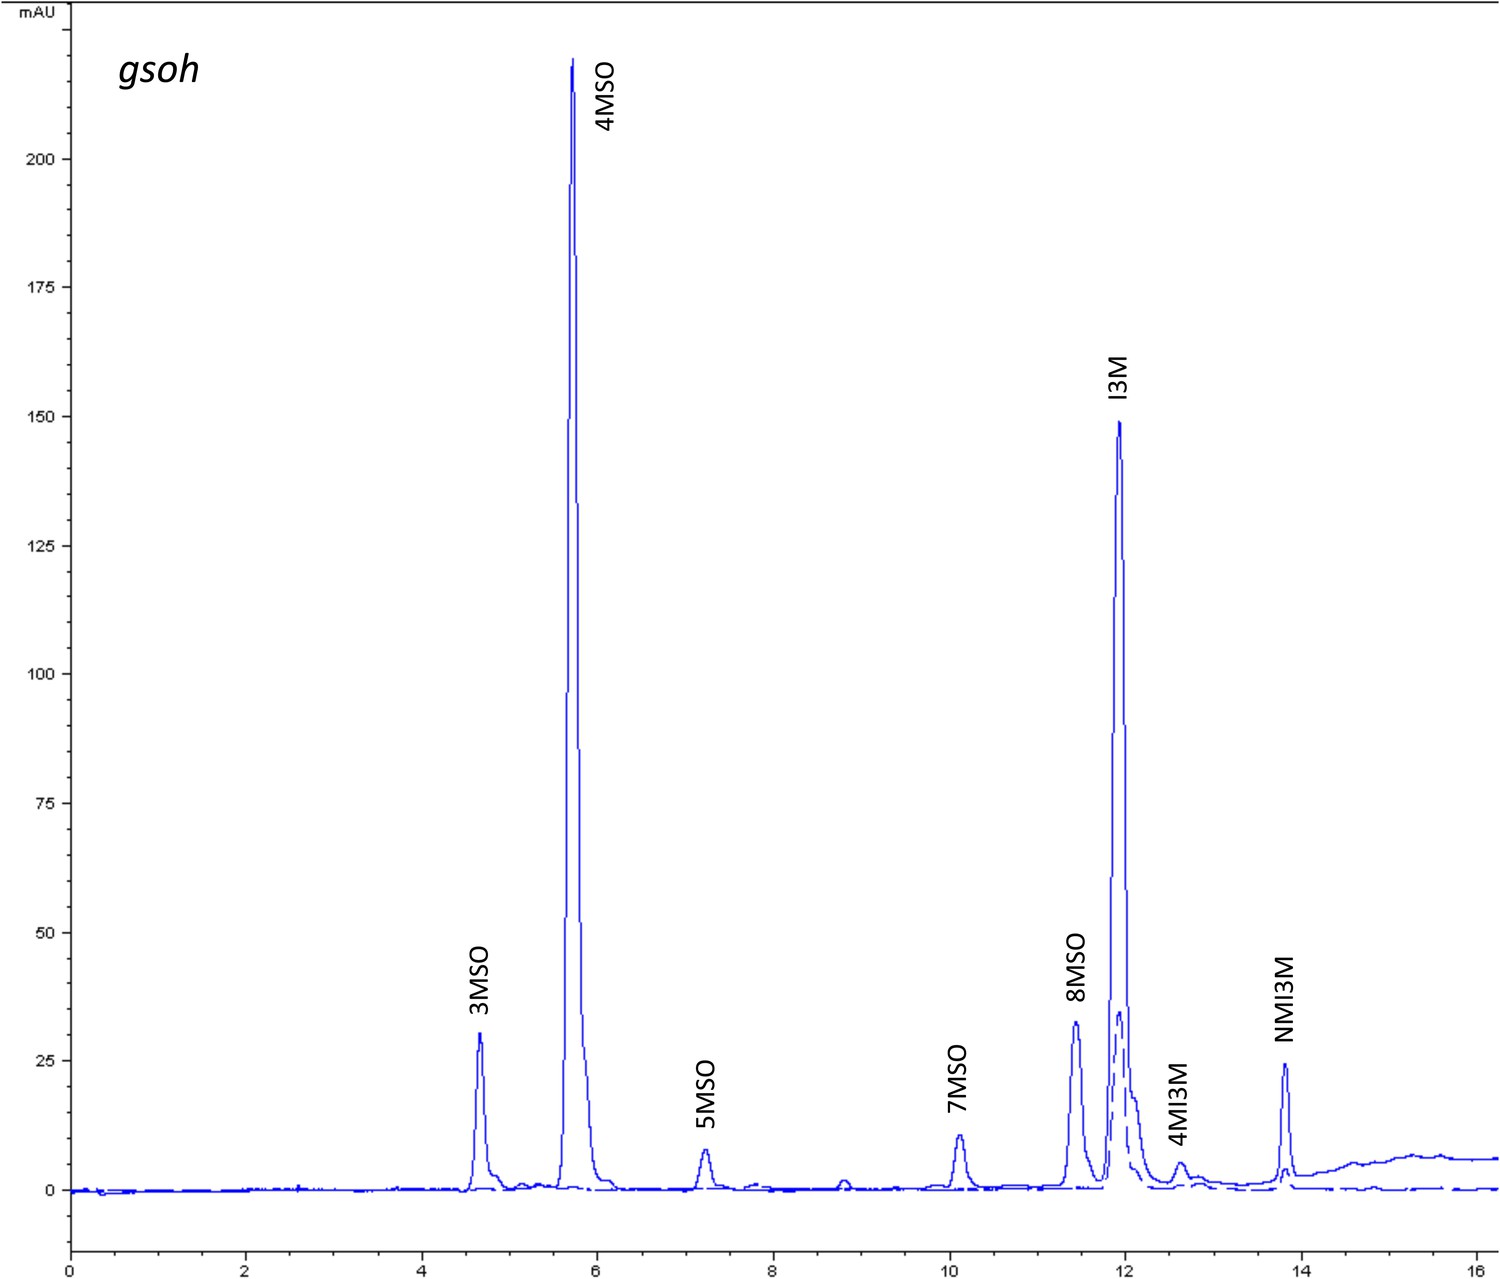
HPLC trace of Arabidopsis thaliana accession Columbia-0 gsoh genotype.
Shown is an HPLC trace from a representative individual of field-grown gsoh genotype that depicts the GSL profile found within the leaves of this genotype. The mixture of various GSL structures present within the leaf and the relative amounts of each constitute the GSL profile in an individual. 3MSO = 3-Methylsulfinylpropyl glucosinolate (GSL), 4MSO = 4-Methylsulfinylbutyl GSL, 5MSO = 5-Methylsulfinylpentyl GSL, But-3-enyl = But-3-enyl GSL, 7MSO = 7-Methylsulfinylheptyl GSL, 8MSO = 8-Methylsulfinyloctyl GSL, I3M = Indol-3-ylmethyl GSL, 4MI3M = 4-Methoxyindol-3-ylmethyl GSL, NMI3M = 1-Methoxyindol-3-ylmethyl GSL.
Figure 1—figure supplement 10
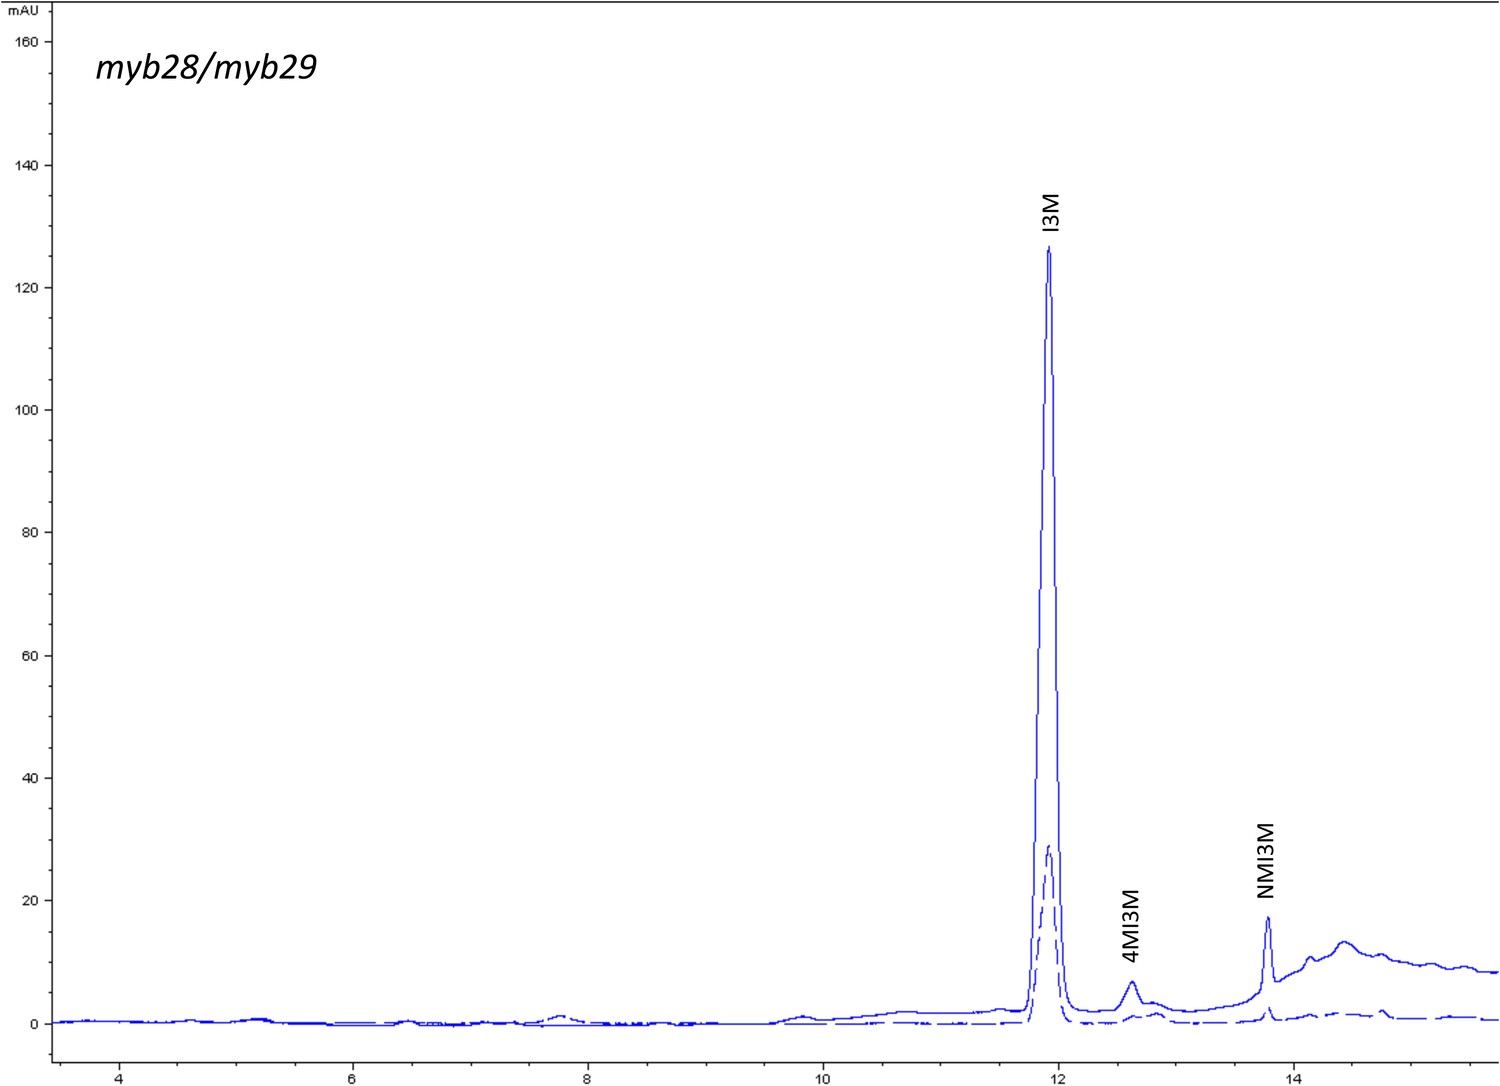
HPLC trace of Arabidopsis thaliana accession Columbia-0 myb28/myb29 genotype.
Shown is an HPLC trace from a representative individual of field-grown myb28/myb29 genotype that depicts the GSL profile found within the leaves of this genotype. The mixture of various GSL structures present within the leaf and the relative amounts of each constitute the GSL profile in an individual. I3M = Indol-3-ylmethyl GSL, 4MI3M = 4-Methoxyindol-3-ylmethyl GSL, NMI3M = 1-Methoxyindol-3-ylmethyl GSL.
Figure 1—figure supplement 11
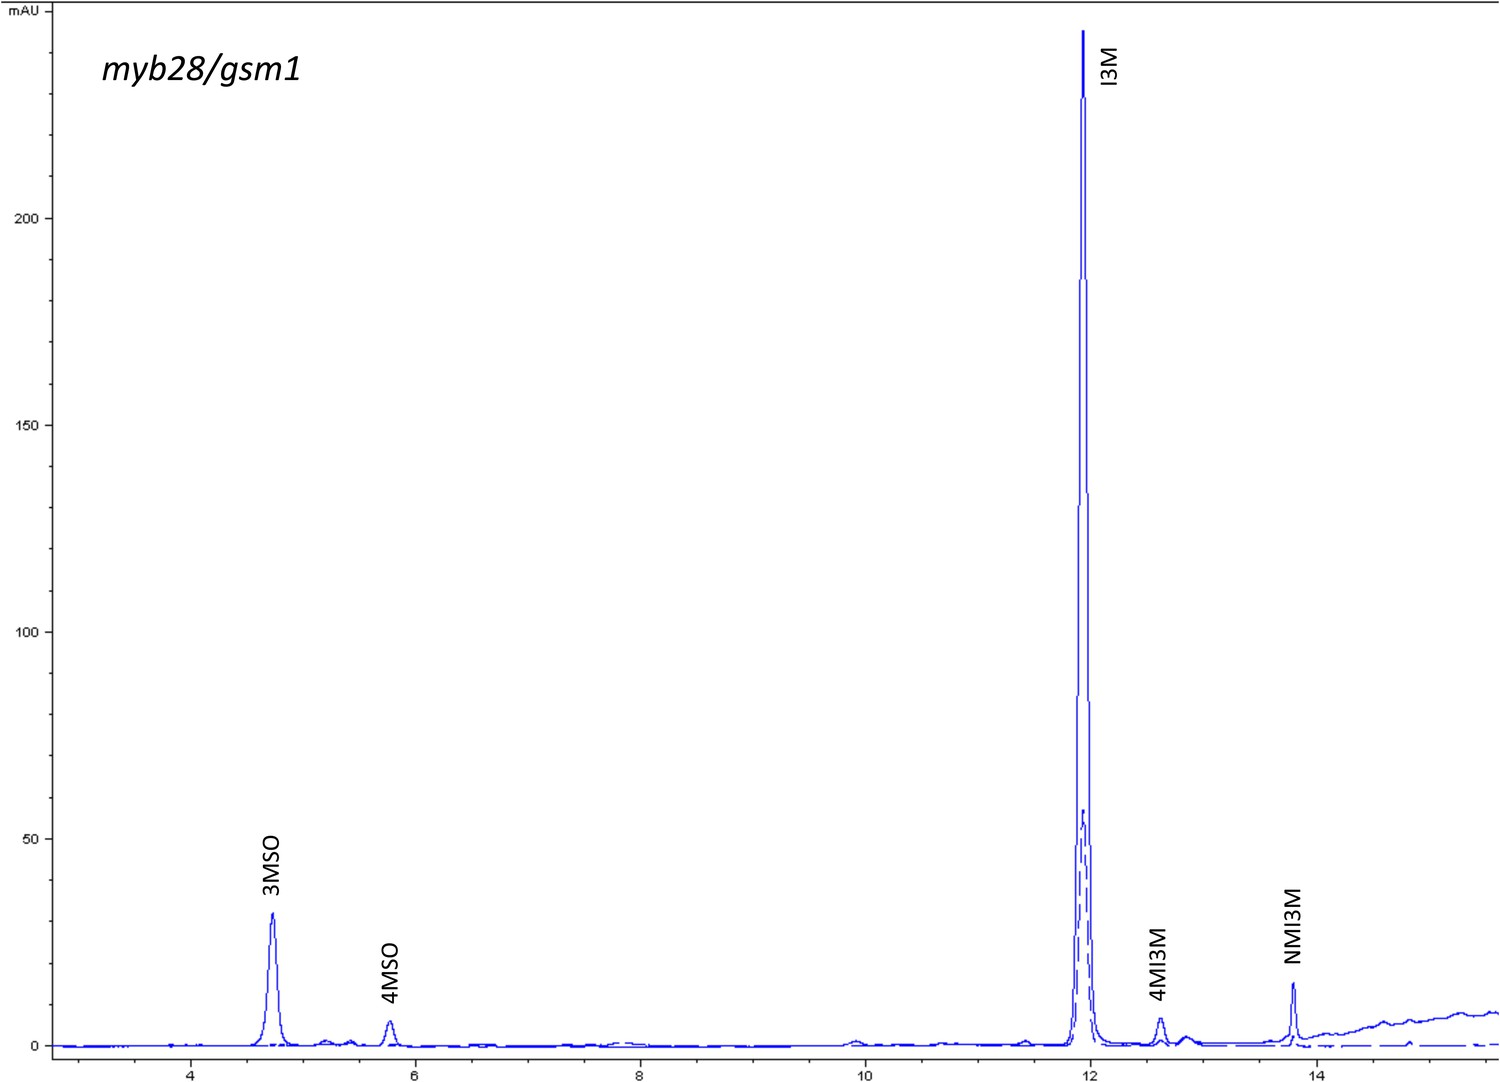
HPLC trace of Arabidopsis thaliana accession Columbia-0 myb28/gsm1 genotype.
Shown is an HPLC trace from a representative individual of field-grown myb28/gsm1 genotype that depicts the GSL profile found within the leaves of this genotype. The mixture of various GSL structures present within the leaf and the relative amounts of each constitute the GSL profile in an individual. 3MSO = 3-Methylsulfinylpropyl glucosinolate (GSL), 4MSO = 4-Methylsulfinylbutyl GSL, I3M = Indol-3-ylmethyl GSL, 4MI3M = 4-Methoxyindol-3-ylmethyl GSL, NMI3M = 1-Methoxyindol-3-ylmethyl GSL.
Figure 1—figure supplement 12
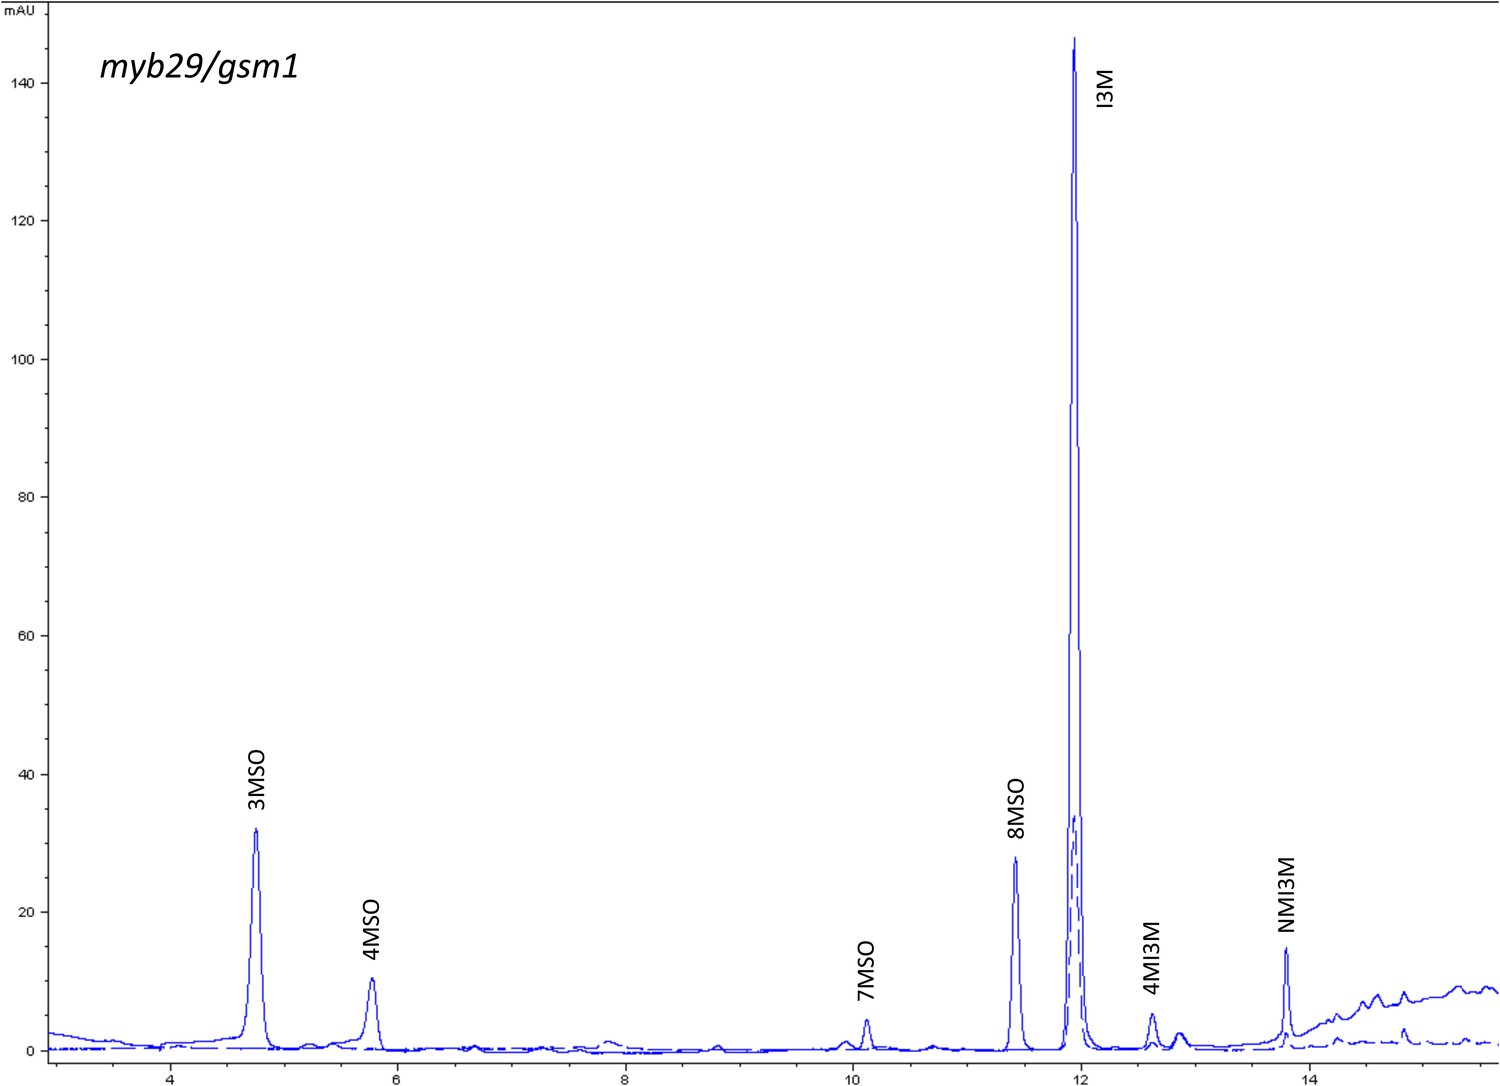
HPLC trace of Arabidopsis thaliana accession Columbia-0 myb29/gsm1 genotype.
Shown is an HPLC trace from a representative individual of field-grown myb29/gsm1 genotype that depicts the GSL profile found within the leaves of this genotype. The mixture of various GSL structures present within the leaf and the relative amounts of each constitute the GSL profile in an individual. 3MSO = 3-Methylsulfinylpropyl glucosinolate (GSL), 4MSO = 4-Methylsulfinylbutyl GSL, 7MSO = 7-Methylsulfinylheptyl GSL, 8MSO = 8-Methylsulfinyloctyl GSL, I3M = Indol-3-ylmethyl GSL, 4MI3M = 4-Methoxyindol-3-ylmethyl GSL, NMI3M = 1-Methoxyindol-3-ylmethyl GSL.
Figure 1—figure supplement 13
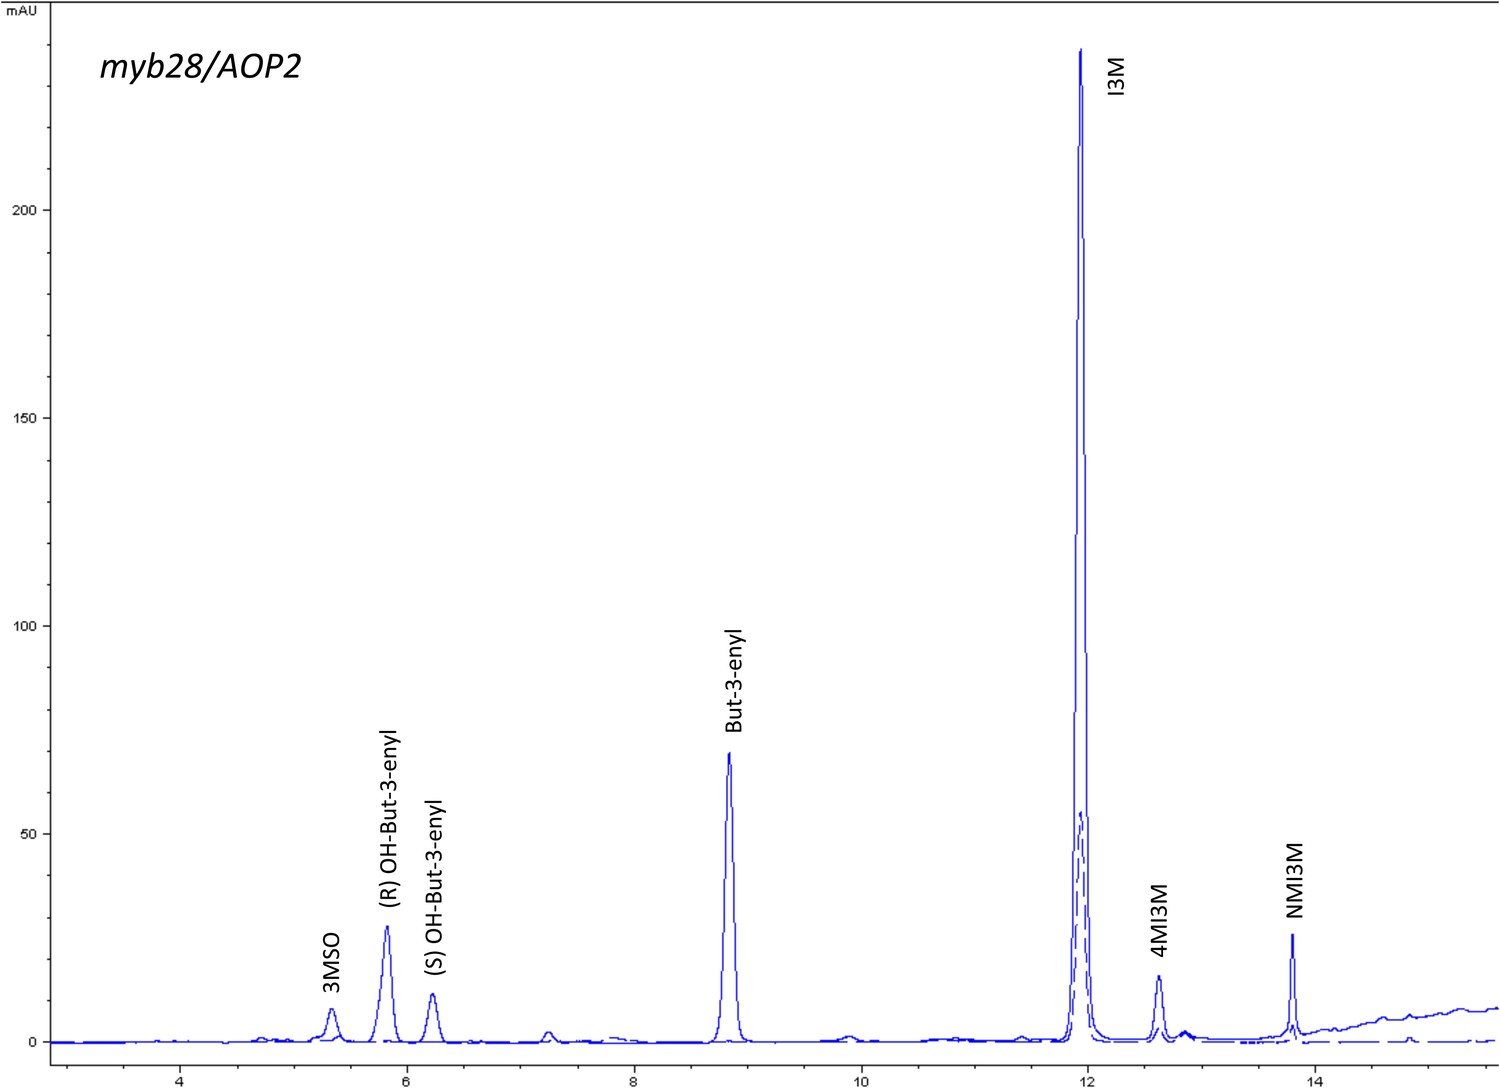
HPLC trace of Arabidopsis thaliana accession Columbia-0 myb28/AOP2 genotype.
Shown is an HPLC trace from a representative individual of field-grown myb28/AOP2 genotype that depicts the GSL profile found within the leaves of this genotype. The mixture of various GSL structures present within the leaf and the relative amounts of each constitute the GSL profile in an individual. 3MSO = 3-Methylsulfinylpropyl glucosinolate (GSL), (R) OH-But-3-enyl = (R) OH-But-3-enyl GSL, (S) OH-But-3-enyl = (S) OH-But-3-enyl GSL, But-3-enyl = But-3-enyl GSL, I3M = Indol-3-ylmethyl GSL, 4MI3M = 4-Methoxyindol-3-ylmethyl GSL, NMI3M = 1-Methoxyindol-3-ylmethyl GSL.
Figure 1—figure supplement 14
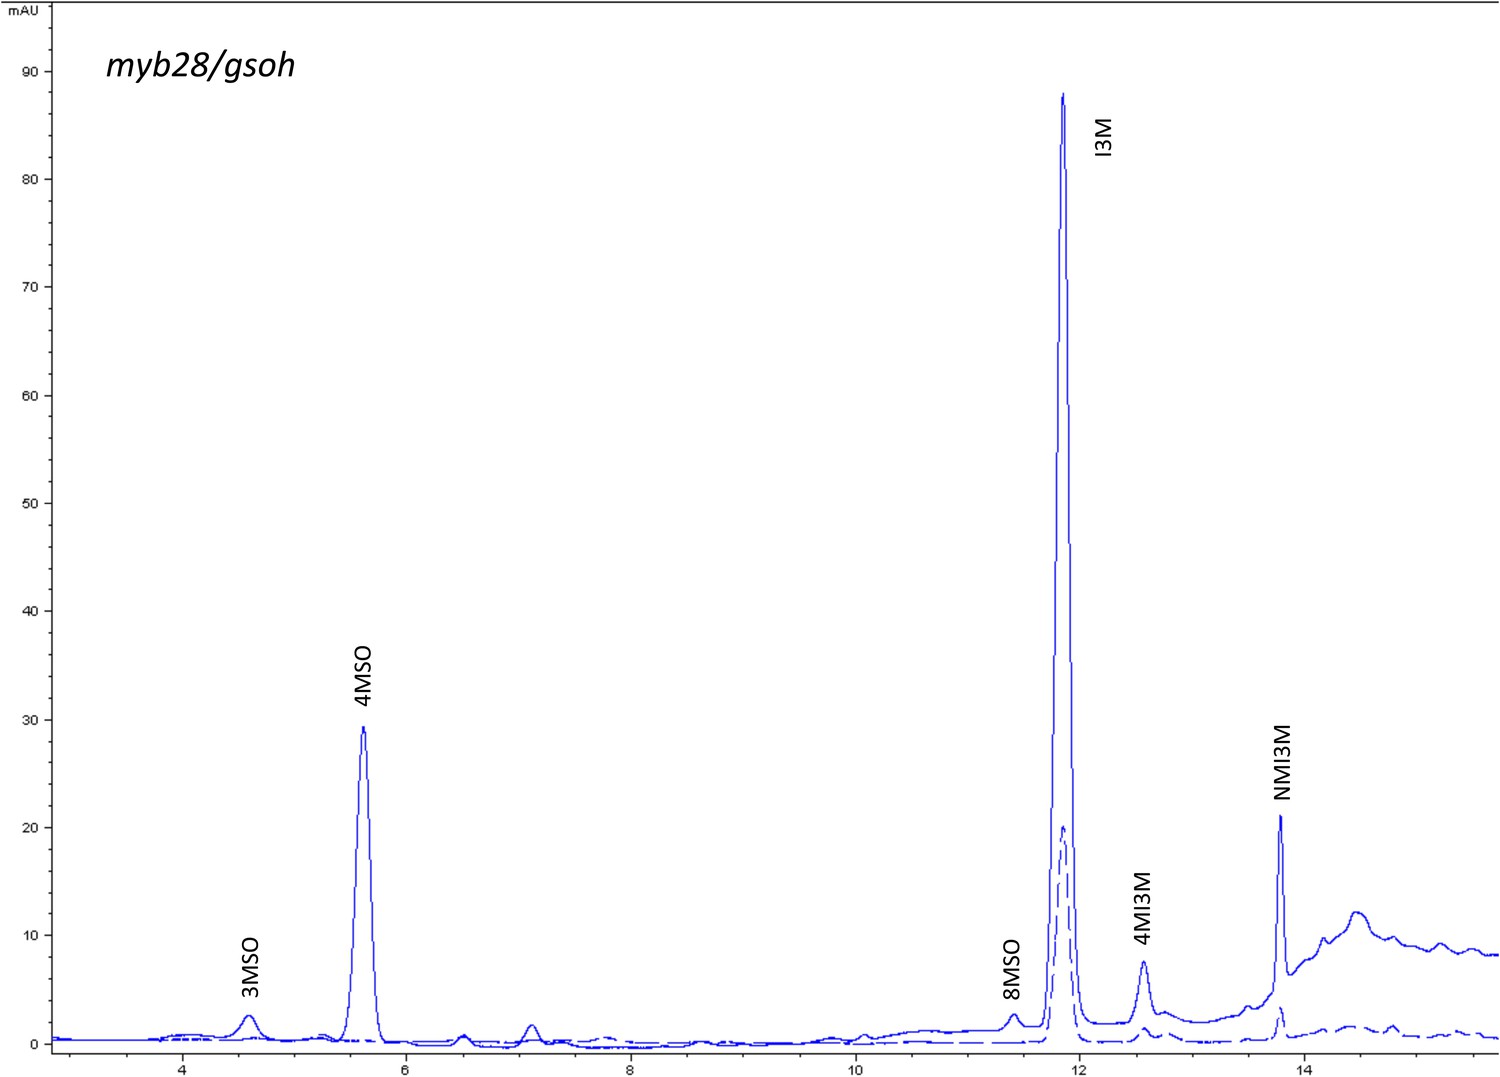
HPLC trace of Arabidopsis thaliana accession Columbia-0 myb28/gsoh genotype.
Shown is an HPLC trace from a representative individual of field-grown myb28/gsoh genotype that depicts the GSL profile found within the leaves of this genotype. The mixture of various GSL structures present within the leaf and the relative amounts of each constitute the GSL profile in an individual. 3MSO = 3-Methylsulfinylpropyl glucosinolate (GSL), 4MSO = 4-Methylsulfinylbutyl GSL, 8MSO = 8-Methylsulfinyloctyl GSL, I3M = Indol-3-ylmethyl GSL, 4MI3M = 4-Methoxyindol-3-ylmethyl GSL, NMI3M = 1-Methoxyindol-3-ylmethyl GSL.
Figure 1—figure supplement 15
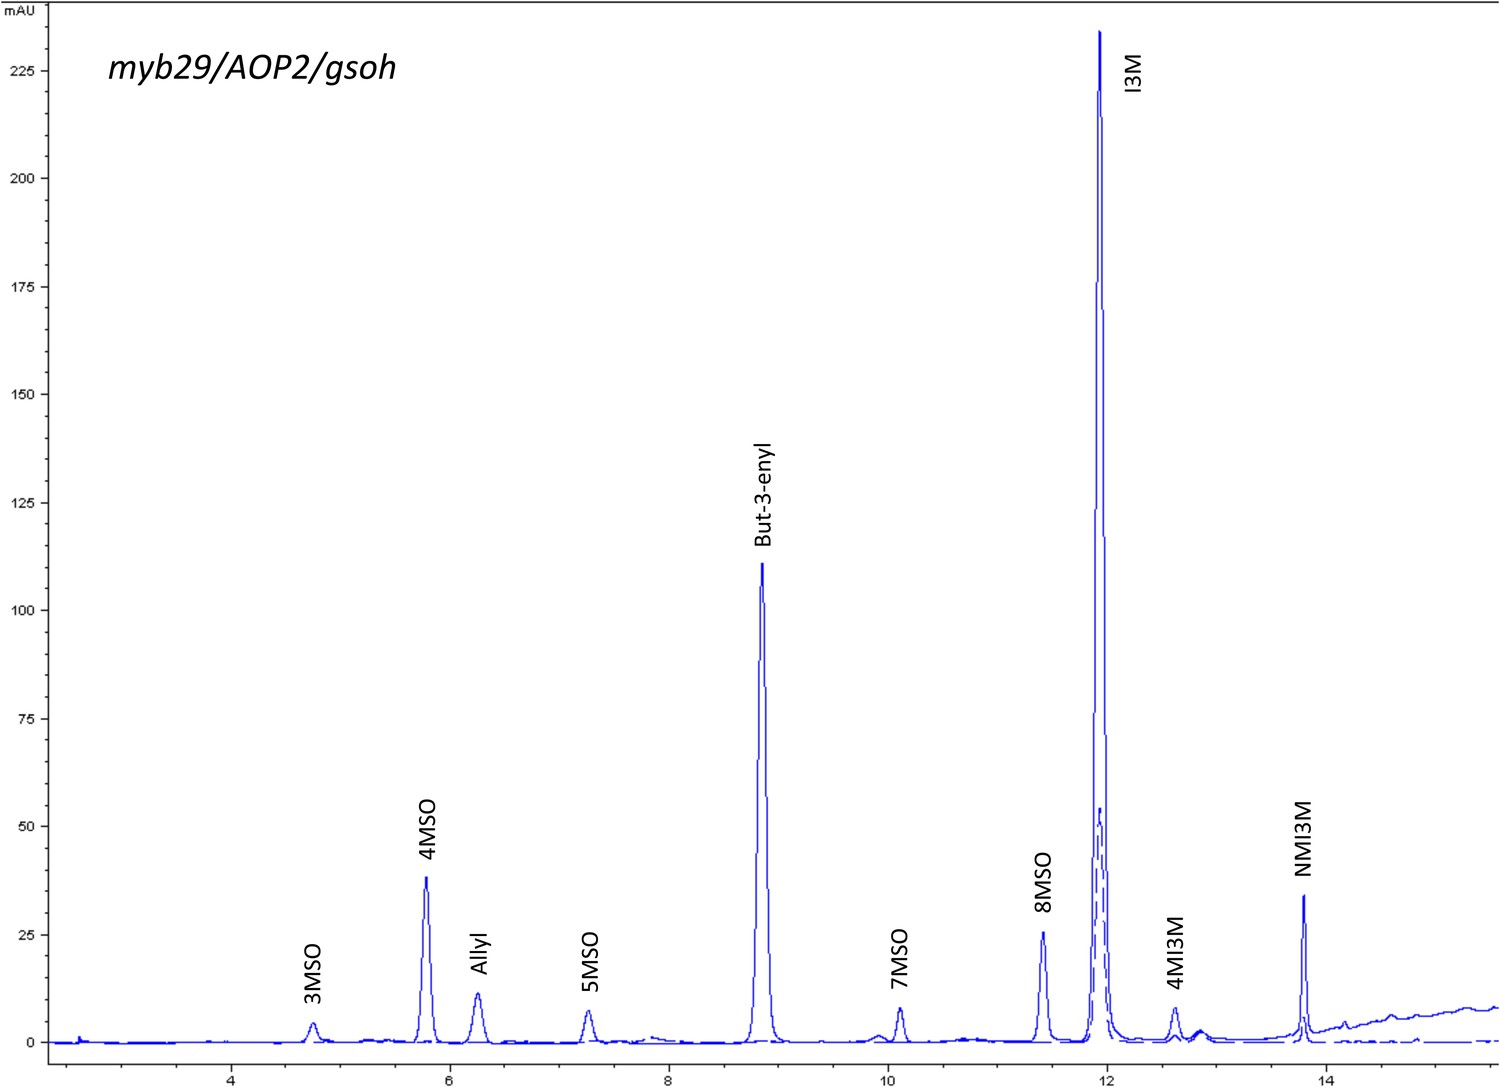
HPLC trace of Arabidopsis thaliana accession Columbia-0 myb29/AOP2/gsoh genotype.
Shown is an HPLC trace from a representative individual of field-grown myb29/AOP2/gsoh genotype that depicts the GSL profile found within the leaves of this genotype. The mixture of various GSL structures present within the leaf and the relative amounts of each constitute the GSL profile in an individual. 3MSO = 3-Methylsulfinylpropyl glucosinolate (GSL), 4MSO = 4-Methylsulfinylbutyl GSL, Allyl = Allyl (Propenyl) GSL, 5MSO = 5-Methylsulfinylpentyl GSL, But-3-enyl = But-3-enyl GSL, 7MSO = 7-Methylsulfinylheptyl GSL, 8MSO = 8-Methylsulfinyloctyl GSL, I3M = Indol-3-ylmethyl GSL, 4MI3M = 4-Methoxyindol-3-ylmethyl GSL, NMI3M = 1-Methoxyindol-3-ylmethyl GSL.
Figure 1—figure supplement 16
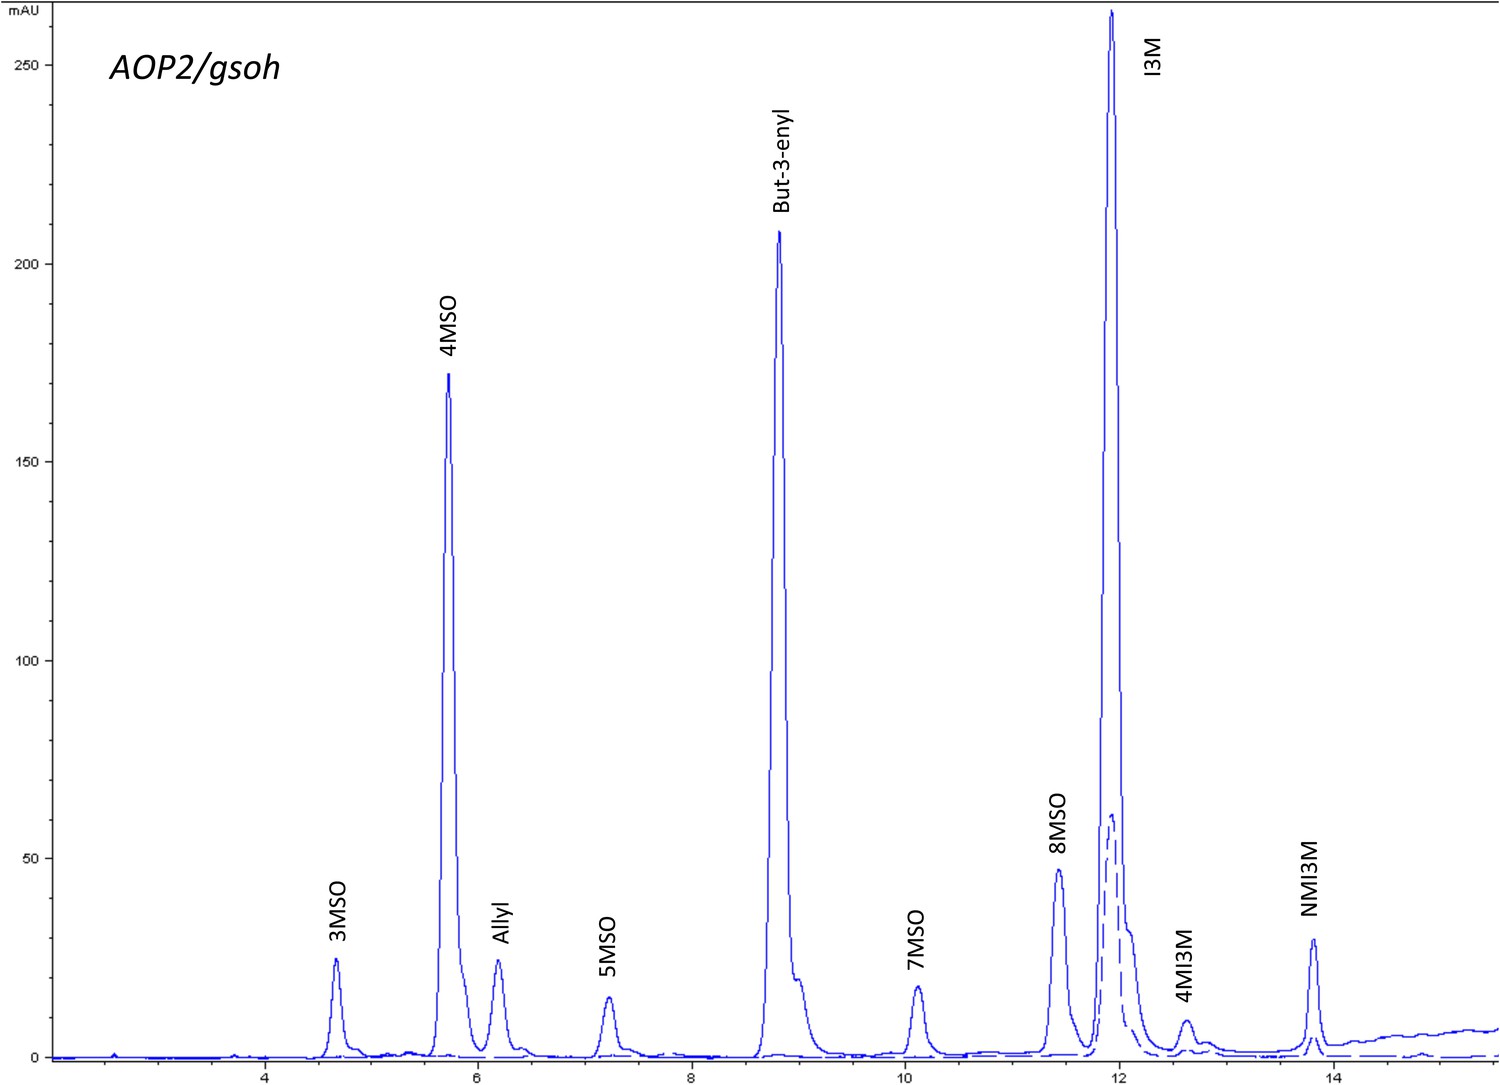
HPLC trace of Arabidopsis thaliana accession Columbia-0 AOP2/gsoh genotype.
Shown is an HPLC trace from a representative individual of field-grown AOP2/gsoh genotype that depicts the GSL profile found within the leaves of this genotype. The mixture of various GSL structures present within the leaf and the relative amounts of each constitute the GSL profile in an individual. 3MSO = 3-Methylsulfinylpropyl glucosinolate (GSL), 4MSO = 4-Methylsulfinylbutyl GSL, Allyl = Allyl (Propenyl) GSL, 5MSO = 5-Methylsulfinylpentyl GSL, But-3-enyl = But-3-enyl GSL, 7MSO = 7-Methylsulfinylheptyl GSL, 8MSO = 8-Methylsulfinyloctyl GSL, I3M = Indol-3-ylmethyl GSL, 4MI3M = 4-Methoxyindol-3-ylmethyl GSL, NMI3M = 1-Methoxyindol-3-ylmethyl GSL.
Figure 1—figure supplement 17
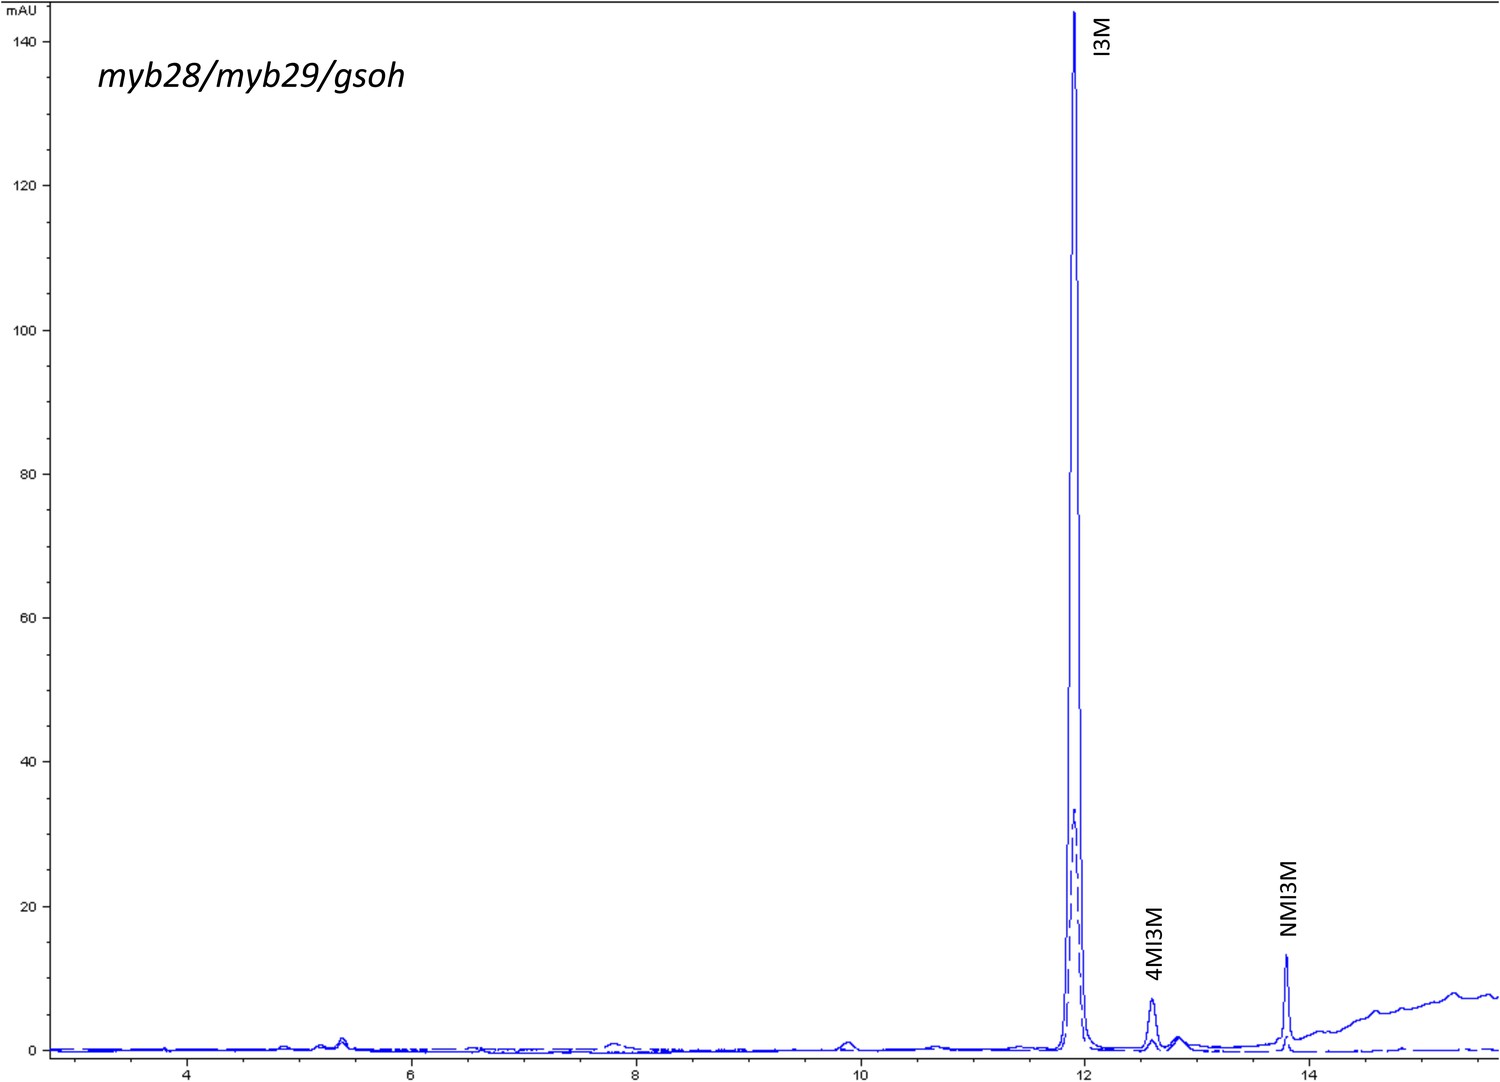
HPLC trace of Arabidopsis thaliana accession Columbia-0 myb28/myb29/gsoh genotype.
Shown is an HPLC trace from a representative individual of field-grown myb28/myb29/gsoh genotype that depicts the GSL profile found within the leaves of this genotype. The mixture of various GSL structures present within the leaf and the relative amounts of each constitute the GSL profile in an individual. I3M = Indol-3-ylmethyl GSL, 4MI3M = 4-Methoxyindol-3-ylmethyl GSL, NMI3M = 1-Methoxyindol-3-ylmethyl GSL.
Figure 2
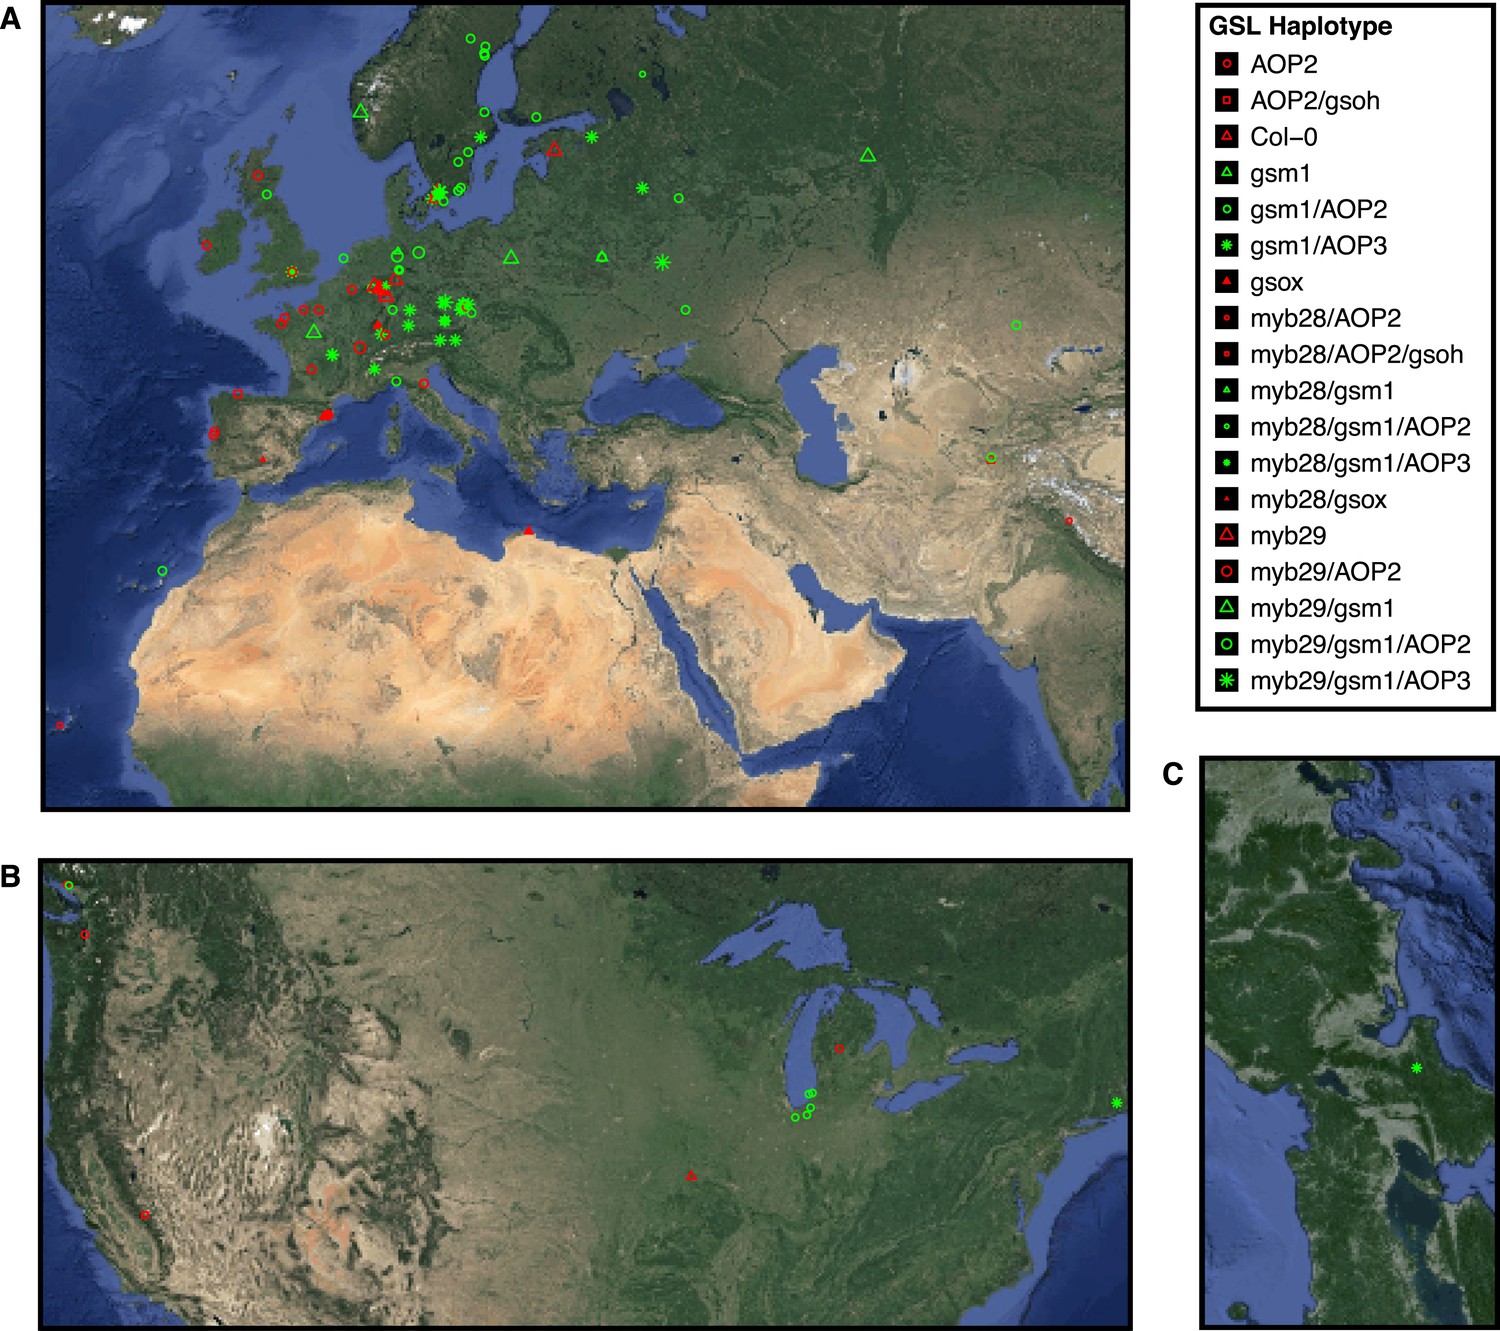
Globally distributed collection of Arabidopsis thaliana accessions that vary with respect to GSL haplotype.
Shown are the geographic origins of 144 Arabidopsis accessions across (A) Europe and Northern Africa, (B) North America and (C) Japan, as well as their corresponding GSL haplotypes and chemotypes. GSL haplotype names correspond to allelic identity at six polymorphic loci involved in aliphatic GSL production, based on GSL profile data collected from each accession. Haplotype names use Col-0 as a reference, which is functional at four or the six loci. Symbol shape, color and size indicate GSL chemotype (i.e., phenotype based on GSL profile). Red = 3C (non-functional MAM1), green = 4C GSL (functional MAM1), triangle = MSO (non-functional AOP), square = alkenyl (functional AOP2), circle = OH-alkenyl (functional GSOH), star = OH-Propyl (functional AOP3), point size 1 = 100% accumulation of aliphatic GSL (compared to Col-0), point size 0.5 = 50% accumulation of aliphatic GSL (non-functional MYB28) and point size 1.5 = 75% accumulation of aliphatic GSL (non-functional MYB29). See Figure 2—source data 1 for table of accession geographic information, Figure 1 for schematic of biosynthetic pathway and Figure 9 for more details on the allelic state at each locus for all 18 GSL haplotypes.
-
Figure 2—source data 1
Geographic origin and GSL haplotype information for a collection of 144 Arabidopsis thaliana accessions.
Shown are the province/city and country of origin and corresponding latitude and longitude coordinates for 144 Arabidopsis accessions along with their GSL haplotypes. See Figure 2 legend for full details.
- https://doi.org/10.7554/eLife.05604.024
Figure 3
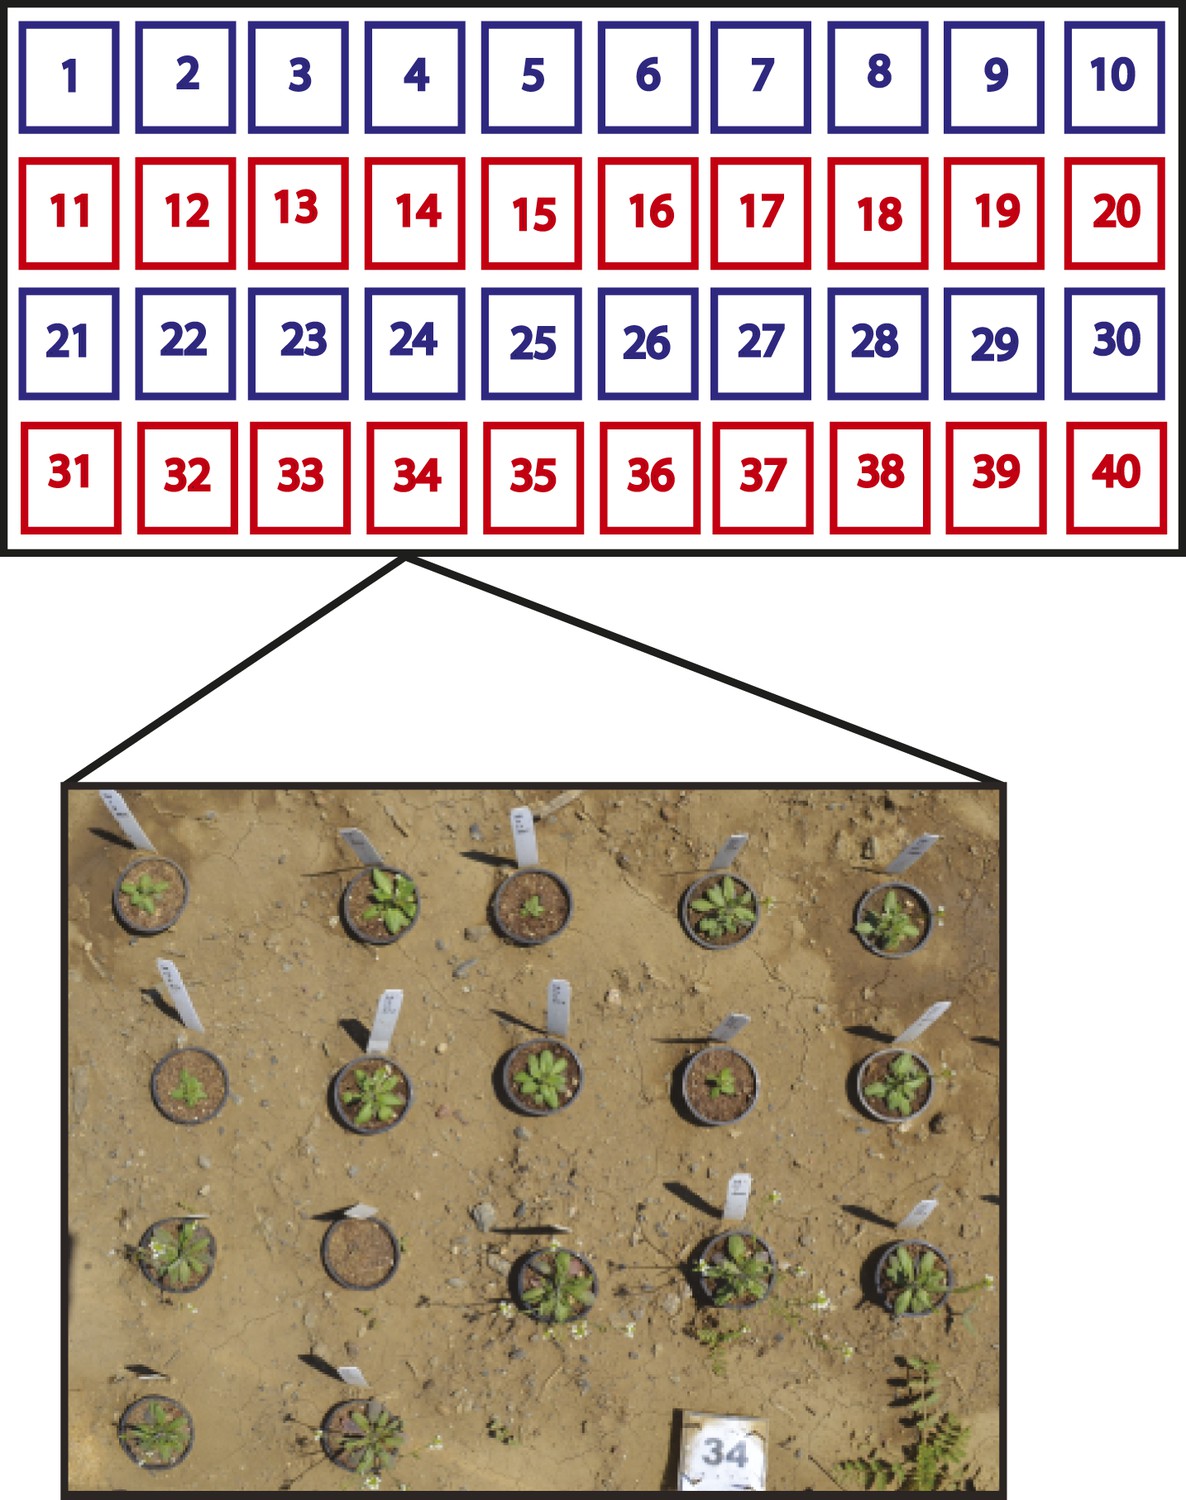
Split-plot field trial setup.
Shown is the field trial setup used in all three environments. In each environment, 40 blocks were arranged into rows of 10 blocks and each row was called a plot. Within each block, the complete set of 17 genotypes was randomly organized, for a total of 40 genotype replicates per environment. Each plot (four per environment) was placed into one of two treatment groups. The ‘− Herbivory’ treatment group received pesticide application to prevent leaf damage (shown in blue). The ‘+ Herbivory’ or control treatment group did not receive pesticide application (shown in red). This setup was repeated in each of the three environments, for a total of 120 blocks/genotype replicates and 12 plots, split between the two treatment groups. Environment and treatment were nested within plot, making this field trial setup a split-plot design. Seedlings were transplanted from the greenhouse into the field at 2 weeks of age where they were allowed to flower and then subsequently harvested for further analysis in the laboratory.
Figure 4
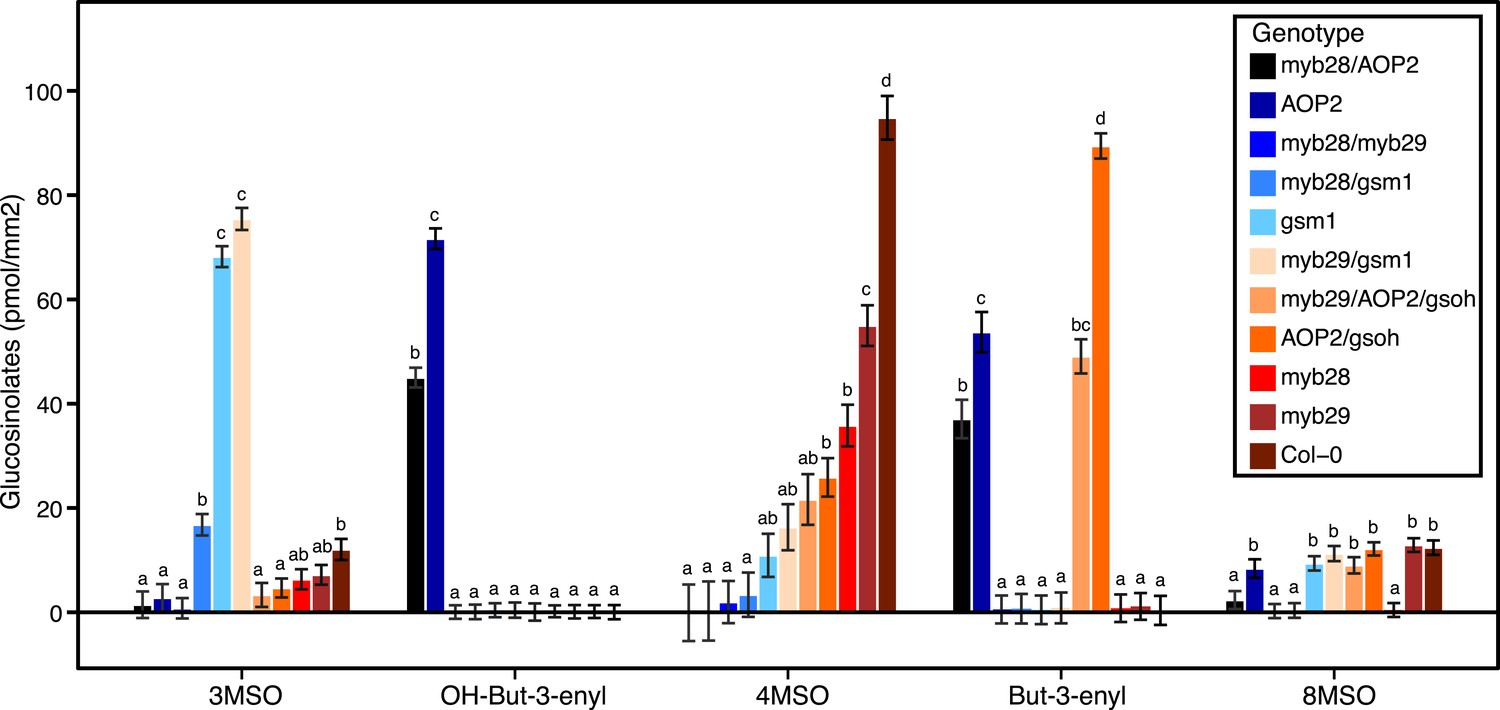
Average GSL profiles from select laboratory population genotypes grown in the field.
Shown are the genotype averages of various aliphatic GSL chemical structures from GSL genotypes grown in all three environments in the field. The GSL structures present and the corresponding abundances makeup the GSL profile of an individual. Results are based on single leaf analysis of 4 week old plants (see Table 2 for full list of GSL genotypes used in this study). Each color represents a different aliphatic GSL genotype. Error bars represent standard error of the mean. Letters represent significantly different genotypes based on Tukey's HSD. See Figure 4—source data 1 for full list of GSL genotypes used in this study and the corresponding LSMeans and SE of GSL structures produced by all GSL genotypes used in study averaged across field trials.
-
Figure 4—source data 1
LSMeans and SE of GSL structures produced by all GSL genotypes used in study averaged across field trials.
Shown are the LSMeans and SE for GSL structures produced by GSL genotypes used in this study, averaged across the three field trials. Letters correspond to significant differences based on Tukeys's HSD. See Fgiure 4 legend for full details.
- https://doi.org/10.7554/eLife.05604.030
Figure 5
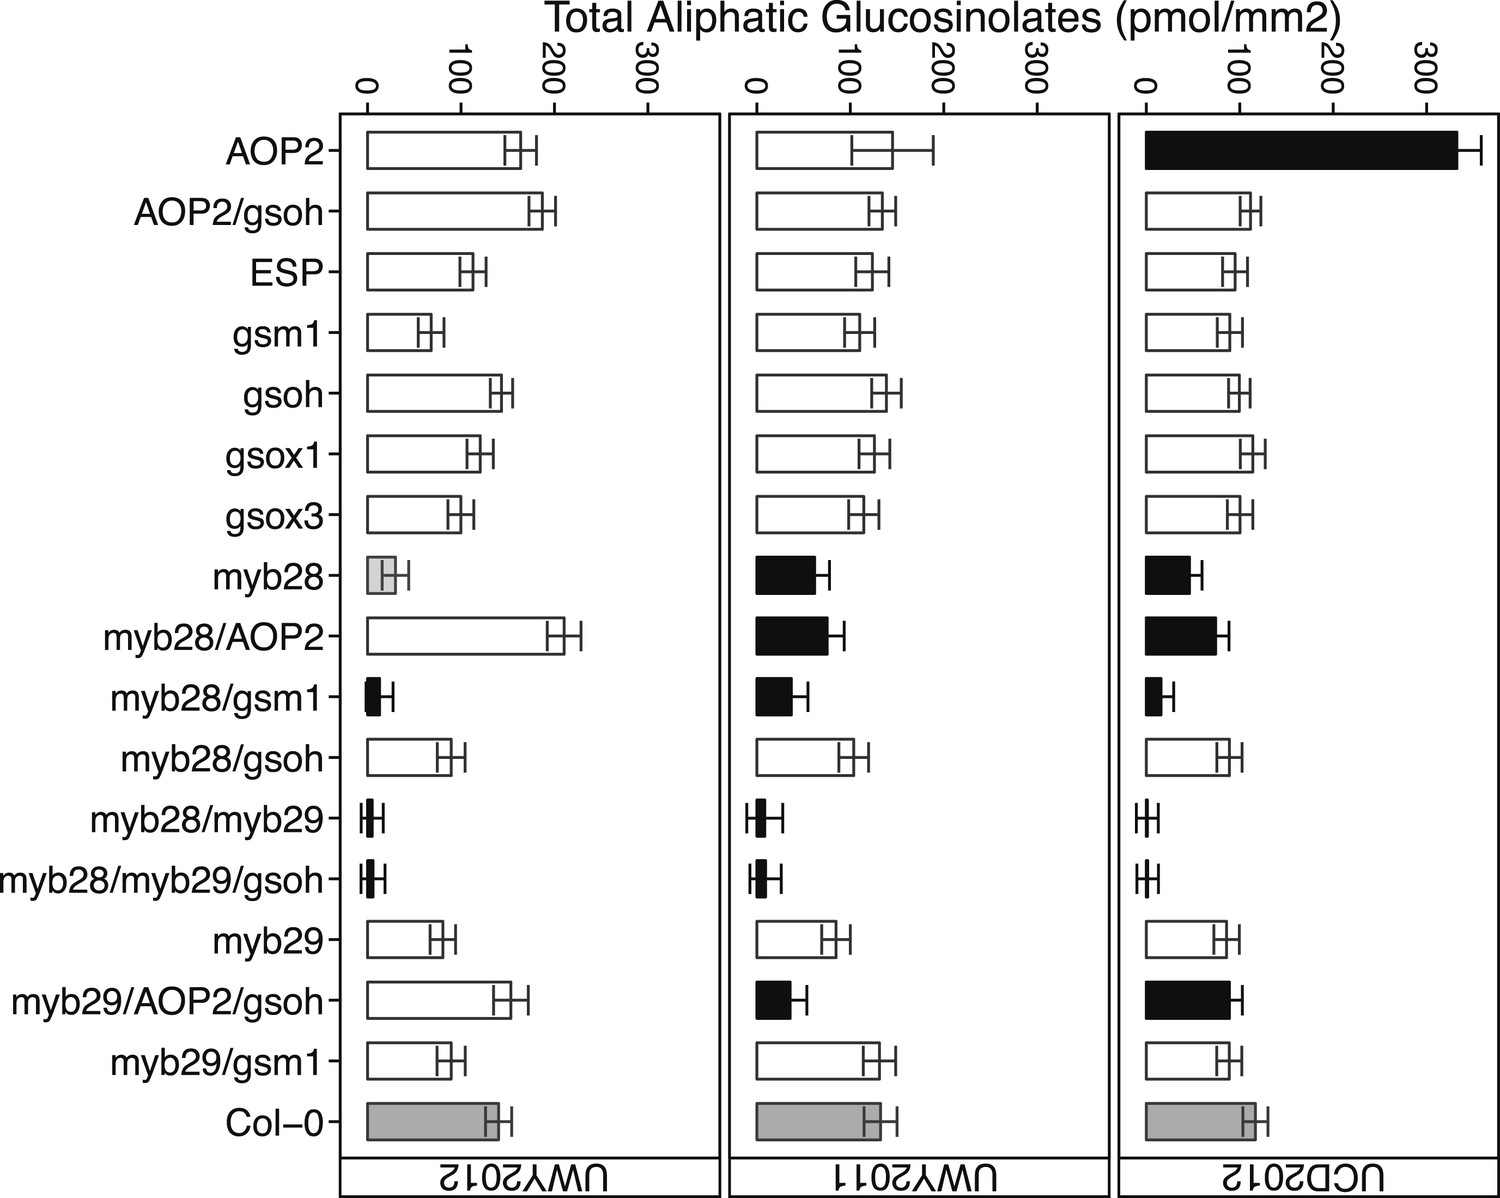
Total aliphatic GSL accumulation of GSL genotypes from the laboratory population grown in the field.
Shown are the genotype averages in all three environments of total aliphatic GSL from individuals grown in the field. Results are based on single leaf analysis of 4 week old plants. Bar color based on Dunnett's multiple comparison procedure. Within each environment, dark grey bars = Col-0 genotype, black bars = genotypes that accumulate significantly more or less total aliphatic GSL than Col-0 (p value ≤ 0.05), light grey bars = genotypes that accumulate suggestively more or less total aliphatic GSL than Col-0 (p value = 0.05–0.1) and white bars = genotypes that are not significantly different than Col-0 (p value >0.1). Error bars represent standard error of the mean.
Figure 6
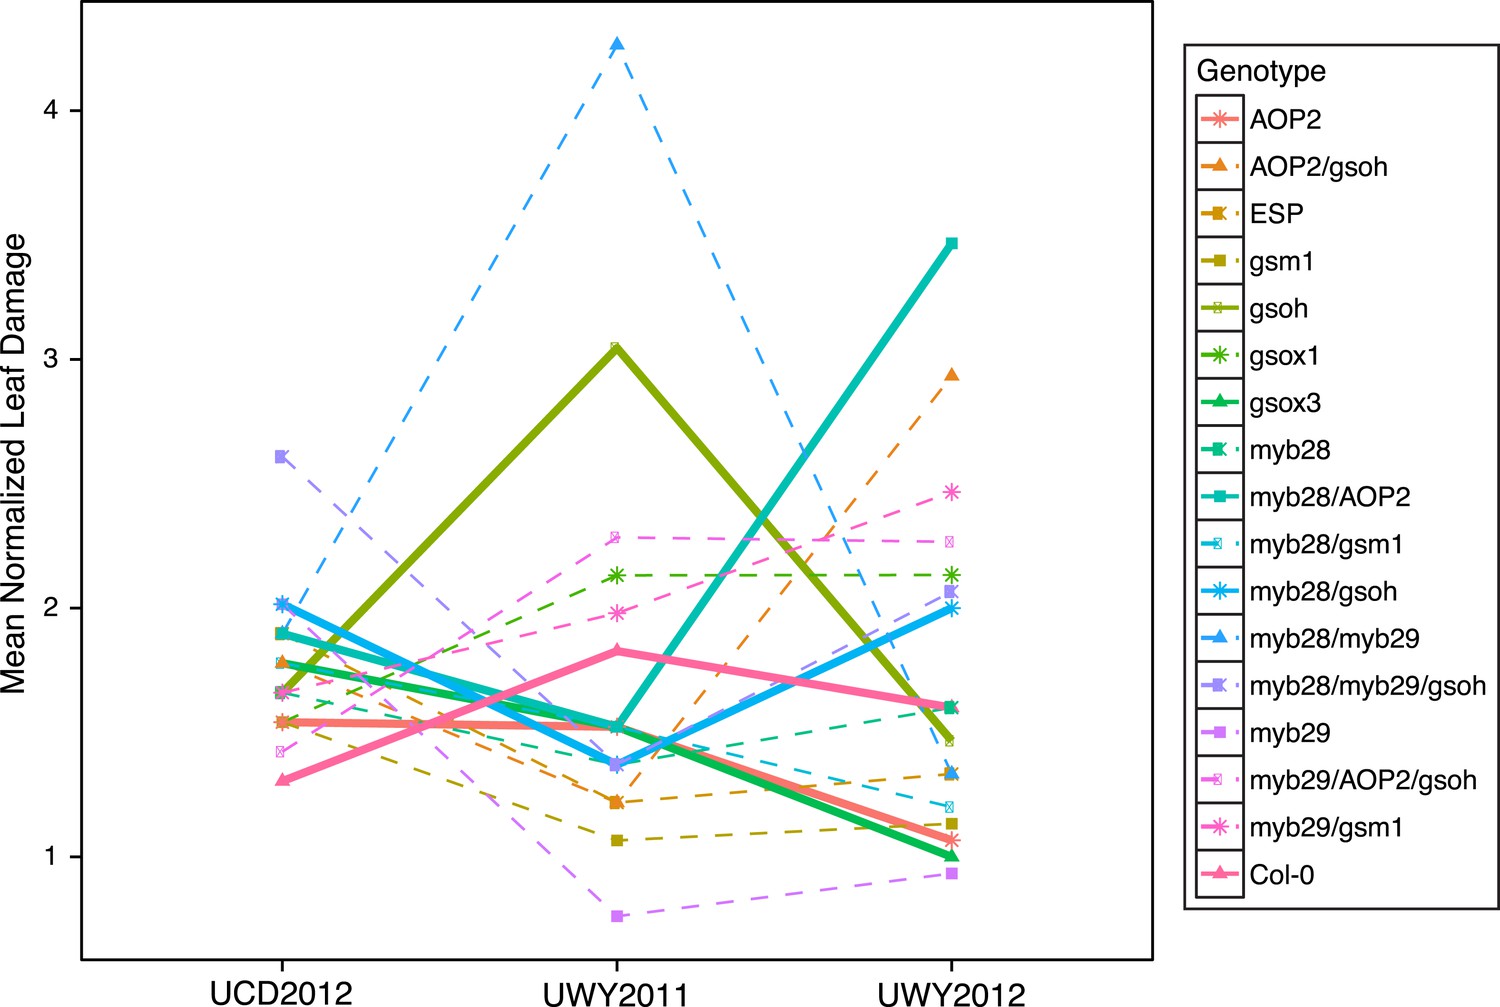
Mean normalized leaf damage of GSL genotypes from the laboratory population grown in the field.
Shown are the mean normalized genotype averages in all three environments of leaf damage from GSL genotypes grown in the field. Mean normalization was conducted by first dividing the genotype average of each GSL genotype within an environment to the corresponding environment average. Then, each normalized value was multiplied by the grand mean across all three environments. This was done in order put the leaf damage estimates in each environment on the same order of magnitude to ease visual comparisons of genotypes across environments and to highlight the fact that relative leaf damage of a given GSL genotype varies across environments.
-
Figure 6—source data 1
Mean normalized values for leaf damage in the field.
- https://doi.org/10.7554/eLife.05604.034
Figure 7 with 1 supplement
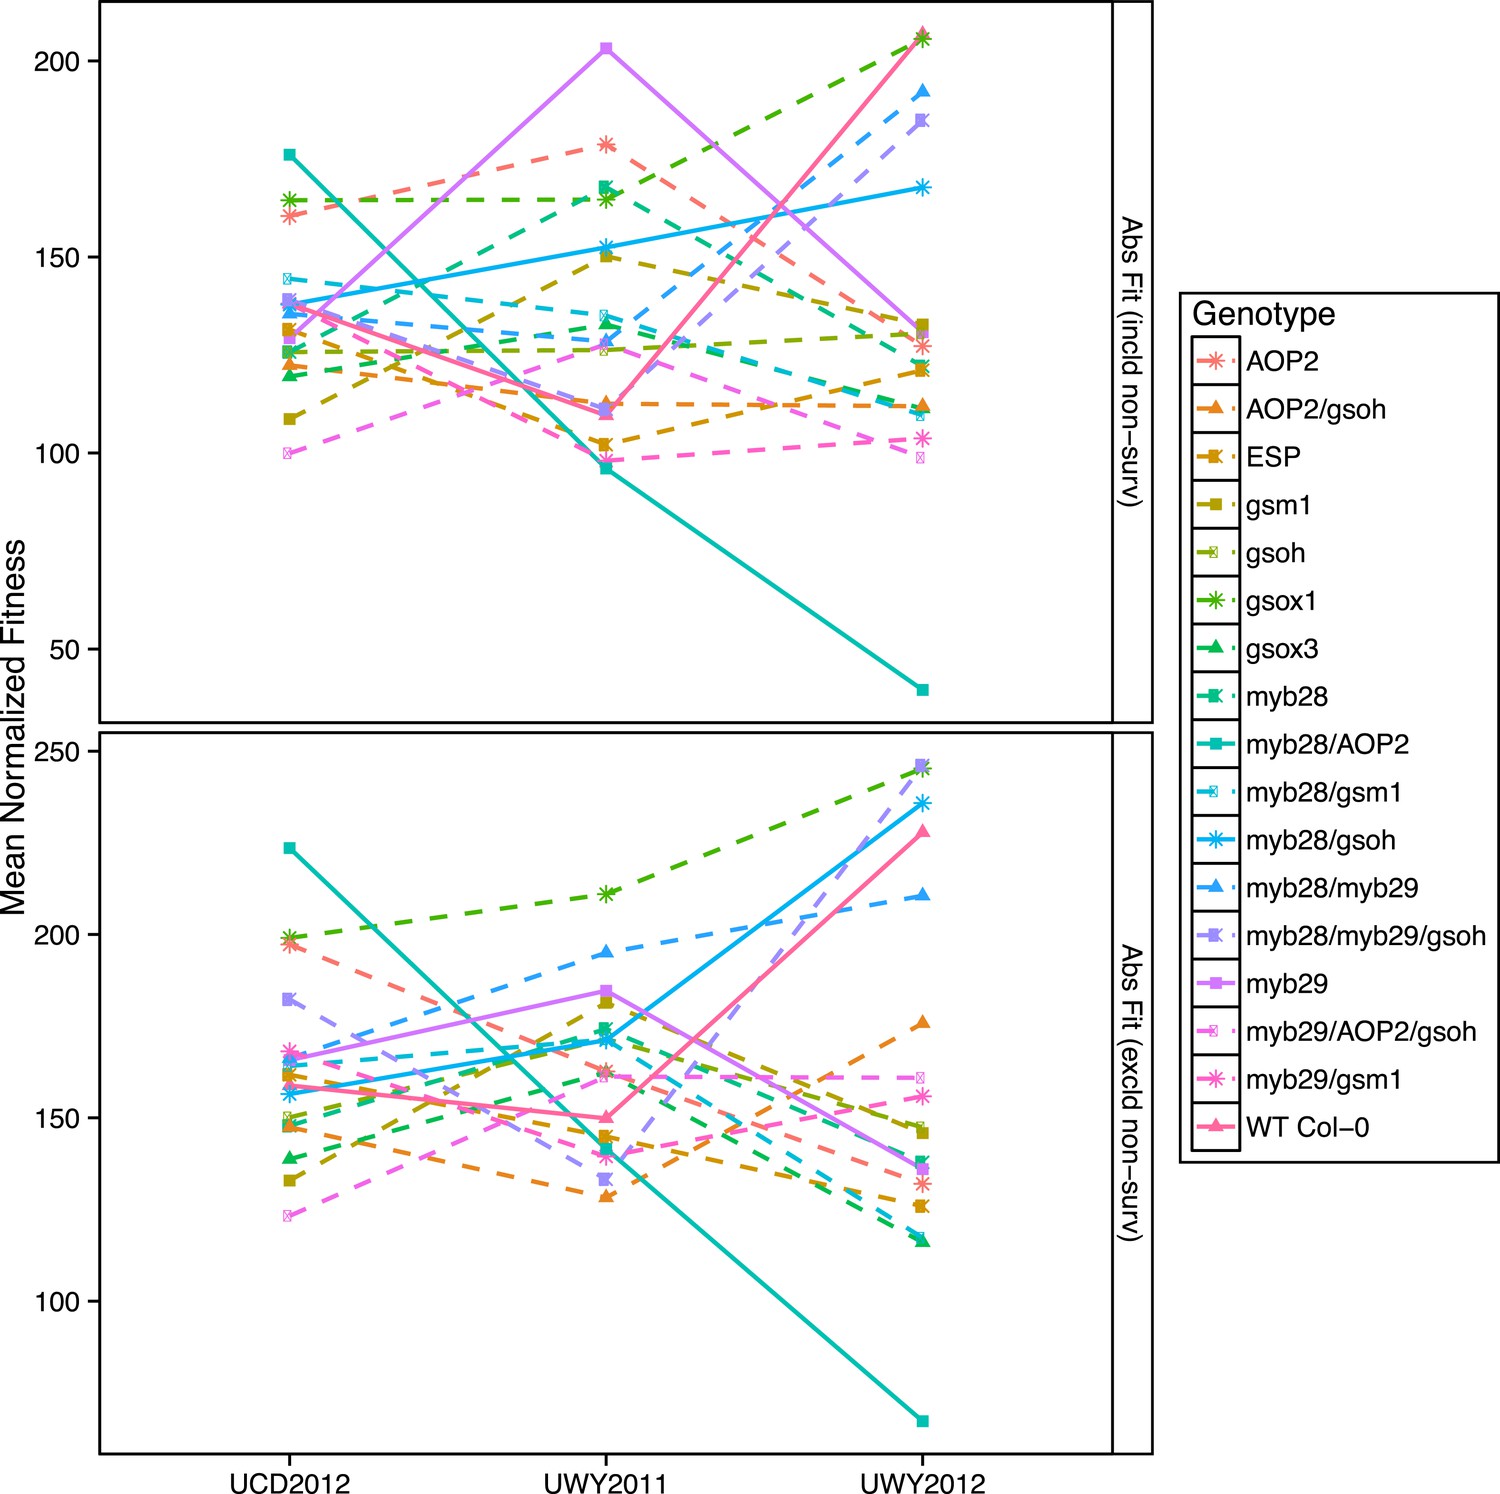
Mean normalized absolute fitness of GSL genotypes from the laboratory population grown in the field.
Shown are the mean normalized genotype averages of absolute fitness from GSL genotypes grown in all three environments calculated either including or excluding survivorship, as indicated. Absolute fitness including survivorship was calculated as total fruit count (TFC) × silique length × survivorship, whereas absolute fitness excluding survivorship was calculated as TFC × silique length for individuals that survived to harvest. Mean normalization was conducted for each phenotype by first dividing the average of each GSL genotype within an environment to the corresponding population mean for each environment. Then, each normalized value was multiplied by the grand mean across all three environments. This was done in order put the phenotype estimates in each environment on the same order of magnitude to ease visual comparisons. Solid lines represent distinct patterns that GSL genotypes display across the environments and are meant as a visual aid.
-
Figure 7—source data 1
Mean normalized values for phenotypic traits in the field.
- https://doi.org/10.7554/eLife.05604.038
Figure 7—figure supplement 1
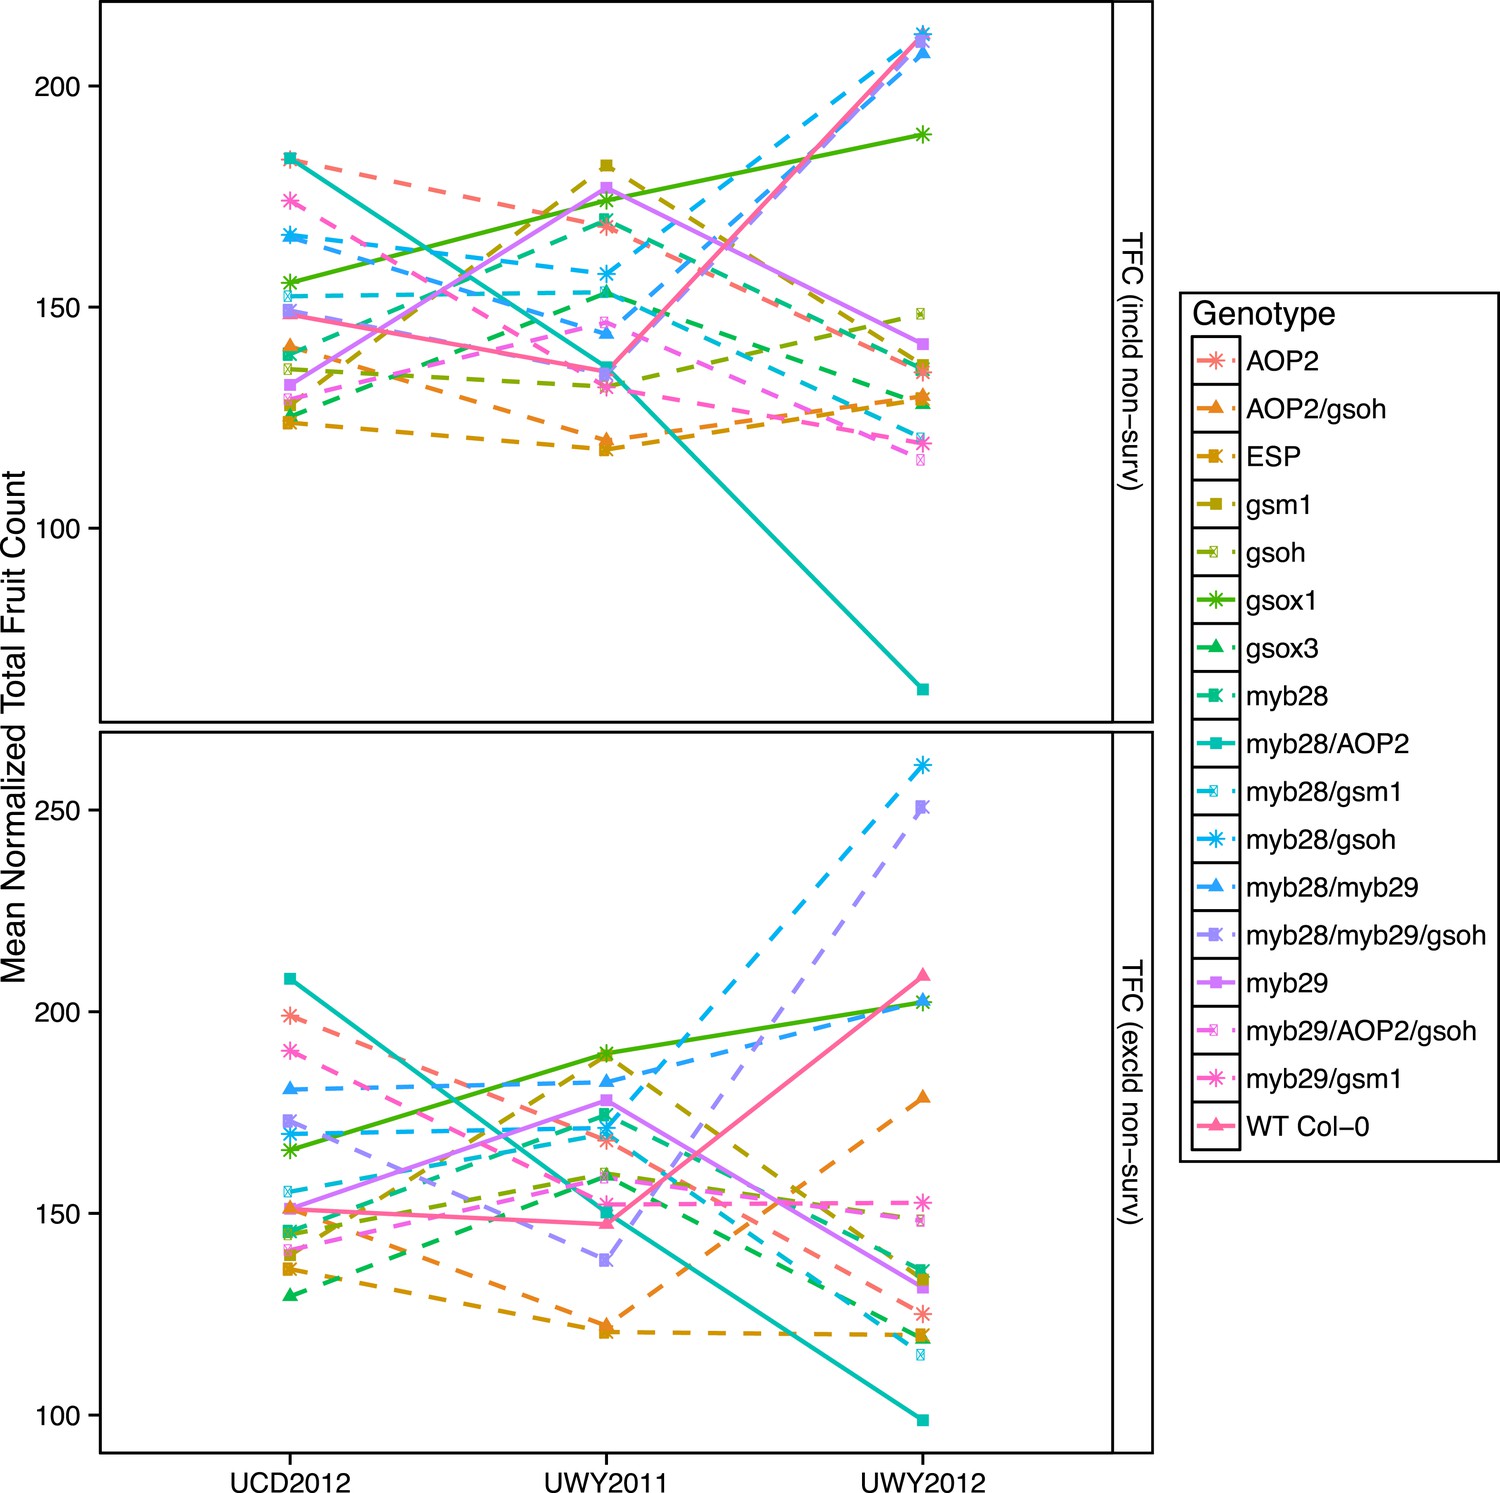
Mean normalized total fruit count of GSL genotypes from the laboratory population grown in the field.
Shown are the mean normalized genotype averages of total fruit count (TFC) from GSL genotypes grown in all three environments calculated either including or excluding survivorship, as indicated. TFC was measured in the laboratory as the total number of fruits, flowers and buds per individual. Mean normalization was conducted for each phenotype by first dividing the average of each GSL genotype within an environment to the corresponding population mean for each environment. Then, each normalized value was multiplied by the grand mean across all three environments. This was done in order put the phenotype estimates in each environment on the same order of magnitude to ease visual comparisons of genotypes across environments. Solid lines represent distinct patterns that GSL genotypes display across the environments and are meant as a visual aid.
Figure 8
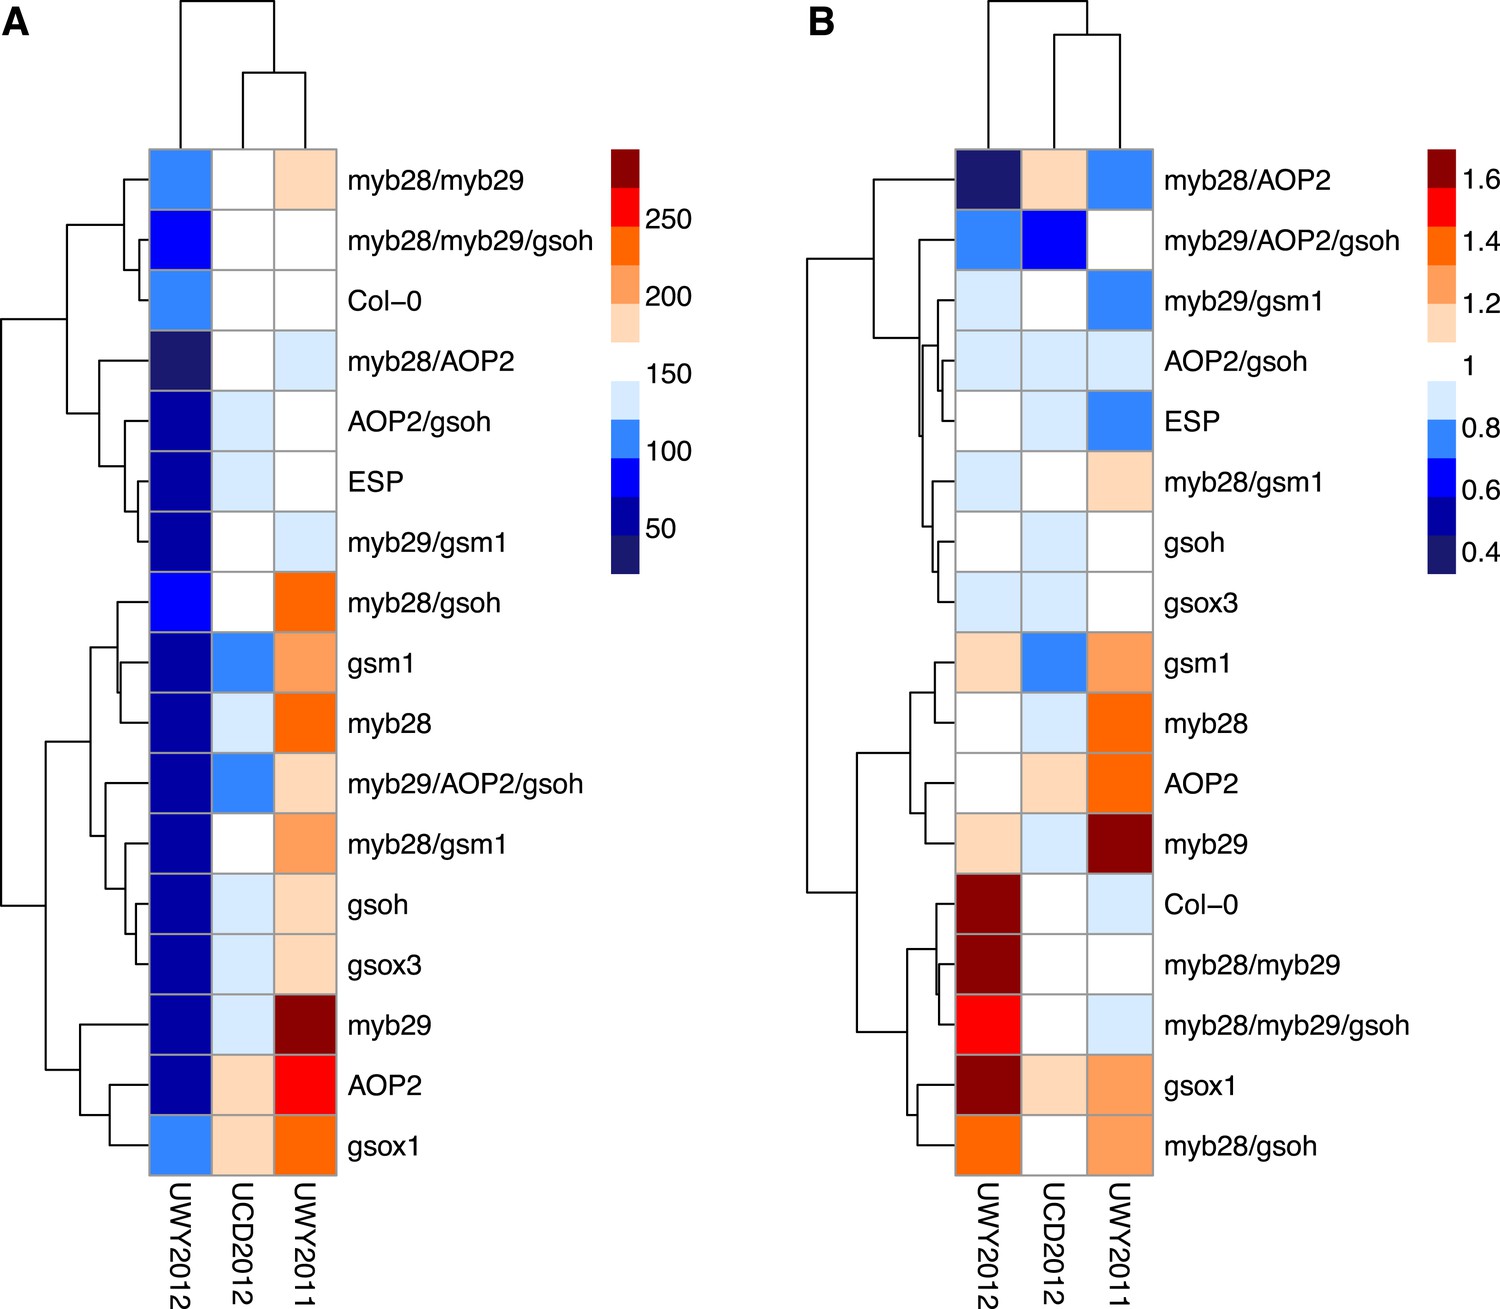
Relative and absolute of GSL genotypes from the laboratory population grown in the field.
Heatmaps with hierarchical clustering of GSL genotypes representing the model corrected means of (A) absolute fitness including survivorship and (B) relative fitness of each genotype in each environment. Absolute fitness was calculated for each individual as the total fruit count × silique length × survivorship. Relative fitness was calculated by normalizing absolute fitness for each genotype against the population mean within an environment.
Figure 9
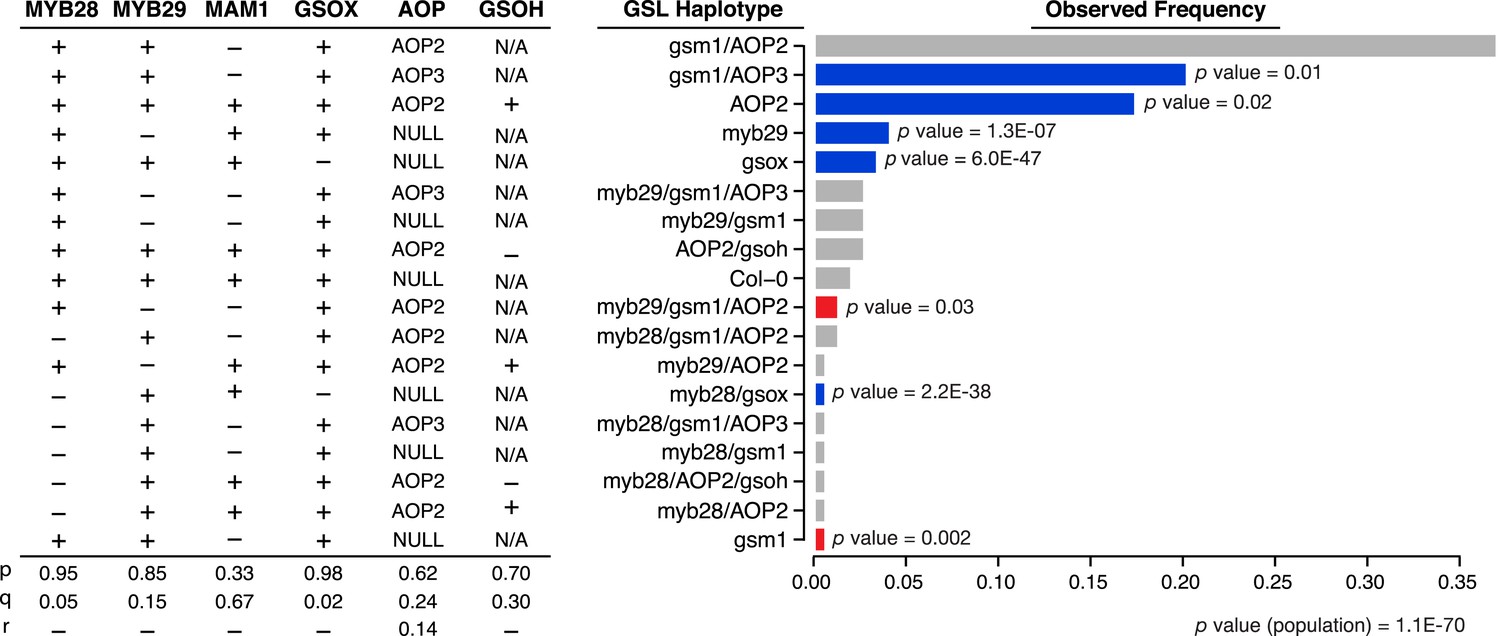
GSL haplotype frequencies of Arabidopsis thaliana accessions based on GSL profile data from chamber-grown individuals.
Shown are the GSL haplotypes observed among a population of 144 Arabidopsis accessions for which our lab had existing GSL data. Seven loci important in the aliphatic GSL pathway were called based on GSL profile data from the lab as ‘+’ = functional, ‘−’ = non-functional or ‘NA’ = unobservable due to epistasis (see Figure 1 for an explanation of epistasis in the GSL biosynthetic pathway). Bar length represents the observed GSL genotype frequencies among 144 Arabidopsis accessions. Bar color represents the difference, for a given GSL haplotype, between expected and observed genotype frequencies, based on Chi Squared distribution (significant p values shown). Blue = GSL genotypes found more frequently than expected (p value ≤ 0.05), red = GSL genotypes found less frequently than expected (p value ≤ 0.05) and grey = GSL genotypes found as frequently as expected (p value >0.05).
-
Figure 9—source data 1
χ2 analysis comparing observed and expected GSL haplotype frequencies observed among a globally distributed population of 144 Arabidopsis thaliana accessions.
- https://doi.org/10.7554/eLife.05604.043
Tables
Table 1
Polymorphic genes involved in aliphatic GSL synthesis and activation
| Gene name | Locus | ATG # | Gene type | Gene function | Mutation type in Col-0 |
|---|---|---|---|---|---|
| MYB28 | MYB28 | At5g61420 | TF | Positive regulator of aliphatic GSL (Sønderby et al., 2007, 2010) | T-DNA |
| MYB29 | MYB29 | At5g07690 | TF | Positive regulator of aliphatic GSL (Sønderby et al., 2007, 2010) | T-DNA |
| MAM1 | MAM1 | At5g23010 | Enzyme | Controls 3C–4C chain elongation (Haughn et al., 1991; de Quiros et al., 2000; Kroymann et al., 2003) | EMS |
| GSOX1 | GSOX | At1g65860 | Enzyme | Converts MT to MSO GSL (Hansen et al., 2007; Li et al., 2008) | T-DNA |
| GSOX3 | GSOX | At1g62560 | Enzyme | Converts MT to MSO GSL (Hansen et al., 2007; Li et al., 2008) | T-DNA |
| AOP2 | AOP | At4g03060 | Enzyme | Converts MSO to alkenyl GSL (Kliebenstein et al., 2001c) | 35S OX |
| AOP3 | AOP | At4g03050 | Enzyme | Converts 3MSO to hydroxy-propyl GSL (Kliebenstein et al., 2001c) | n/a |
| GSOH | GSOH | At2g25450 | Enzyme | Converts butenyl to OHB (Hansen et al., 2008) | T-DNA |
| ESP | ESP | At1g54040 | Co-factor | Guides formation of activated GSL to nitriles (Lambrix et al., 2001) | 35S OX |
-
Shown are the identities, functions and mutation types of nine genes representing seven loci important for aliphatic GSL synthesis and activation. These genes were chosen for mutant laboratory population of Arabidopsis thaliana accession Col-0 due to the fact that they represent the majority of aliphatic GSL variation observed in Arabidopsis. Each of these genes is naturally polymorphic among Arabidopsis accessions.
Table 2
Allelic variation of polymorphic aliphatic GSL loci in structured population
| Genotype | MYB28 | MYB29 | MAM1 | GSOX1 | GSOX3 | AOP2 | GSOH | ESP |
|---|---|---|---|---|---|---|---|---|
| Col-0 | + | + | + | + | + | − | + | − |
| myb28 | − | + | + | + | + | − | + | − |
| myb29 | + | − | + | + | + | − | + | − |
| gsm1 | + | + | − | + | + | − | + | − |
| gsox1 | + | + | + | − | + | − | + | − |
| gsox3 | + | + | + | + | − | − | + | − |
| AOP2 | + | + | + | + | + | + | − | − |
| AOP2/gsoh | + | + | + | + | + | + | − | − |
| Gsoh | + | + | + | + | + | − | − | − |
| Myb28/gsoh | − | + | + | + | + | − | + | − |
| Myb28/gsm1 | − | + | − | + | + | − | + | − |
| Myb28/AOP2 | − | + | + | + | + | + | + | − |
| Myb29/gsm1 | + | − | − | + | + | − | + | − |
| Myb29/AOP2/gsoh | + | + | + | + | + | + | − | − |
| Myb28/myb29 | − | − | + | + | + | − | + | − |
| Myb28/myb29/gsoh | − | − | + | + | + | − | − | − |
| ESP | + | + | + | + | + | − | + | + |
-
Shown are the genotypes in the mutant laboratory GSL population used in this study and the allelic state of each gene within each of them. Each gene in our population is naturally polymorphic among Arabidopsis accessions. See Table 1 for gene functions. For each gene listed, a ‘+’ indicates a functional allele and a ‘−’ indicates a non-functional allele. The loss-of-function and gain-of-function mutant lines shown in Table 1 were manually crossed to generate this population of genotypes, each of which vary from Col-0 at only these eight genes, including single, double, and triple mutants.
Table 3
Mixed model table of leaf damage, flowering time and GSL in the field
| Fixed effects | Leaf damage | Flowering time | ||||||||
|---|---|---|---|---|---|---|---|---|---|---|
| Source of variation | df | SS | MS | F | p value | df | SS | MS | F | p value |
| Genotype | 16 | 280 | 18 | 3.7 | 7.6E-07 | 16 | 7471 | 467 | 9.4 | 5.8E-23 |
| Environment | 2 | 207 | 104 | 7.5 | 0.02 | 2 | 36603 | 18302 | 464.6 | 8.6E-08 |
| Treatment | 1 | 17 | 17 | 0.3 | – | 1 | 107 | 107 | 7.3 | 0.04 |
| Geno:Env | 32 | 617 | 19 | 4.0 | 7.2E-13 | 32 | 2678 | 84 | 3.0 | 5.3E-08 |
| Geno:Trt | 16 | 75 | 5 | 1.0 | – | 16 | 655 | 41 | 1.3 | – |
| Env:Trt | 2 | 32 | 16 | 1.9 | – | 2 | 526 | 263 | 6.5 | 0.03 |
| Geno:Env:Trt | 32 | 201 | 6 | 1.3 | – | 32 | 1115 | 35 | 1.3 | – |
| Random effects | Leaf damage | Flowering time | ||||||||
|---|---|---|---|---|---|---|---|---|---|---|
| Source of variation | df | SS | MS | χ2 | p value | df | SS | MS | χ2 | p value |
| Plot(Trt:Env) | 1 | 0 | 0 | 8.7 | 0.003 | 1 | 0 | 0 | 0.0 | – |
| Residual | 1904 | 5 | 0 | NA | – | 1750 | 26 | 0 | NA | – |
| Fixed effects | Total aliphatic GSL | Total indole GSL | ||||||||
|---|---|---|---|---|---|---|---|---|---|---|
| Source of variation | df | SS | MS | F | p value | df | SS | MS | F | p value |
| Genotype | 16 | 2509273 | 156830 | 34.6 | 3.0E-95 | 16 | 33432 | 2090 | 7.3 | 1.1E-16 |
| Environment | 2 | 14588 | 7294 | 1.6 | – | 2 | 1520 | 760 | 0.6 | – |
| Treatment | 1 | 1430 | 1430 | 0.3 | – | 1 | 2208 | 2208 | 4.3 | – |
| Geno:Env | 32 | 305993 | 9562 | 2.1 | 3.3E-04 | 32 | 14139 | 442 | 1.5 | 0.03 |
| Geno:Trt | 16 | 100139 | 6259 | 1.4 | – | 16 | 7488 | 468 | 1.6 | – |
| Env:Trt | 2 | 3938 | 1969 | 0.4 | – | 2 | 610 | 305 | 1.0 | – |
| Geno:Env:Trt | 32 | 116269 | 3633 | 0.8 | – | 32 | 9531 | 298 | 1.0 | – |
| Random effects | Total aliphatic GSL | Total indole GSL | ||||||||
|---|---|---|---|---|---|---|---|---|---|---|
| Source of variation | df | SS | MS | χ2 | p value | df | SS | MS | χ2 | p value |
| Plot(Trt:Env) | 1 | 193 | 193 | 72.6 | 5.6E-16 | 1 | 15 | 15 | 67.5 | 2.2E-16 |
| Residual | 1490 | 4342 | 2 | NA | – | 1491 | 269 | 0 | NA | – |
-
A linear mixed model was fitted to phenotypes measured on plants grown in the field. Variation was partitioned among the fixed effects, Genotype, Environment, and Treatment as well as a random factor, Plot, inside which Treatment and Environment were nested. Phenotypic data used in the model was collected on 17 genotypes from three environments and two treatment groups. df = degrees of freedom, SS = Type II Sums of Squares variation, MS = Mean Squared variation, F = F statistic (for fixed factors), χ2 = chi squared statistic (for random factors). p value = probability value from either an F test or a chi squared test, depeding on the source of variation. Non-significant p values (>0.05) are represented by a dash.
-
Table 3—source data 1
Mixed model table of phenotypes measured in the field
- https://doi.org/10.7554/eLife.05604.027
-
Table 3—source data 2
LSMeans of phenotypes measured in the field
- https://doi.org/10.7554/eLife.05604.028
Table 4
PCA comparison of GSL profiles produced by GSL genotypes from synthetic laboratory population grown in the chamber and all three environments
| Environment | PCA1 = 48.5% | PCA2 = 29% | PCA3 = 16% | PCA4 = 6% | ||||
|---|---|---|---|---|---|---|---|---|
| R | p value | R | p value | R | p value | R | p value | |
| Chamber | 1.00 | 1.00 | 1.00 | 1.00 | ||||
| UCD2012 | 0.97 | <0.001 | 0.97 | <0.001 | 0.82 | <0.001 | 0.96 | <0.001 |
| UWY2011 | 0.91 | <0.001 | 0.95 | <0.001 | 0.74 | <0.001 | 0.97 | <0.001 |
| UWY2012 | 0.90 | <0.001 | 0.91 | <0.001 | 0.85 | <0.001 | 0.86 | <0.001 |
-
Glucosinolate analysis was conducted on the 17 genotypes within a Long-day growth chamber (16 hr light) set to match the median light regime for the three environmments. Principal component analysis was conducted on the mean glucosinolate accumulation for the aliphatic glucosinoles within the chamber environment. This creates a set of mathematical descriptors of the chemotype variation across the 17 genotypes. The first three eigenvectors were used to generate scores from the lsmeans of the glucosinolates across the 17 glucosinolate genotypes independently for the chamber and three different field environments values. These scores were then correlated to test if the GSL profiles were similar or not across the environments. The R of the correlation to the Chamber scores for the 17 genotypes for each of the three PCA vectors are shown in conjunction with the p value as determined by Pearson correlation. To the right of each PCA vector label is shown the fraction of total variance approximated by the given vector. In total, the four vectors describe >99% of the GSL profile variance.
Table 5
Environmental correlations for leaf damage in the field
| UCD2012-UWY2012 | UWY2012-UWY2011 | UCD2012-UWY2011 | |||
|---|---|---|---|---|---|
| R | p value | R | p value | R | p value |
| −0.25 | – | 0.01 | – | 0.22 | – |
-
Shown are Pearson's correlations for leaf damage between the different environments. R = correlation coefficients; p value = probability statistic. Non-significant p values are represented by a dash.
Table 6
Mixed model of fitness phenotypes in the field
| Fixed effects | Absolute fitness (w/survivorship) | Absolute fitness (w/out survivorship) | ||||||||
|---|---|---|---|---|---|---|---|---|---|---|
| Source of variation | df | SS | MS | F | p value | df | SS | MS | F | p value |
| Genotype | 16 | 455453 | 28466 | 2.2 | 4.9E-03 | 16 | 397186 | 24824 | 2.3 | 2.0E-03 |
| Environment | 2 | 88326 | 44163 | 2.2 | – | 2 | 127177 | 63588 | 4.6 | – |
| Treatment | 1 | 1948 | 1948 | 0.2 | – | 1 | 2042 | 2042 | 0.3 | – |
| Geno:Env | 32 | 706781 | 22087 | 1.7 | 0.01 | 32 | 508962 | 15905 | 1.5 | 0.04 |
| Geno:Trt | 16 | 137795 | 8612 | 0.6 | – | 16 | 169036 | 10565 | 1.0 | – |
| Env:Trt | 2 | 2918 | 1459 | 0.1 | – | 2 | 4883 | 2442 | 0.2 | – |
| Geno:Env:Trt | 32 | 348291 | 10884 | 0.8 | – | 32 | 235224 | 7351 | 0.7 | – |
| Random Effects | Absolute fitness (w/survivorship) | Absolute fitness (w/out survivorship) | ||||||||
|---|---|---|---|---|---|---|---|---|---|---|
| Source of variation | df | SS | MS | Chi.sq | p value | df | SS | MS | Chi.sq | p value |
| Plot(Trt:Env) | 1 | 2640 | 2640 | 216.5 | 0 | 1 | 3311 | 3311 | 279.3 | 0 |
| Residual | 1692 | 12581 | 7 | NA | – | 1451 | 10061 | 7 | NA | – |
| Fixed effects | Relative fitness | Survivorship | ||||||||
|---|---|---|---|---|---|---|---|---|---|---|
| Source of variation | df | SS | MS | F | p value | df | SS | MS | F | p value |
| Genotype | 16 | 28 | 2 | 2.7 | 3.9E-04 | 16 | 5 | 0 | 4.9 | 6.9E-10 |
| Environment | 2 | 2 | 1 | 1.0 | – | 2 | 2 | 1 | 9.3 | 0.01 |
| Treatment | 1 | 0 | 0 | 0.2 | – | 1 | 0 | 0 | 1.2 | – |
| Geno:Env | 32 | 39 | 1 | 1.8 | 4.2E-03 | 32 | 9 | 0 | 3.8 | 3.8E-12 |
| Geno:Trt | 16 | 8 | 1 | 0.8 | – | 16 | 1 | 0 | 0.8 | – |
| Env:Trt | 2 | 0 | 0 | 0.1 | – | 2 | 0 | 0 | 0.1 | – |
| Geno:Env:Trt | 32 | 17 | 1 | 0.8 | – | 32 | 3 | 0 | 1.1 | – |
| Random effects | Relative fitness | Survivorship | ||||||||
|---|---|---|---|---|---|---|---|---|---|---|
| Source of variation | df | SS | MS | Chi.sq | p value | df | SS | MS | Chi.sq | p value |
| Plot(Trt:Env) | 1 | 0.1 | 0.1 | 184.5 | 0 | 1 | 0 | 0 | 0 | – |
| Residual | 1692 | 1 | 3.8E-04 | NA | – | 1900 | 0.1 | 3.5E-05 | NA | – |
-
A linear mixed model was fitted to phenotypes measured on plants grown in the field. Variation was partitioned among the fixed effects, Genotype, Environment, and Treatment as well as a random factor, Plot, inside which Treatment and Environment were nested. Phenotypic data used in the model was collected on 17 genotypes from three environments and two treatment groups. df = degrees of freedom, SS = Type II Sums of Squares variation, MS = Mean Squared variation, F = F statistic. Non-significant p values (>0.05) are represented by a dash.
Table 7
Genetic correlations between fitness and Pleitropic traits in the field
| Absolute fitness | Flowering time | Total indole GSL | |
|---|---|---|---|
| Trait (UCD2012) | |||
| Absolute fitness | – | −0.40 | −0.21 |
| Flowering time | −0.22 | – | 0.06 |
| Total indole GSL | −0.05 | −0.23 | – |
| Trait (UWY2011) | |||
| Absolute fitness | – | −0.24 | −0.27 |
| Flowering time | −0.19 | – | −0.05 |
| Total indole GSL | −0.43 | 0.12 | – |
| Trait (UWY2012) | |||
| Absolute fitness | – | 0.22 | −0.25 |
| Flowering time | 0.29 | – | 0.59* |
| Total indole GSL | −0.21 | 0.38 | – |
-
Shown are genetic correlations between absolute fitness and traits pleiotripically controlled by GSL genes. Pearson's correlation coefficients are on the top half of the tables and Spearman rank correlations are on the bottom. *p value < 0.05, **p value < 0.01, ***p value < 0.001.
Download links
A two-part list of links to download the article, or parts of the article, in various formats.
Downloads (link to download the article as PDF)
Open citations (links to open the citations from this article in various online reference manager services)
Cite this article (links to download the citations from this article in formats compatible with various reference manager tools)
Natural genetic variation in Arabidopsis thaliana defense metabolism genes modulates field fitness
eLife 4:e05604.
https://doi.org/10.7554/eLife.05604


