A novel isoform of MAP4 organises the paraxial microtubule array required for muscle cell differentiation
- University of Warwick, United Kingdom
- MRC Laboratory of Molecular Biology, United Kingdom
Figures
Figure 1 with 3 supplements
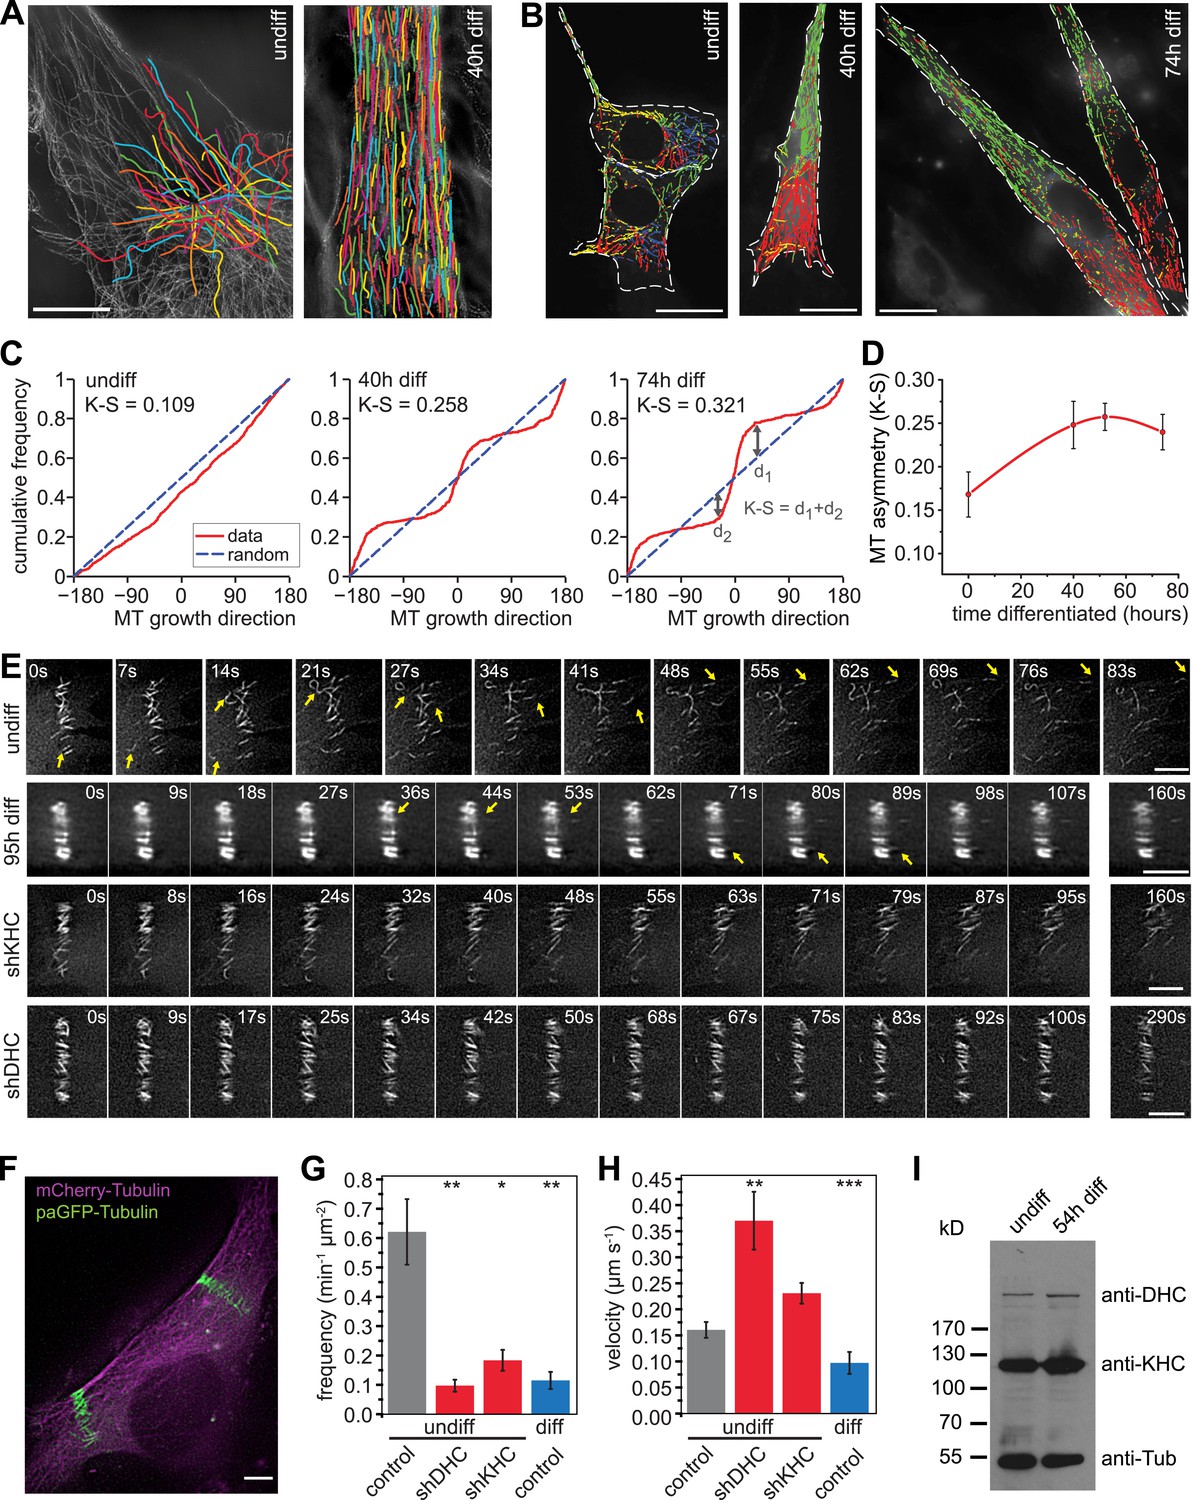
Microtubules are arranged in stable paraxial arrays during muscle cell differentiation.
(A) Structured illumination microscopy of anti-tubulin-stained C2C12 cells pre/post induction of muscle differentiation as indicated. Microtubule filaments have been manually traced to highlight arrangement. Scale bar 10 μm. (B) Tracks of EB3-GFP in C2C12 cells at different stages of differentiation. Directionality is colour-coded (green and red: ±45° to longitudinal cell axis, blue and yellow: perpendicular to cell axis ±45°). Cell outlines are indicated with dashed white line. Scale bars 20 μm. (C) Cumulative distribution of MT growth angles for example cells shown in (B). Kuiper statistics (K–S) is calculated as a measure for microtubule alignment as the sum of the maximum deviations d1 and d2 from a random distribution. See Figure 1—figure supplement 1 for angular histograms. (D) Average MT asymmetry of differentiating myoblasts. Data show mean ± SEM for 4–9 cells with >5000 microtubule tracks per condition. (E and F) Motility of paGFP-Tubulin-labelled microtubule segments in myoblasts pre/post induction of differentiation and after depletion of dynein (shDHC) and kinesin-1 (shKHC). Bar-shaped patterns were activated perpendicular to the microtubule orientation using mCherry-Tubulin as marker (F). An individual bar-shaped activation pattern is shown in (E) for each condition. Arrows highlight microtubule-sliding events. Scale bars are 5 μm. See supplementary Videos 1–5. (G and H) Frequency and velocity of microtubule sliding events observed following photoactivation of tubulin segments. Data show mean ± SEM, n = 17–51 activated patterns. Asterisks indicate significant difference from undifferentiated control cells (*p < 0.05, **p < 0.005, ***p < 0.0005). (I) Immunoblotting of C2C12 cell extracts pre/post induction of differentiation for DHC and KHC. Tubulin serves as loading control.
Figure 1—figure supplement 1
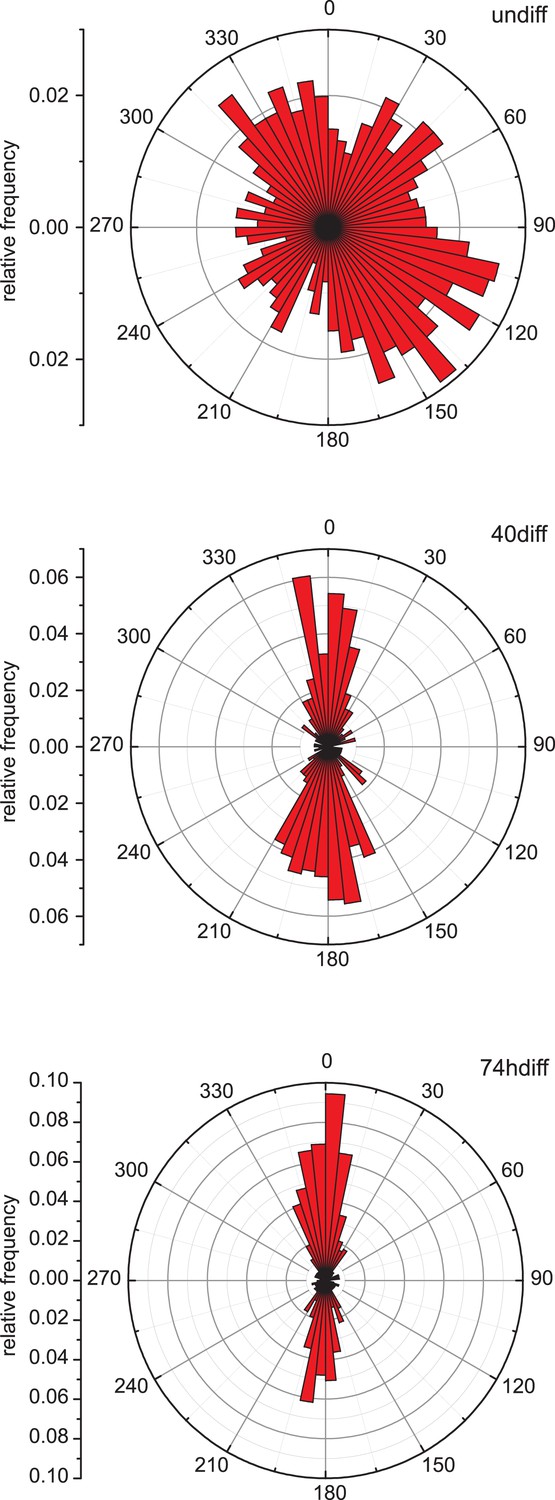
Microtubule growth orientation.
Angular distribution of microtubule growth data obtained from EB3-GFP tracks for the cells shown in Figure 1B.
Figure 1—figure supplement 2
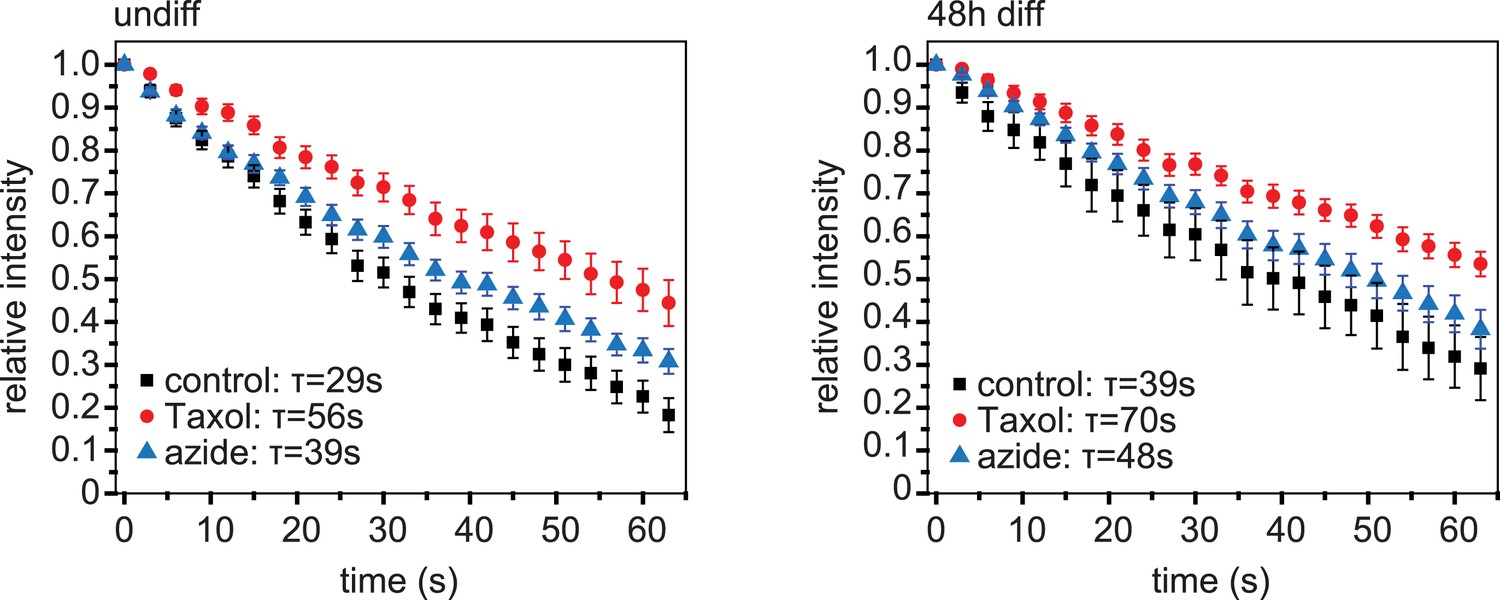
Dissipation of photoconverted microtubule labelling.
Dissipation of photoconverted regions of mEos2-Tubulin in C2C12 cells before (undiff) and 48 hr post induction of differentiation. Cells were treated with Taxol to stop dissipation by depolymerisation, or azide to stop dissipation by motor-driven movement. Data have been corrected for bleaching by substraction of data from cells treated with both Taxol and azide. Data show mean ± SEM, n = 10–20 cells from two experiments. Half-life was determined from exponential decay curve fitted to the data.
Figure 1—figure supplement 3

Verification of dynein and kinesin depletion.
Immunoblotting of C2C12 cell extracts from GFP-positive FACS-sorted cells treated with individual short hairpin RNAs (shRNAs) for 72 hr probed with antibodies as indicated.
Figure 2 with 6 supplements
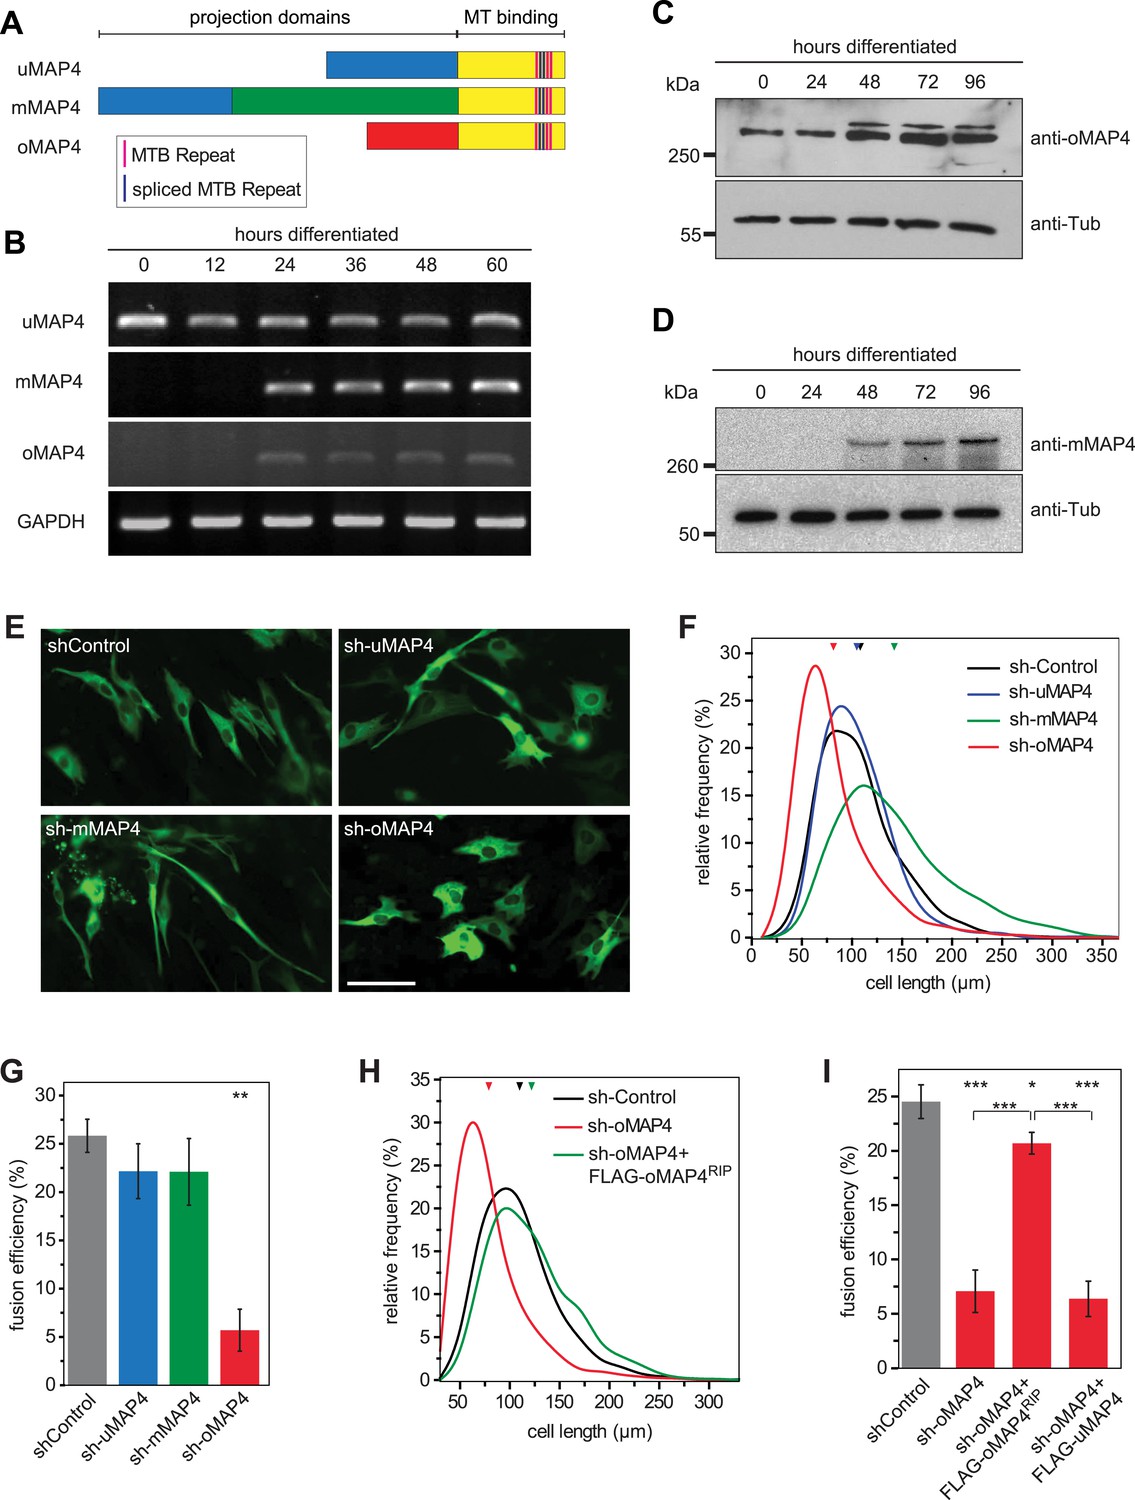
oMAP4 is required for myoblast elongation and fusion.
(A) Domain organization of MAP4 isoforms. Green and red boxes represent isoform-specific regions in the projection domains of mMAP4 and oMAP4, respectively. Note that all three isoforms are expressed with 3, 4, or 5 tau-like MT binding repeats. (B) RT-PCR-based MAP4 expression analysis of RNA samples isolated from 0–60 hr differentiated C2C12 cells. Glyceraldehyde-3-phosphate dehydrogenase (GAPDH) was used as loading control. (C and D) Immunoblotting of extracts from 0 to 96 hr differentiated C2C12 cells using antibodies against the N-terminus of oMAP4 (C) or the muscle-specific insertion of mMAP4 (D). Tubulin was used as a loading control. (E) Examples of shRNA-treated cells co-expressing GFP-Tubulin 48 hr after induction of differentiation. Scale bar 50 μm. (F, H) Distribution of cell lengths after 48 hr differentiation following treatment with indicated shRNAs. 1000–1900 cells were measured from three independent experiments for each condition. Small triangles represent mean values. (G, I) Myoblast fusion analyses of C2C12 cells treated with indicated shRNAs after 56 hr differentiation.1000–1200 cells were analysed for each condition and only cells with three or more nuclei were scored as fused. Data are collected from three experiments for each condition and are presented as mean ± S.E.M. Asterisks indicate significant difference from shControl treatment or between pairs of samples as indicated (*p < 0.05, **p < 0.005, ***p < 0.0005).
Figure 2—figure supplement 1
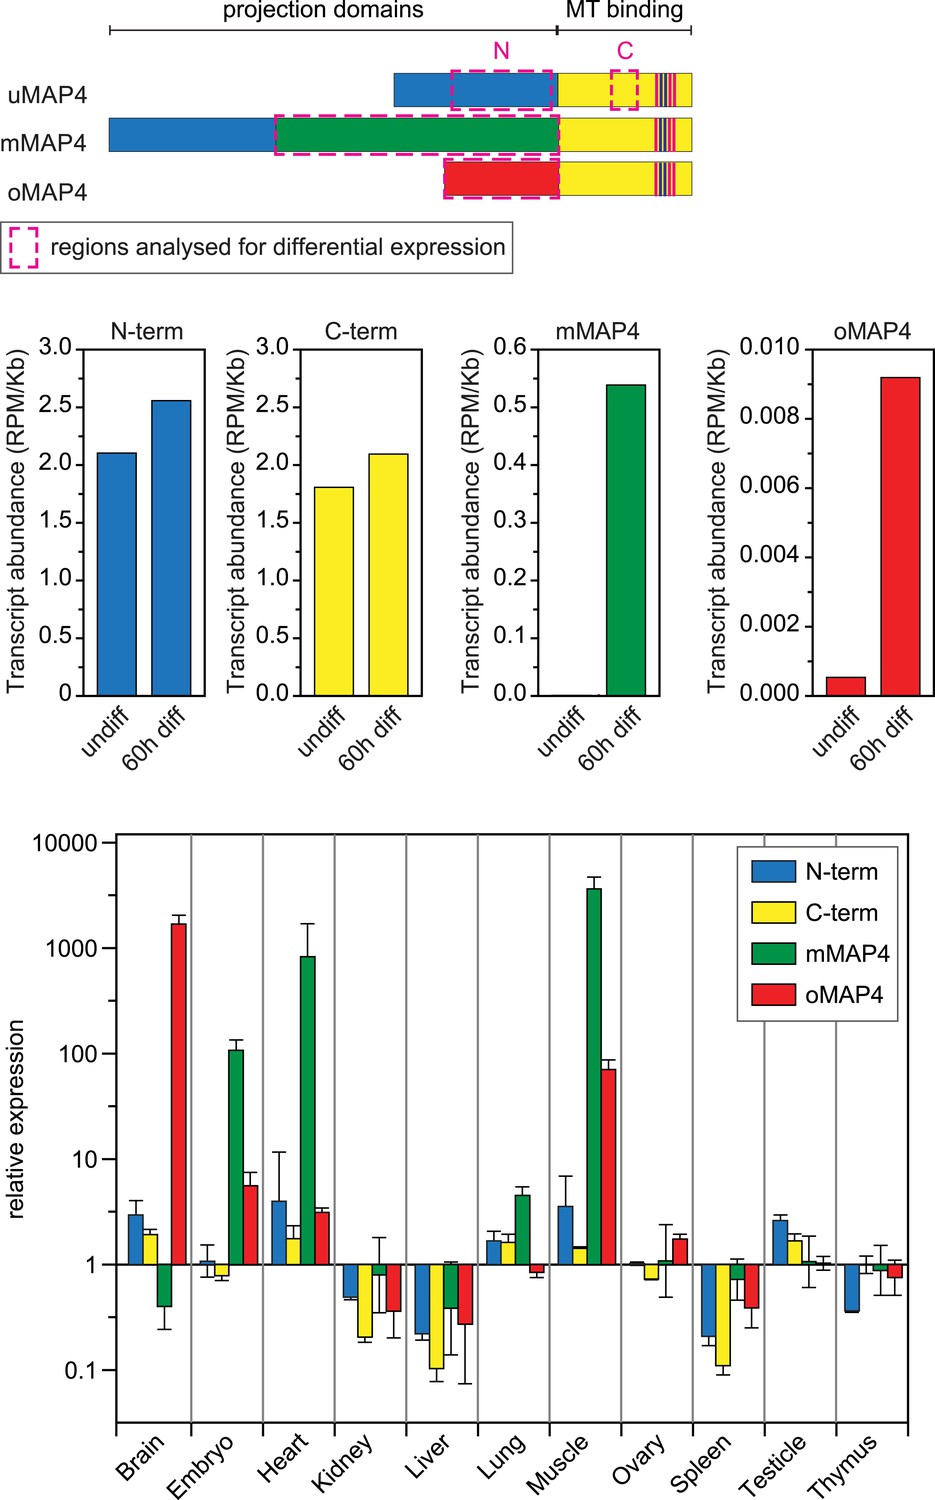
Expression of major MAP4 isoforms.
Relative transcript abundances of MAP4 isoforms during myoblast differentiation as determined by analysis of RNA sequencing data from undifferentiated and 60 hr differentiated C2C12 cells (Trapnell et al., 2010). Comparative expression levels of MAP4 isoforms in several mouse tissues obtained by analysis of Affymetrix exon array data (Pohl et al., 2009). Data are shown as mean ± SD from three experiments for each tissue. See previously generated data sets 1–2 in supplement.
Figure 2—figure supplement 2
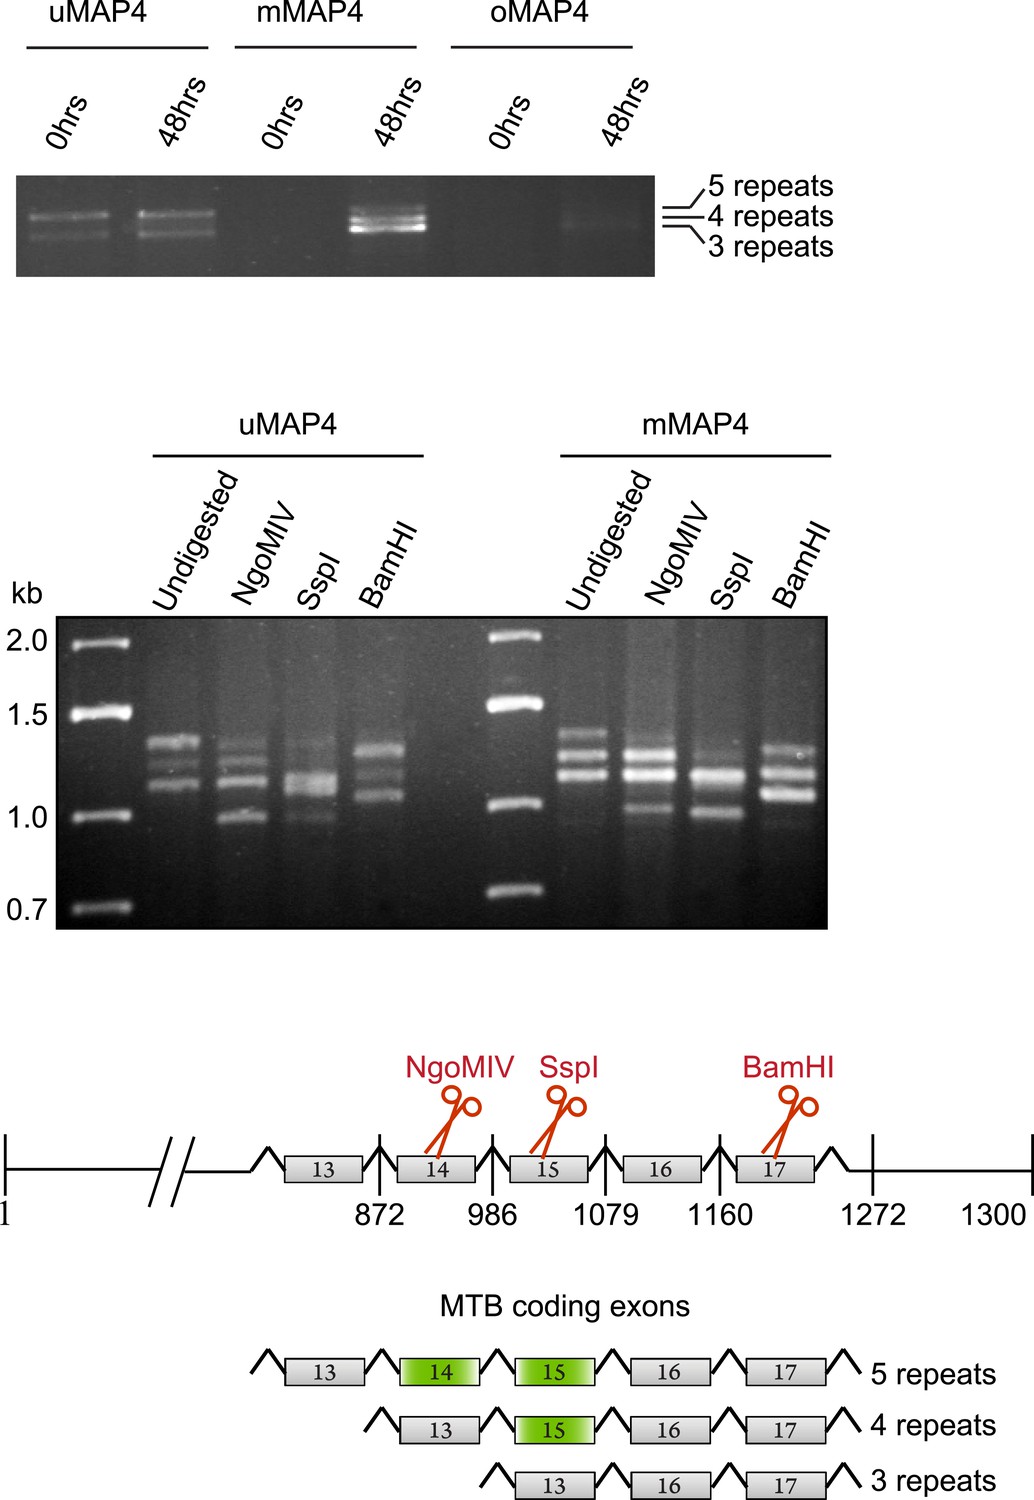
C2C12 cells express three major MAP4 isoforms with variable numbers of MT binding repeats.
RT-PCR from total RNA isolated from C2C12 cells before (0 hr) and 48 hr post induction of differentiation with upstream primers specific for projection domains of uMAP4, mMAP4, and oMAP4 and downstream primer at 3′ end of the MAP4 coding sequence to determine number of microtubule binding repeats. Digestion of PCR from 48 hr differentiated cells with exon-specific restriction nucleases to determine spliced exons that give rise to variants with different numbers of microtubule binding repeats.
Figure 2—figure supplement 3

Microtubular localisation of eGFP-tagged MAP4 isoforms in C2C12 cells.
Tubulin is used as a marker for microtubules. Scale bars are 20 μm, insets 2 μm.
Figure 2—figure supplement 4

Verification of mMAP4 depletion by immunofluorescence.
Protein depletion was quantified by counting cells that expressed mMAP4 in GFP-Tubulin and shRNA co-expressing cells. Bars are 20 μm. 40–50 cells each were analysed for shControl and sh-mMAP4 transfections.
Figure 2—figure supplement 5
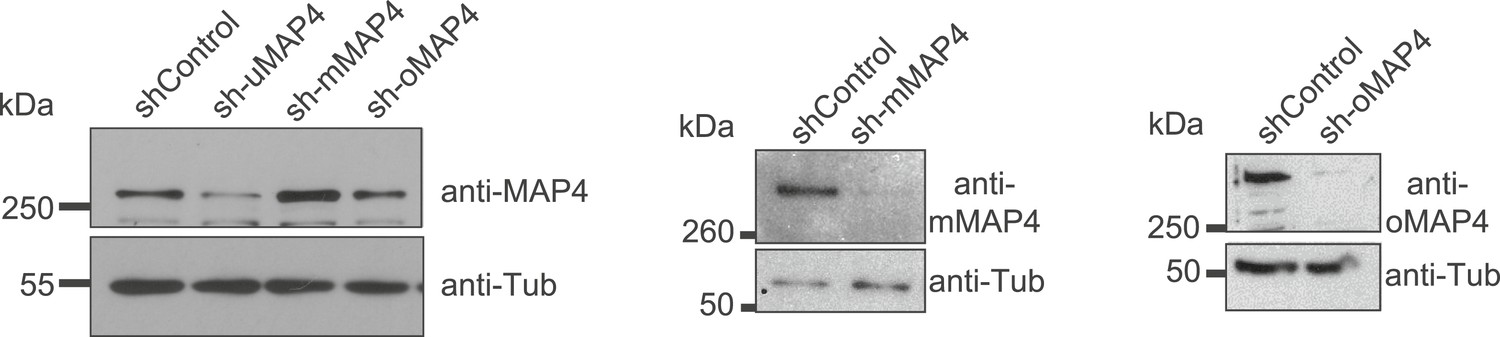
Verification of MAP4 depletion by immunoblotting.
Immunoblotting of C2C12 cell extracts treated with individual shRNAs as indicated for 70–74 hr. Tubulin serves as loading control.
Figure 2—figure supplement 6
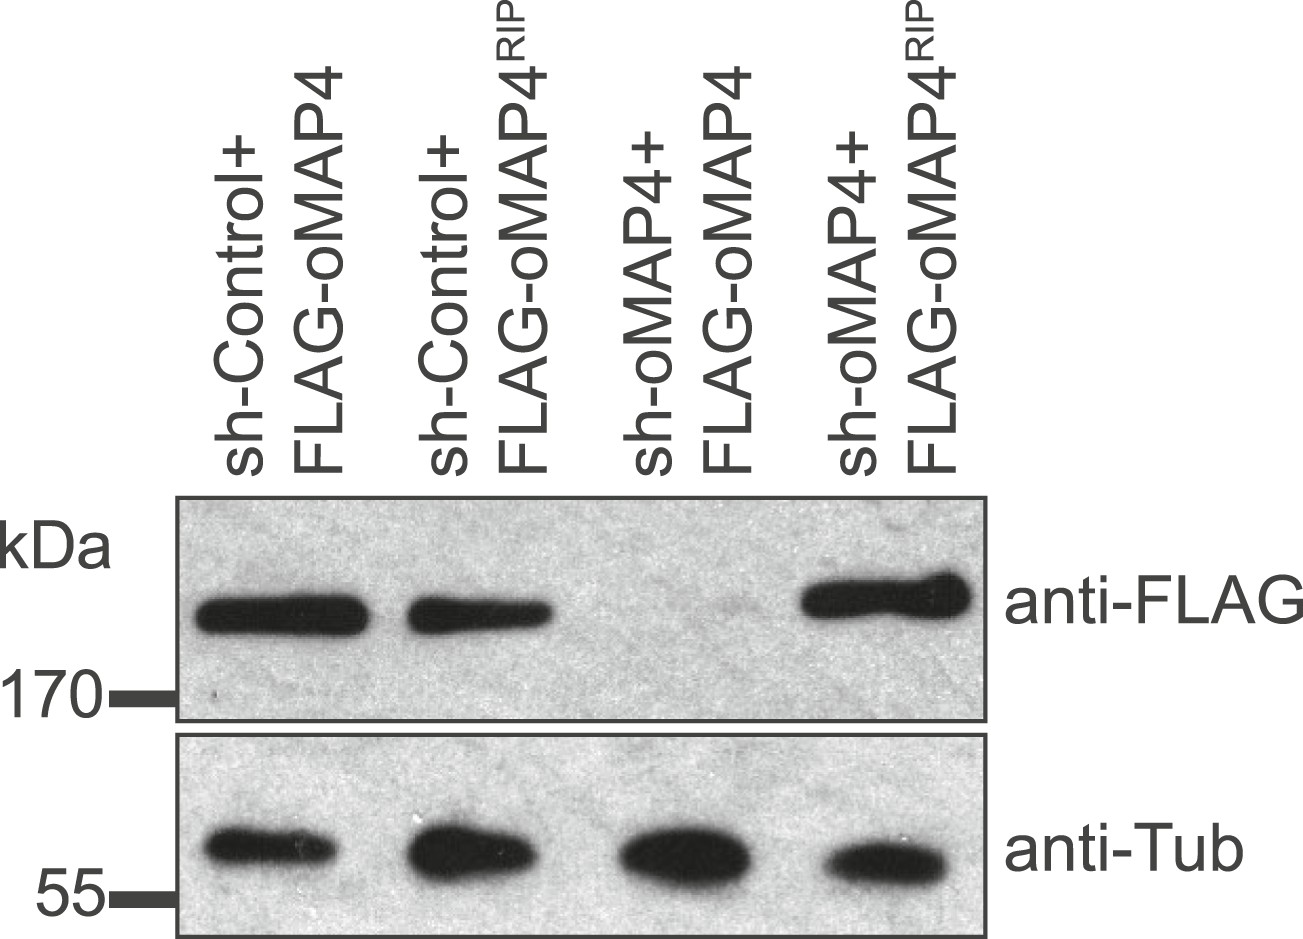
Verification of oMAP4 depletion and RNAi-protected rescue construct by immunoblotting.
Immunoblot of whole cell extracts of HeLa cells co-transfected with shRNAs and control or rescue plasmids. Tubulin serves as loading control.
Figure 3 with 2 supplements
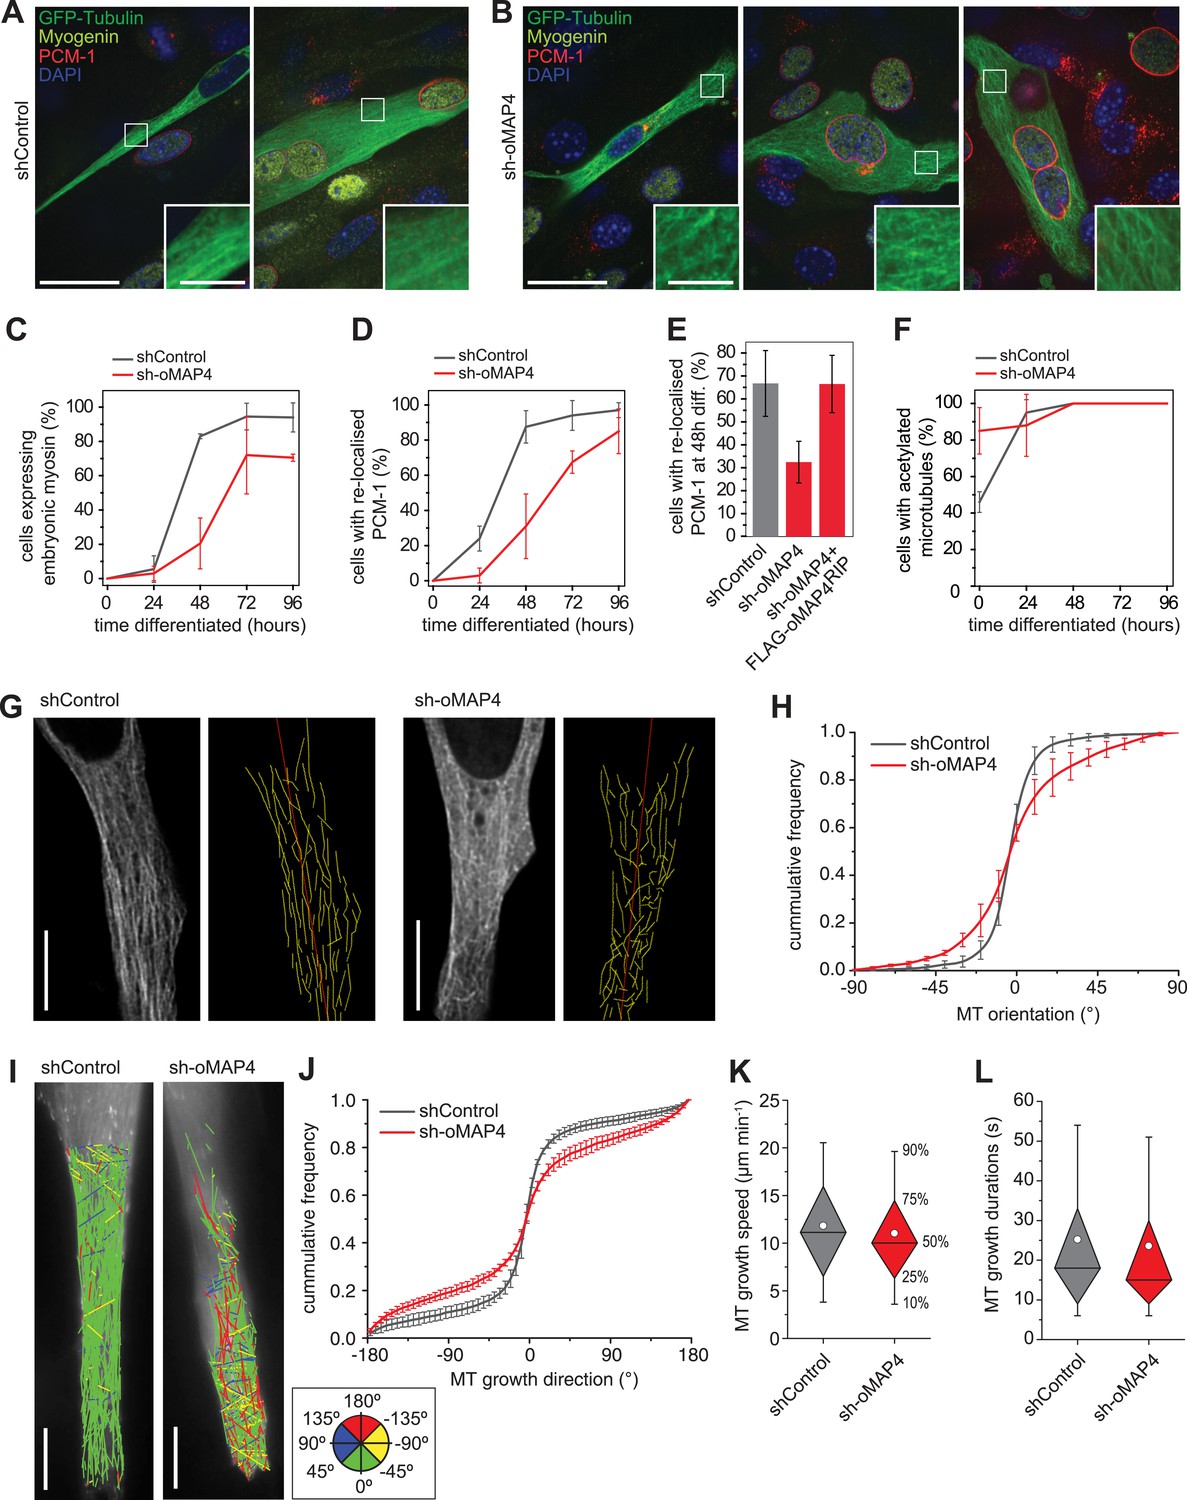
oMAP4 is required for the parallel arrangement of microtubules in differentiating muscle cells.
(A and B) C2C12 myoblasts 48 hr after induction of differentiation treated with shRNA as indicated and stained for Myogenin (a marker for differentiating myoblasts, yellow), PCM-1 (red) and DAPI (blue). GFP-Tubulin (green) indicates successful transfection with shRNA. Insets show higher magnification of microtubule arrangement. Scale bars 25 μm, 5 μm in insets. (C) Timecourse of expression of embryonic myosin, a marker of myogenic differentiation. (D) Timecourse of relocalisation of PCM-1 from a focus around the centrosome to the surface of the nucleus. Cells with a complete nuclear ring were scored as positive. Data in C, D show mean ± SD, n = 30–50 cells from 2 experiments. (E) RNAi rescue experiment of delayed PCM-1 relocalisation phenotype. Data show mean ± SEM of 3 experiments with 50–60 cells each. (F) Timecourse of accumulation of cells with acetylated tubulin during muscle cell differentiation. Data in show mean ± SD, n = 30–50 cells from 2 experiments. (G) Manual tracing of microtubule filaments (yellow) relative to the longitudinal cell axis (red) in elongated mono-nucleated cells selected after 48 hr differentiation and shRNA treatment as indicated. Scale bars 10 μm. See supplementary Videos 6, 7. (H) Microtubule directionally from data as in g shown as cummulative frequency distribution. Data show mean ± SD, n = 3 experiments, 1522–1958 MTs. (I) Automatic tracking of EB3-tdTomato comets in elongated mono-nucleated cells selected after 48 hr differentiation and shRNA treatment as indicated. Direct lines from start to end of track are shown and colour-coded for direction relative to longitudinal axis of cell as indicated in legend. Scale bars 10 μm. See supplementary Videos 8, 9. (J) Distribution of microtubule growth angles obtained from data as in H. Data show mean ± SD, n = 3 experiments, 6251–6382 tracks. (K and L) Microtubule growth speed and duration was determined from EB tracks as in I. Pooled data shown as statistical box plots with percentiles as indicated.
Figure 3—figure supplement 1
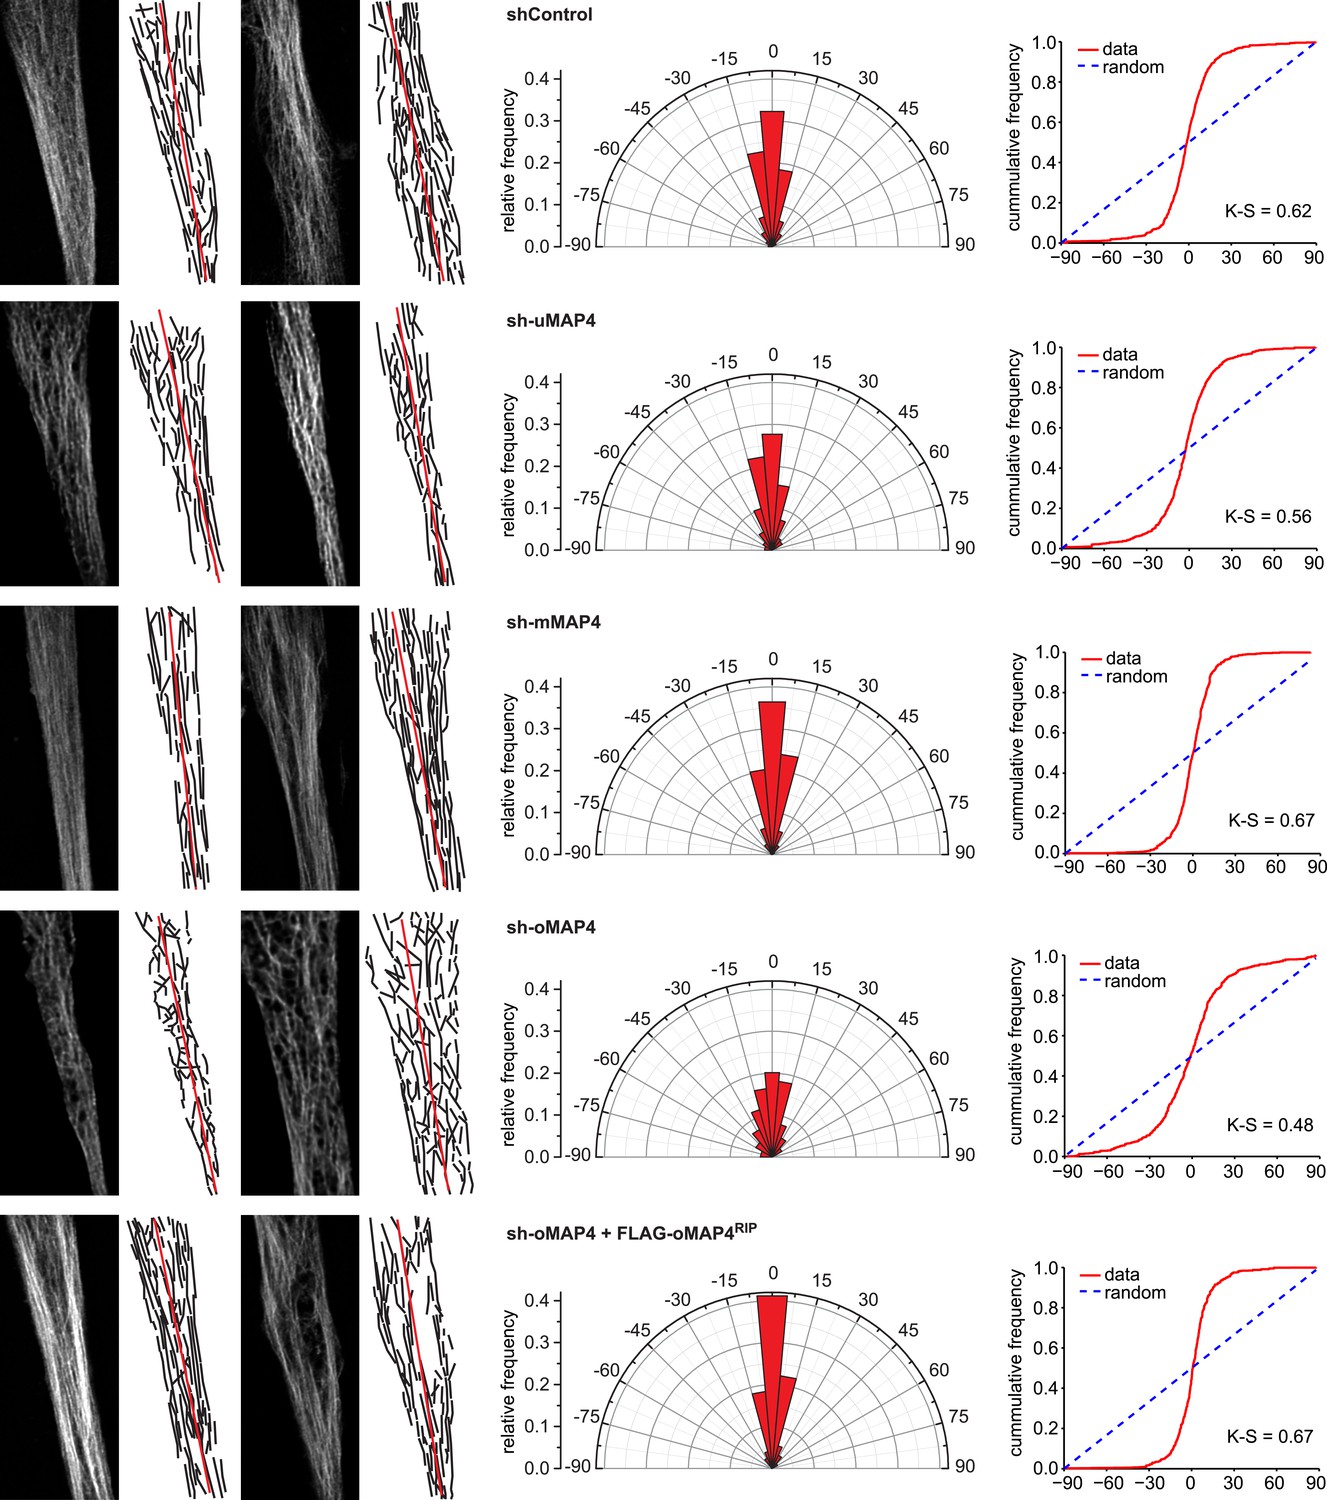
Microtubule orientation in depleted cells.
Manual segmentation of microtubules (white/black), their angular distribution relative to main cell axis (red), and cumulative frequency of microtubule orientation following depletion of individual MAP4 isoforms and in oMAP4 RNAi rescue experiment. n ≥ 10 cells. Kuiper statistic relative to random distribution is calculated as in Figure 1C.
Figure 3—figure supplement 2

Microtubule growth orientation in depleted cells.
Angular distribution of microtubule growth data from Figure 3J. To aid visualisation of data tails, bin size increases progressively between 0 and ±60° and is then constantly 30°.
Figure 4 with 1 supplement
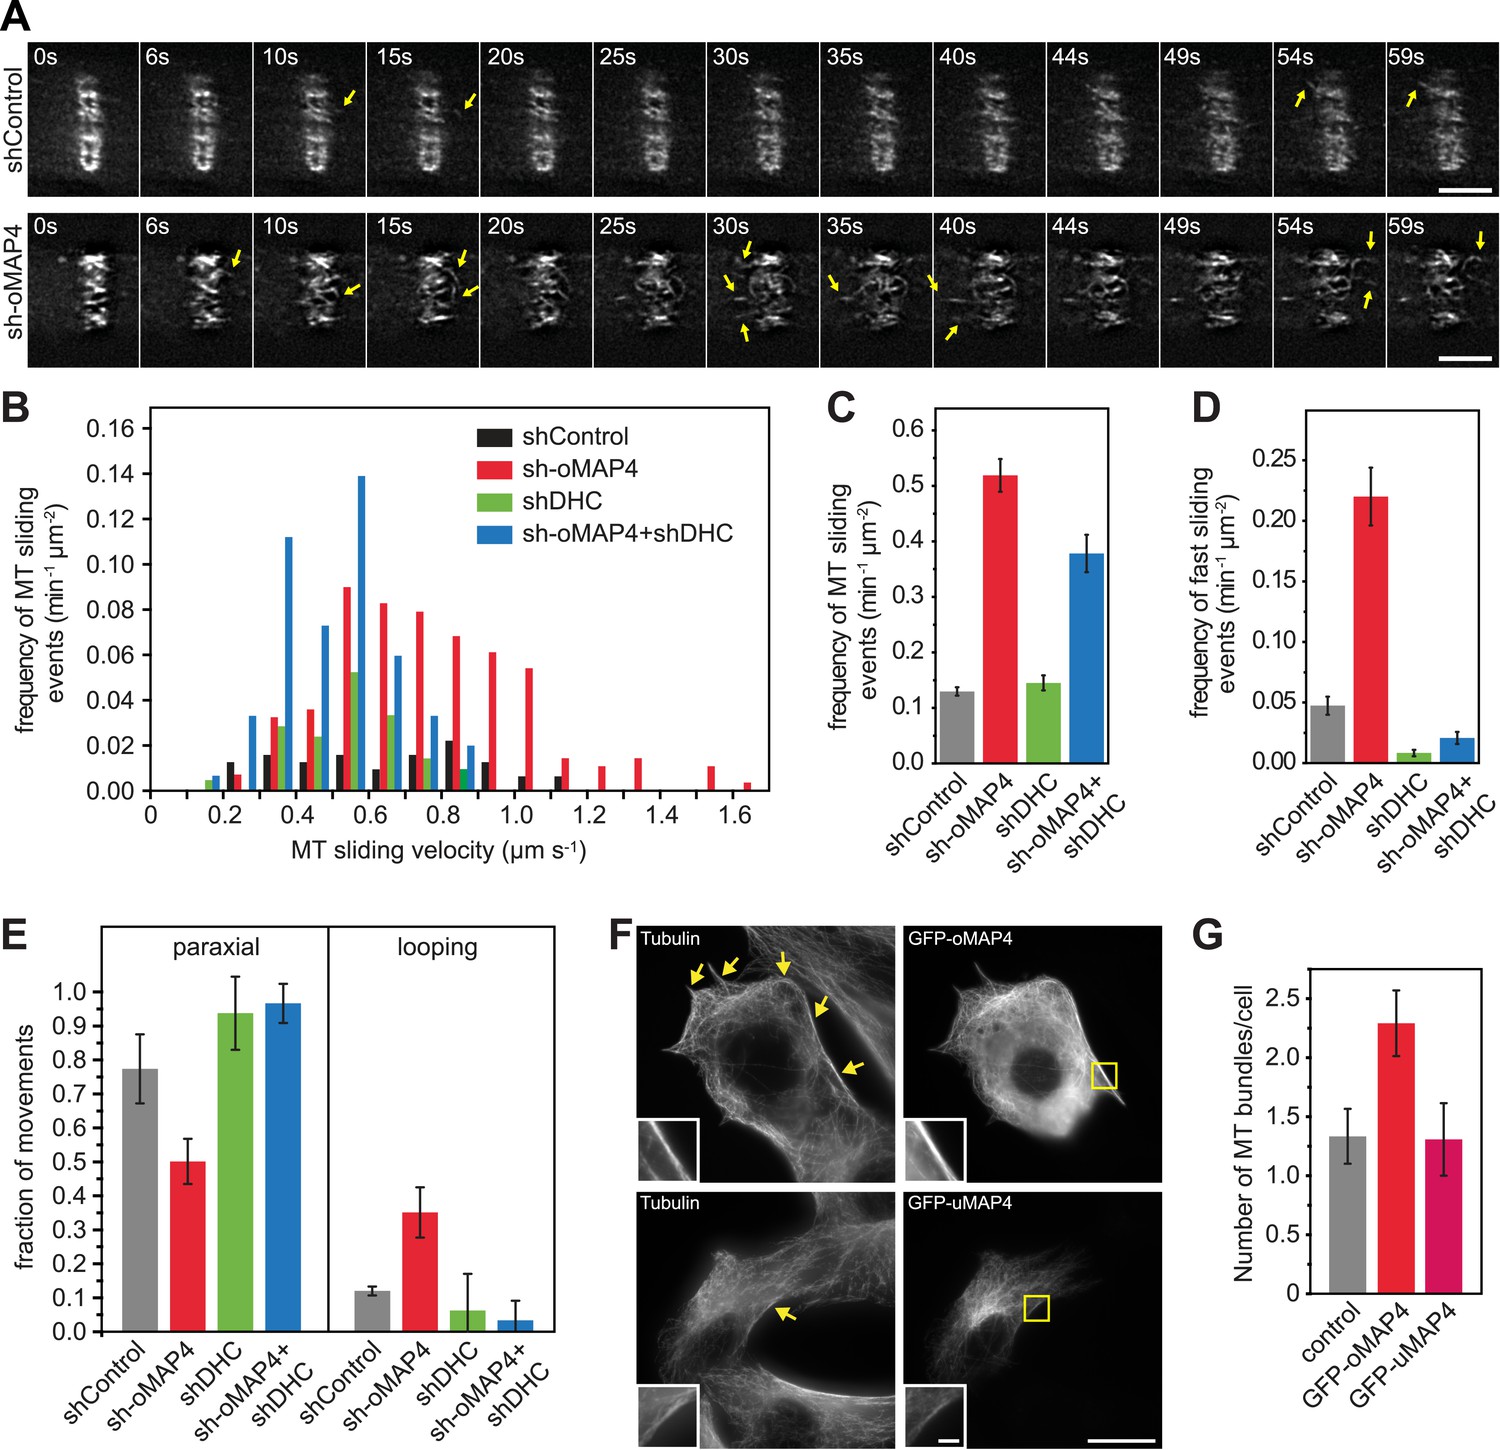
oMAP4 prevents microtubule sliding in cells.
(A) Microtubule motility (arrows) observed after photoconversion of mEOS2-Tubulin in 48 hr differentiated cells treated with shRNA as indicated. Scale bars 5 μm. See supplementary Videos 10, 11. (B) Frequency of microtubule motility events relative to average sliding velocity in 48-hr differentiated cells treated with shRNA as indicated. Data pooled from three experiments, n = 15–23 cells. (C and D) Frequency of microtubule motility events: all events are shown in C, while only fast sliding events are shown in D. The latter were defined as movement faster than 700 nm/s. Data show mean ± SD, n = 3 experiments, 15–23 cells. (E) Directionality of microtubule motility events. Paraxial movement is defined as occurring parallel to the long cell axis with a deviation less than 45°. Looping microtubules changed direction by more than 90° during the movement event. Data show mean ± SD, n = 3 experiments, 15–23 cells. (F and G) Expression of GFP-oMAP4 (upper row) or GFP-uMAP4 (lower row) in undifferentiated C2C12 cells stained with tubulin antibodies. The number of strong microtubule bundles (arrows) of at least 2-μm length and threefold intensity of an individual microtubule was scored. Data in g show mean ± SEM, n = 13–23 cells. oMAP4 causes statistically significant change (p = 0.02). Scale bar 20 μm, 2 μm in insets.
Figure 4—figure supplement 1
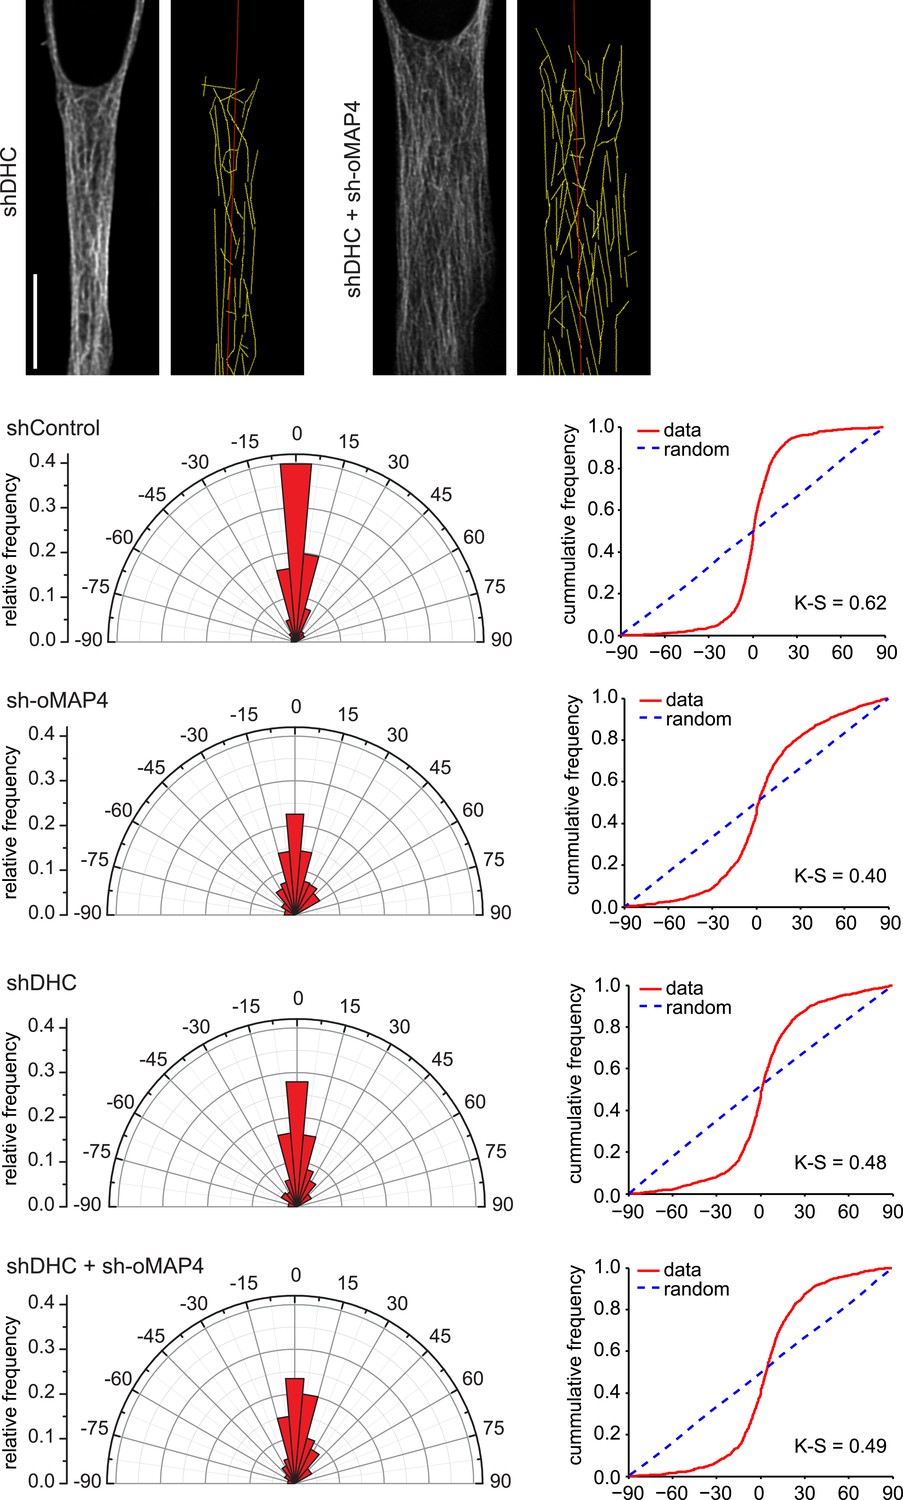
Microtubule orientation in depleted cells.
Examples of microtubule traces (yellow) in dynein depleted and dynein + oMAP4-depleted 48 hr differentiated elongated myoblasts, see Figure 3G for examples for control and oMAP4 depletion. Angular distribution and cumulative frequency of microtubule orientation relative to the main cell axis (red) is shown for data pooled from three experiments. Kuiper statistic relative to random distribution is calculated as in Figure 1C.
Figure 5
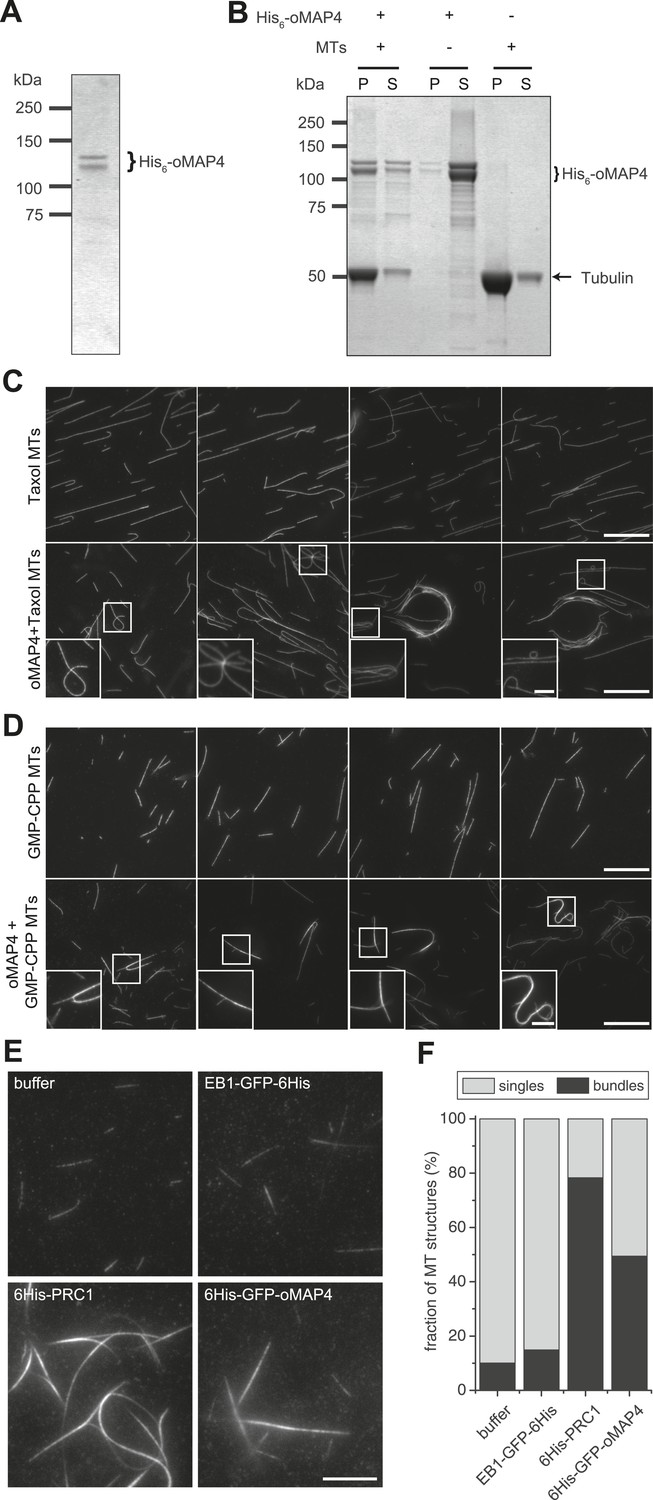
oMAP4 bundles microtubules in vitro.
(A) SDS-PAGE analysis of oMAP4 protein purification. N-terminally 6xHis tagged full-length oMAP4 was purified by Ni2+-NTA affinity chromatography followed by ion exchange chromatography. (B) Microtubule co-sedimentation analysis of oMAP4 protein. Purified protein from (A) was incubated with Taxol-stabilised microtubules prior to centrifugation. Separate centrifugations of microtubules alone and oMAP4 protein alone were used as controls. Pellet and supernatant fractions were analysed by SDS-PAGE and Coomassie staining. (C and D) Analysis of microtubule bundling by oMAP4 in vitro. Taxol- or GMP-CPP-stabilised microtubules were incubated with buffer or 60 nM purified oMAP4 protein before spreading on glass for imaging. Insets show various microtubule crosslinking and bundling events. Scale bars 20 μm, 5 μm in insets. (E and F) Comparison of bundling efficiency of oMAP4 with negative control (EB1) and positive control (PRC1). Representative image and data quantified from >300 microtubules are shown. Scale bar 10 μm.
Figure 6 with 1 supplement
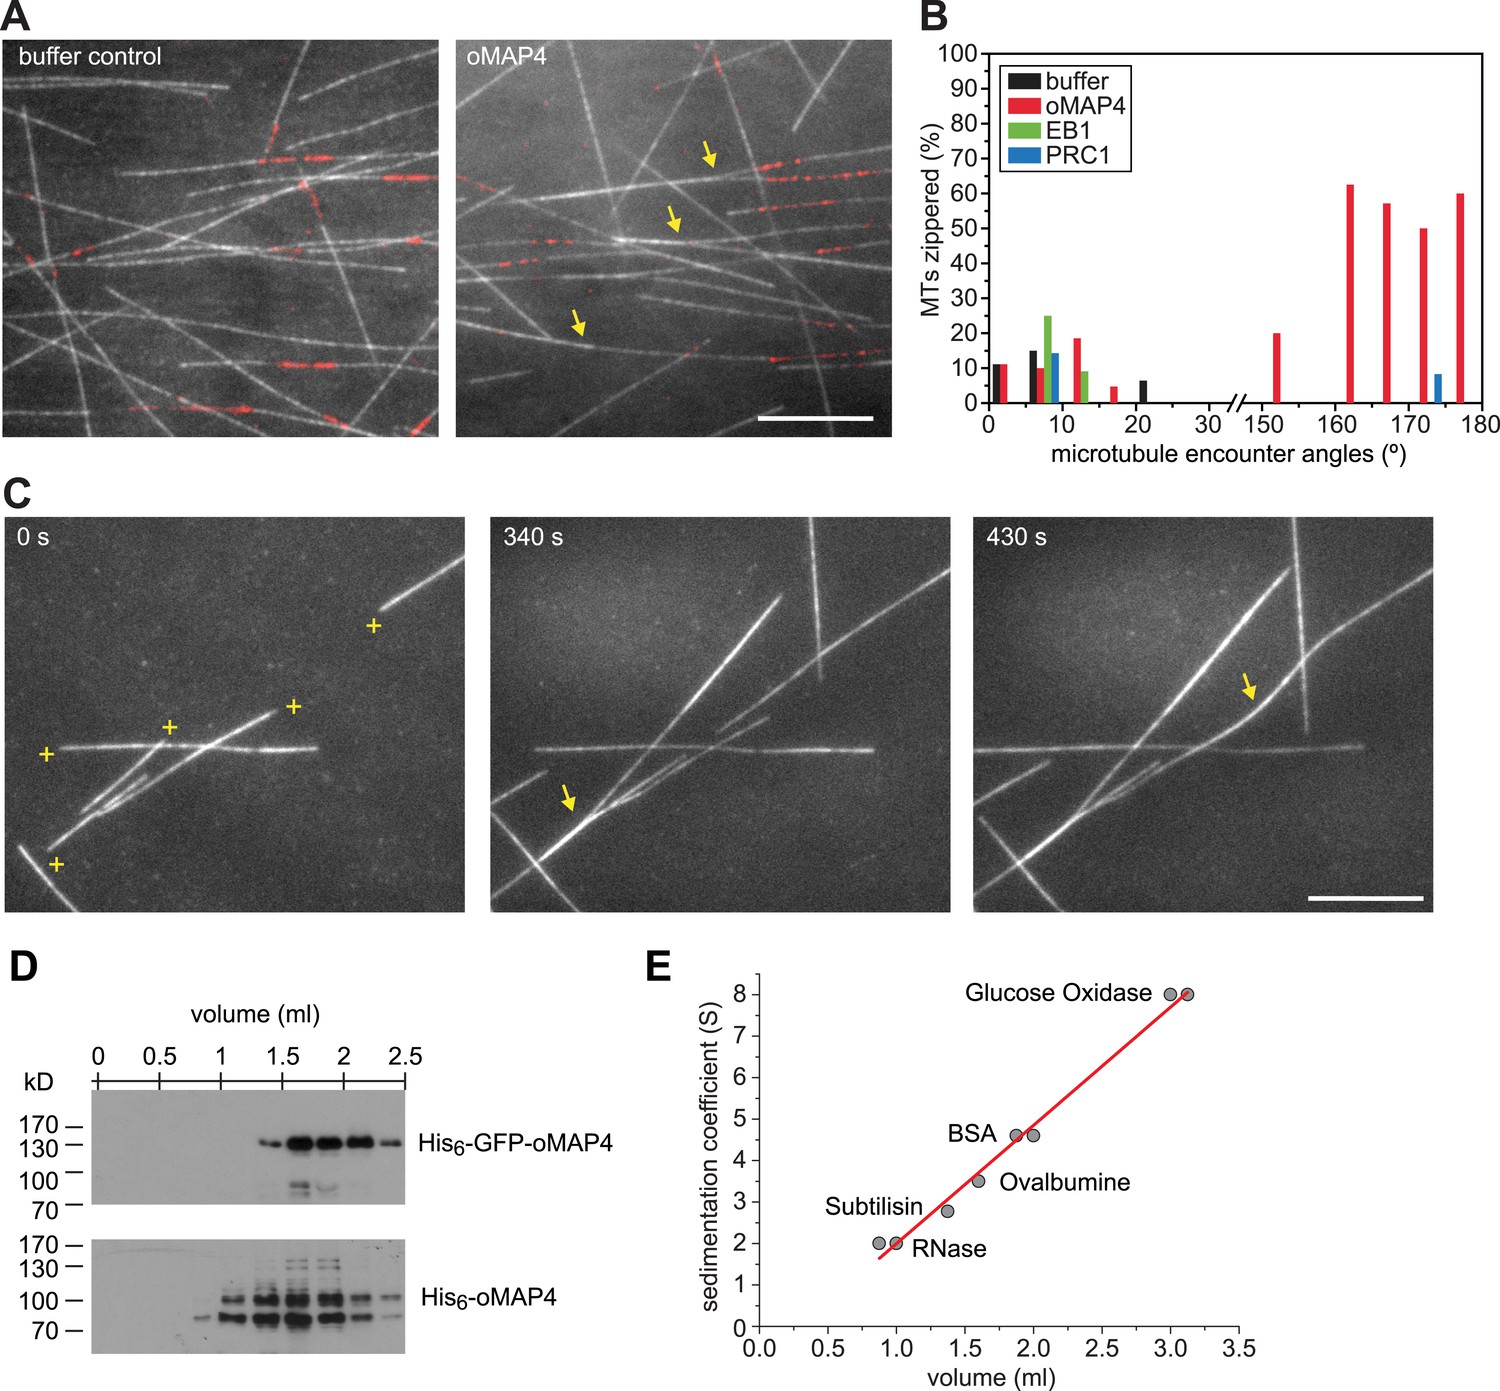
oMAP4 zippers dynamic microtubules with a bias for antiparallel arrangements.
(A) Dynamic Rhodamine-labelled microtubules (greyscale) assembled from immobilised Hilyte640-labelled seeds (red) in vitro are zippered in the presence of oMAP4. Arrows highlight bundled microtubules. Scale bar 10 μm. (B) Histogram showing proportion of microtubule encounters leading to MT zippering relative to microtubule encounter angles. Antiparallel encounters are observed at angles above 90°. Note no zippering occurs between 25 and 150°. Data for GFP-oMAP4, EB1-GFP and PRC1, each at 80 nM concentration are shown for comparison. n ≥ 400 microtubule encounters for control and oMAP4, 136 encounters for PRC1 and 184 encounters for EB1. (C) Example of zippering events (arrows) in the presence of 80 nM oMAP4-GFP. Microtubule polarity is indicated with (+) at the dynamic plus end. See supplementary Videos 12, 13. Scale bar 10 μm. (D and E) Immunoblot of oMAP4 in fractions from glycerol gradients to determine its sedimentation coefficient with volume from top of gradient indicated (D). Calibration curve using standard proteins with known sedimentation coefficients and linear regression curve (E).
Figure 6—figure supplement 1
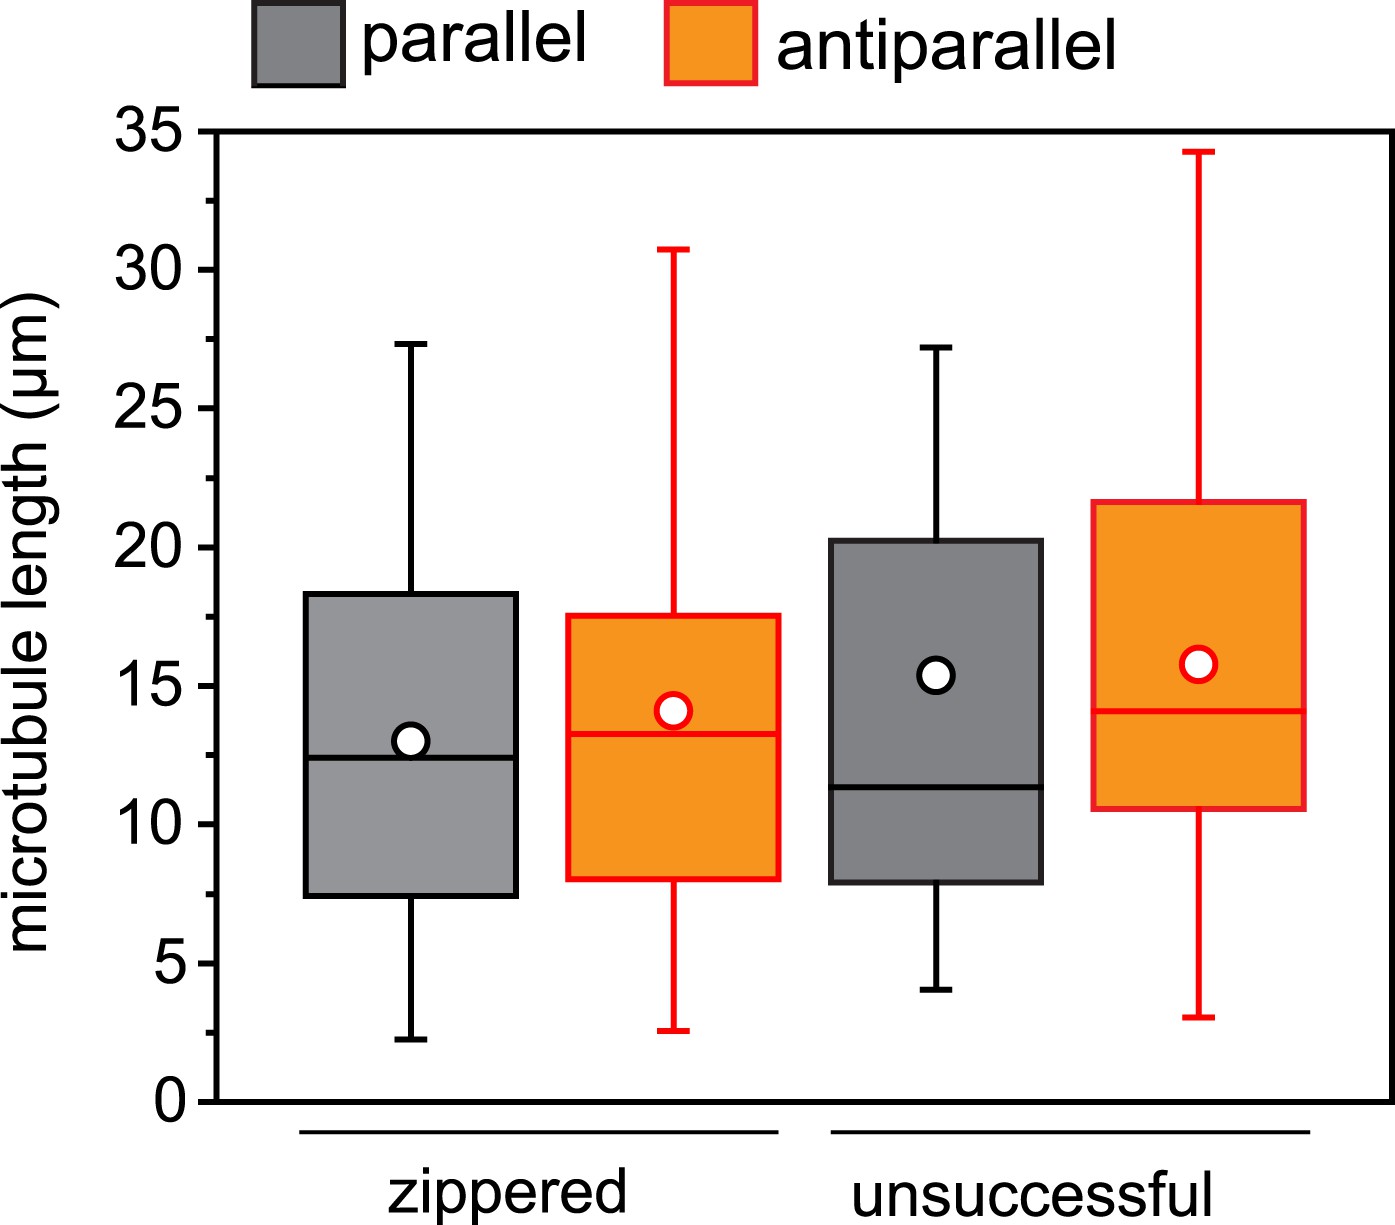
Microtubule length distribution in zippering experiments.
For microtubule encounters between 10 and 30° incident angle in (near) parallel or (near) antiparallel orientation, the length of each microtubule was measured to the attached seed or the closest crossover point. None of the distributions are significantly different. n = 22–54 encounters.
Figure 7
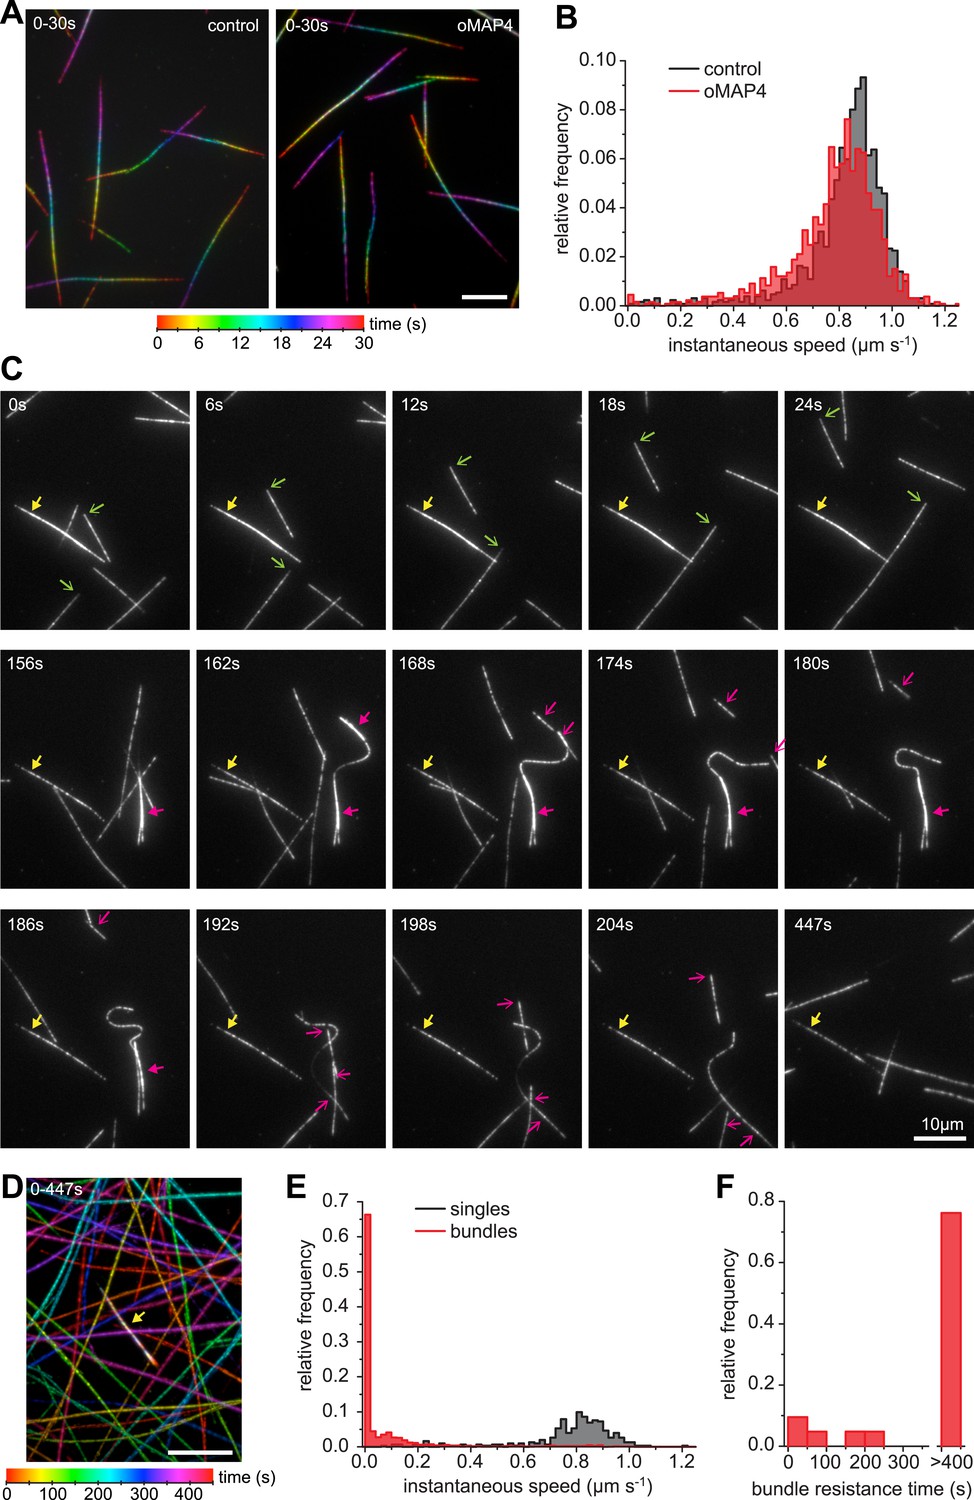
oMAP4 bundles can withstand motor forces.
(A) Microtubule gliding assay on a Drosophila kinesin-1-coated surface. Time colour-coded projections over 30 s are shown for buffer control and 80 nM oMAP4. (B) Instantaneous speeds of microtubule motility were determined from tracks of 50 microtubules and shown as histograms. The presence of 80 nM oMAP4 reduces velocity of single microtubules by about 5%. (C) Microtubule bundles formed in solution by oMAP4 and landing on the kinesin-coated surface tend not to move (yellow filled arrows), while single microtubules do (green arrows). In about 25% of cases, bundles are driven apart by motor forces (magenta filled arrows) with microtubules gliding apart at normal speed once separated (magenta arrows). See supplementary Video 14. (D) Time colour-coded projection of gliding assay showing a microtubule bundle (arrow, appears white due to averaging of all time points) and individual microtubules over 447 s in the presence of 80 nM oMAP4. (E) Instantaneous speeds of microtubule motility were determined from tracks of 20 single and bundled microtubules and shown as histograms. (F) Time between start of observation and either end of observation or time when bundle was separated by motor forces. Bundles that moved out of the field or dissociated as intact bundle were not scored.
Figure 8
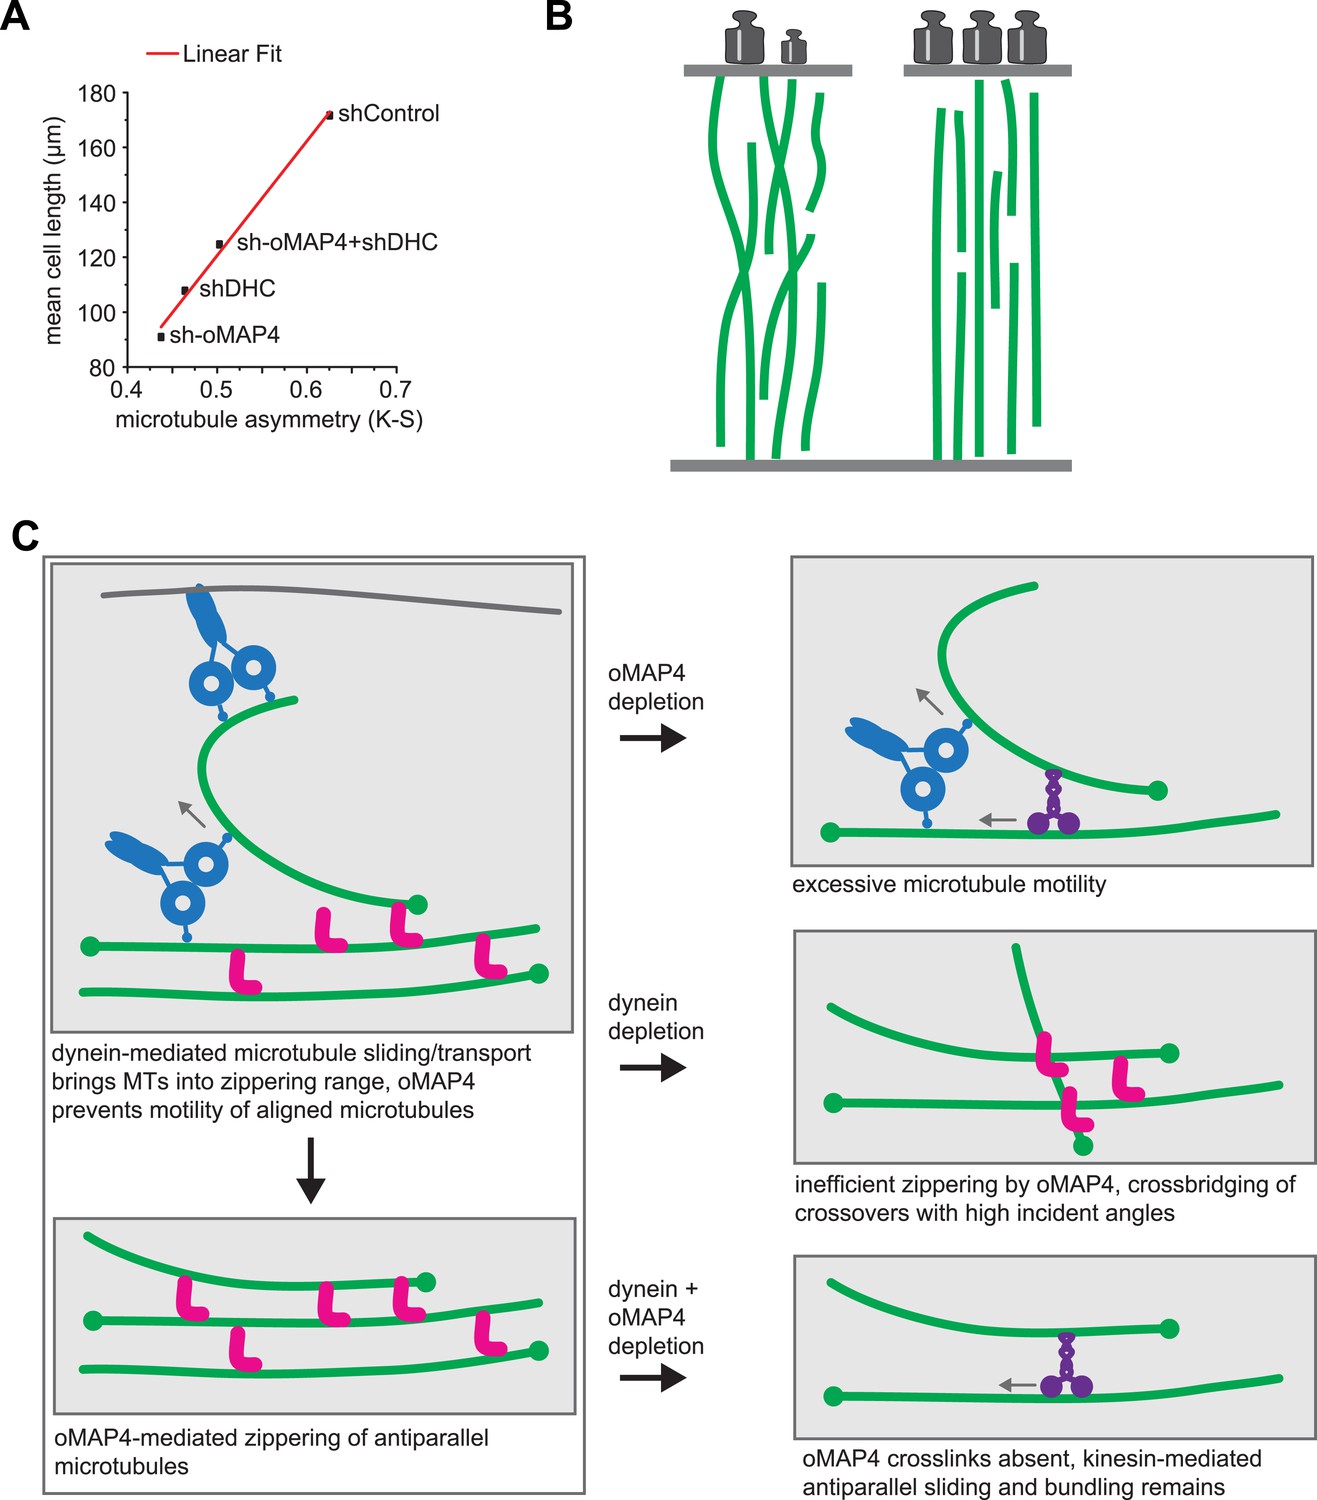
oMAP4 and dynein co-operate in the organisation of the paraxial microtubule network in differentiating muscle cells.
(A) Kuiper statistics of traced microtubule filaments as in Figures 3G, 4, Figure 4—figure supplement 1 as a measure for microtubule orderliness is plotted against the mean cell length of 48 hr differentiated C2C12 myoblasts treated with shRNAs as indicated. A linear fit to the data is shown. (B) We propose that the correlation between the precision of paraxial alignment and cell elongation suggests that ordered microtubule arrays confer higher mechanical stability to counteract contractile forces. (C) Model of cooperation of oMAP4-mediated zippering with motor-driven microtubule sliding/transport in the formation of a highly ordered paraxial microtubule network. Microtubules are indicated in green, oMAP4 in magenta, dynein in blue, and kinesin in purple.
Videos
Video 1
Photoconversion of mEos2-Tubulin in an undifferentiated C2C12 myoblast showing converted (left panel and magenta in right panel) and non-converted channels (middle panel and green in right panel).
Scale bar: 10 μm.
Video 2
Photoactivation of bar-shaped patterns of paGFP-Tubulin in an undifferentiated C2C12 myoblast.
Scale bar: 10 μm.
Video 3
Photoactivation of bar-shaped patterns of paGFP-Tubulin in a 94-hr differentiated C2C12 myoblast.
Scale bar: 10 μm.
Video 4
Photoactivation of bar-shaped patterns of paGFP-Tubulin in an undifferentiated C2C12 myoblast treated with shRNA against dynein heavy chain.
Scale bar: 10 μm.
Video 5
Photoactivation of bar-shaped patterns of paGFP-Tubulin in an undifferentiated C2C12 myoblast treated with shRNA against kinesin heavy chain (Kif5b).
Scale bar: 10 μm.
Video 6
Microtubule orientation in a 48 hr differentiated C2C12 myoblast treated with shControl co-expressing GFP-Tubulin.
Manual tracing of microtubule cytoskeleton (yellow lines) and main cell axis (red line) shown as used for analysis. Scale bar: 10 μm.
Video 7
Microtubule orientation in a 48-hr differentiated C2C12 myoblast treated with sh-oMAP4 co-expressing GFP-Tubulin.
Manual tracing of microtubule cytoskeleton (yellow lines) and main cell axis (red line) shown as used for analysis. Scale bar: 10 μm.
Video 8
Growing microtubules in a 48-hr differentiated C2C12 myoblast treated with sh-Control co-expressing EB3-tdTomato.
Scale bar: 10 μm.
Video 9
Growing microtubules in a 48-hr differentiated C2C12 myoblast treated with sh-oMAP4 co-expressing EB3-tdTomato.
Scale bar: 10 μm.
Video 10
Photoconversion of bar-shaped patterns of mEOS2-Tubulin in a 48-hr differentiated C2C12 myoblast treated with shControl.
Scale bar: 10 μm.
Video 11
Photoconversion of bar-shaped patterns of mEOS2-Tubulin in a 48-hr differentiated C2C12 myoblast treated with sh-oMAP4.
Scale bar: 10 μm.
Video 12
TIRF-based assay showing dynamic Rhodamine-labelled microtubules assembled from immobilised seeds.
Scale bar: 10 μm.
Video 13
TIRF-based assay showing dynamic microtubules in the presence of 80 nM GFP-oMAP4.
Note that antiparallel microtubule encounters result in zippering into an antiparallel bundle in most cases. Scale bar: 10 μm.
Video 14
Microtubule gliding assay on a kinesin-1-coated surface in the presence of 80 nM GFP-oMAP4.
Note that single microtubules move persistently, while bundles don't until they are driven apart. Scale bar: 10 μm.
Additional files
-
Supplementary file 1
RNAseq_Myoblast_Myocyte. RNA sequencing data for C2C12 myoblasts and 60 hr differentiated myocytes (Trapnell et al., 2010) extracted for four regions in MAP4 as shown in Figure 2—figure supplement 1.
- https://doi.org/10.7554/eLife.05697.038
-
Supplementary file 2
Affymetrix Exon Arrays. Affymetrix exon array data (Pohl et al., 2009) for four regions in MAP4 as shown in Figure 2—figure supplement 1.
- https://doi.org/10.7554/eLife.05697.039
-
Source code 1
MATLAB code MTdirectionality. Custom MATLAB function to compute directionality of MT growth relative to the main cell axis, generate figure with tracks colour-coded for direction, plot angular histograms and calculate Kuiper statistics relative to a random distribution.
- https://doi.org/10.7554/eLife.05697.040
Download links
A two-part list of links to download the article, or parts of the article, in various formats.
Downloads (link to download the article as PDF)
Open citations (links to open the citations from this article in various online reference manager services)
Cite this article (links to download the citations from this article in formats compatible with various reference manager tools)
A novel isoform of MAP4 organises the paraxial microtubule array required for muscle cell differentiation
eLife 4:e05697.
https://doi.org/10.7554/eLife.05697


