Nrg1 is an injury-induced cardiomyocyte mitogen for the endogenous heart regeneration program in zebrafish
- Howard Hughes Medical Institute, Duke University Medical Center, United States
Figures
Figure 1
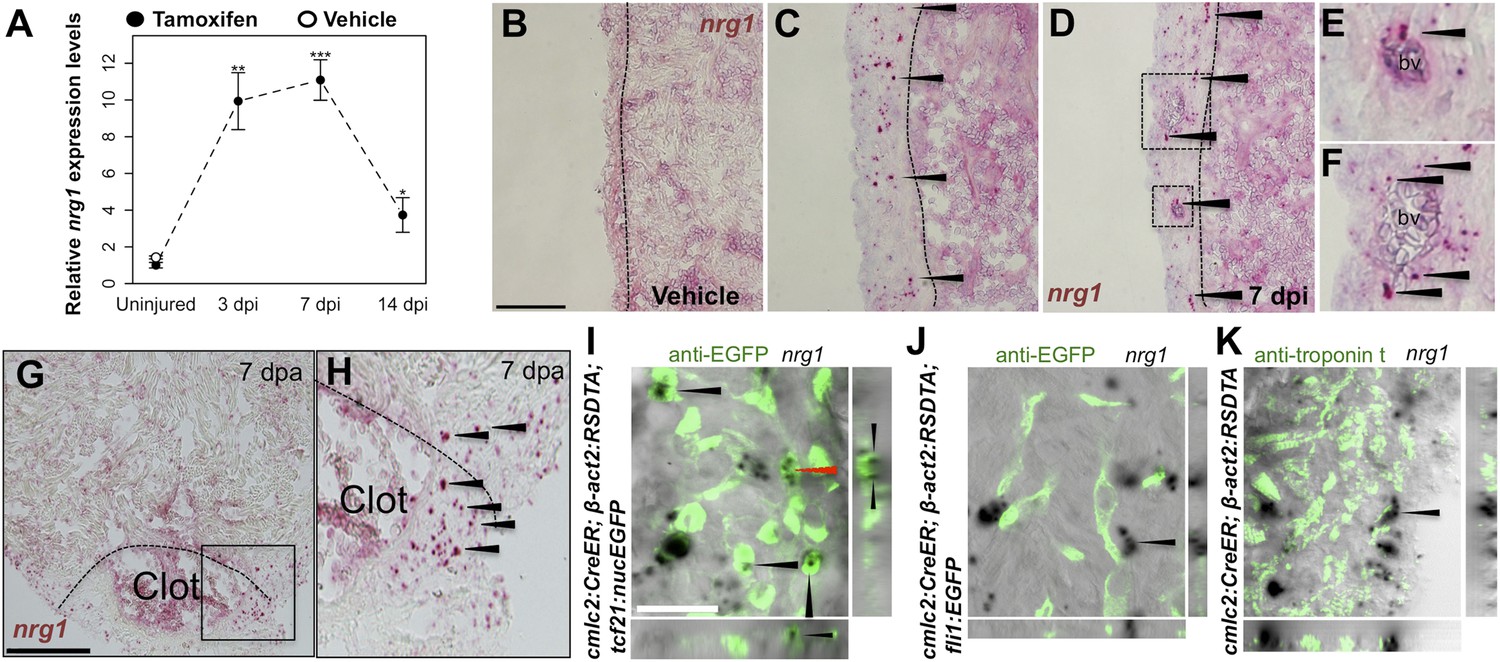
Induction of Nrg1 after cardiac injury.
(A) Time course of nrg1 induction in cardiac ventricles following severe genetic ablation of cardiomyocytes. nrg1 mRNA levels were assessed by qPCR at 3, 7, and 14 days after ablation injury in tamoxifen-treated cmlc2:CreER; β-act2:RSDTA animals relative to control cmlc2:CreER animals (closed circles). cmlc2:CreER; β-act2:RSDTA (open circle) vehicle-treated animals serve as an additional control. Data are presented as mean ± SE. *p < 0.05, **p < 0.01, ***p < 0.001, Student's t-test, two-tailed. (B–F) Section images of in situ hybridization experiments assessed for nrg1 expression in uninjured ventricles (B) or at 7 days after induced cardiomyocyte ablation (C and D). Dashed lines delineate the ventricular wall from the trabecular compartment. Higher magnification of boxes in (E) and (F) reveal nrg1 signals surrounding vessels (bv). Arrowheads indicate examples of RNAscope signals. Scale bar represents 100 µm (A and C). (G and H) Section images of RNAScope in situ hybridization analysis for nrg1 expression at 7 days after ventricular resection surgery. Image in (H) is a higher magnification of box in (G). Arrowheads indicate examples of RNAscope signals. Scale bar represents 100 µm. (I–K) Confocal slice images, with accompanying orthogonal views, of nrg1 expression colocalized with tcf21:nucEGFP (I), fli1:EGFP (J), or cardiac muscle (Troponin, K). Arrows point to RNAscope signal, and red arrows indicate area for orthogonal views. Scale bar represents 20 µm.
Figure 2
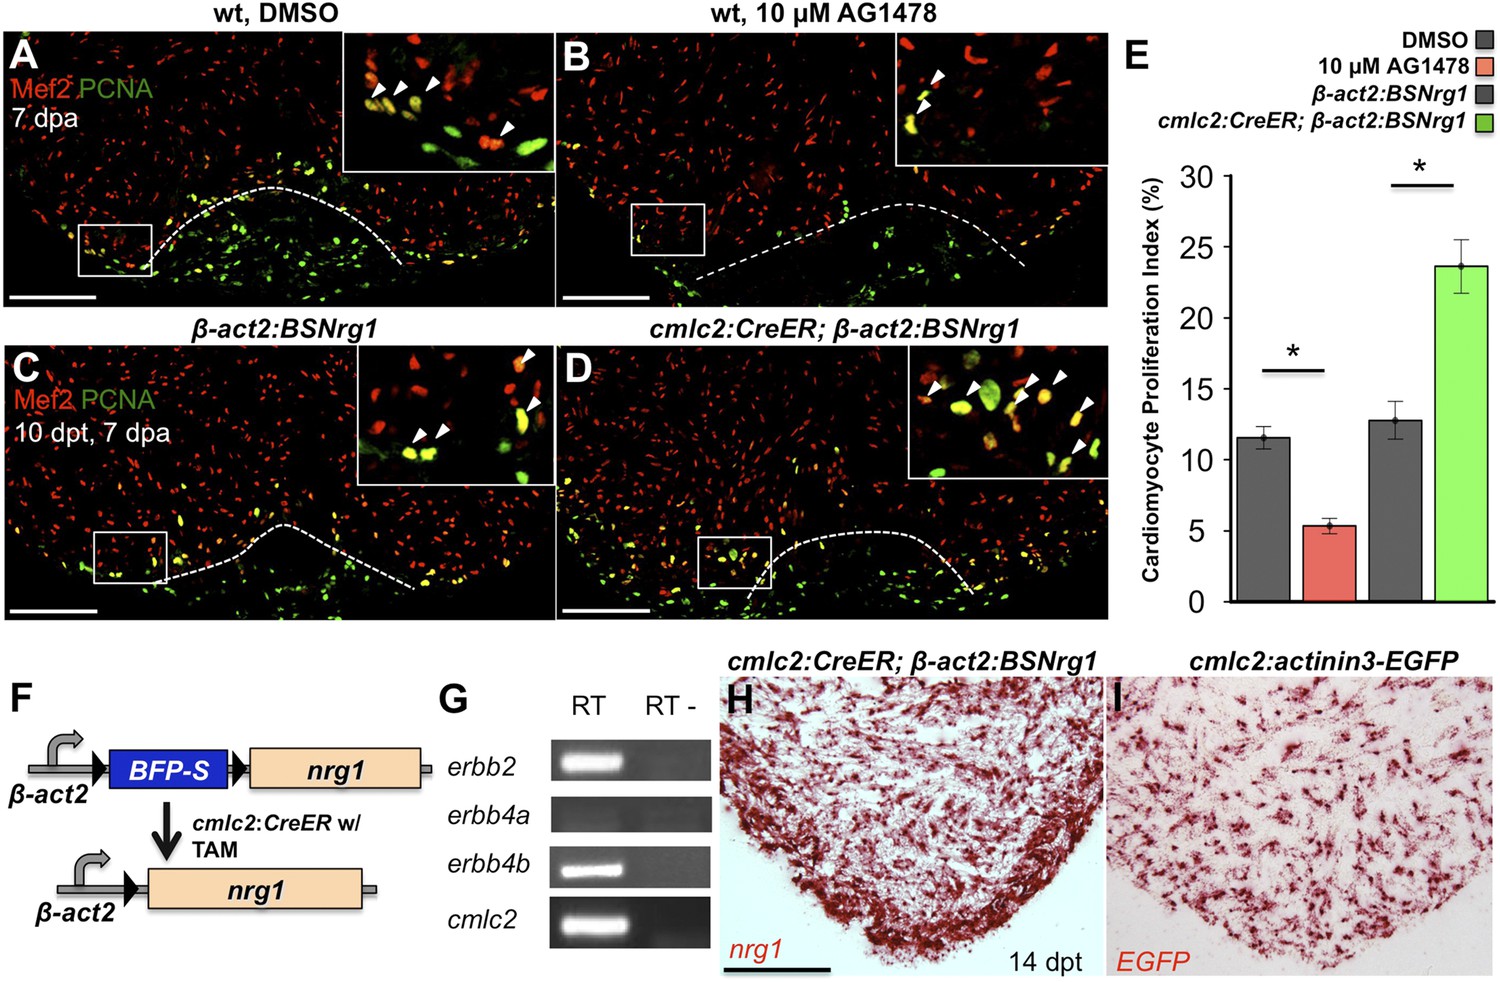
Nrg1 signaling modulates cardiomyocyte proliferation during regeneration.
(A and B) Section images of injured ventricular apices of animals treated from 6 to 7 dpa with DMSO (A) or 10 µM AG1478 (B) and stained for Mef2+PCNA+ cells (arrowheads). Wounds are indicated by dotted lines. Scale bar represents 100 µm. (C and D) Section images of 7 dpa ventricular apices of control β-act2:BSNrg1 (C) or cmlc2:CreER; β-act2:BSNrg1 (D) animals treated with tamoxifen at 3 days before injury, stained for Mef2+PCNA+ cells (arrowheads). Scale bar represents 100 µm. (E) Quantification of cardiomyocyte proliferation at 7 dpa. DMSO-treated wild-type clutchmates (n = 22) were used as controls for 10 µM AG1478 treatment (n = 20), and tamoxifen-treated β-act2:BSNrg1 clutchmates (n = 15) were controls for cmlc2:CreER; β-act2:BSNrg1 (n = 18) animals. Data are represented as mean ± SEM. *p < 0.05, Mann–Whitney Ranked Sum Test. (F) Cartoon schematic of β-act2:BSNrg1 transgene. (G) RT-PCR results for erbb2, erbb4a, and erbb4b, indicating the presence of erbb2 and erbb4b messages in the uninjured adult ventricle. cmlc2 is shown as a control. (H) Section image of RNAscope in situ hybridization analysis for nrg1 expression at 14 days after tamoxifen-released expression in uninjured cmlc2:CreER; β-act2:BSNrg1 ventricles. (I) Section image of RNAscope in situ hybridization analysis for EGFP expression in uninjured cmlc2:actinin3-EGFP ventricles, used as a control to detect transgenic signals. Scale bar represents 100 µm.
Figure 3
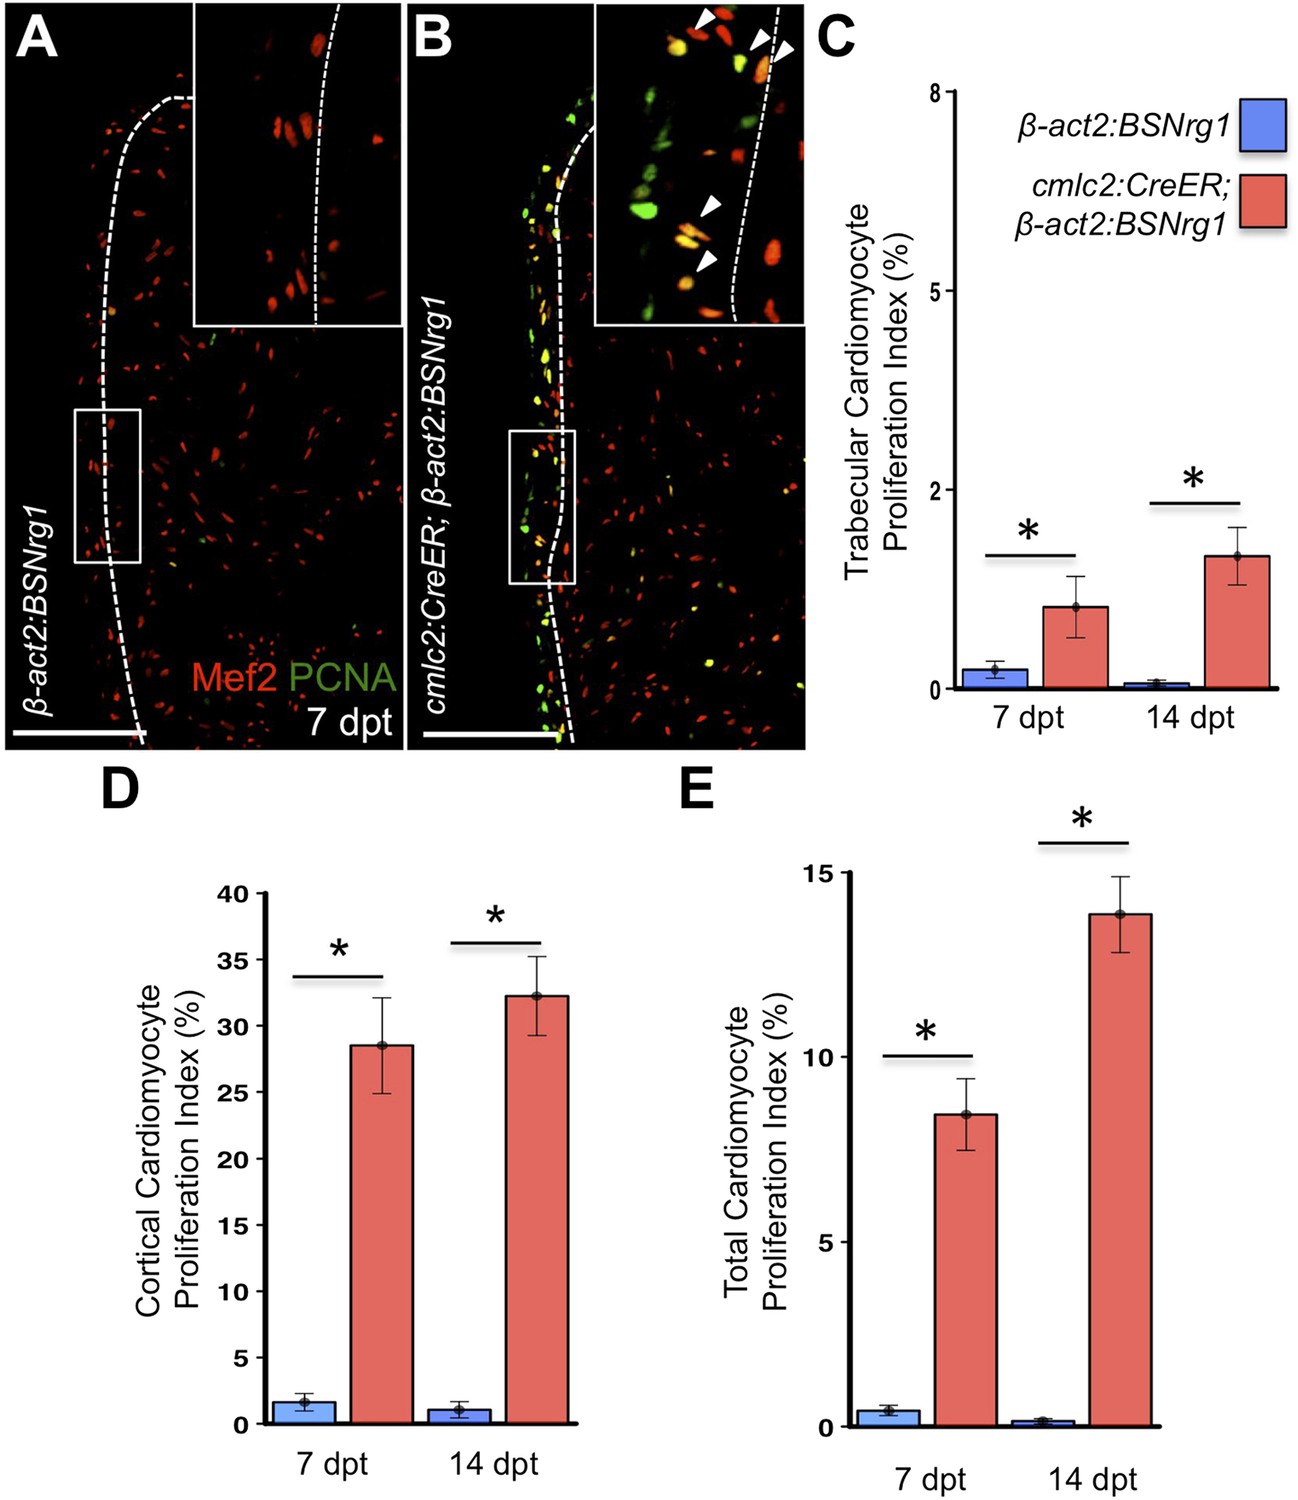
Nrg1 reactivation without injury induces proliferation of ventricular wall cardiomyocytes.
(A and B) Section images from uninjured cmlc2:CreER; β-act2:BSNrg1 and control ventricles at 7 days post-tamoxifen treatment (dpt), stained for Mef2+PCNA+ cells. Insets show high-zoom views of the boxed regions, and arrowheads indicate Mef2+PCNA+ nuclei. Dashed lines delineate cortical (wall) from trabecular muscle. Scale bars represent 100 µm. (C) Quantification of cardiomyocyte proliferation in cmlc2:CreER; β-act2:BSNrg1 and controls in the trabecular muscle compartment at 7 (n = 8, 9) and 14 dpt (n = 10, 10). Data are represented as mean ± SEM. *p < 0.05, Mann–Whitney Ranked Sum Test. (D) Quantification of cardiomyocyte proliferation in cortical muscle at 7 (n = 8, 9) and 14 dpt (n = 10, 10), from groups in (A and B). Data are represented as mean ± SEM. *p < 0.05, Mann–Whitney Ranked Sum Test. (E) Quantification of total cardiomyocyte proliferation at 7 (n = 8, 9) and 14 dpt (n = 10, 10), from groups in (C and D). Data are represented as mean ± SEM. *p < 0.05, Mann–Whitney Ranked Sum Test.
Figure 4
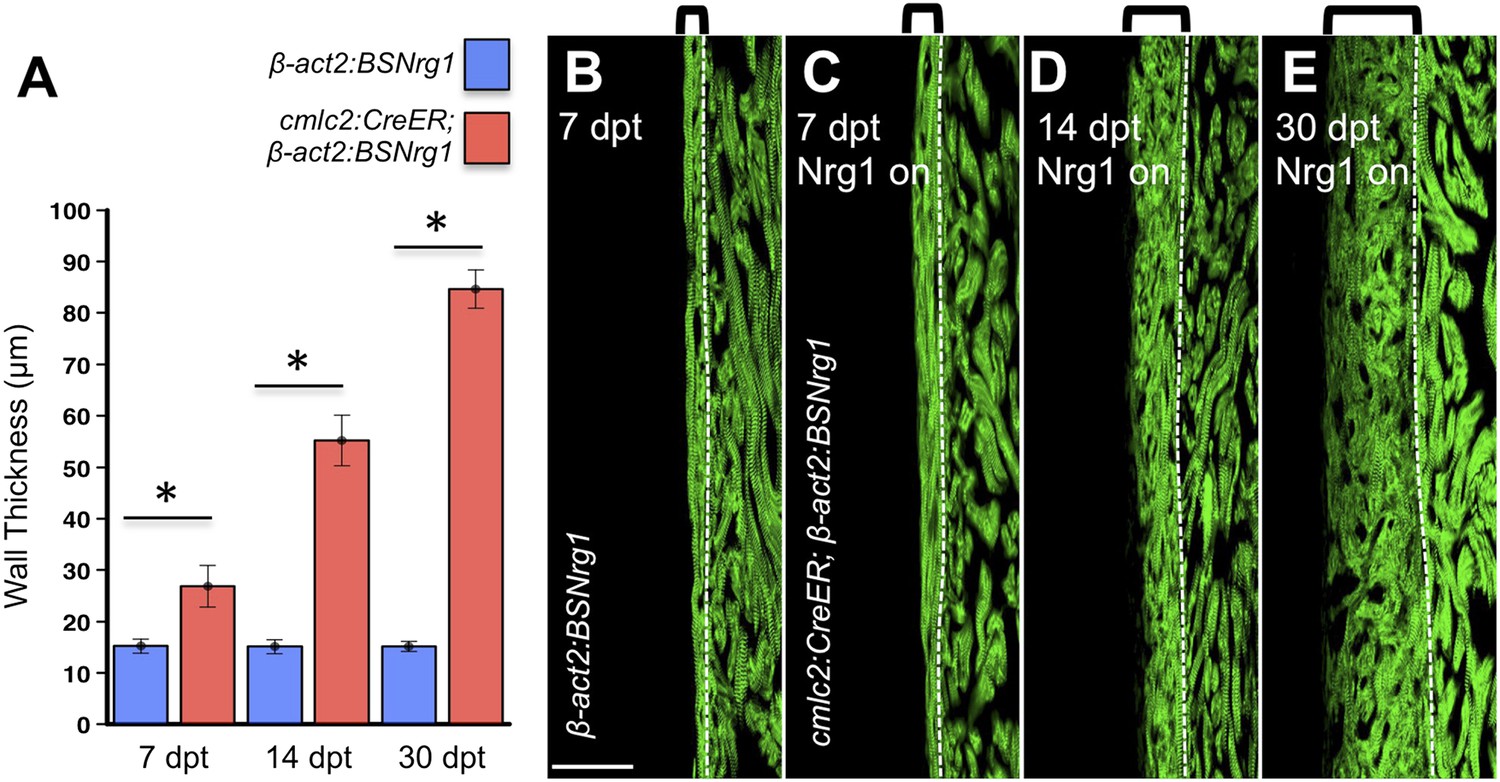
Nrg1-induced cardiomyocyte proliferation expands the ventricular wall.
(A) Quantification of cortical muscle thickness at 7 (n = 8, 9), 14 (n = 10, 11), and 30 dpt (n = 11, 11). Data are represented as mean ± SEM. *p < 0.05, Student's t-test, two-tailed. (B–E) Section images of cmlc2:CreER; β-act2:BSNrg1 (Nrg1 on) and control ventricles from 7 to 30 dpt, using animals also transgenic for cmlc2:actinin3-EGFP to indicate sarcomere organization. Brackets indicate cortical muscle, and dashed lines delineate cortical from trabecular muscle. Scale bar represents 100 µm.
Figure 5
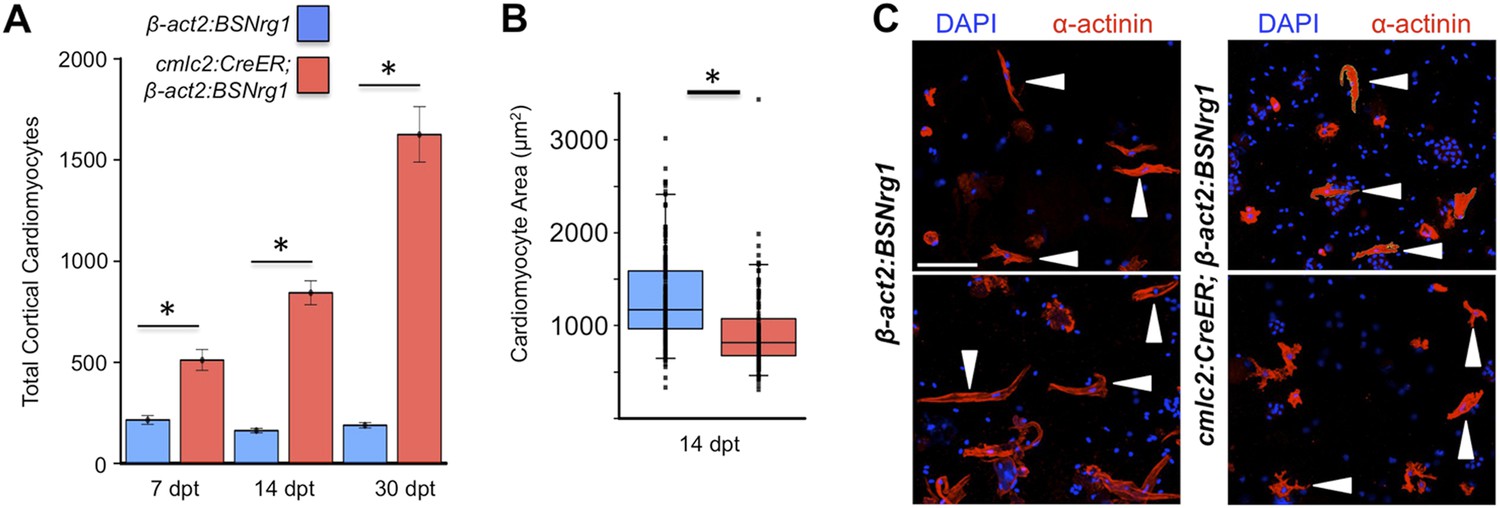
Nrg1 induces a hyperplastic, not hypertrophic, response.
(A) Quantification of total ventricular wall cardiomyocytes in cmlc2:CreER; β-act2:BSNrg1 animals and controls at 7 (n = 8, 9) and 14 dpt (n = 10, 10). Data are represented as mean ± SEM. *p < 0.05, Student's t-test, two-tailed. (B) Quantification of cardiomyocyte area in cmlc2:CreER; β-act2:BSNrg1 animals and controls at 14 dpt. Data are represented as mean ± SD, with all data points represented. *p < 0.05, Student's t-test, two-tailed. (C) Confocal images of dissociated cardiomyocytes from cmlc2:CreER; β-act2:BSNrg1 (right) and controls (left) at 14 dpt (n = 124, 172). Only cardiomyocytes with visible sarcomeres and nuclei were measured. Examples of quantified cells are marked with arrowheads. Scale bar represents 100 µm.
Figure 6
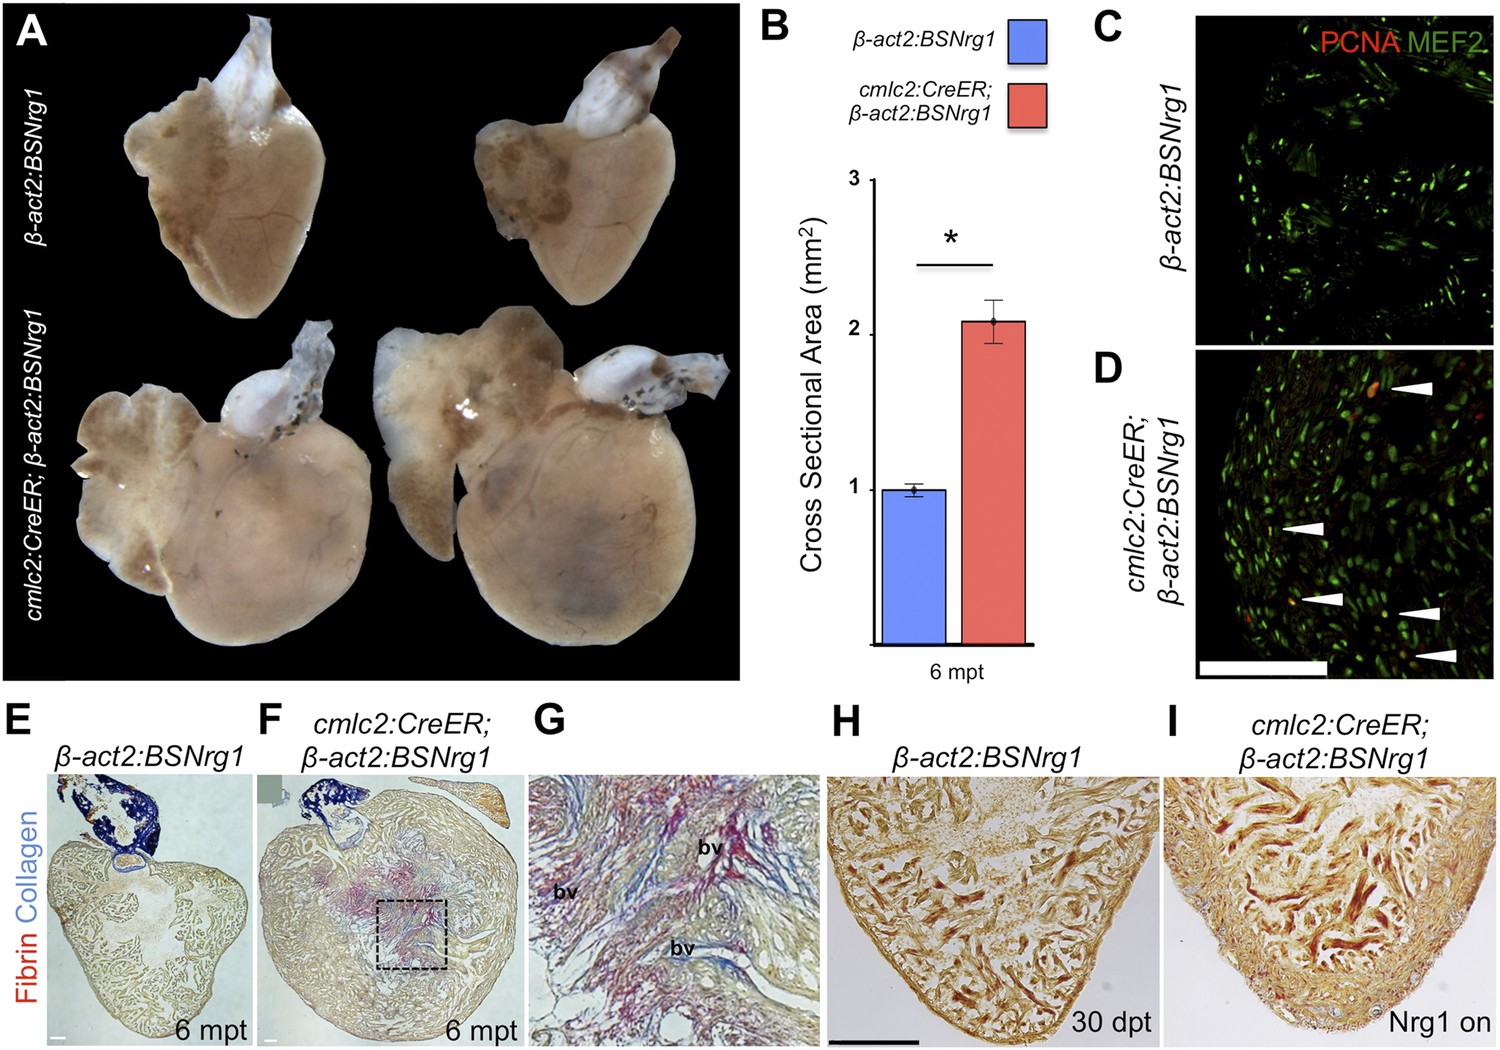
Nrg1-induced hyperplasia causes cardiomegaly.
(A) Whole-mount images of cmlc2:CreER; β-act2:BSNrg1 and control ventricles at 6 months post-tamoxifen treatment. (B) Quantification of the cross-sectional surface area of cmlc2:CreER; β-act2:BSNrg1 (n = 9) and control ventricles (n = 10) 6 months post-treatment, revealing cardiomegaly effects of nrg1 overexpression. Data are represented as mean ± SEM. *p < 0.05, Student's t-test, two-tailed. (C and D) Section images of ventricular walls of 6 mpt control β-act2:BSNrg1 (C) or cmlc2:CreER; β-act2:BSNrg1 animals (D) stained for Mef2+PCNA+ cells (arrowheads). Scale bar represents 100 µm. (E) Section images of control β-act2:BSNrg1 ventricles stained with Acid-Fuchsin Orange G (AFOG), revealing minimal collagen (blue), or fibrin deposition (red). Scale bar represents 100 µm. (F and G) Section images of cmlc2:CreER; β-act2:BSNrg1 ventricles stained with AFOG, revealing collagen (blue) and fibrin deposition (red) in the inner portions of the thickened ventricular wall. Image in (G) is a high-zoom view of box in (F) and also indicates two examples of large coronary vessels (bv). (H and I) Acid-Fuchsin Orange (AFOG) staining reveals minimal fibrosis in cmlc2:CreER; β-act2:BSNrg1 ventricle at 30 dpt despite the thickened ventricular wall (n = 7, 7). Scale bar represents 100 µm.
Figure 7
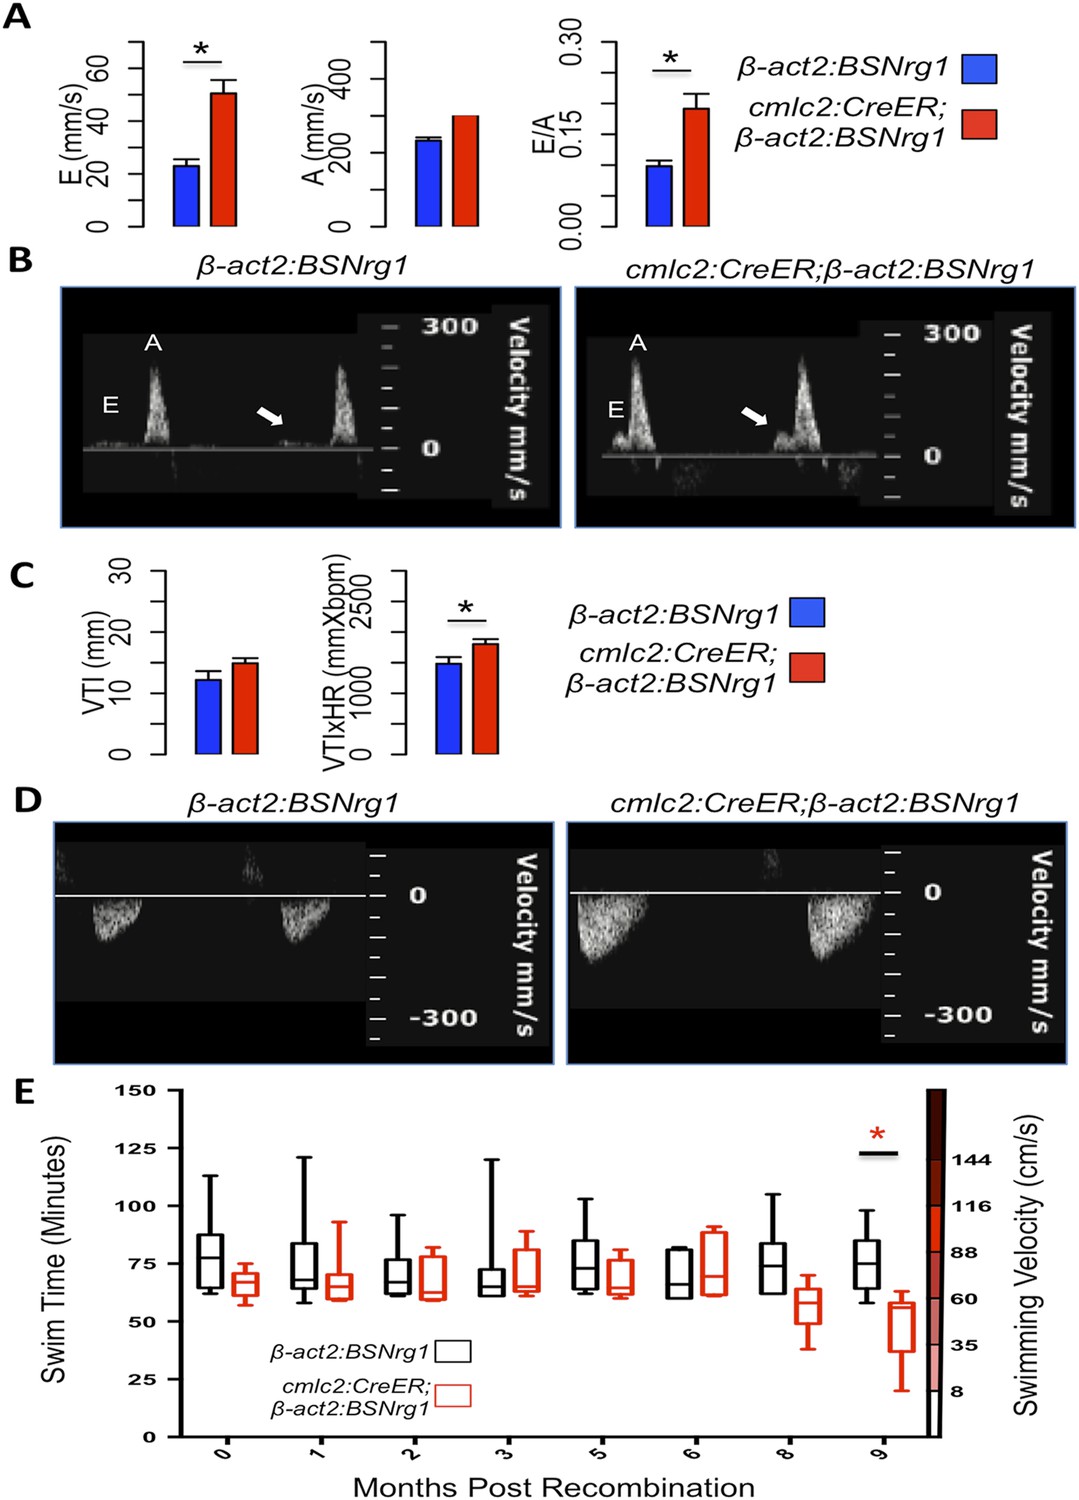
Effects of Nrg1 reactivation on cardiac function.
(A) Doppler measures of ventricular filling obtained at the AV valve in cmlc2:CreER; β-act2:BSNrg1 and β-act2:BSNrg1 animals (n = 9 and 7). Data are represented as mean ± SEM. *p < 0.05, Student's t-test, two-tailed. (B). Representative PW Doppler at the AV valve in cmlc2:CreER; β-act2:BSNrg1 and β-act2:BSNrg1 animals. Arrows indicate E waves. (C) Doppler measures of cardiac output and stroke volume using the velocity time integral (VTI) obtained at the outflow tract (OFT) in cmlc2:CreER; β-act2:BSNrg1 and β-act2:BSNrg1 animals (n = 9, 7). Data are represented as mean ± SEM. *p < 0.05, Student's t-test, two-tailed. (D) Representative PW Doppler at the OFT in cmlc2:CreER; β-act2:BSNrg1 and β-act2:BSNrg1 animals. (E) Quantification of graded swimming performance of animals at varying times of nrg1 overexpression plotted as box and whisker plots. Two-way ANOVA was performed looking at the effect of Nrg1 overexpression (p < 0.05), age (p = 0.38), and the interaction of Nrg1 overexpression and age (p < 0.05).
Figure 8
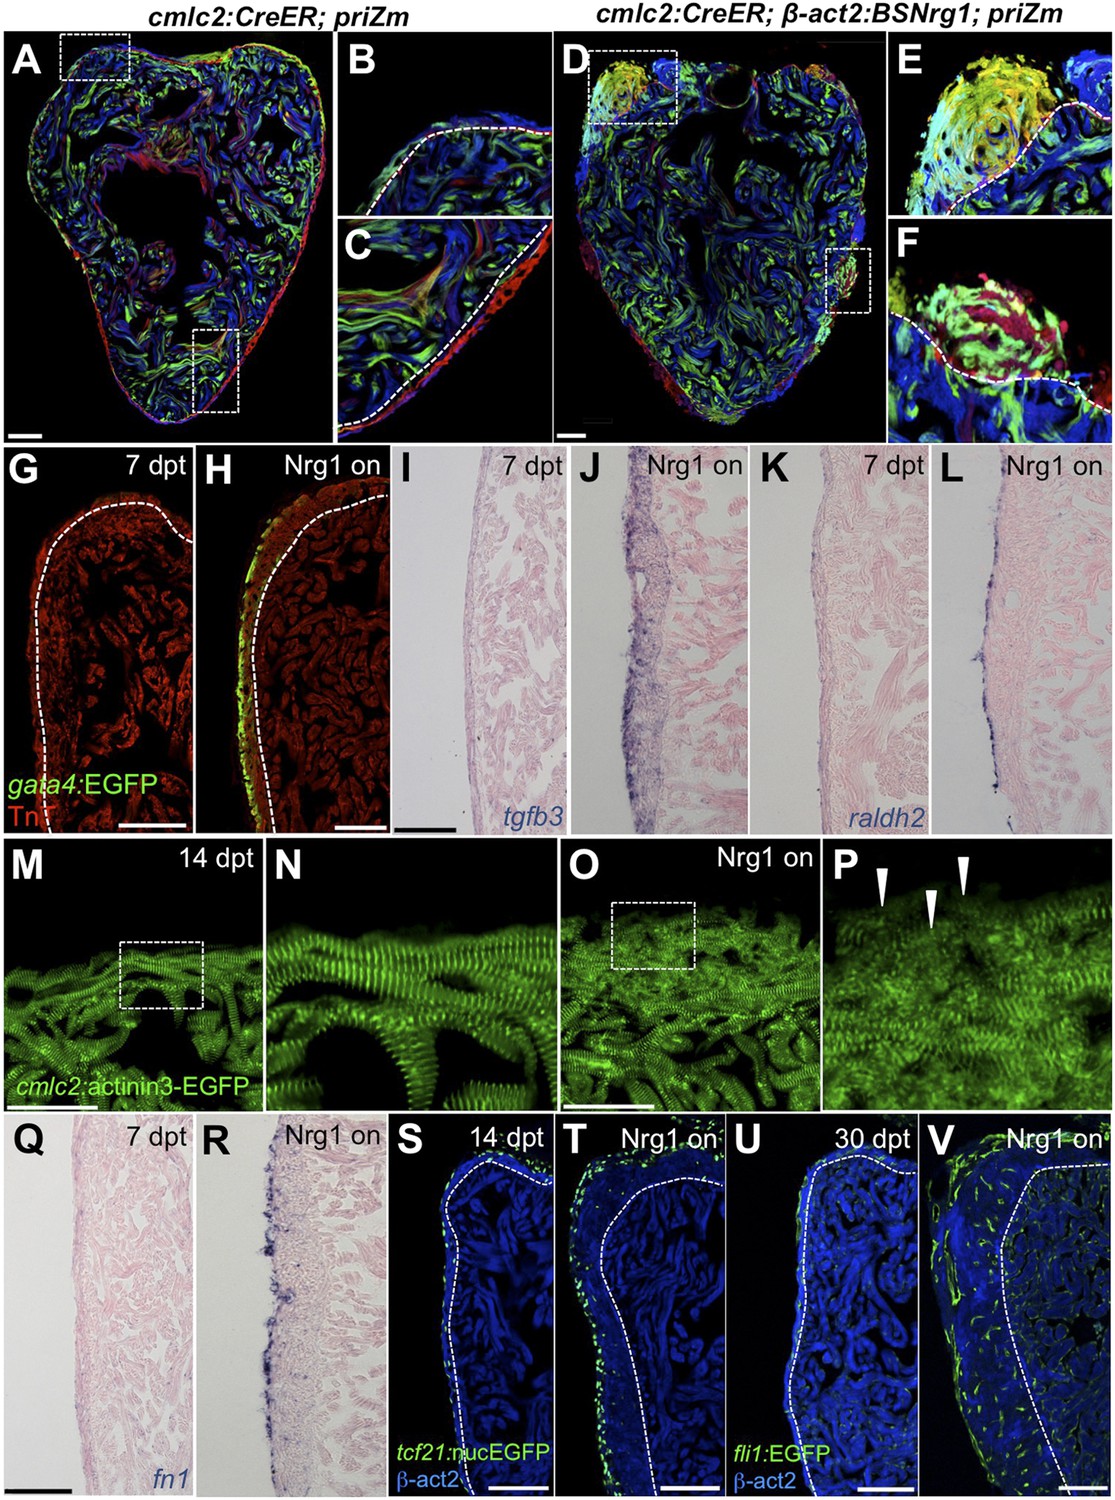
Nrg1 reactivation is sufficient to induce the heart regeneration program.
(A–F) Section images of ventricles from control cmlc2:CreER; priZM (A–C) and cmlc2:CreER; β-act2:BSNrg1; priZM (D–F) animals treated with tamoxifen at 5 weeks post-fertilization (wpf) and assessed at 10 wpf. Cortical myocyte clones show clear boundaries between clones in control ventricles (B and C; n = 11). During nrg1 overexpression, cortical muscle thickens appreciably via mixing and radial growth of distinct clones (E and F; n = 14). Dashed lines delineate cortical from trabecular muscle. Scale bar represents 100 µm. (G and H) Section images of ventricles from cmlc2:CreER; β-act2:BSNrg1 (Nrg1 on) and control animals at 7 days post-treatment, using animals also transgenic for gata4:EGFP. EGFP induction is clear in the cortical layer during nrg1 overexpression. Scale bar represents 100 µm. (I and J) Section images of ventricles from cmlc2:CreER; β-act2:BSNrg1 and control animals at 7 days post-treatment, visualized for tgfβ3 expression by in situ hybridization. Scale bar represents 100 µm. (K, L, Q, R) Section images of ventricles from cmlc2:CreER; β-act2:BSNrg1 and control animals at 7 days post-treatment, visualized for raldh2 (K and L) or fn1 expression (Q and R) in epicardial cells by in situ hybridization. Scale bar represents 100 µm. (M and N) Section images of the ventricular wall from cmlc2:CreER; β-act2:BSNrg1 and control animals at 14 days post-treatment, using animals transgenic for cmlc2:actinin3-EGFP. EGFP marks sarcomeric z-bands. Control animals (M) show organized sarcomeres in ventricular wall. nrg1 overexpression (O) leads to reduced EGFP fluorescence and disorganization of sarcomeres. Arrowheads point to areas of reduced EGFP intensity and sarcomere organization. Boxes in (M and O) are represented as high-zoom in (N and P). Scale bars represents 50 µm. (S and T) Section images of ventricles from cmlc2:CreER; β-act2:BSNrg1 and control animals at 14 days post-treatment, visualized for epicardial cells using a tcf21:nucEGFP transgene. nrg1 overexpression grossly increases epicardial cell presence. Scale bar represents 100 µm. (U and V) Section images of ventricles from cmlc2:CreER; β-act2:BSNrg1 and control animals at 30 days post-treatment, visualized for endothelial cells using a fli1:EGFP transgene. Increased endothelial cells and vasculature are evident in the thickened ventricular wall. Scale bar represents 100 µm.
Videos
Video 1
B-mode video of echocardiography performed on adult control β-act2:BSNrg1 animals 3 months post-tamoxifen treatment, indicating a thin ventricular wall.
Relates to Figure 7A–D.
Video 2
B-mode video of echocardiography performed on adult cmlc2:CreER; β-act2:BSNrg1 animals 3 months post-tamoxifen treatment, showing increased wall thickness.
Relates to Figure 7A–D.
Additional files
-
Supplementary file 1
Raw data spreadsheets used for quantification and statistical tests from experiments in this study.
- https://doi.org/10.7554/eLife.05871.013
Download links
A two-part list of links to download the article, or parts of the article, in various formats.
Downloads (link to download the article as PDF)
Open citations (links to open the citations from this article in various online reference manager services)
Cite this article (links to download the citations from this article in formats compatible with various reference manager tools)
Nrg1 is an injury-induced cardiomyocyte mitogen for the endogenous heart regeneration program in zebrafish
eLife 4:e05871.
https://doi.org/10.7554/eLife.05871


