The self-organization of grid cells in 3D
- Scuola Internazionale Superiore di Studi Avanzati, Italy
Figures
Figure 1
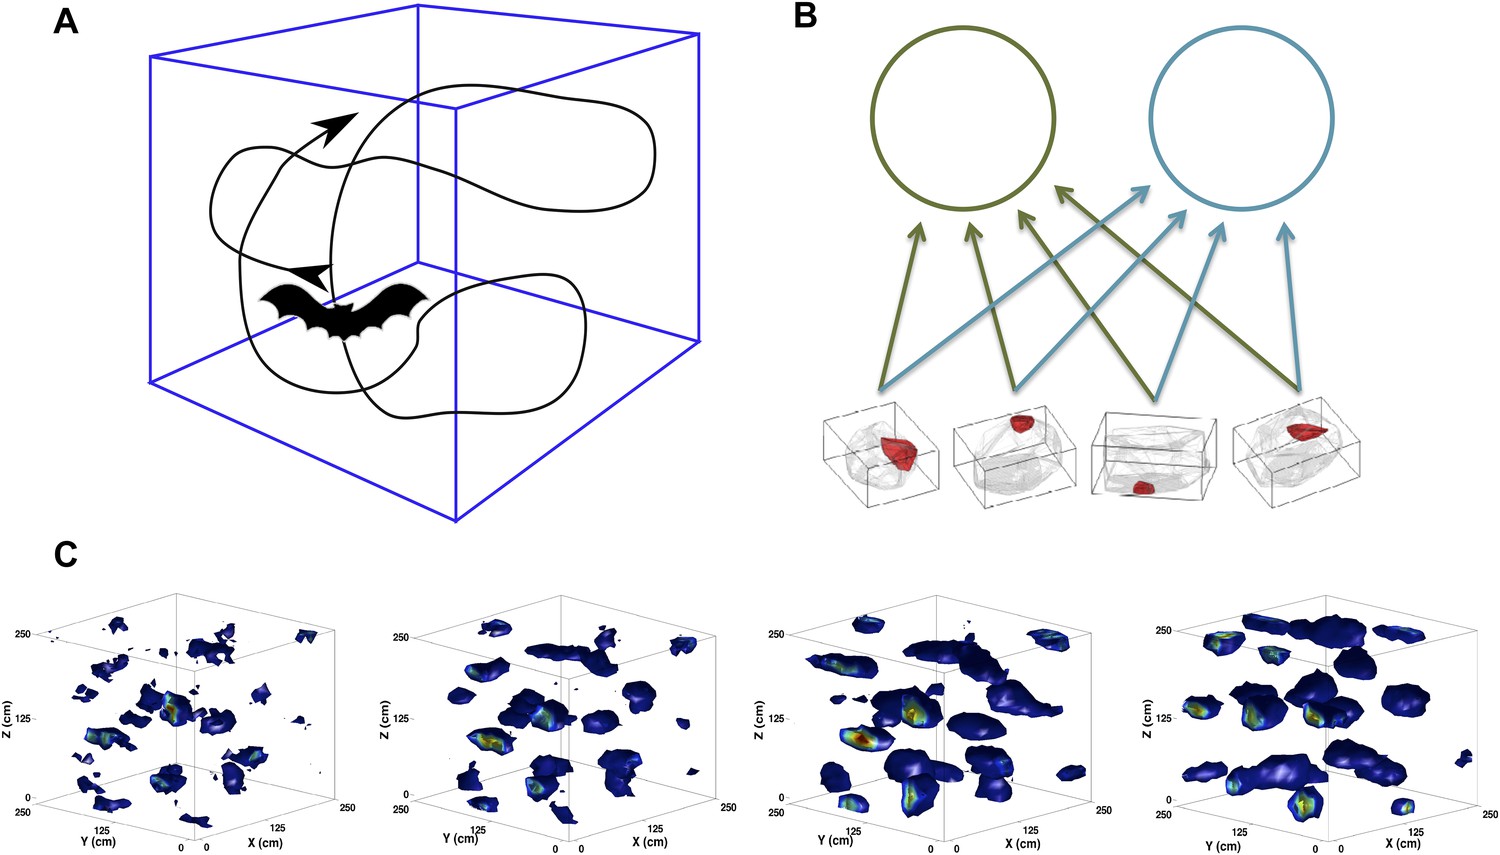
Scheme of the simulations.
(A) We simulate the trajectory of a bat exploring a volume of space over a prolonged period of time. At each step, the bat moves forward at a constant speed and chooses a new direction of movement close to the previous one. (B) The feed-forward network (equivalent to that shown in [Kropff and Treves, 2008]), including here only two mEC neurons. The would-be grid units receive inputs from place cell-like units with firing fields similar to those reported in Yartsev and Ulanovsky (2013). (C) Snapshots of the evolution of the firing rate map of a single unit. The figures correspond to (from left to right) 2, 5, 10 and 20 million time steps of learning.
© 2013, M Yartsev, N Ulanovsky. Figure 1 is reproduced from M Yartsev, N Ulanovsky. 2013. Representation of three-dimensional space in the hippocampus of flying bats. Science 340:367–372. Reprinted with permission from AAAS.
Figure 2
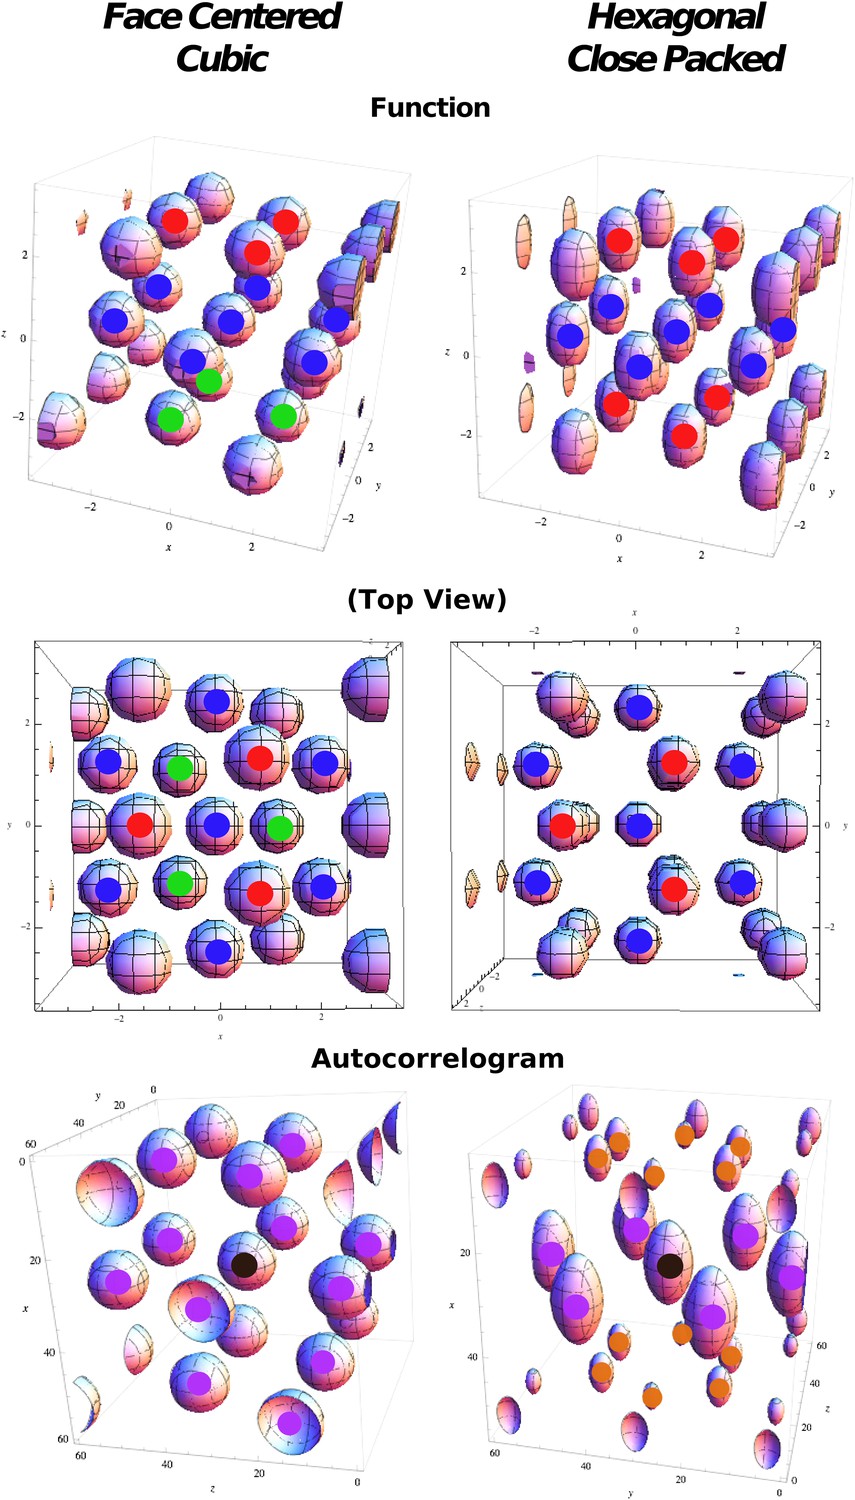
Regular optimal solutions to the sphere packing problem in 3D.
Top: Functions used in cost function calculation for face centered cubic (FCC) and hexagonal close packed (HCP) structures. Color markers are used to indicate the layering in the field arrangement: FCC results from an A(red)B(blue)C(green) sequence, HCP from an A(red)B(blue)A(red) sequence. Middle: Same as above but from a different viewpoint to highlight the different organization of the relative phases. Bottom: Autocorrelograms of the above functions. Color markers indicate the magnitude of the corresponding peak in the autocorrelogram. Purple: full peaks. Orange: half peaks.
Figure 3
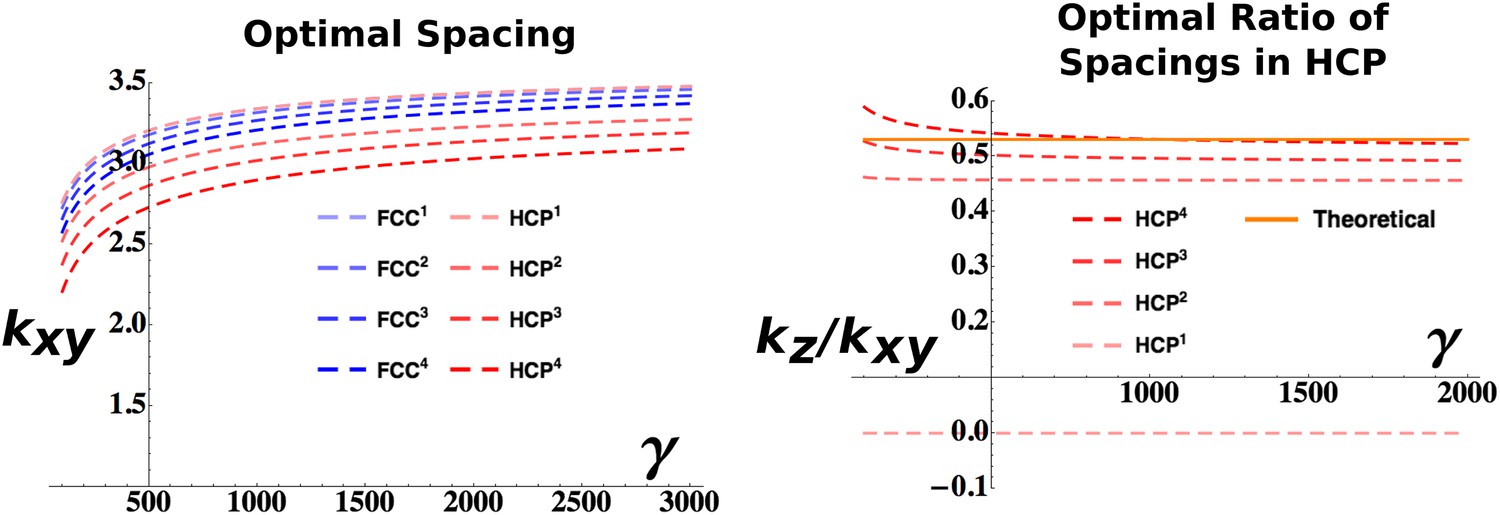
Analytical estimation of the optimal grid parameters.
Results for the grid parameters resulting from the cost function minimization. Left: Optimal grid spacing for face centered cubic (FCC) and hexagonal close packed (HCP) structures and various powers of the respective expressions. Right: Optimal ratio between horizontal spacing and vertical spacing for different powers of the HCP expression. The orange continuous line indicates the theoretical value to obtain a perfect HCP arrangement. All the plots are obtained with parameters: vτL = 1, , ρ = 0.03.
Figure 4
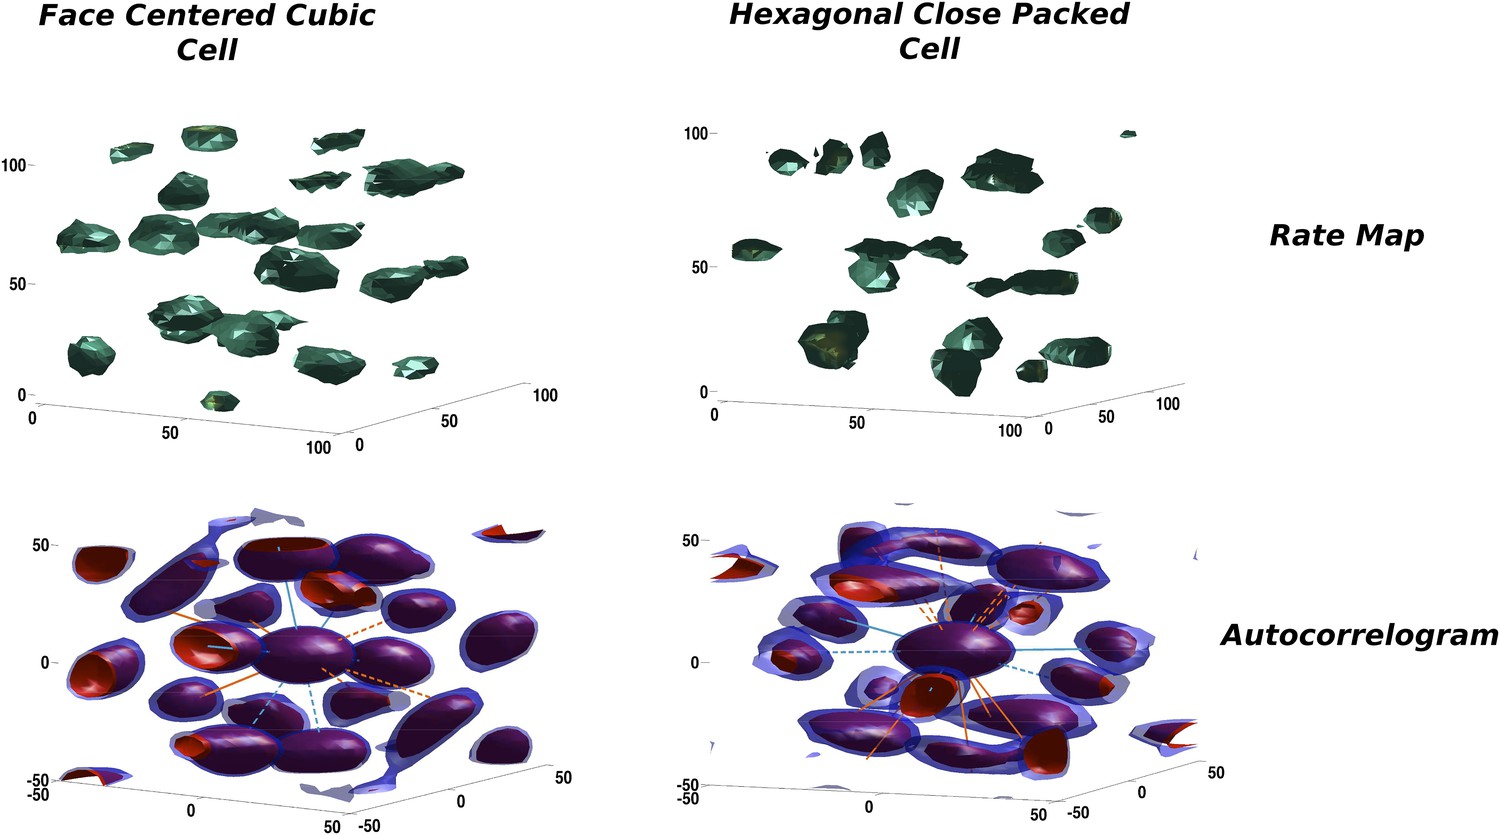
Two illustrative examples of unit activity obtained from simulations.
Left: Face centered cubic (FCC)-like unit. Right: Hexagonal close packed (HCP)-like unit. Top: Rate maps. Bottom: Autocorrelograms. We plot the central portion of the autocorrelogram comprising the peaks surrounding the origin. Red and blue contours correspond to a correlation value of 0.2 and 0.25, respectively.
Figure 5
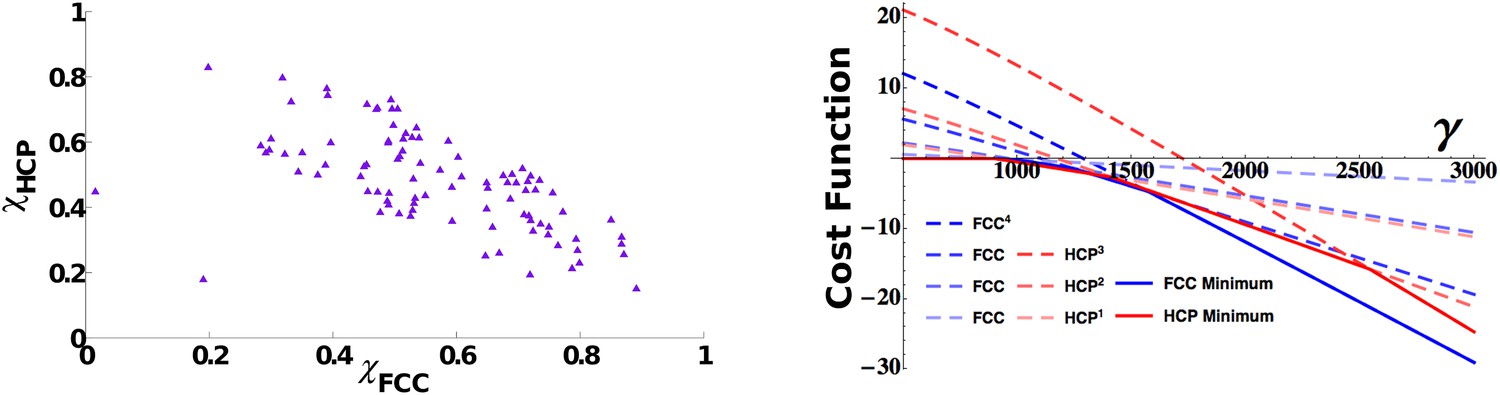
3D grid units do not converge towards a common arrangement of fields.
Left: Distribution of face centered cubic (FCC) and hexagonal close packed (HCP) scores in a population of simulated mEC units. The scores span a continuum between a pure FCC arrangement (bottom right corner) and a pure HCP one (top left corner of the figure) and are widely distributed between the two extremes. Right: Analytical cost function for various powers of FCC and HCP as a function of γ parameter. Continuous lines indicate the minimum value within each set of solutions and are found to alternate as a global minimum in different ranges of values of γ. For small values of the parameter γ, instead, the trivial solution ψ = 0 is favored. The plot is obtained with: vτL = 1, , ρ = 0.03.
Figure 6
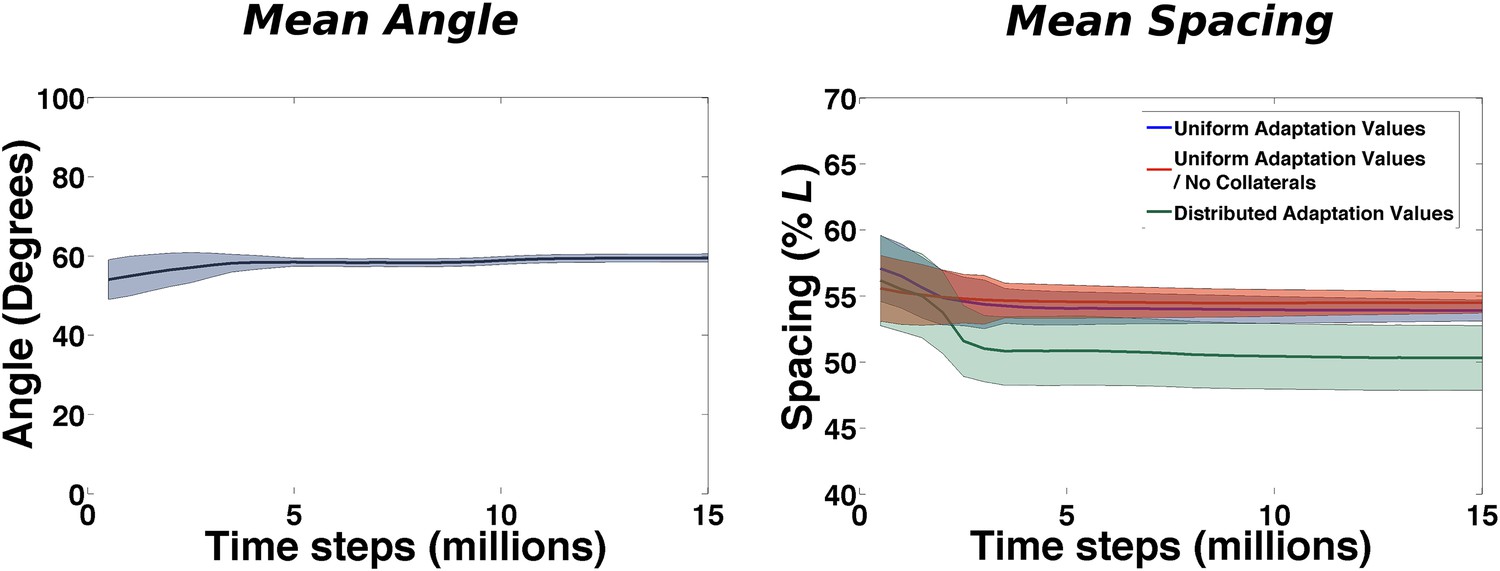
Emergence of local regularities in the arrangement of fields.
Left: Mean angle formed by triplets of fields as a function of learning time (see the ‘Local gridness measure’ section in ‘Materials and methods’ for details on the measure). Right: Mean spacing between fields extracted from the autocorrelograms, for various conditions as a function of learning time.
Figure 7

Three distinct time courses for the emergence of long-range ordering.
The panels present the time evolution of the measure of different symmetries in the arrangement of fields. Top row: Fast convergence of neighboring triplets of fields towards equilateral triangles (left) and of group of fields into planes with a hexagonal arrangement (right). Middle row: Slow convergence of the different units in the population towards a common orientation of the layers of fields. Left: Angle between the principal plane expressed by the various units. Right: Angle between fields arranged over mutually aligned planes. Bottom row: No convergence of global, inter-planar order. The measures of similarity with face centered cubic (FCC) and hexagonal close packed (HCP) ordering do not evolve with the extension of the learning time and remain close to intermediate values indicating an even distribution of the values over the population of grid cells. See ‘Materials and methods’ for details on the measures.
Figure 8
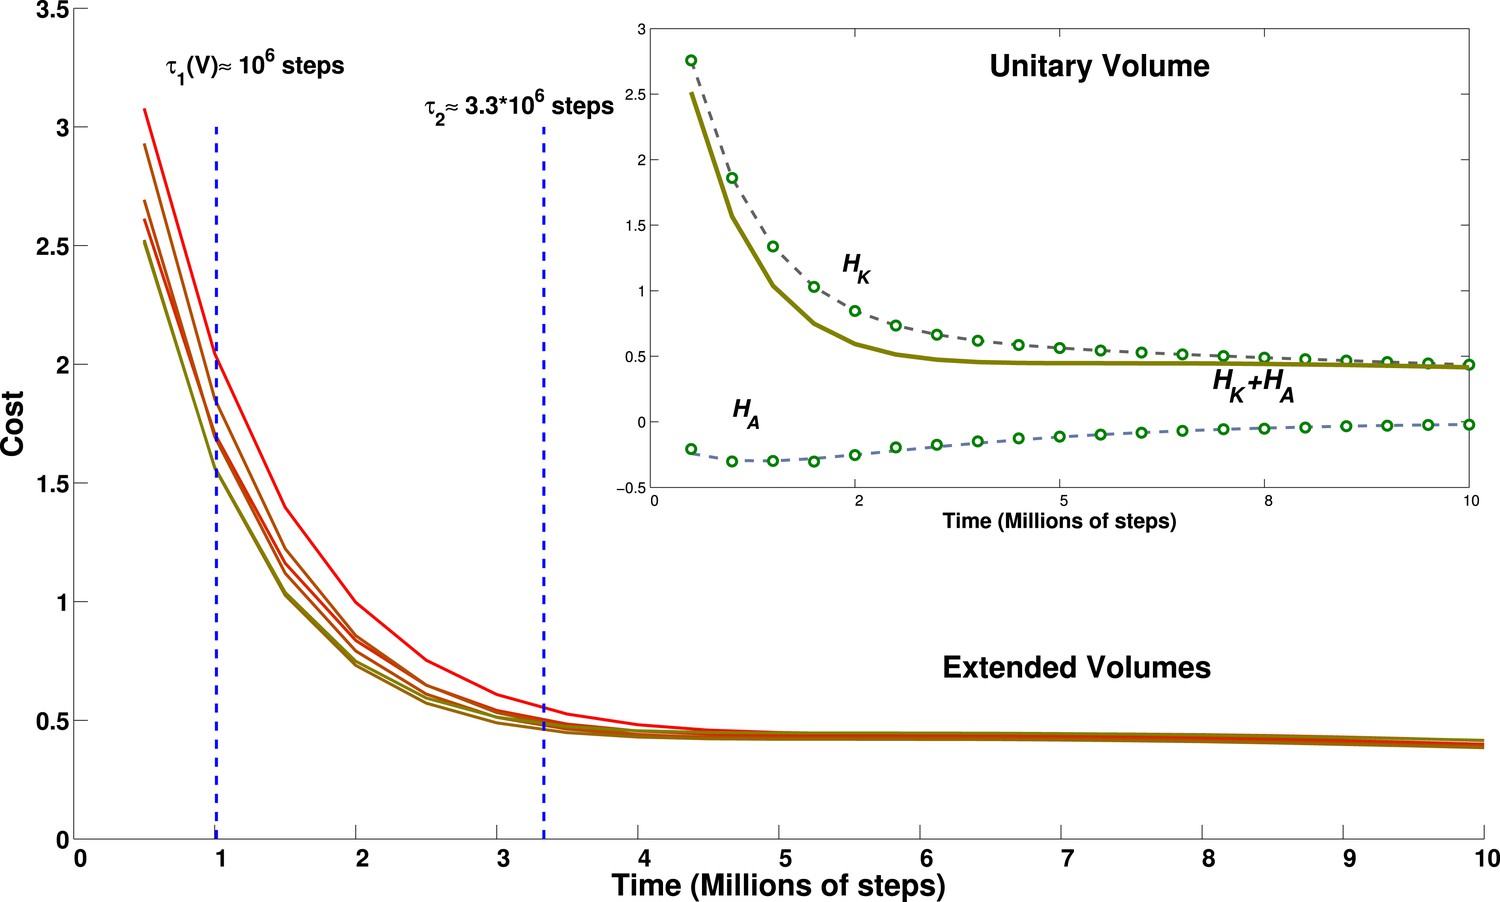
Effect of environment volume on grid developmental time.
Temporal evolution of the cost function calculated for environments of different size. Lines from green to red correspond to environments of increasing size: 1 (green), 1.2, 1.4, 1.44, 1.68 and 1.96 (red) times the basic volume, respectively. With the choice of parameters reported in the discussion, these volumes would range from a 15.625 m3 room to a 30.625 m3 room. The inset shows the breakdown of the contribution to the total cost of the kinetic part and of the adaptation part for the cubic environment of size 2.5 × 2.5 × 2.5 m. Dots correspond to data points, lines to a fit. The constant of the kernel term, which varies with the volume, is not included for clarity.
Download links
A two-part list of links to download the article, or parts of the article, in various formats.
Downloads (link to download the article as PDF)
Open citations (links to open the citations from this article in various online reference manager services)
Cite this article (links to download the citations from this article in formats compatible with various reference manager tools)
The self-organization of grid cells in 3D
eLife 4:e05913.
https://doi.org/10.7554/eLife.05913


