Self-recognition drives the preferential accumulation of promiscuous CD4+ T-cells in aged mice
- University of Arizona College of Medicine, United States
Figures
Figure 1
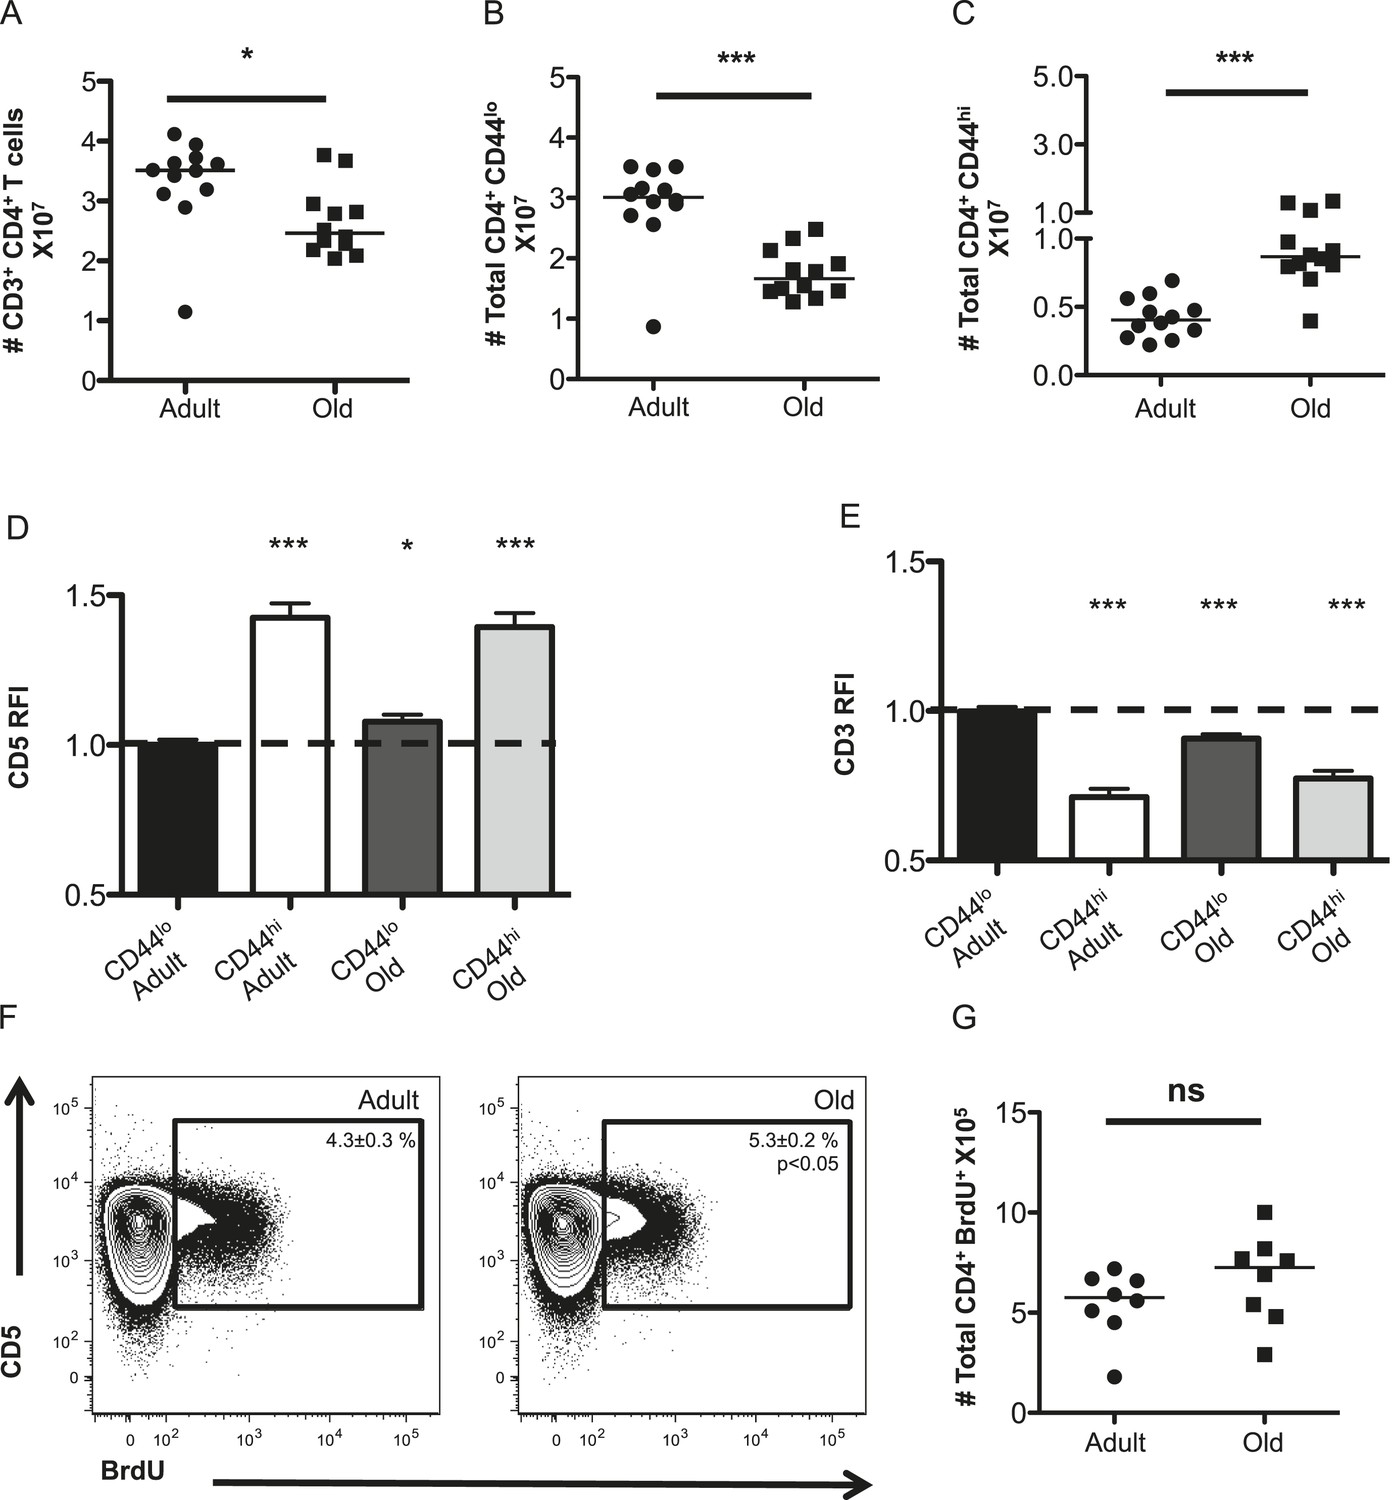
The CD4+ T-cell compartment contracts but accumulates CD44hiCD5hi cells with aging.
The absolute numbers of T-cells in unprimed adult (8–12 weeks) and old (18–22 months) mice are shown as (A) total CD4+ T-cells in secondary lymphoid organs, (B) CD4+ CD44lo (naïve) T-cells and (C) CD4+ CD44hi (memory phenotype) T-cells. Data are concatenated from three experiments, 4 mice/group. Horizontal bar indicates median (*p < 0.05, ***p < 0.0001; Mann–Whitney). (D) Relative fluorescent intensity (RFI) of CD5 expression on adult and old CD44hi and CD44lo CD4+ T-cells relative to CD5 expression on adult CD44lo CD4+ T-cells (dotted line). Data represent four experiments with 4 mice/group (***p < 0.0001, *p < 0.05; Mann–Whitney). (E) RFI of CD3 expression on adult and old CD44hi and CD44lo CD4+ T-cells relative to CD3 expression on adult CD44lo CD4+ T-cells (dotted line) (***p < 0.0001; Mann–Whitney). Results represent seven experiments with 4 mice/group. (F) Concatenated contour plots (4 mice) showing CD5 vs BrdU incorporation in unprimed adult and old total CD4+ T-cells. Percent BrdU+ of total CD4+ T-cells ± SEM is shown in the inset (*p < 0.05 Mann–Whitney adult compared to old). (G) Absolute numbers of CD4+ BrdU+ T-cells. Results are representative of two experiments with 4 mice/group.
Figure 2 with 9 supplements
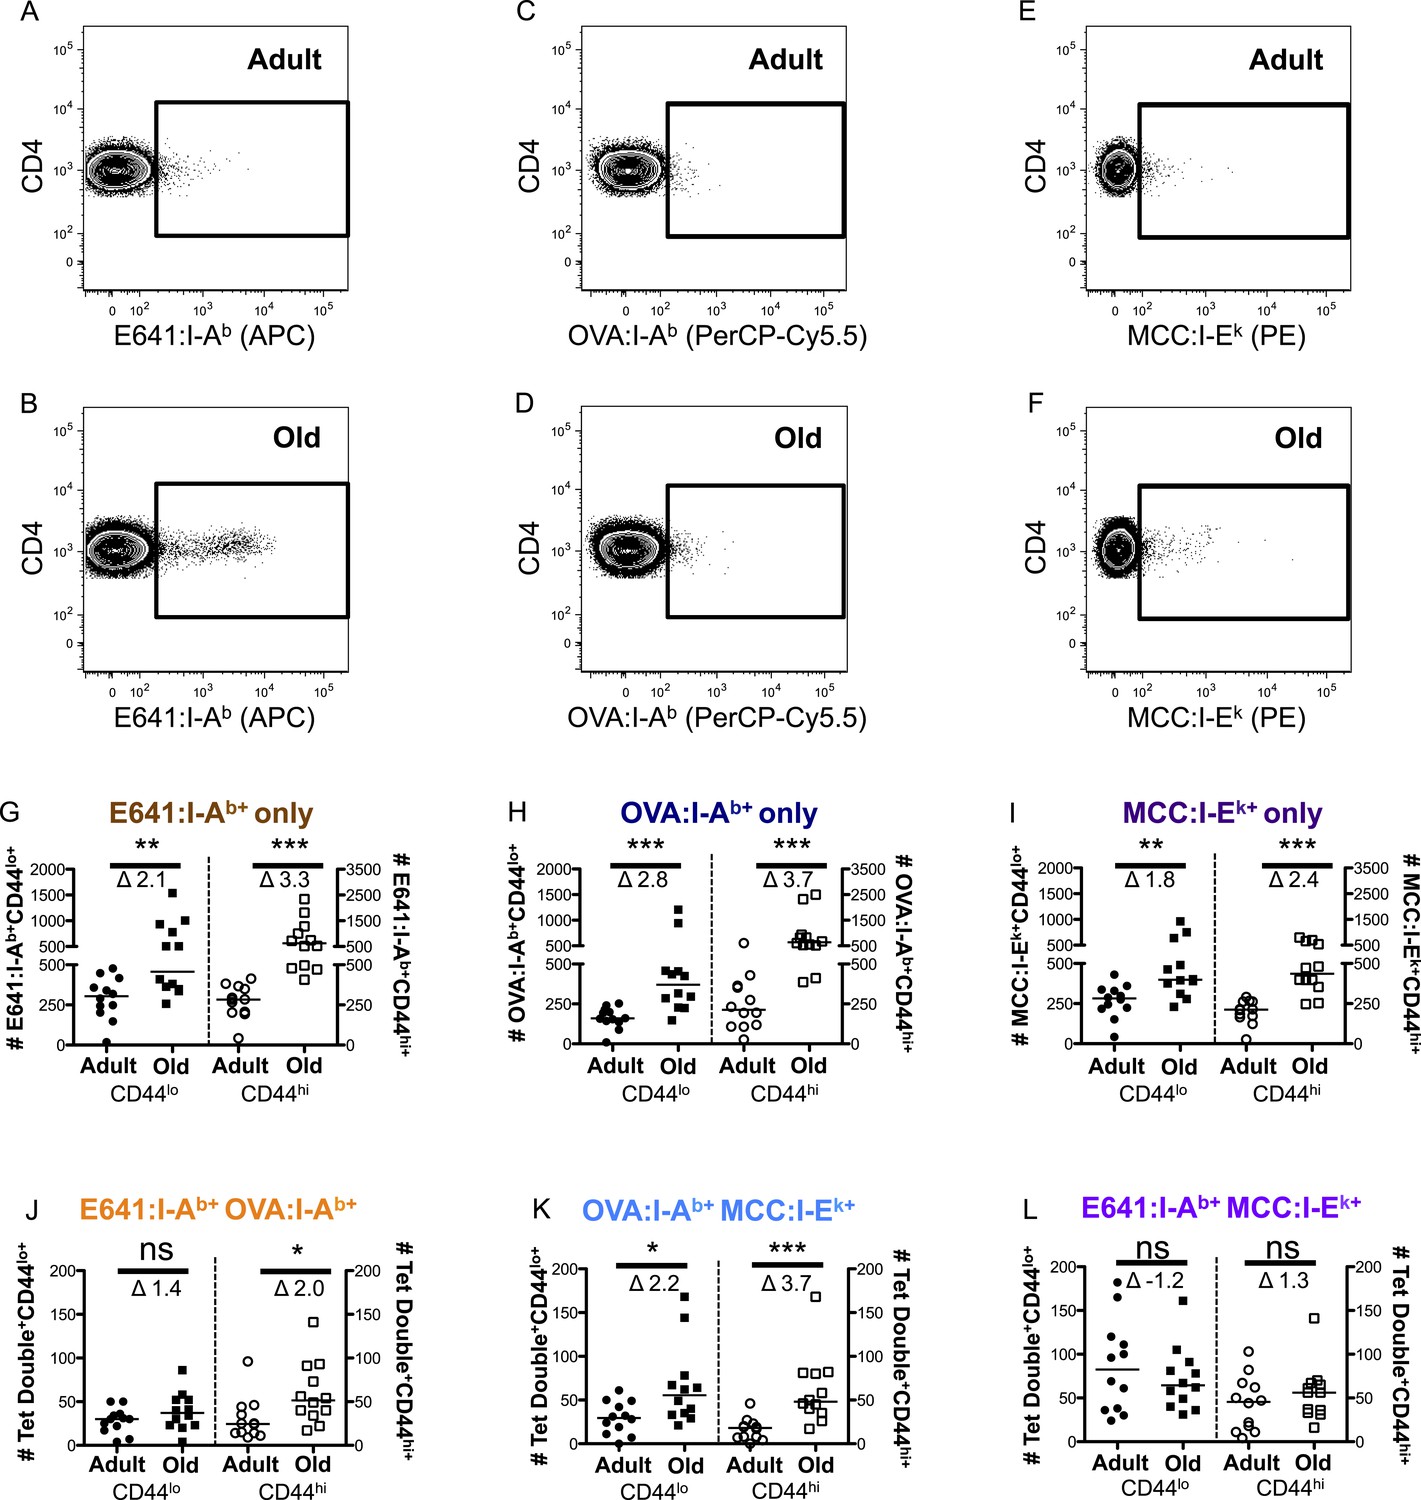
CD44lo and CD44hi CD4+ T-cells binding immunodominant, subdominant, and allogeneic pMHC increase with time.
Representative plots of CD4+ T-cells bound to (A and B) E641:I-Ab, (C and D) OVA:I-Ab, and (E and F) MCC:I-Ek tetramers in adult (top) and old (bottom) mice. Absolute number of CD4+ CD44lo (left Y-axis) and CD4+ CD44hi (right Y-axis) T-cells bound to (G) E641:I-Ab, (H) OVA:I-Ab, or (I) MCC:I-Ek tetramers only enumerated after dump tetramer analysis (‘Materials and methods’), or those binding (J) E641:I-Ab + OVA:I-Ab, (K) OVA:I-Ab + MCC:I-Ek, or (L) E64:I-Ab + MCC:I-Ek tetramers in combination enumerated after both dump and two-color tetramer analysis (‘Materials and methods’). Bars indicate median (*p < 0.05, **p < 0.005, ***p < 0.0001, ns = non-significant; Mann–Whitney). Fold change (Δ) in means between adult and old is shown. Results are from three experiments with 4 mice/group.
Figure 2—figure supplement 1
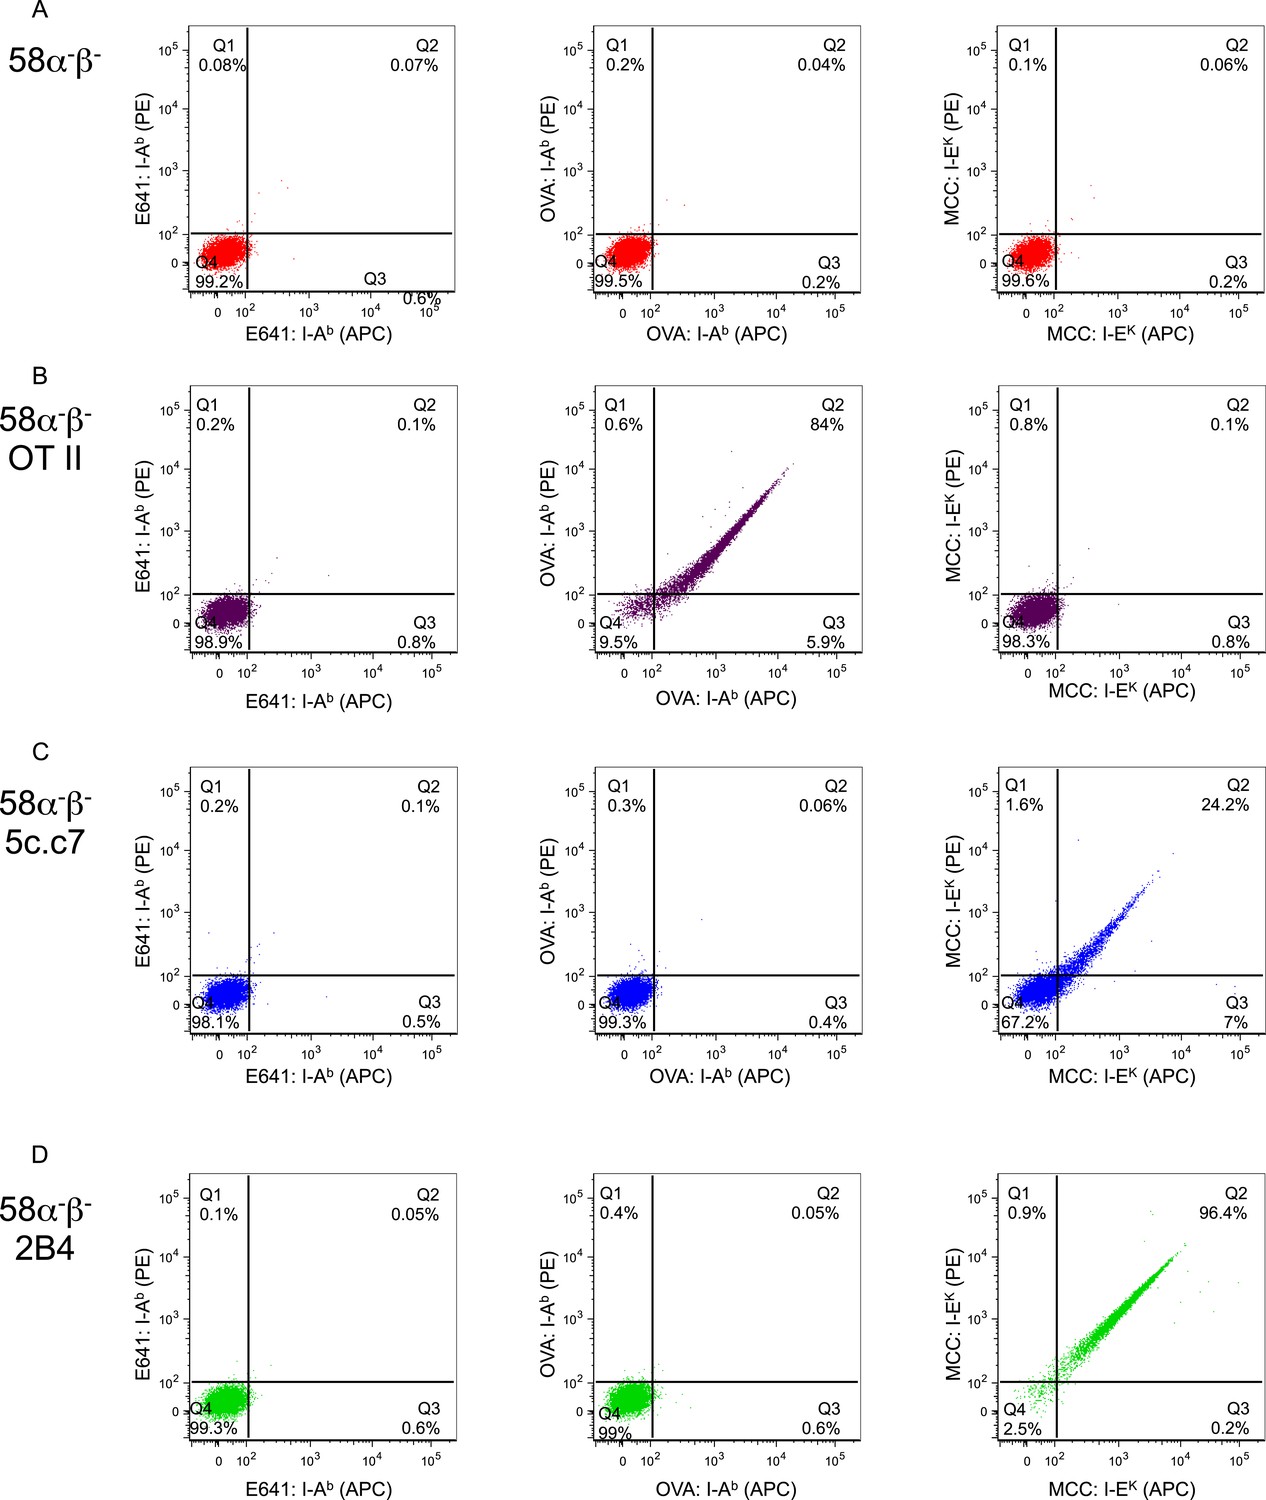
Tetramer validation on T-cell hybridomas.
Dot plots showing E641:I-Ab (left panel), OVA: I-Ab (middle panel), and MCC:I-Ek (right panel) tetramer bound to (A) parental 58α−β− TCR-negative hybridomas or those transduced to express the (B) OT-II TCR specific for OVA: I-Ab, or the (C) 5c.c7 or (D) 2B4 TCRs specific for MCC:I-Ek. Each tetramer was made with streptavidin-PE and streptavidin-APC for two-color analysis as labeled on axis.
Figure 2—figure supplement 2
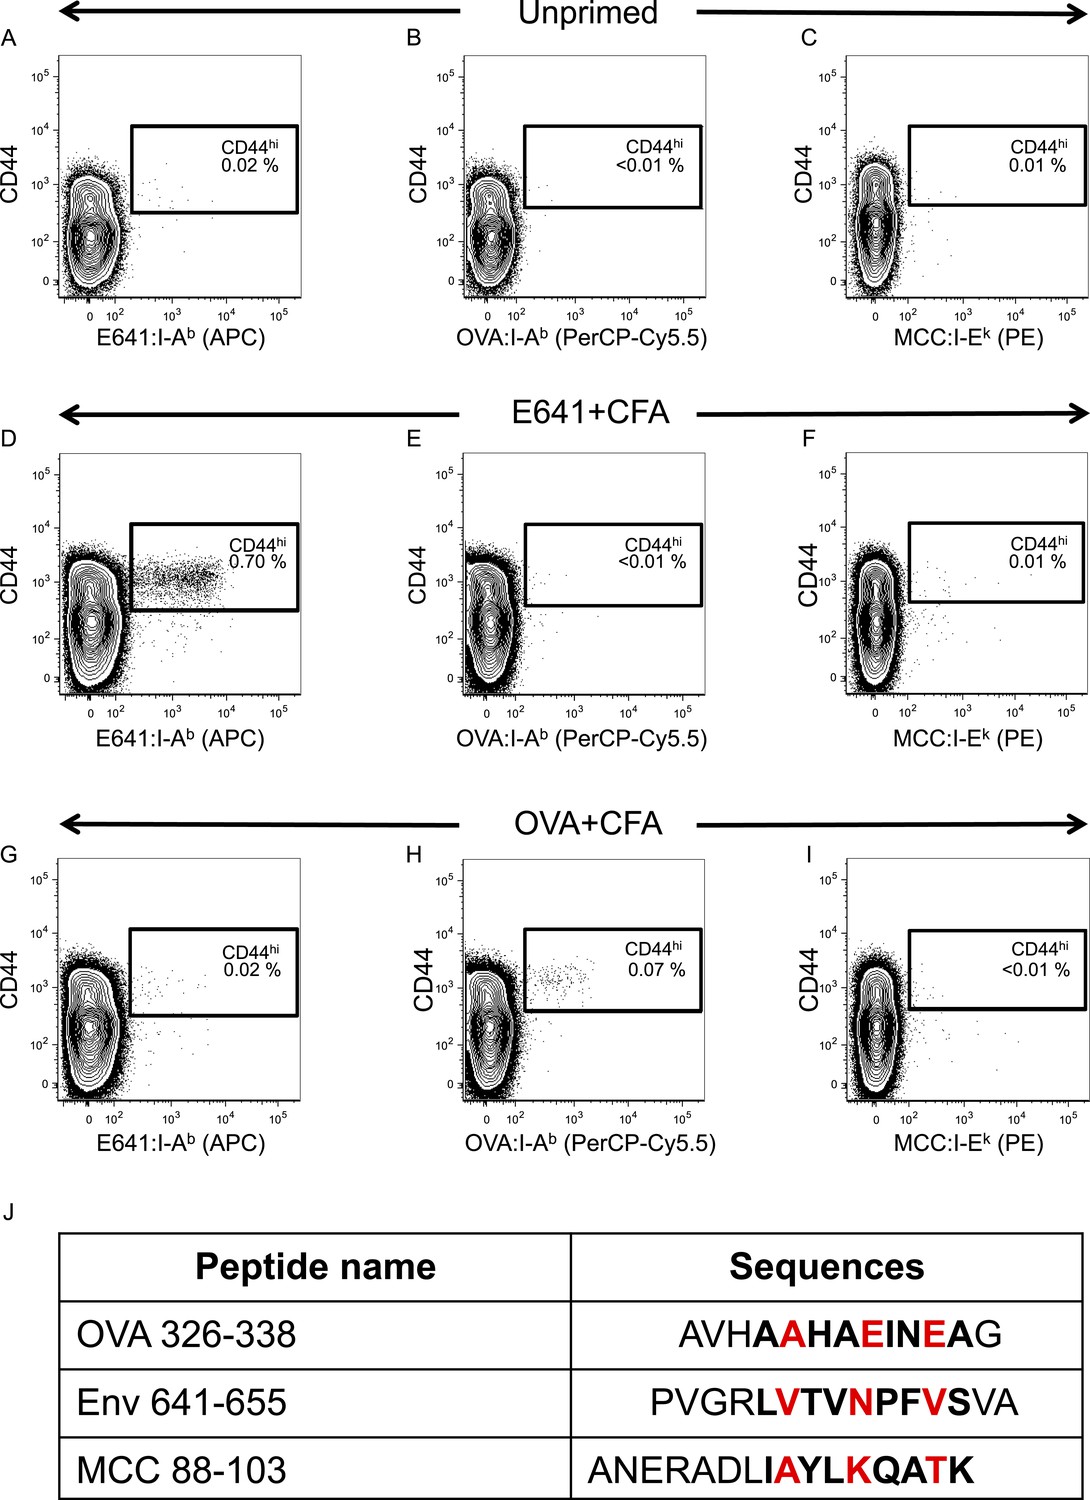
Tetramer validation for in vivo primed CD4+ T-cells.
C57BL/6 mice were immunized with 50 µg of the indicated peptide in 50 µl CFA on each side of the base of the tail or left unprimed. Spleen and lymph nodes cells were harvested on day 7-post immunization and incubated with E641:I-Ab, OVA:I-Ab, and MCC:I-Ek tetramers. No tetramer enrichment was performed. Contour plots show tetramer vs CD44 for (A–C) unprimed (D–F) E641+CFA immunized or (G–I) OVA+CFA immunized mice. Numbers indicate percent of CD44hi tetramer+ CD4+ T-cells. Results represent a single experiment with one mouse per condition. (J) Amino acid sequences of peptides contained in I-Ab and I-Ek tetramers used in this study. The bold sequences indicate the core nonamer peptide epitopes as predicted by Zhu et al. (2003); Birnbaum et al. (2012); Nelson et al. (2015). OVA 326–338 is from chicken ovalbumin, Env 641–655 is from West Nile Virus, and MCC 88–103 is from moth cytochrome c. The putative TCR contact residues are highlighted in red.
Figure 2—figure supplement 3
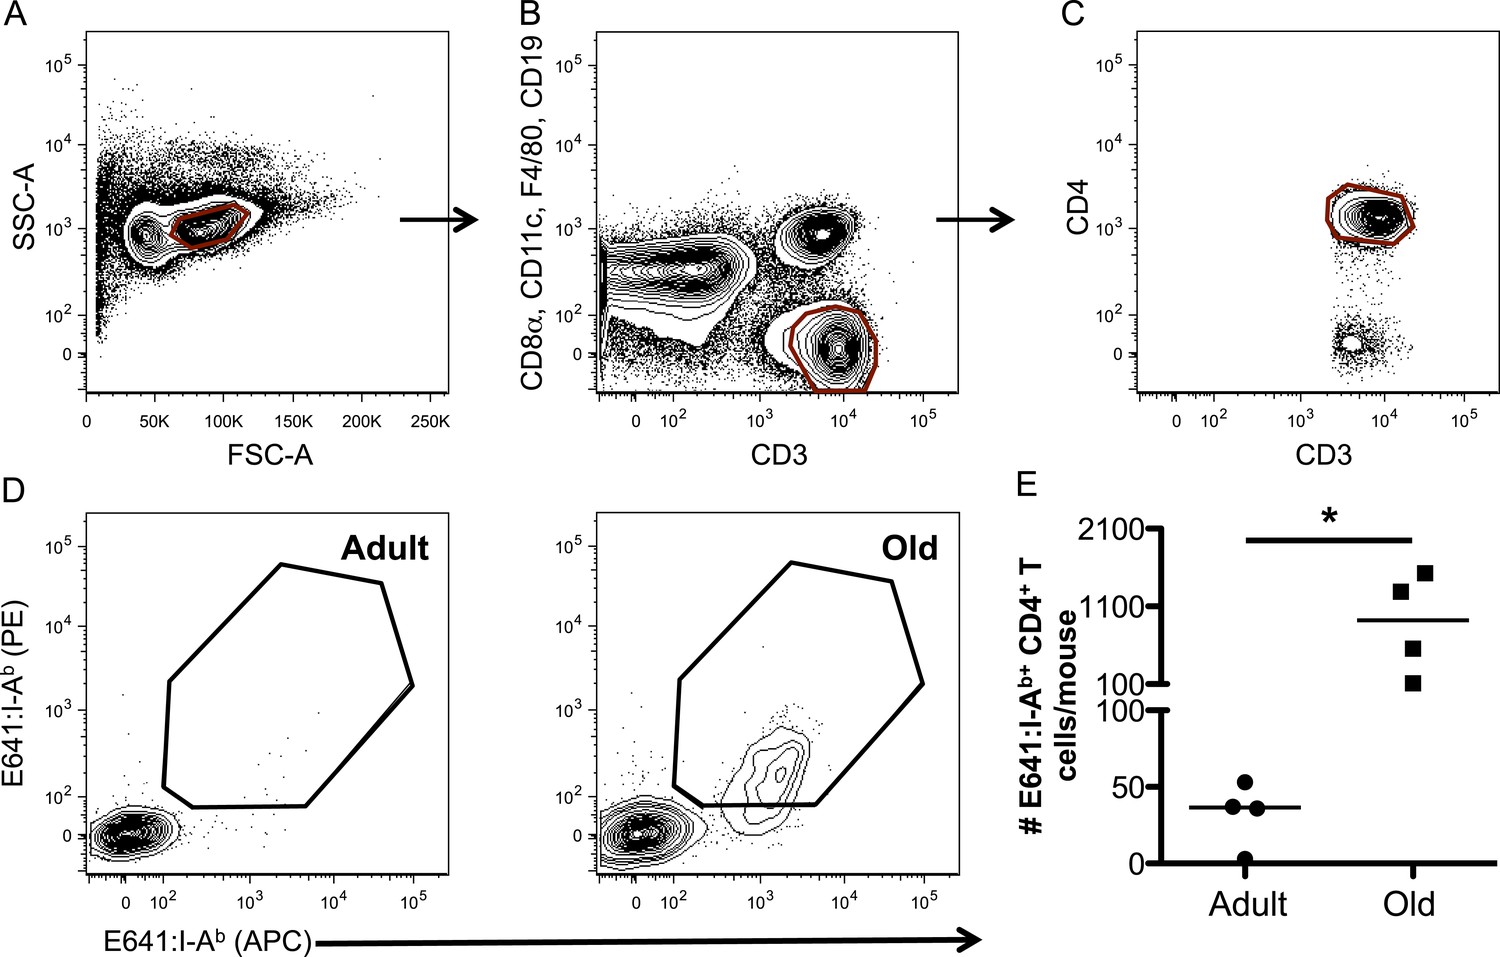
WNV-specific CD4+ T-cells increase over the lifespan.
Representative gating strategy for CD4+ tetramer+ T-cells via (A) forward and side scatter, (B) CD3+ CD8− T-cells, (C) CD3+ CD4+ T-cells, and (D) E641:I-Ab+ CD4+ T-cells in the tetramer enrichment bound fraction from adult and old mice. (E) Absolute number of E641:I-Ab+ CD4+ T-cells derived from pooled spleen and lymph node cells from unprimed adult or old mice after E641:I-Ab tetramer enrichment using anti-FP magnetic beads. Horizontal bar indicates median (*p < 0.05; Mann–Whitney). Results are shown from one of two similar experiments (4 mice/group).
Figure 2—figure supplement 4
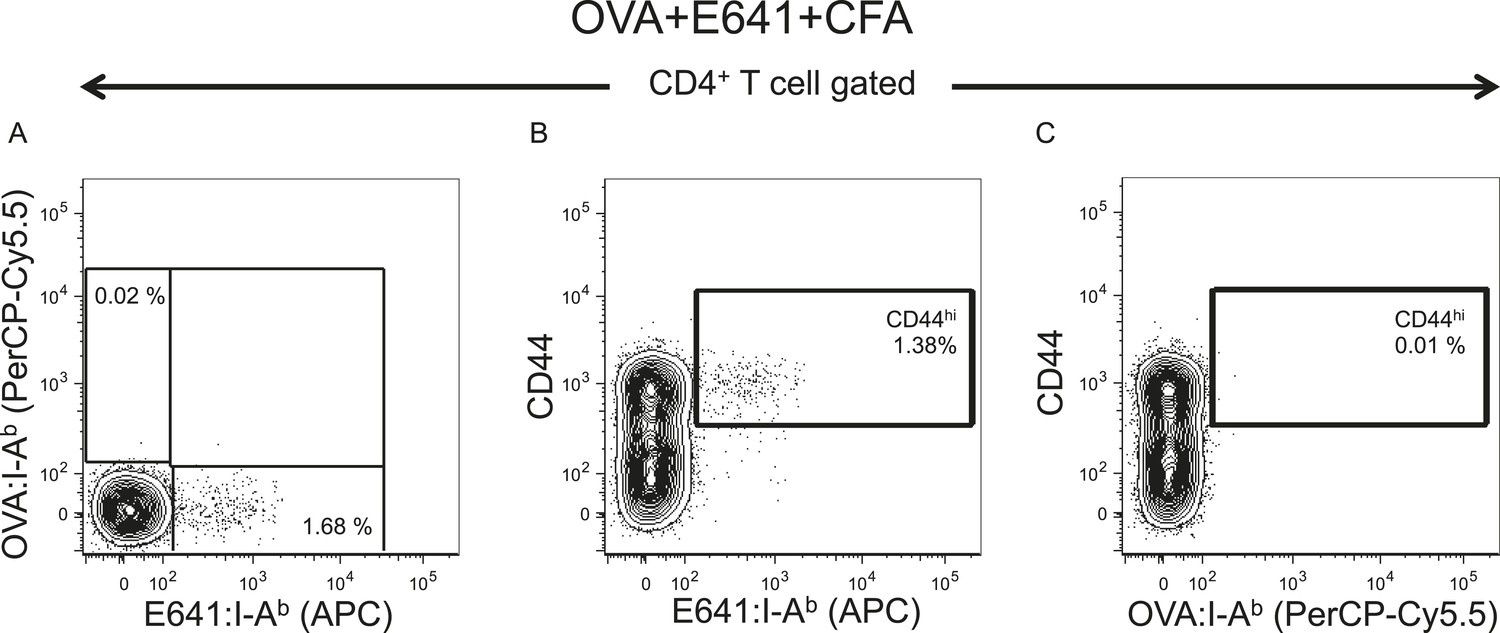
E641 is immunodominant to OVA.
C57BL/6 mouse was co-immunized with 25 µg E641 + 25 µg OVA + 50 µl CFA on each side of the base of the tail. On day 7 post immunization, pooled spleen and lymph node cells were harvested and stained with E641:I-Ab and OVA:I-Ab tetramers. No tetramer enrichment was performed. (A) Contour plot showing E641:I-Ab vs OVA:I-Ab tetramer+ CD4+ T-cells. (B) CD44 vs E641:I-Ab tetramer+ CD4+ T-cells. (C) CD44 vs OVA:I-Ab tetramer+ CD4+ T-cells. Number indicates percent CD44hi tetramer+ CD4+ T-cells of total CD4+ T-cells. Results are from a single experiment.
Figure 2—figure supplement 5
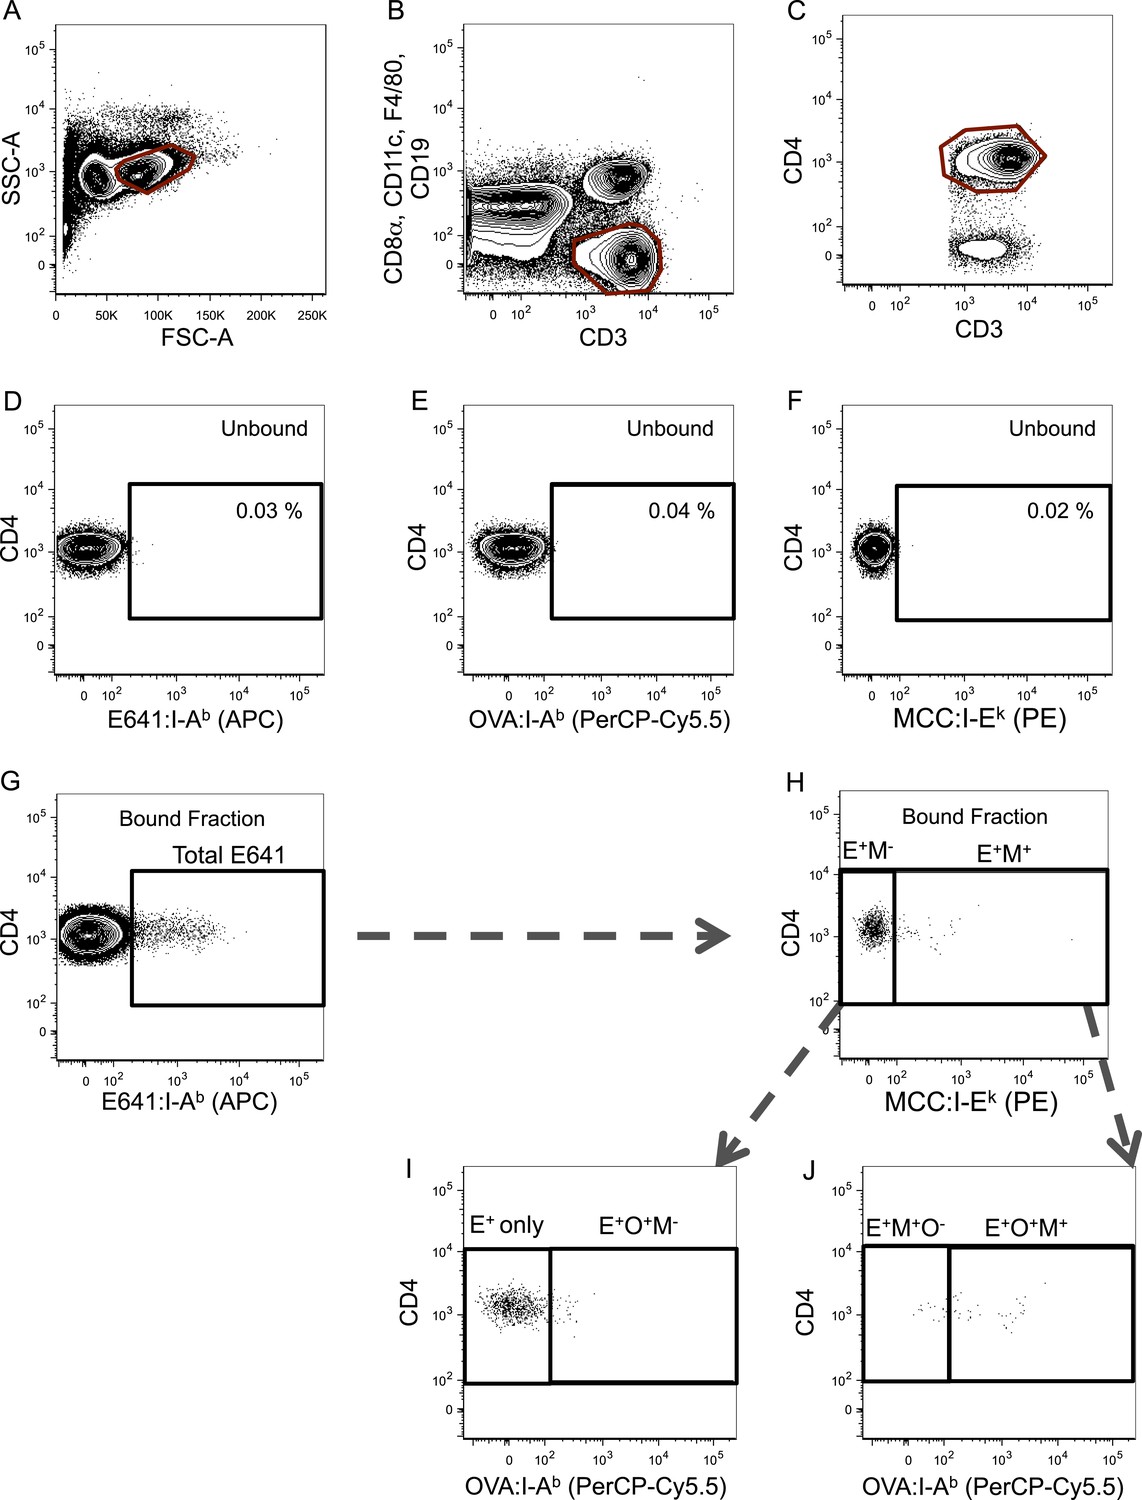
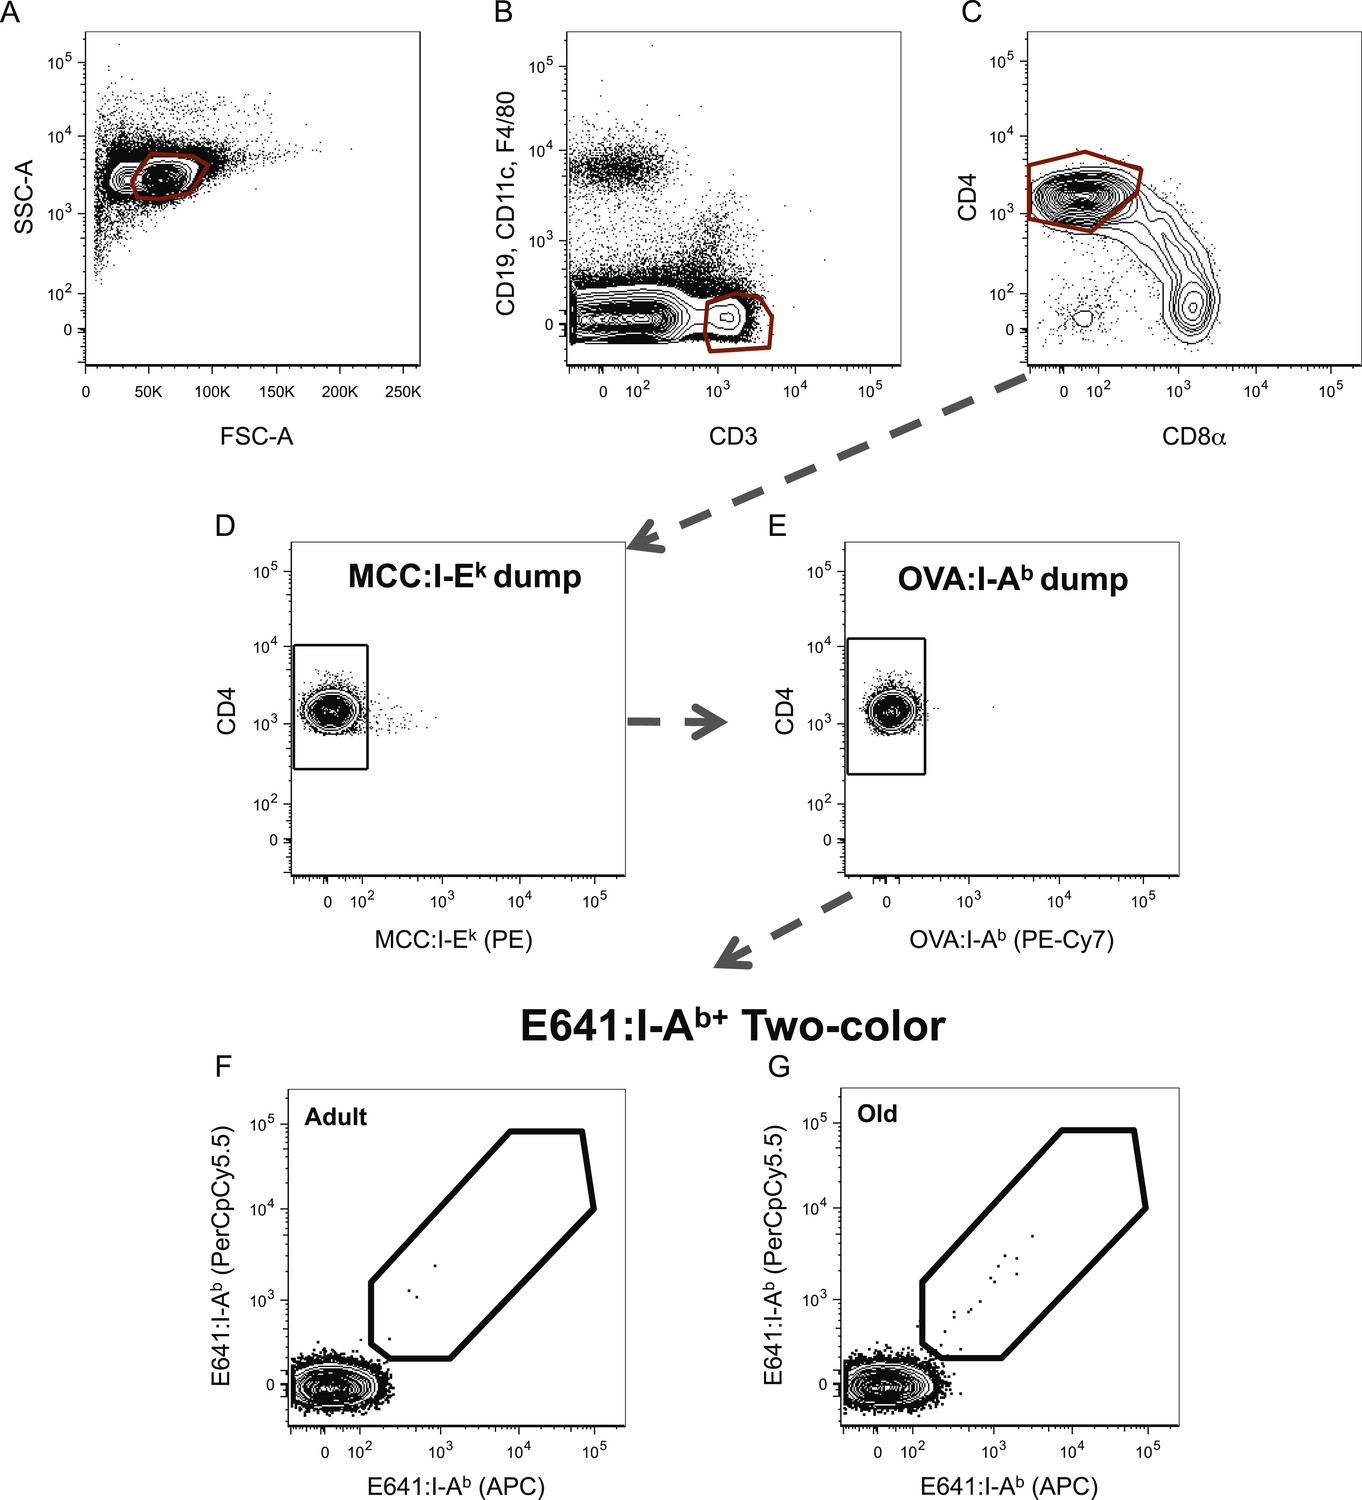
Gating scheme for identification of tetramer+ cells.
Representative gating scheme for identifying tetramer+ cells for Figures 2, 4. (A) Forward vs side scatter. (B) CD3+ CD8− T-cells. (C) CD4+ T-cells. After anti-His magnetic enrichment, the tetramer+ gate was set on the unbound fraction to identify (D) E641:I-Ab+, (E) OVA:I-Ab+, and (F) MCC:I-Ek+ CD4+ T-cells. (G) Additional gating on E641:I-Ab+ CD4+ T-cells in the bound fraction to further identify (H–J) tetramer single+, double+, and triple+ CD4+ T-cells (E = E641:I-Ab+, O = OVA:I-Ab+, and M = MCC:I-Ek+).
Figure 2—figure supplement 6
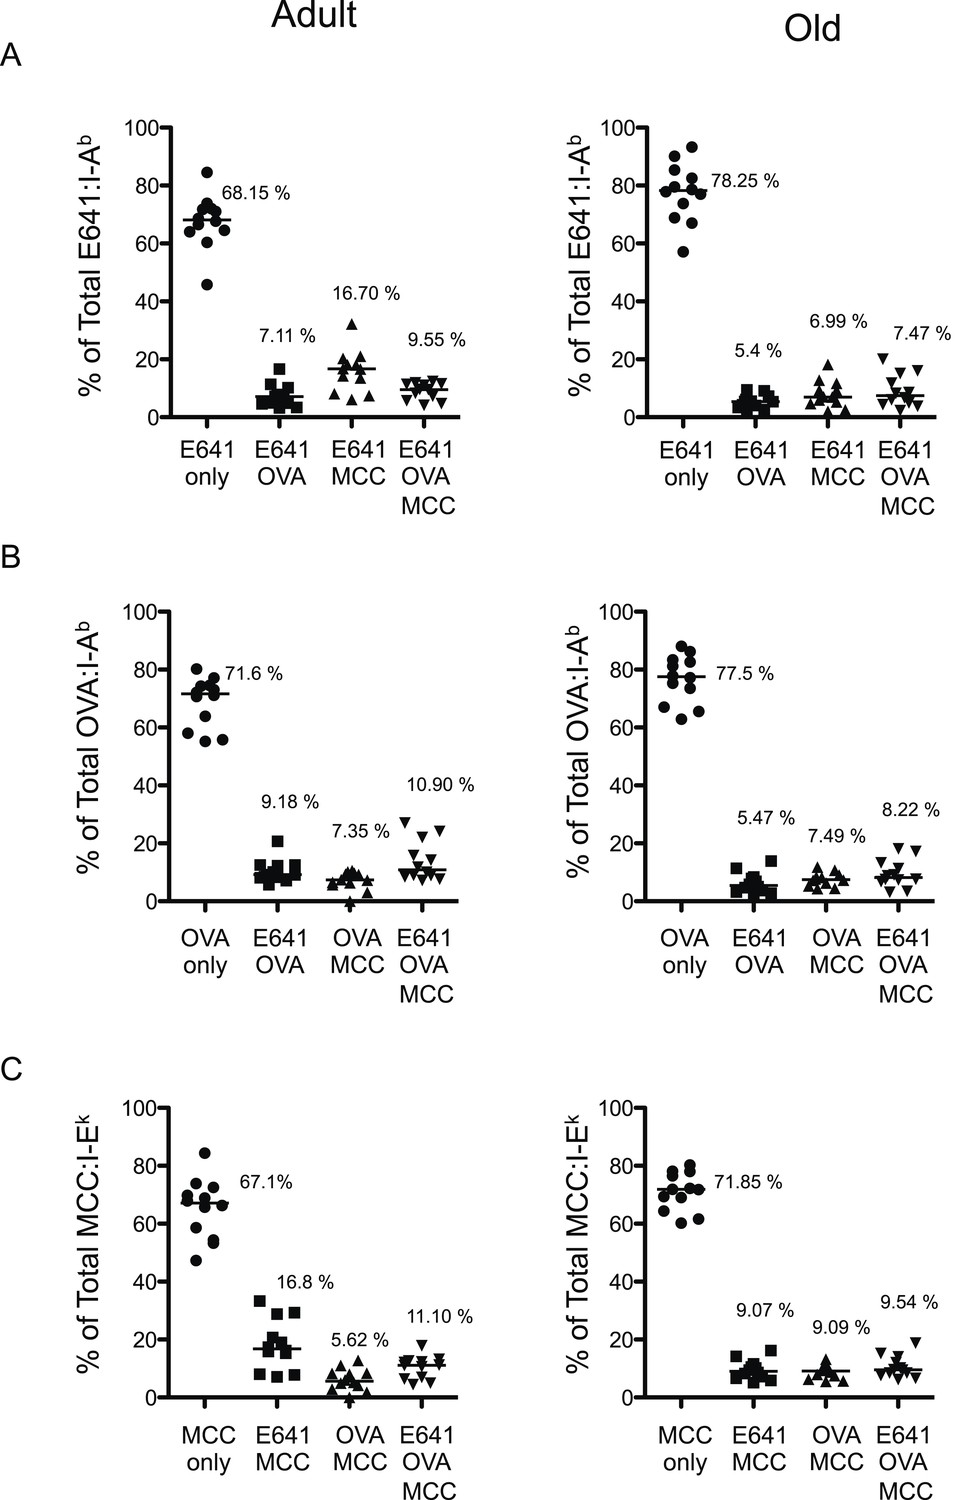
Poly-specific cells form a very small fraction of a particular total tetramer+ population.
Percent tetramer single+, double+ and triple+ CD4+ T-cells of (A) Total E641:I-Ab+, (B) Total OVA:I-Ab+, and (C) Total MCC:I-Ek+ CD4+ T-cells in adult (left) and old (right) mice. Horizontal bar indicates median. Data are from three experiments with 4 mice/group.
Figure 2—figure supplement 7
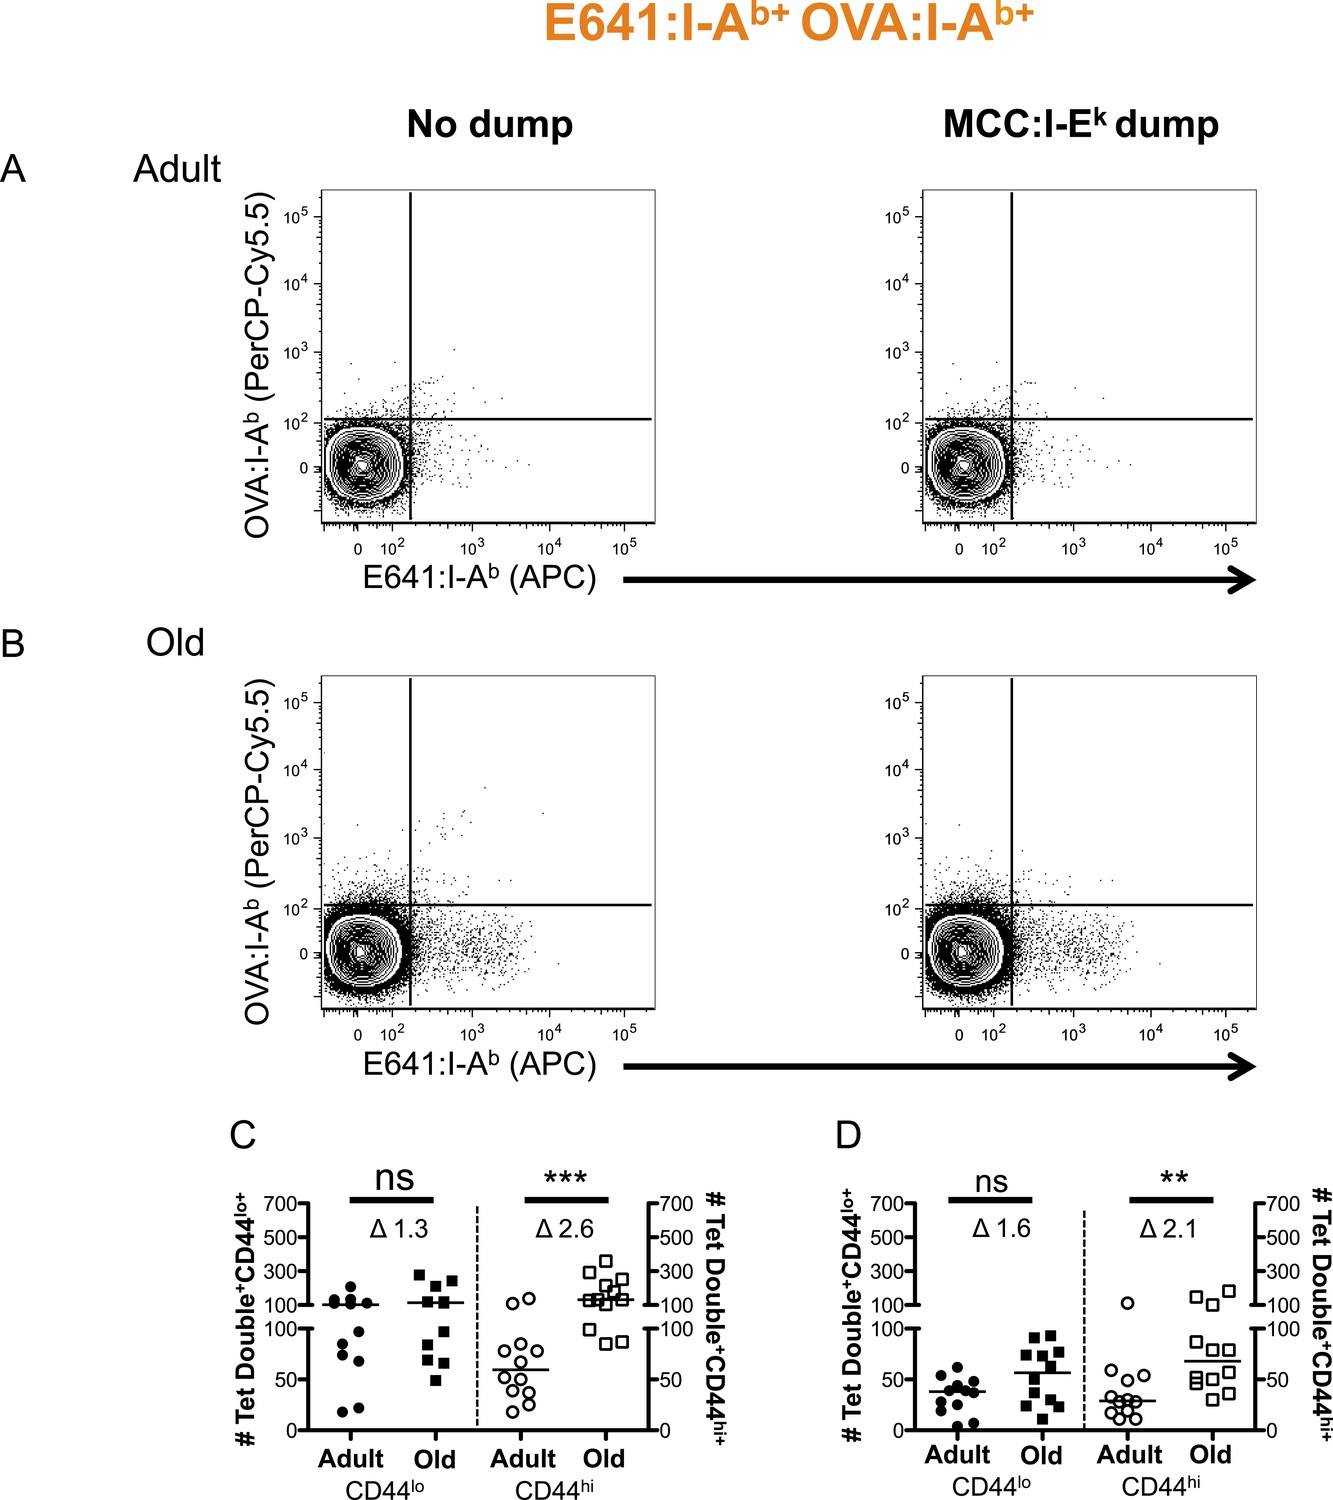
Two-color analysis of E641+OVA polyspecific cells ± dump tetramer exclusion.
CD4+ T-cells from pooled spleen and lymph nodes from unprimed adult and old mice after tetramer enrichment using anti-His magnetic beads. Shown are representative plots of the CD4+ T-cells binding E641:I-Ab + OVA:I-Ab tetramers pre (left) and post (right) gating out the dump, MCC:I-Ek, tetramer+ cells in (A) adult and (B) old mice. Absolute number of CD44lo (left Y-axis) and CD44hi (right Y-axis) CD4+ T-cells binding E641:I-Ab + OVA:I-Ab tetramers (C) pre and (D) post gating out the dump MCC:I-Ek tetramer+ cells. Horizontal bar indicates median (**p < 0.005, ***p < 0.0001, ns = non-significant; Mann–Whitney). Δ: Fold change in average numbers from adult to old mice. Data are from three experiments with 4 mice/group.
Figure 2—figure supplement 8
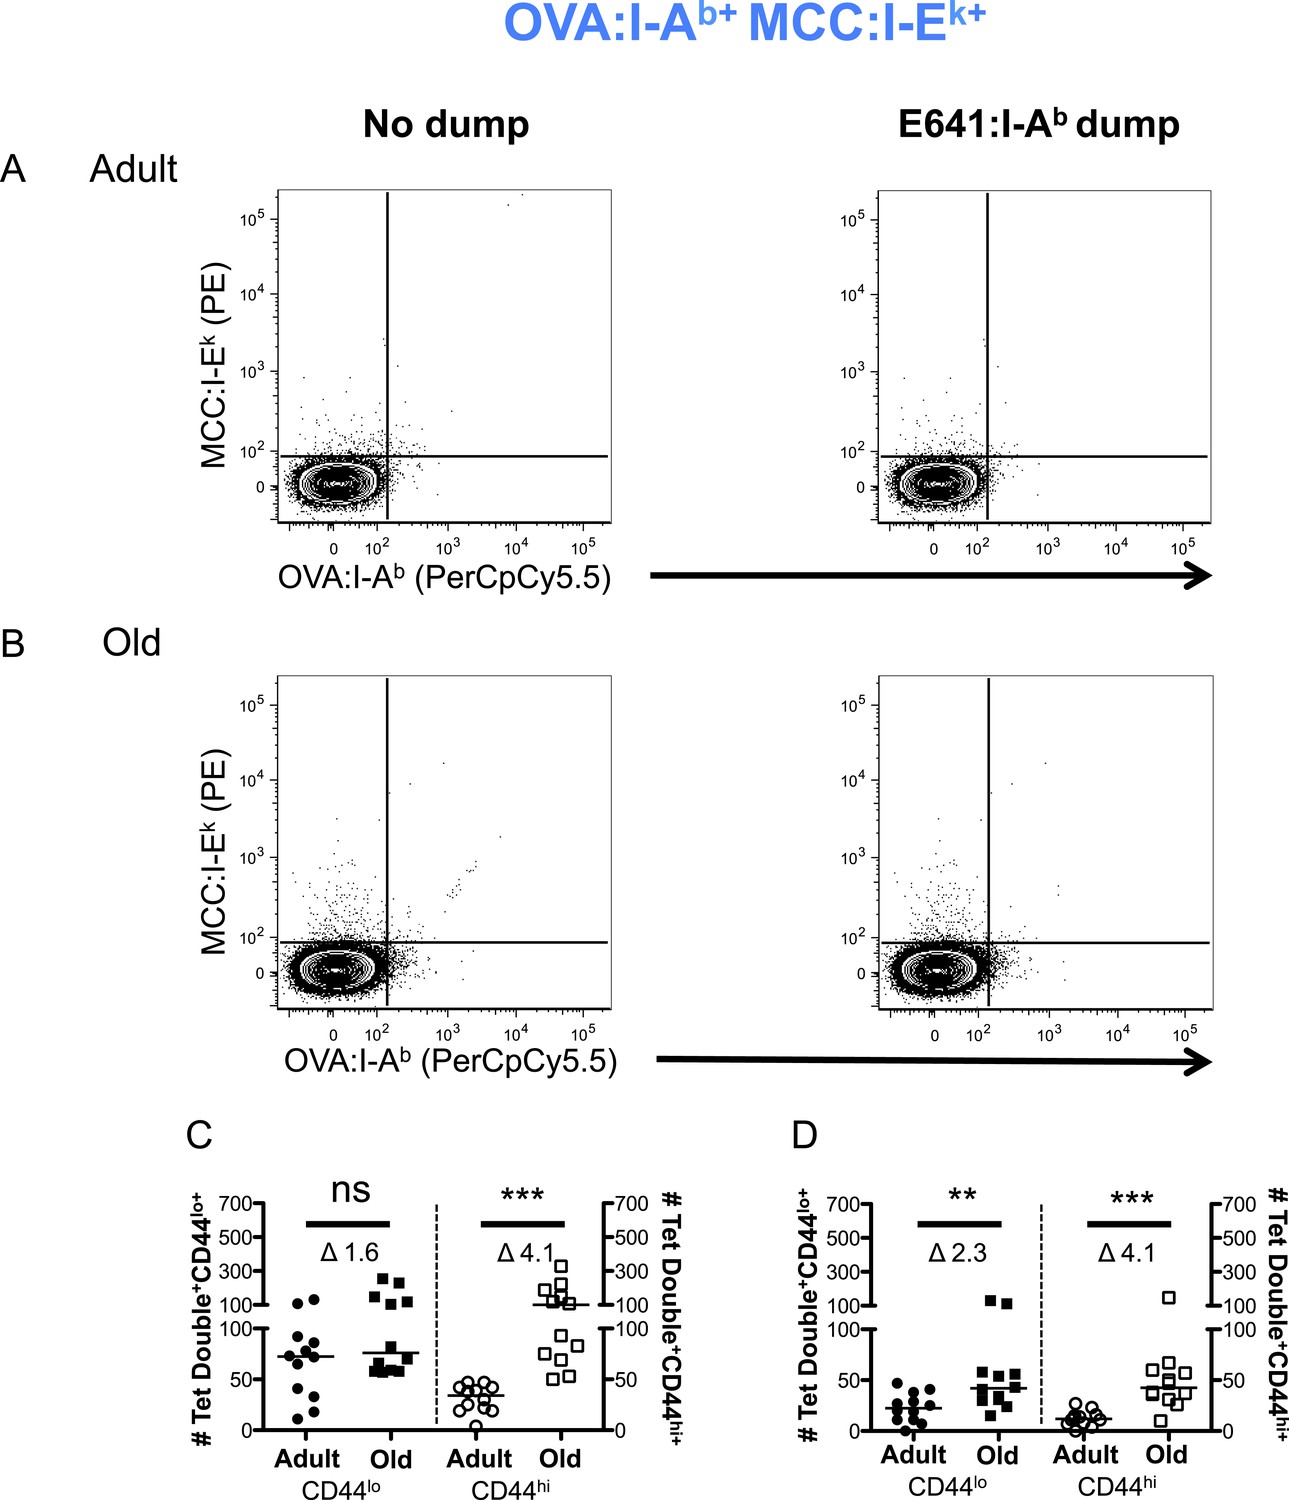
Two-color analysis of OVA+MCC polyspecific cells ± dump tetramer exclusion.
CD4+ T-cells from pooled spleen and lymph node from unprimed adult and old mice after tetramer enrichment using anti-His magnetic beads. Shown are representative plots of the CD4+ T-cells binding OVA:I-Ab + MCC:I-Ek tetramers pre (left) and post (right) gating out the dump, E641:I-Ab, tetramer+ cells in (A) adult and (B) old mice. Absolute number of CD44lo (left Y-axis) and CD44hi (right Y-axis) CD4+ T-cells binding OVA:I-Ab + MCC:I-Ek tetramers (C) pre and (D) post gating out the dump, E641:I-Ab, tetramer+ cells. Horizontal bar indicates median (**p < 0.005, ***p < 0.0001, ns = non-significant; Mann–Whitney). Δ: Fold change in average numbers from adult to old mice. Data are from three experiments with 4 mice/group.
Figure 2—figure supplement 9
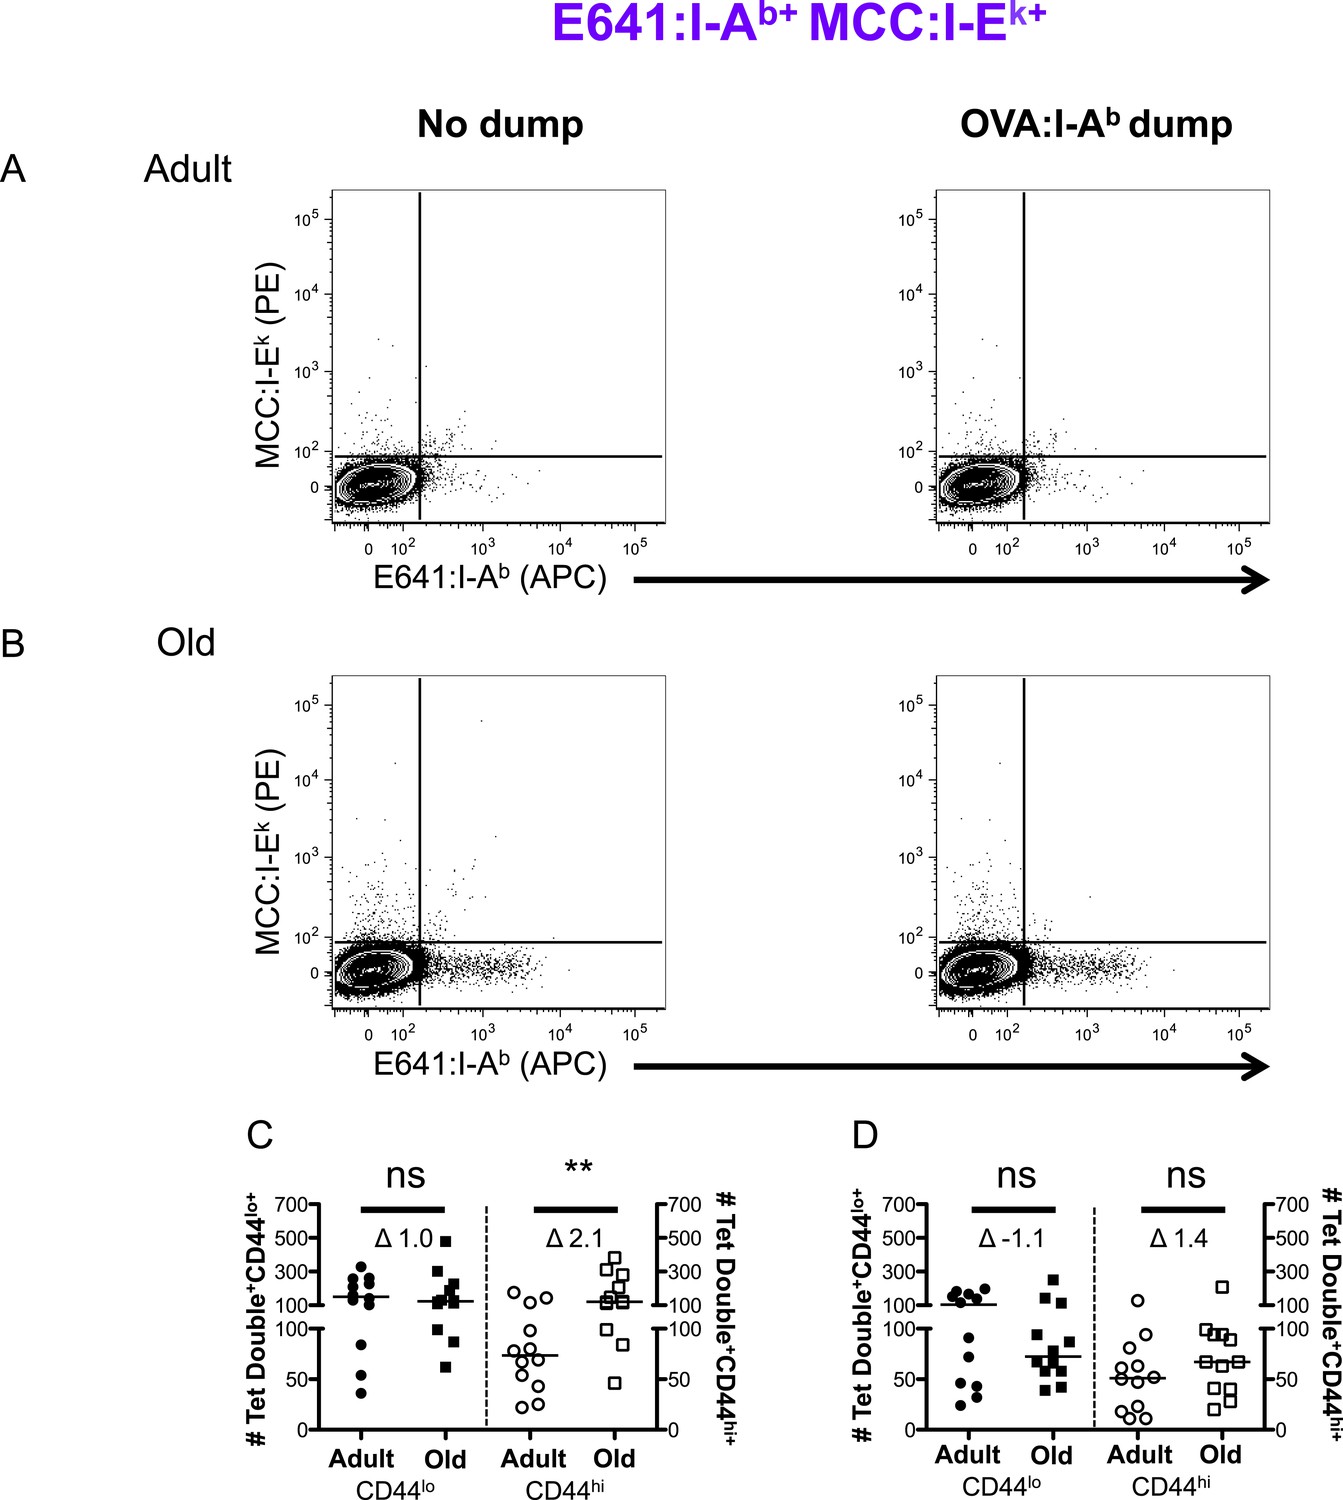
Two-color analysis of E641+MCC polyspecific cells ± dump tetramer exclusion.
CD4+ T-cells from pooled spleen and lymph node from unprimed adult and old mice after tetramer enrichment using anti-His magnetic beads. Shown are representative plots of the CD4+ T-cells binding E641:I-Ab + MCC:I-Ek tetramers pre (left) and post (right) gating out the dump, OVA:I-Ab, tetramer+ cells in (A) adult and (B) old mice. Absolute number of CD44lo (left Y-axis) and CD44hi (right Y-axis) CD4+ T-cells binding E641:I-Ab + MCC:I-Ek tetramers (C) pre and (D) post gating out the dump, OVA:I-Ab, tetramer+ cells. Horizontal bar indicates median (**p < 0.005 ns = non-significant; Mann–Whitney). Δ: Fold change in average numbers from adult to old mice. Data are from three experiments with 4 mice/group.
Figure 3 with 1 supplement
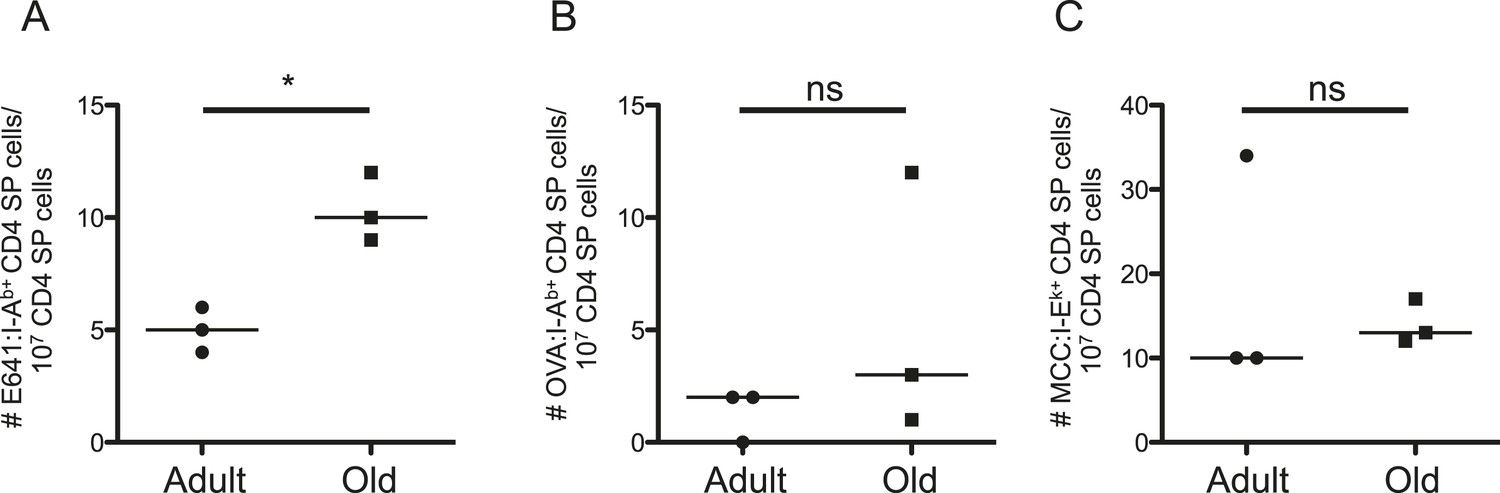
Evidence for changes in selection of E641-binding CD4SP thymocytes with aging.
Frequencies of (A) E641:I-Ab+, (B) OVA:I-Ab+, and (C) MCC:I-Ek+ CD4 single positive (SP) thymocytes per 107 CD4SP thymocytes are shown. Horizontal bar indicates median (*p < 0.05 and ns = non-significant; Mann–Whitney). Each dot represents the results from 4–5 mice pooled/group as described in ‘Materials and methods’.
Figure 3—figure supplement 1
Dump tetramer plus two-color gating scheme for identification of tetramer+ CD4SP thymocytes.
Representative gating scheme for identifying tetramer+ cells for Figure 3. (A) Forward vs side scatter. (B) CD3+ Thymocytes. (C) CD4SP T-cells. After anti-His magnetic enrichment, (D–G) E641:I-A+ CD4SP thymocytes cells were identified by dumping MCC:I-Ek+ and OVA:I-Ab+ bound cells. Similar gating strategy was employed to identify MCC:I-Ek+ and OVA:I-Ab+ CD4+ T-cells.
Figure 4
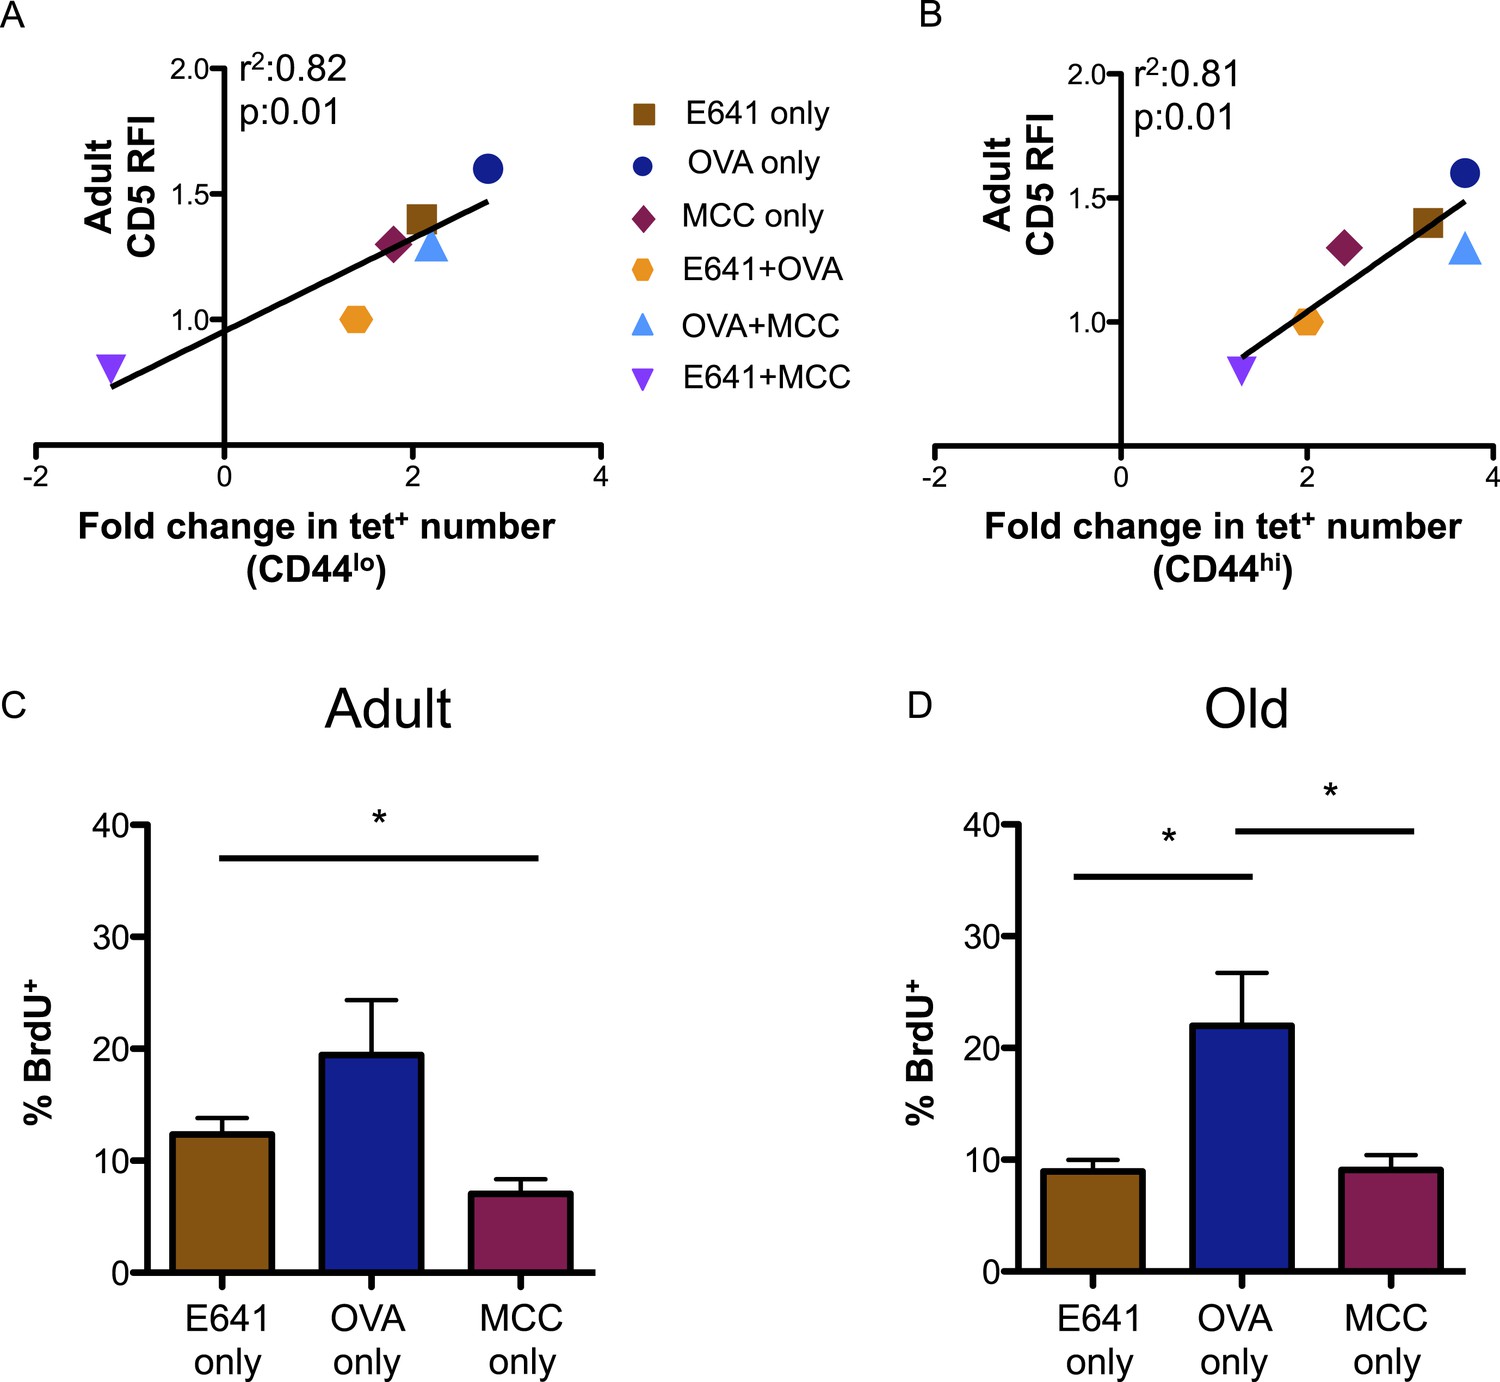
CD5 levels on adult CD4+ T-cells correlate with expansion over time.
Correlation between CD5 RFI for adult CD4+ tetramer+ T-cells and fold change in tetramer+ cells between adult and old populations of (A) CD44lo and (B) CD44hi CD4+ T-cells are shown as labeled. Linear regression was calculated using GraphPad Prism 5. Steady-state in vivo proliferation was assessed by measuring percent BrdU incorporation in tetramer single+ (C) adult or (D) old CD4+ T-cells derived from unprimed mice after 6 days of BrdU exposure (*p < 0.05; ANOVA followed by Dunn's post-test comparison). Results represent two experiments with 4 mice/group.
Author response image 1
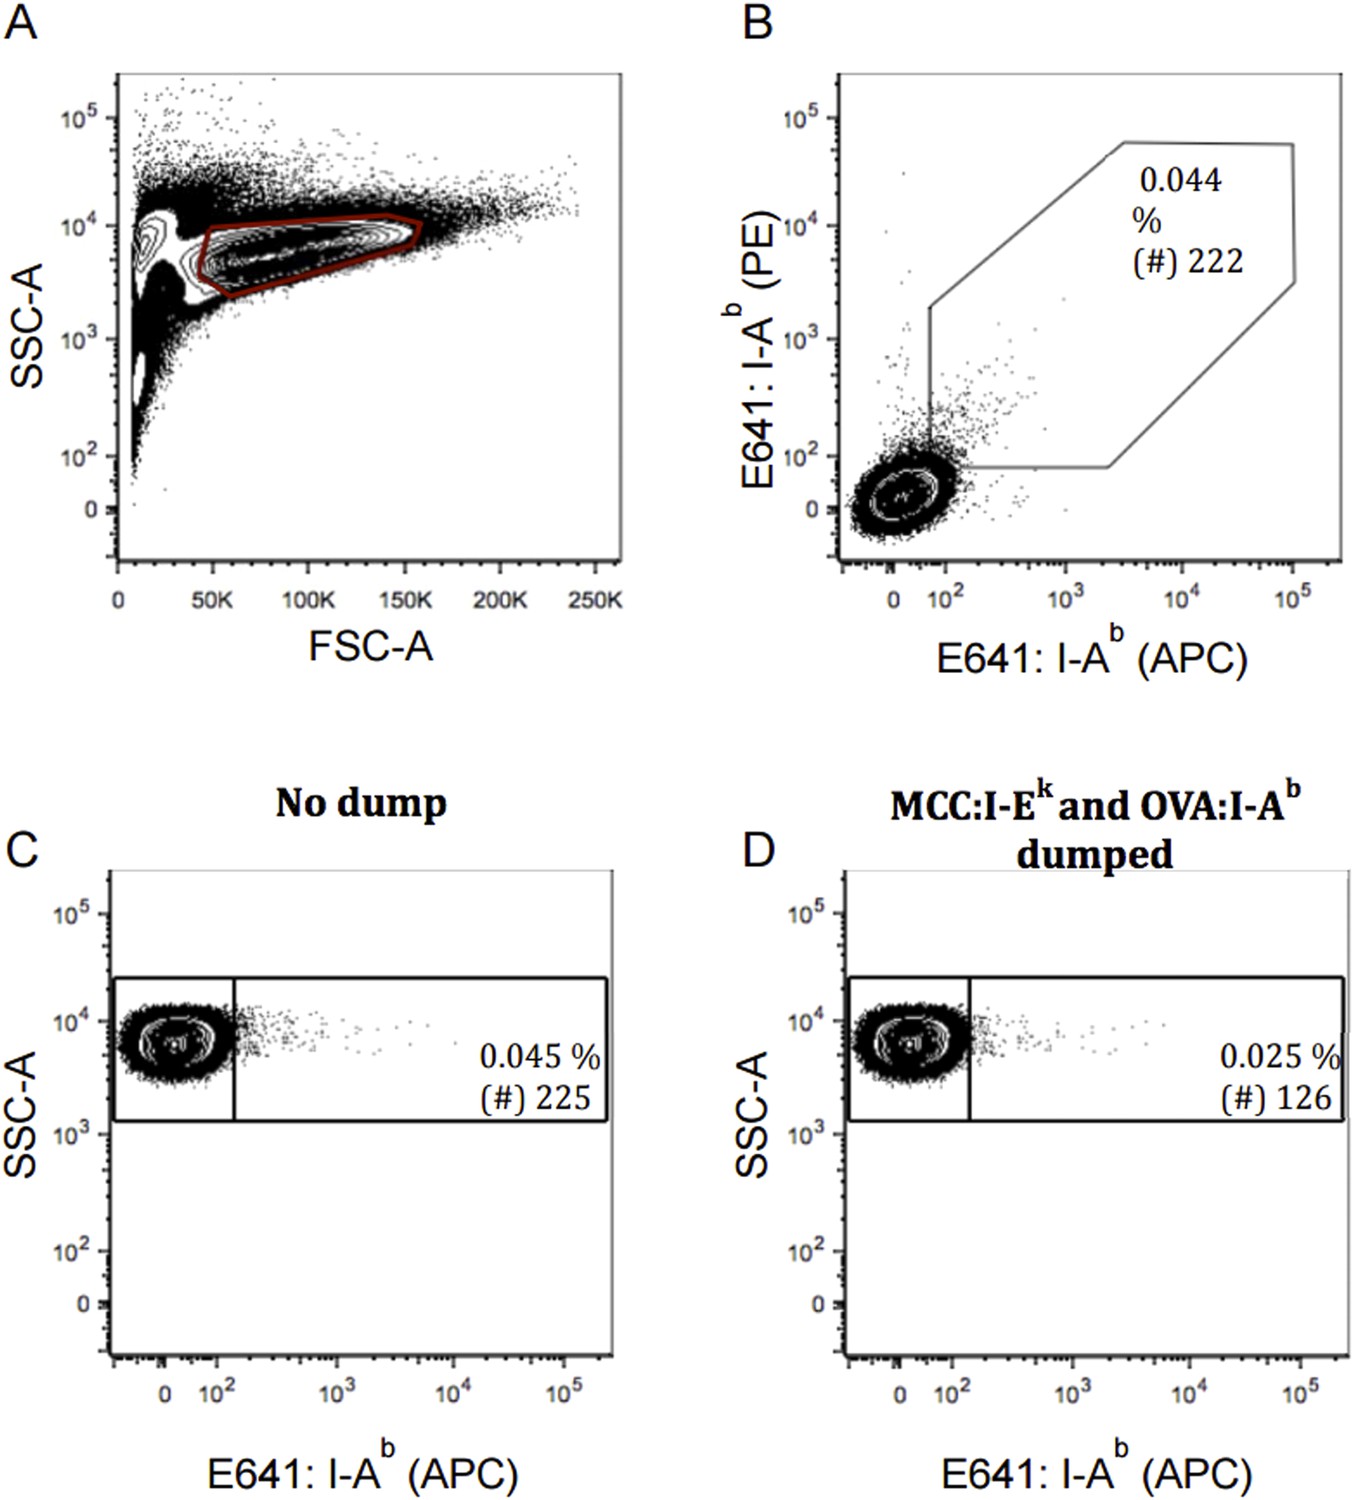
Exclusion of false-positive cells by two-color and dump tetramer analysis modeled with TCR negative T cell hybridoma. TCR negative 58α-β- cells were incubated with E641: I-Ab tetramer in two color as in Figure 3 or with E641: I-Ab, OVA: I-Ab and MCC: I-Ek tetramers with single color as in Figure 4. Contour plot showing our (A) live 58α-β- cells; (B) 58α-β- cells incubated with E641: I-Ab (APC) and (PE) for two-color analysis; or 58α-β- cells staining positive for E641: I-Ab tetramer (C) pre and (D) post dump of cells bound to OVA: I-Ab and MCC: I-Ek. Percent and number (of 500,000 58α-β- cells) of cells bound to E641: I-Ab tetramer are shown in inset.
Author response image 2
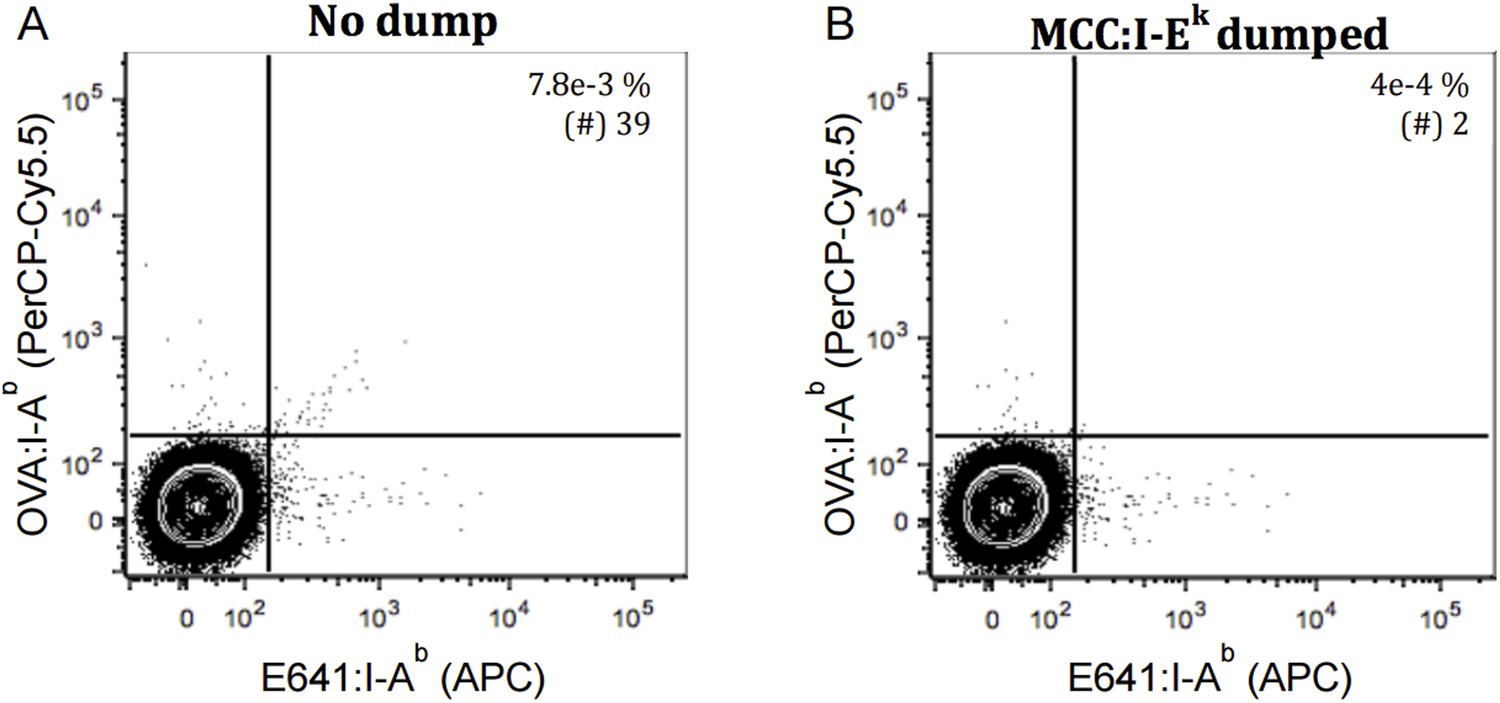
Dump tetramer and two-color analysis excludes the bulk of false positives from the analysis. TCR negative 58α-β- cells were incubated with E641: I-Ab, OVA: I-Ab and MCC: I-Ek tetramers as in Figure 4. Contour plot showing 58α-β- cells staining with E641: I-Ab (APC) and OVA: IAb (PerCP- Cy5.5) pre and post using dump (MCC: I-Ek) tetramer (A-B) Quadrant gate as in Nelson, et al., 2015. 500,000 58α-β- events are displayed. Percent and number of within the quadrant gates are shown in inset.
Download links
A two-part list of links to download the article, or parts of the article, in various formats.
Downloads (link to download the article as PDF)
Open citations (links to open the citations from this article in various online reference manager services)
Cite this article (links to download the citations from this article in formats compatible with various reference manager tools)
Self-recognition drives the preferential accumulation of promiscuous CD4+ T-cells in aged mice
eLife 4:e05949.
https://doi.org/10.7554/eLife.05949


