A structure-based extracellular matrix expansion mechanism of fibrous tissue growth
- University of Manchester, United Kingdom
Figures
Figure 1
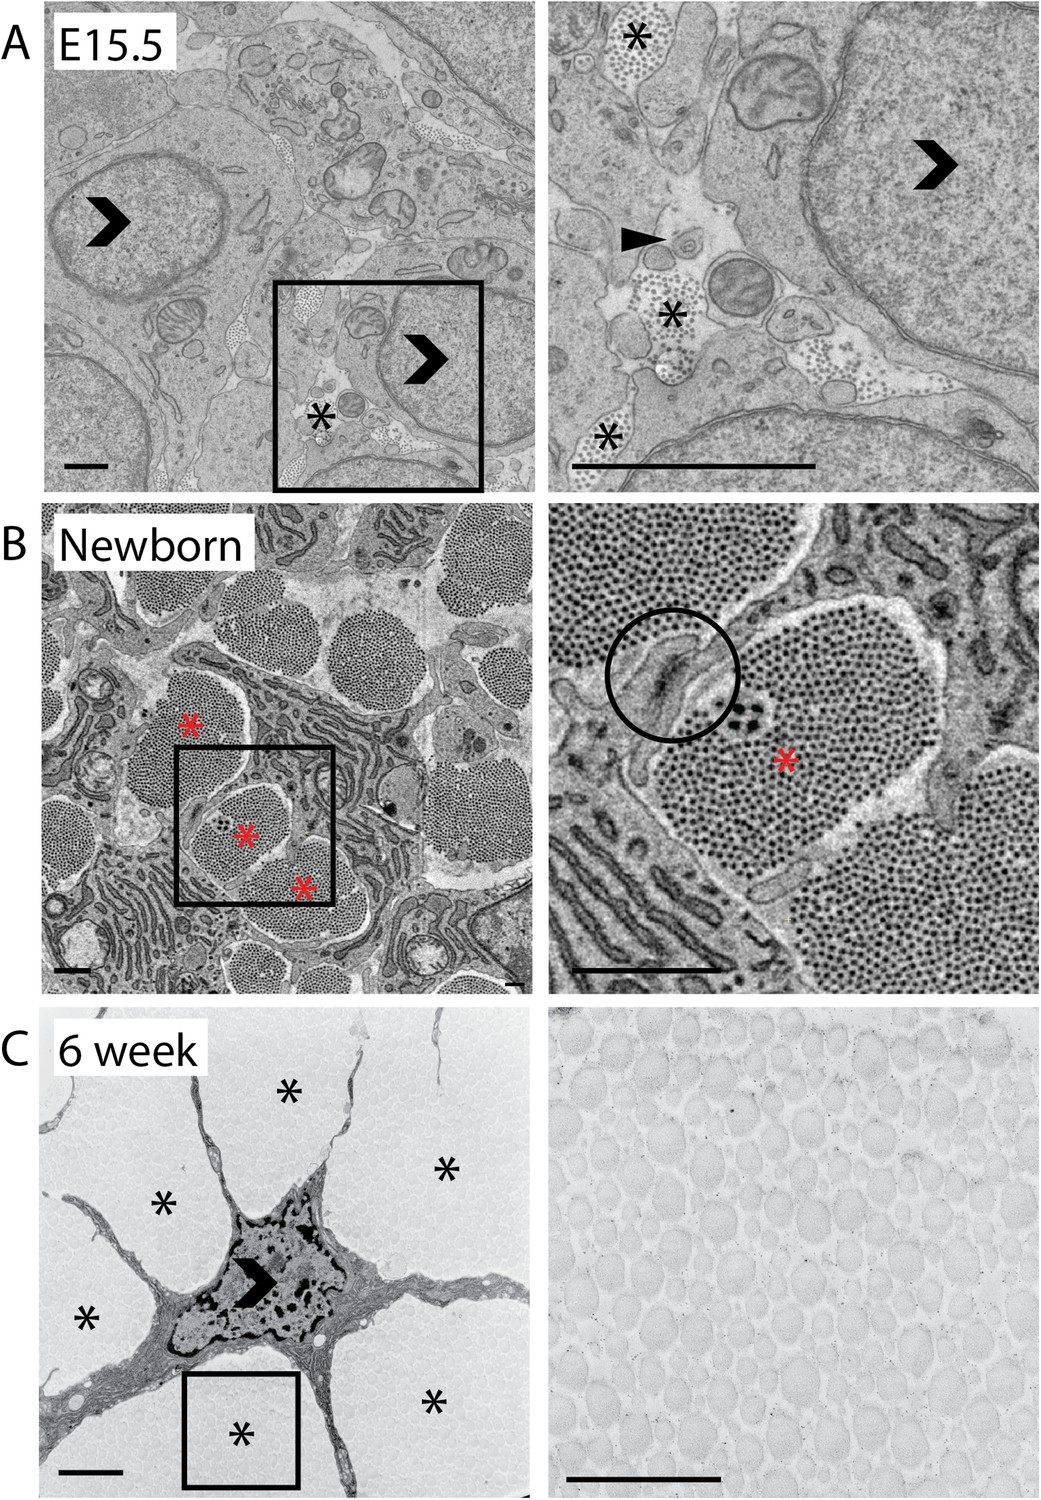
2D analysis of mouse-tail tendon through development.
(A) Transmission electron microscope (TEM) images of transverse sections at embryonic day 15.5 (E15.5). A closed arrowhead marks a fibripositor, seen during embryonic development but absent in postnatal tissue. Fibril bundles (marked *) are small. An open arrowhead marks a cell nucleus. (B) Newborn (P0). A cell–cell junction is circled between two cytoplasmic processes enclosing a fibril bundle. Bundles are larger and contain more fibrils than at E15.5. (C) 6 weeks postnatal. Cells have elongated processes that divide the matrix into bundles and connect with other cells. Bundles are larger than in newborn tissue. Open arrowhead marks cell nuclei. Stars (*) mark fibril bundles. Scale bar = 1 µm. The areas marked with a square in the left image in A, B and C are magnified in the right image.
Figure 2
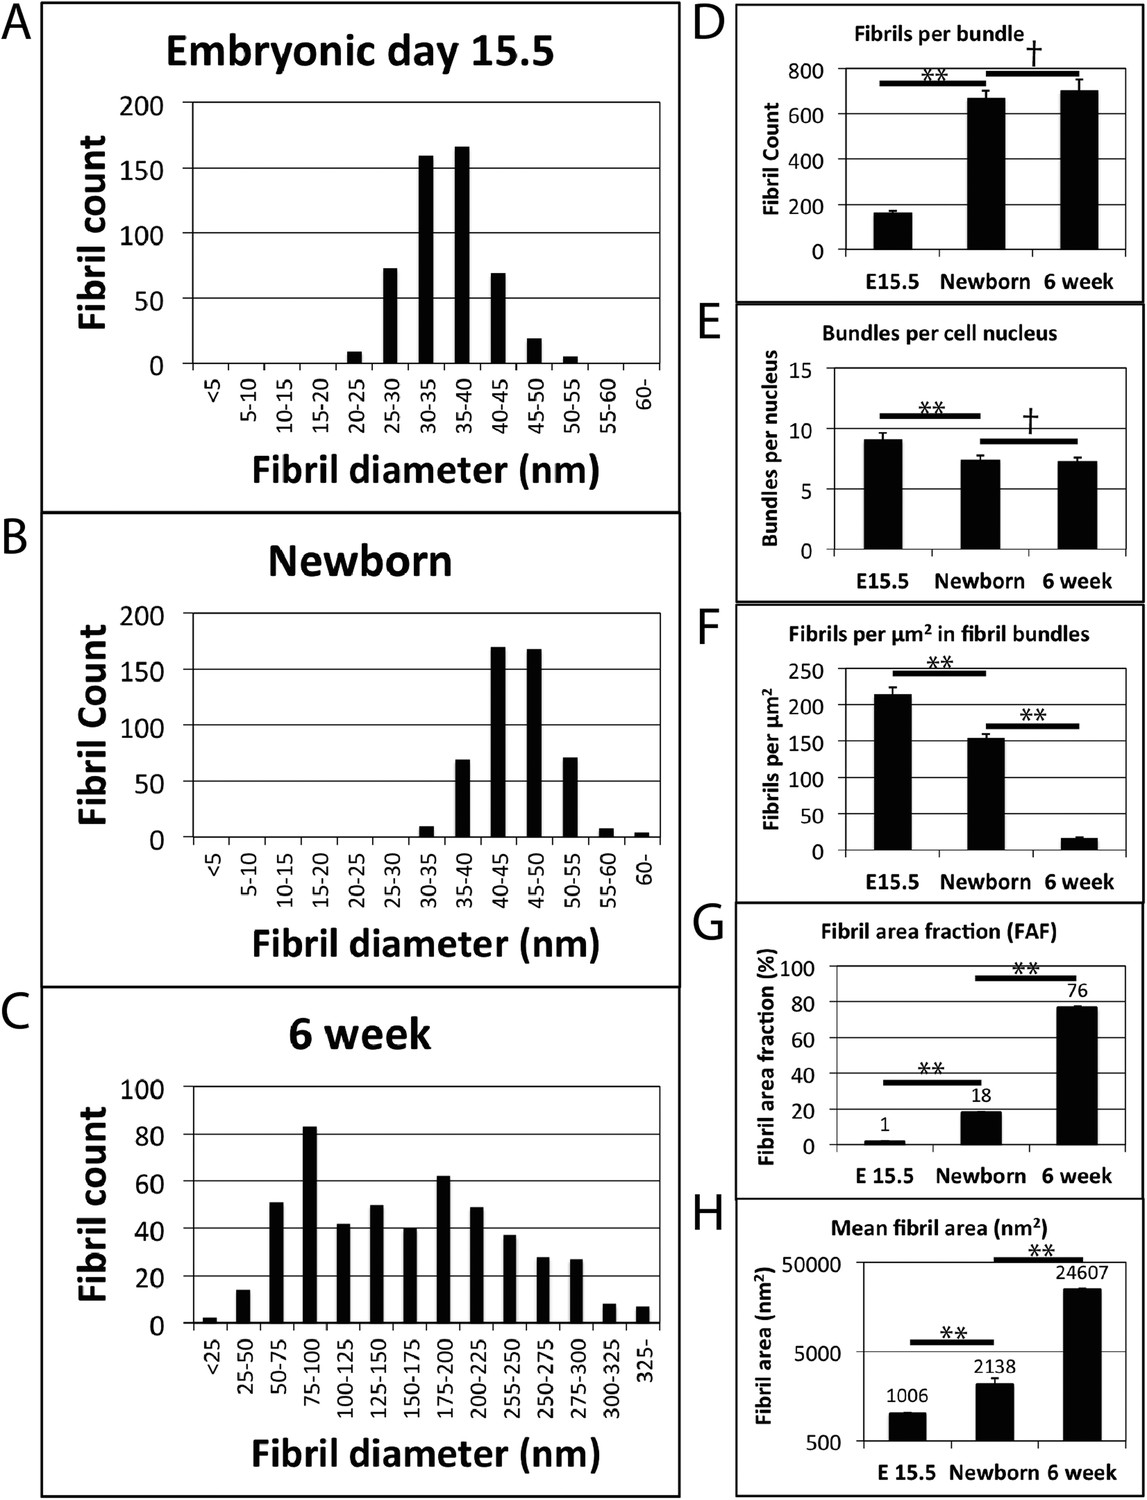
Fibril diameter and fibril bundling during development.
(A) Fibril diameter plot for embryonic day 15.5 (A), newborn (B) and 6 week old tendon (C). In embryonic development there is a gradual increase in fibril diameter, which has a unimodal size distribution. Postnatal tendon has larger fibrils with a bimodal distribution. (D) There is a major (∼fourfold) increase in fibril profiles in transverse section per bundle from E15.5 to newborn tissue. This fibril number remains constant postnatal in mature tissue. (E) Fibril bundle number per cell nucleus is constant postnatal. (F) The number of fibrils per µm2 decreases as a function of increasing fibril diameter. (G) The area occupied by fibrils (as a proportion of total tendon area) increases significantly at each time point. (H) Mean fibril area increases significantly at each time point (derived from fibril diameter data assuming circularity). A logarithmic scale has been used on the y-axis. ** Indicates significant difference (p = <0.05), † indicates p = >0.05. Source data in Figure 2—source data 1.
-
Figure 2—source data 1
Fibril diameter and bundle data.
- https://doi.org/10.7554/eLife.05958.006
Figure 3
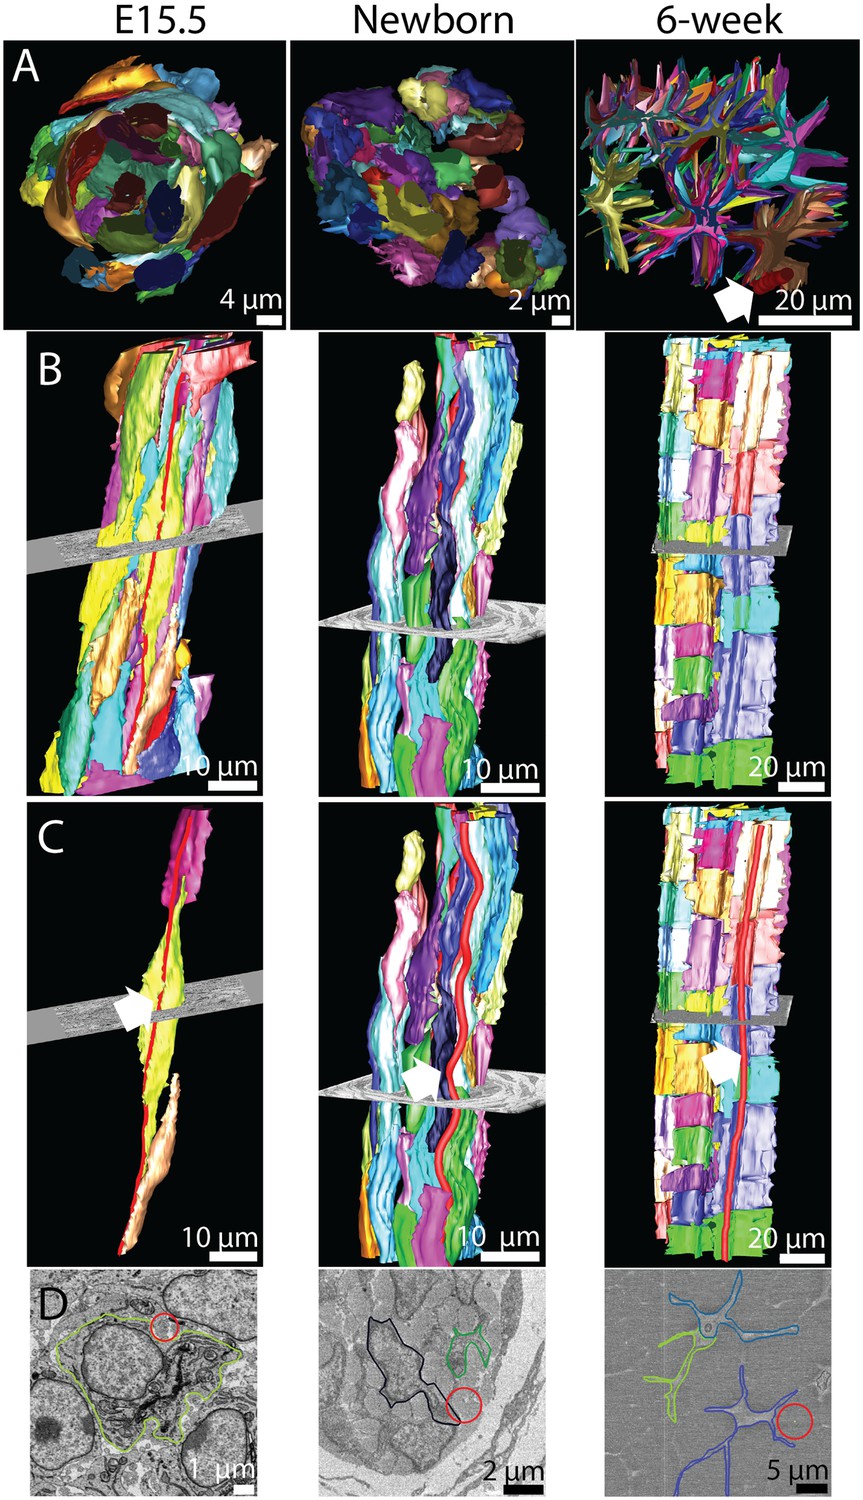
The 3D morphology of tendon changes from embryonic to postnatal tissue.
3D reconstructions from SBF-SEM images of E15.5, newborn and 6 week mouse-tail tendon. Individual cells are reconstructed in a different colour. (A) A transverse view of reconstructed tendon cells. E15.5 is comprised predominantly of rounded cells, with relatively little collagenous ECM. During development the ECM grows rapidly; by 6 weeks postnatal there are large spaces between cells containing bundles of collagen fibrils. One bundle (red) is marked with a white arrowhead. (B) Longitudinal views demonstrate the development of (1) well-defined channels formed by cells stacked end-to-end, and (2) wavy orientation of tenocytes corresponding to crimped bundles of collagen fibrils, particularly notable in newborn tendon. (C) The same reconstructions as in B with a bundle of collagen fibrils highlighted (red, marked with a white arrow). Longitudinally continuous bundles of fibrils are seen at E15.5 closely associated with tendon cell membranes. Crimp is clearly seen in newborn tendon and persists in 6 week tendon with a longer wavelength. (D) SBF-SEM images corresponding to C. The fibril bundle in C is circled red. Cell membranes are also outlined.
Figure 4 with 1 supplement
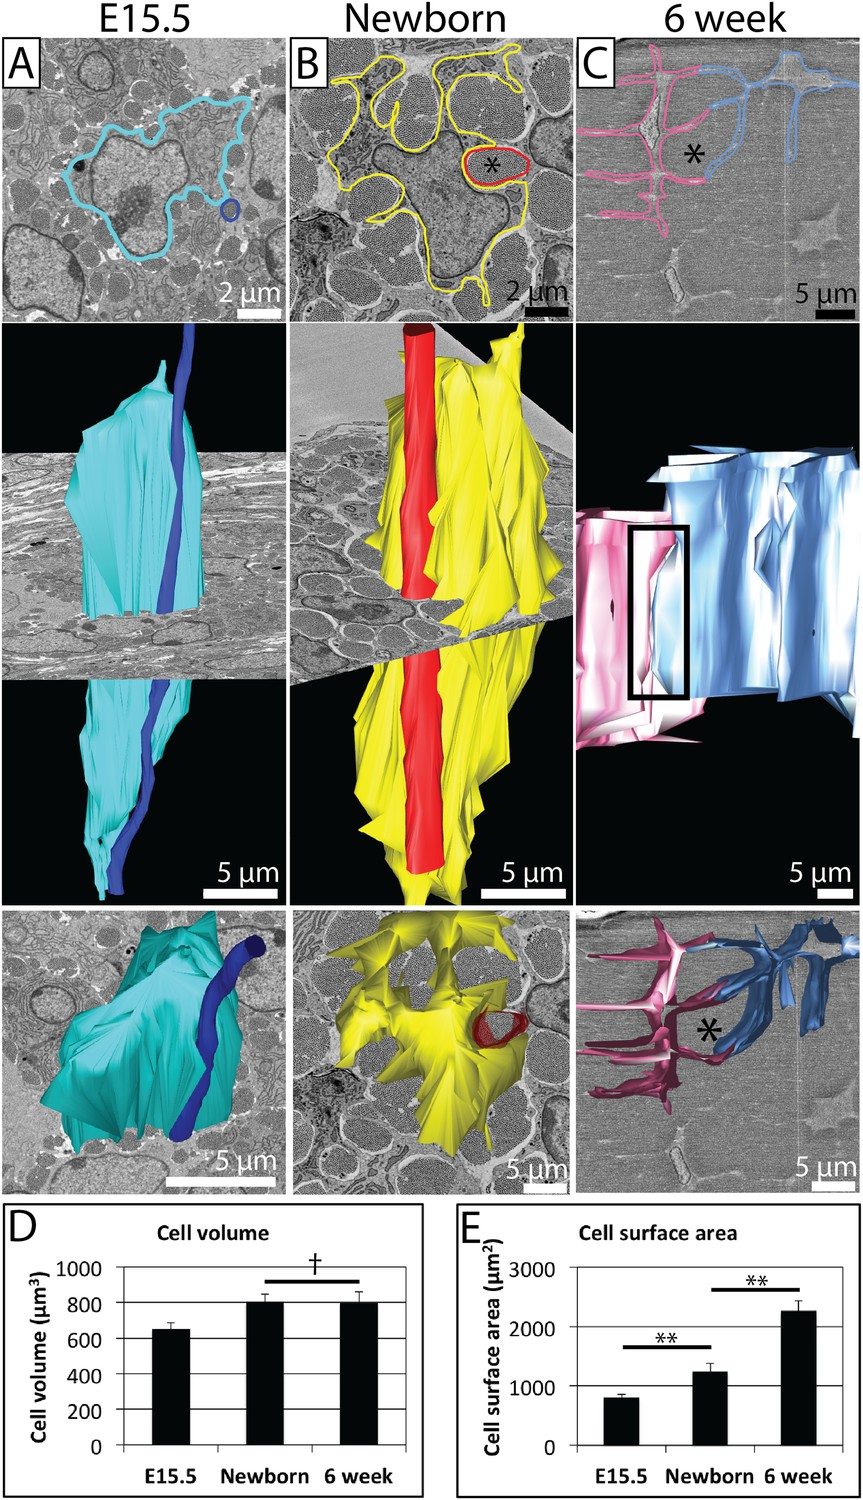
Changes in cell morphology during development.
(A) E15.5 mouse-tail tendon. A cell membrane is highlighted in blue (top panel, single SBF-SEM transverse image) and reconstructed (middle and bottom panels). A fibril bundle, circled in dark blue (top), is reconstructed, and lies closely associated with the cell along the entire cell length. (B) Newborn mouse-tail tendon. A cell membrane is highlighted in yellow (top panel, single SBF-SEM transverse image). A fibril bundle is highlighted in red and reconstructed in red, together with the corresponding cell (in yellow, middle and bottom panels). The fibril bundle is again closely associated with the cell. Cell protrusions surrounding fibrils are better defined than at E15.5. (C) 6 week old mouse-tail tendon. Two adjacent cell membranes are highlighted blue and pink (top panel, single SBF-SEM transverse section image). The same cells are reconstructed below. A fibril bundle is marked with *. The two cells have elongated processes that reach out and contact each other (highlighted with a rectangle, top reconstruction), enveloping a bundle of collagenous ECM (*). (D) There is a small increase in cell volume between E15.5 and newborn time points, but no further increase in cell volume, which remains relatively constant during postnatal development. (E) Cell surface area increases markedly (1.5 fold and 1.8 fold for E15.5 to newborn and newborn to 6 week old, respectively) as cells develop large cell membrane processes to enlarge the channels containing the fibril bundles. ** Indicates significant difference (p = <0.05), † indicates p = >0.05. * Marks a fibril bundle. Source data in Figure 4—source data 1.
-
Figure 4—source data 1
Cell morphology data.
- https://doi.org/10.7554/eLife.05958.009
Figure 4—figure supplement 1
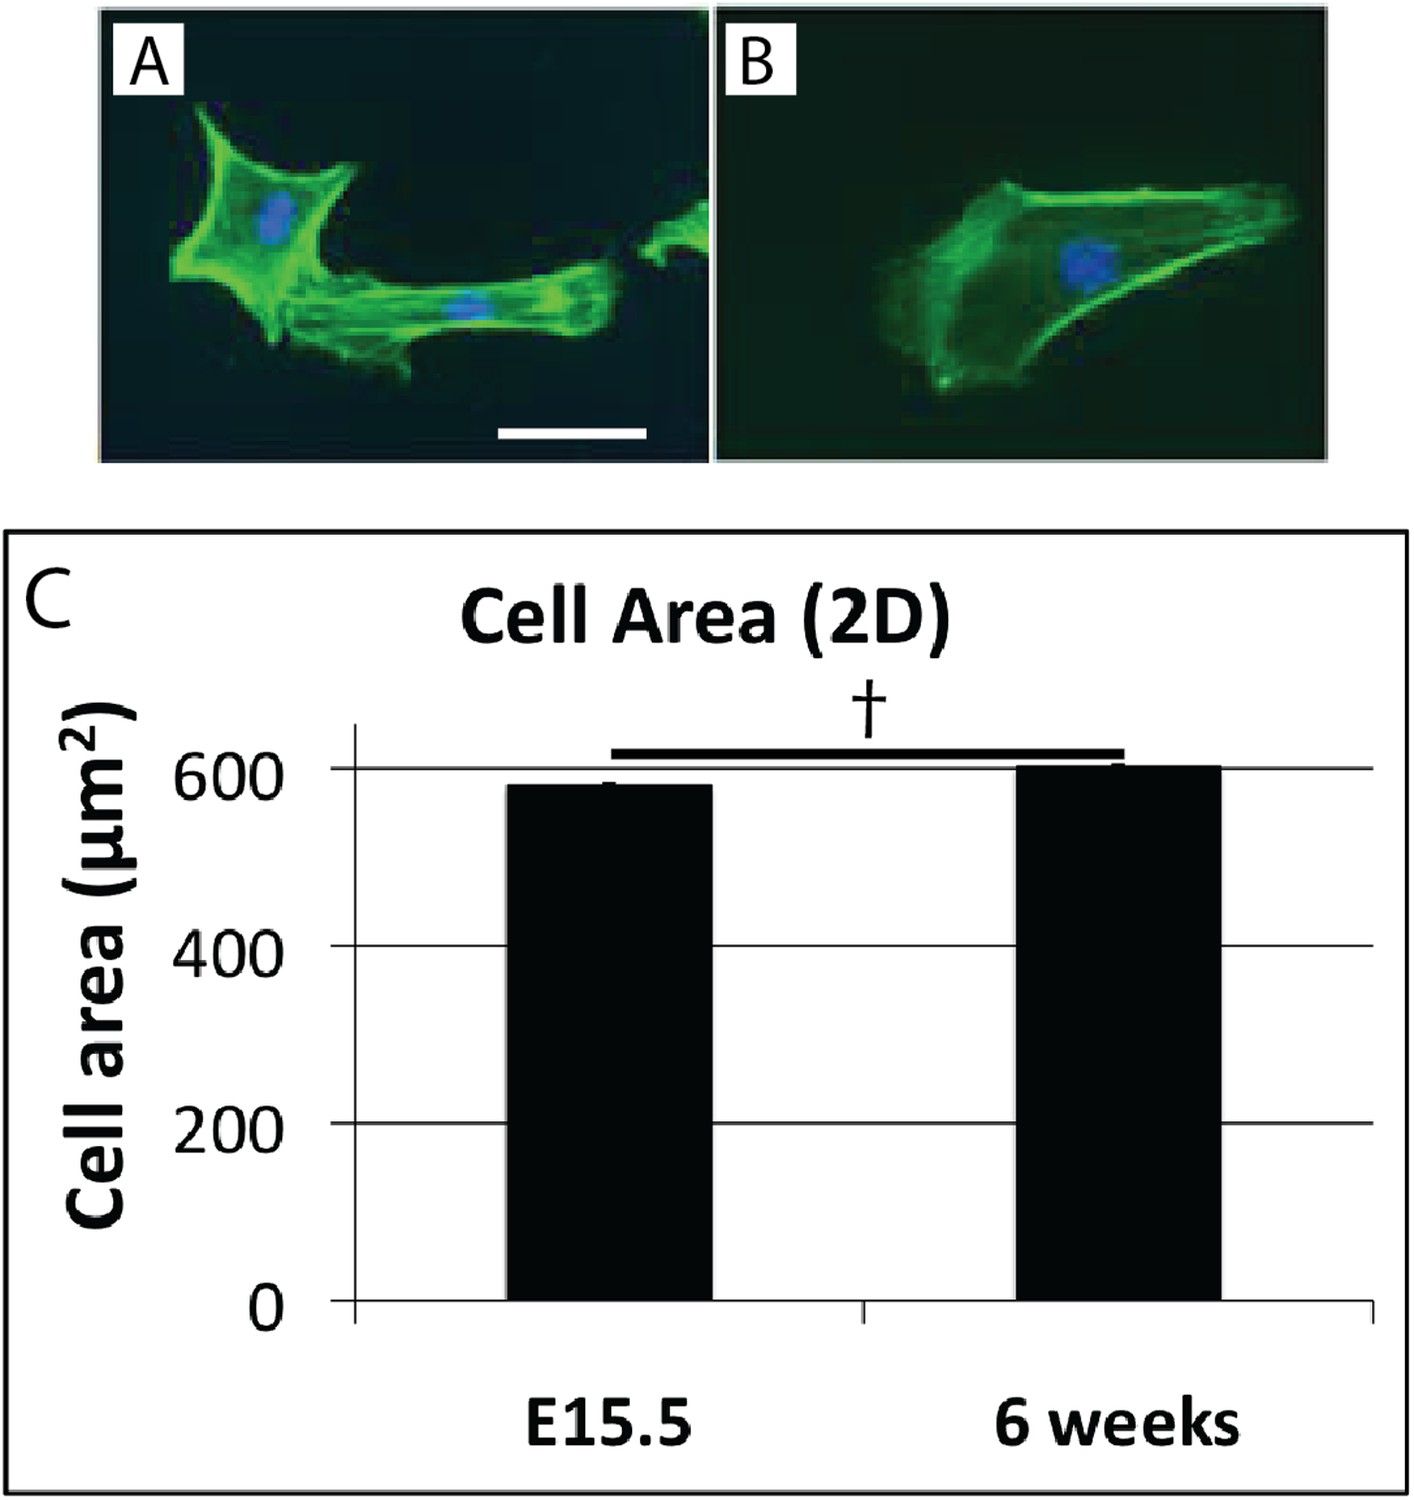
Cell shape in 2D culture.
Cells isolated from E15.5 (A), and 6 week (B) mouse-tail tendon by trypsin digest plated on plastic have similar morphology. Cell surface area is not significantly different in 2D cell culture (C). † indicates p = >0.05. This is in contrast to the marked difference in cell surface area of these cells in vivo (Figure 4E). Scale bar = 10 µm. Source data in Figure 4—source data 1.
Figure 5
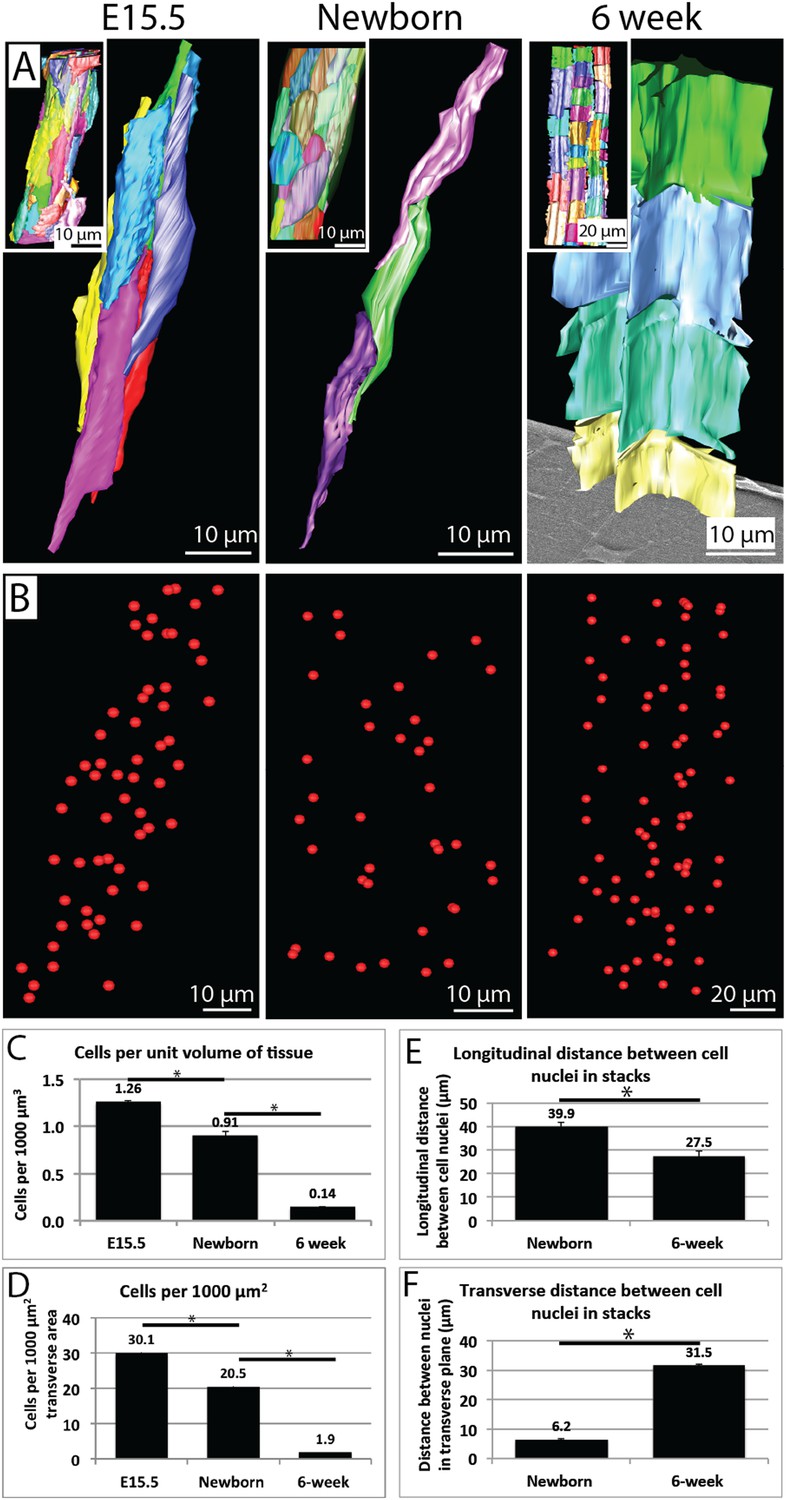
Cell number during development.
(A) 3D reconstructions of longitudinal views of tendon tissue. Individual cell membranes are reconstructed in different colours. Inset images show a lower magnification view. Note the longitudinal-axis cell overlap in newborn tendon, which is not seen at 6 weeks. (B) Cell nuclei from reconstructions in (A) are marked with red spheres. (C) Calculation of cell number per unit volume of tissue. There is a significant decrease in cells per unit volume from E15.5 to newborn (1.26 ± 0.02 to 0.91 ± 0.02 cells per 1000 µm3) and from newborn to 6 weeks (an almost sevenfold change, 0.91 ± 0.02 to 0.14 ± 0.01 cells per 1000 µm3). (D) Calculation of cells per 1000 µm2 of transverse tissue area. The number of nuclei in transverse section was determined. There was a significant decrease in cells per 1000 µm2 from E15.5 to newborn and from newborn to 6 weeks. (E) The longitudinal distance between nuclei of cells in stacks decreases from newborn to 6 weeks (E15.5 cells are not stacked, precluding this analysis). (F) The transverse distance between cell nuclei in adjacent cell stacks increases significantly between newborn and 6 weeks. * Indicates p = <0.05. Source data in Figure 5—source data 1.
-
Figure 5—source data 1
Cell number data.
- https://doi.org/10.7554/eLife.05958.012
Figure 6 with 1 supplement
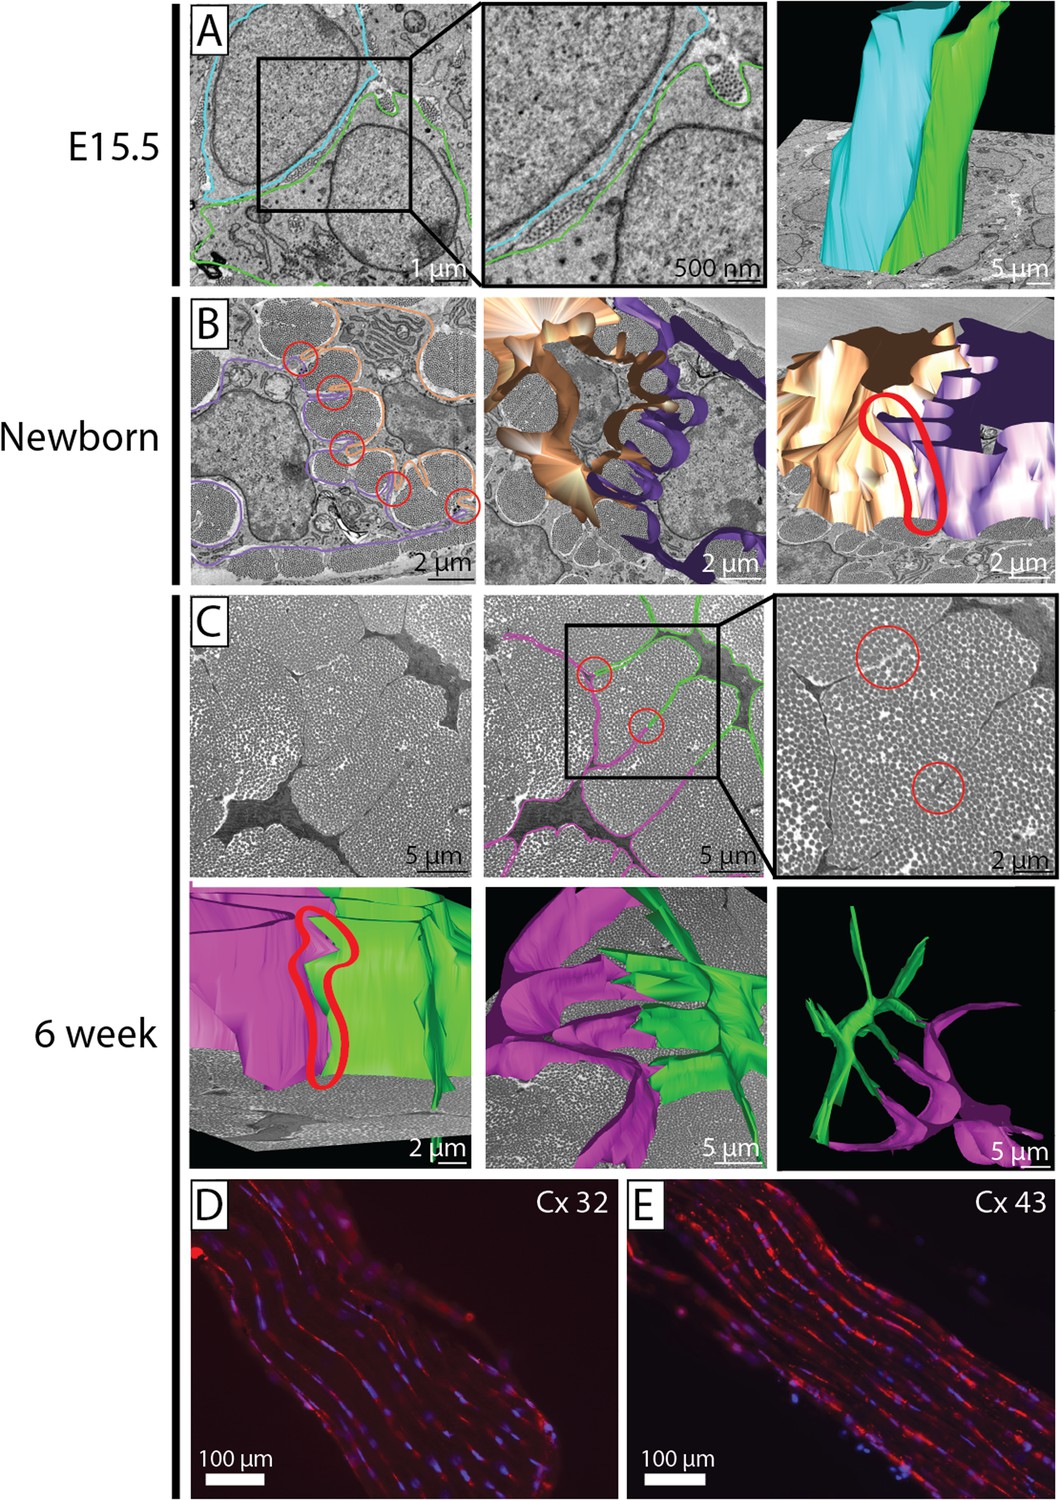
Cell–cell contacts during development.
(A) SBF-SEM images of E15.5 (left and middle panel), 3D cell reconstruction (right panel). Two cells are outlined (blue and green tracing their cell membranes). At E15.5 cells are packed closely, without distinct membrane protrusions forming well-defined channels for collagen fibrils. Narrow diameter fibrils are found between adjacent cell membranes and in cell membrane invaginations. 3D reconstruction of E15.5 cell membranes shows the cells to be in close apposition along their entire length. (B) SBF-SEM images of newborn tendon cells. Two cell membranes are traced (brown and purple). Cell-protrusions are seen, forming channels for ECM fibrils. (C) SBF-SEM images of 6 week tendon. Two cell membranes are traced (pink and green, upper row, three images), and reconstructed (lower row, three images). Distinct cell–cell contacts are seen between adjacent cells (circled in red in SBF-SEM images and in the 3D reconstruction). (D, E) Positive immunofluorescence staining for connexin 32 and connexin 43 in 6 week tendon tissue.
-
Figure 6—source data 1
Cell-contact data.
- https://doi.org/10.7554/eLife.05958.014
Figure 6—figure supplement 1
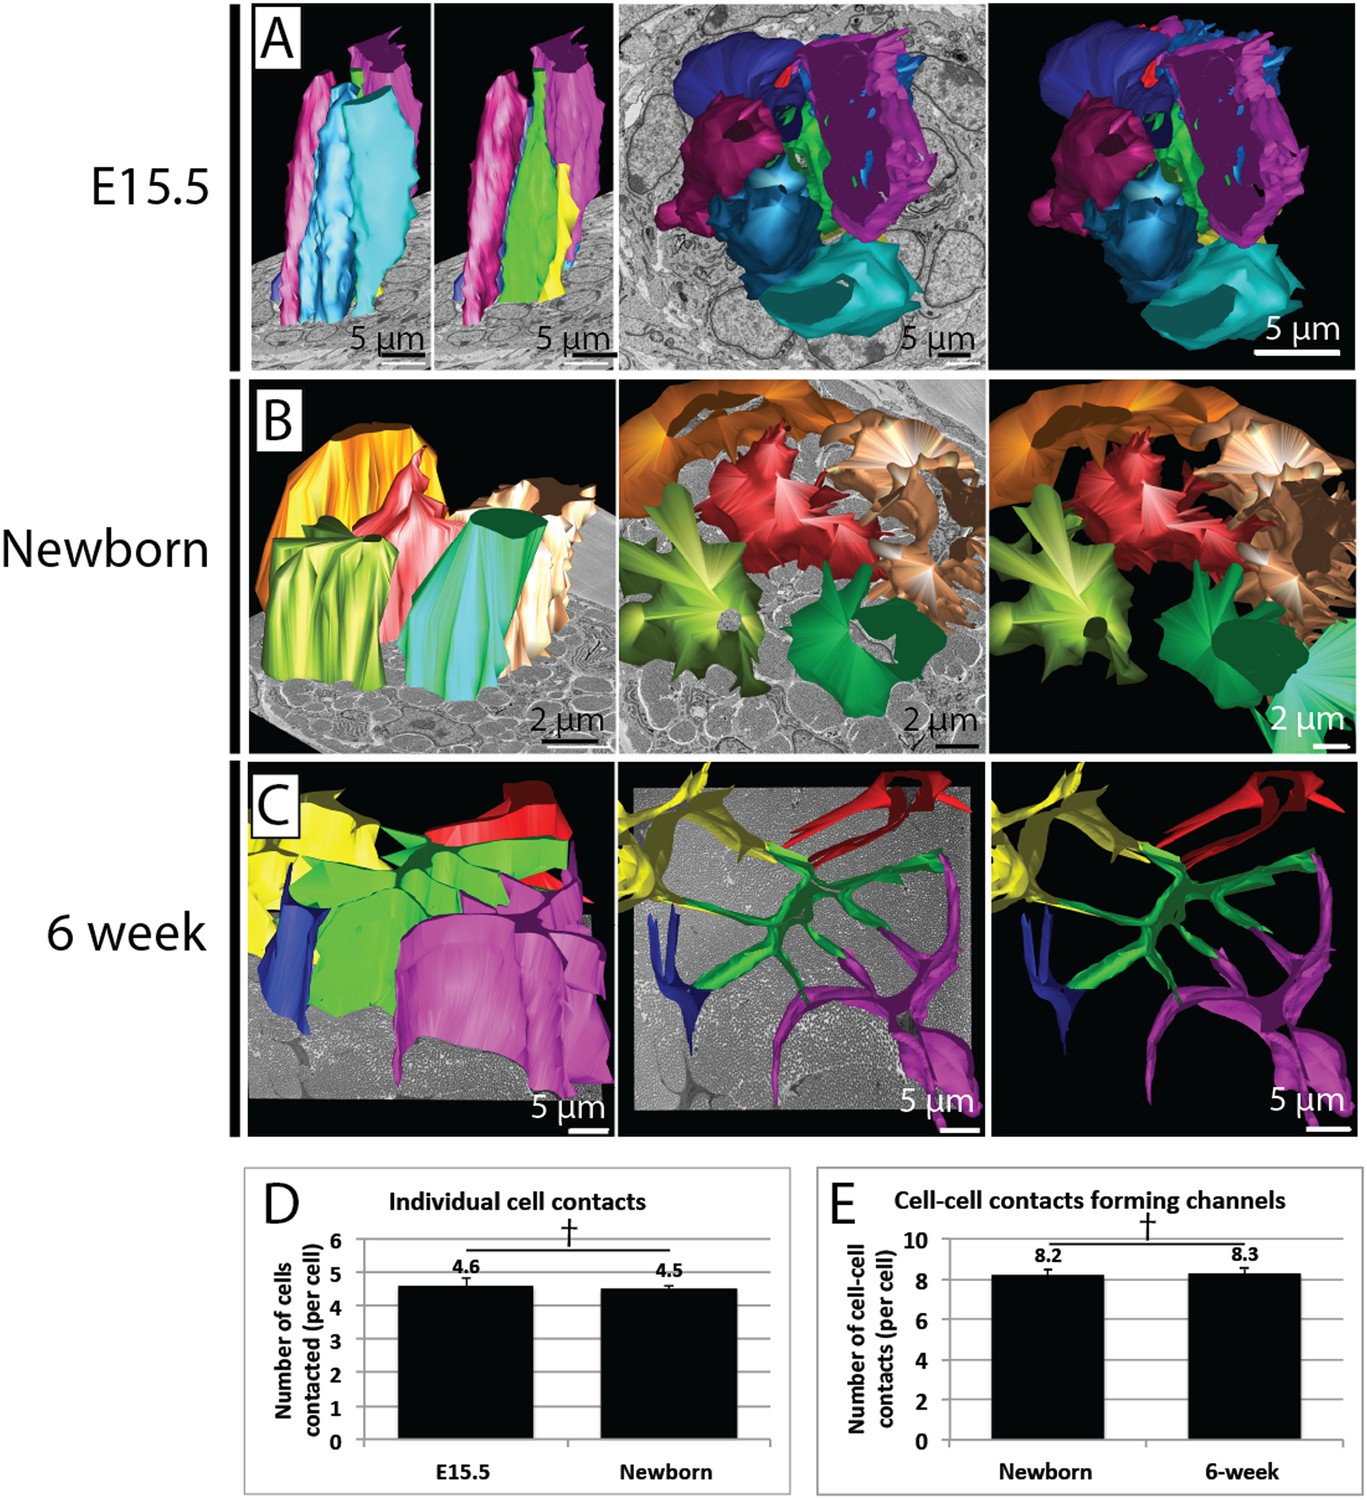
Quantification of cell–cell contacts.
(A) Reconstructions from SBF-SEM data of E15.5 tendon cells. Cells are closely packed, with multiple neighbouring cells in close apposition. (B) Reconstructions from SBF-SEM data of newborn tendon cells. One cell (red) is reconstructed with its four surrounding neighbouring cells, which are all contacted via channel-forming protrusions. (C) Reconstructions from SBF-SEM data of 6 week tendon cells. One cell (green) is reconstructed with its four neighbouring cells, which are contacted channel forming-protrusions. (D) Quantification of cell–cell contacts in 3D. The number of other cells contacted per cell was similar in newborn and at 6 weeks. (E) Newborn and 6 week tendon cells both formed a similar number of cell–cell contacts that formed fibril channels. † Indicates p = >0.05. Source data in Figure 6—source data 1.
Figure 7 with 2 supplements
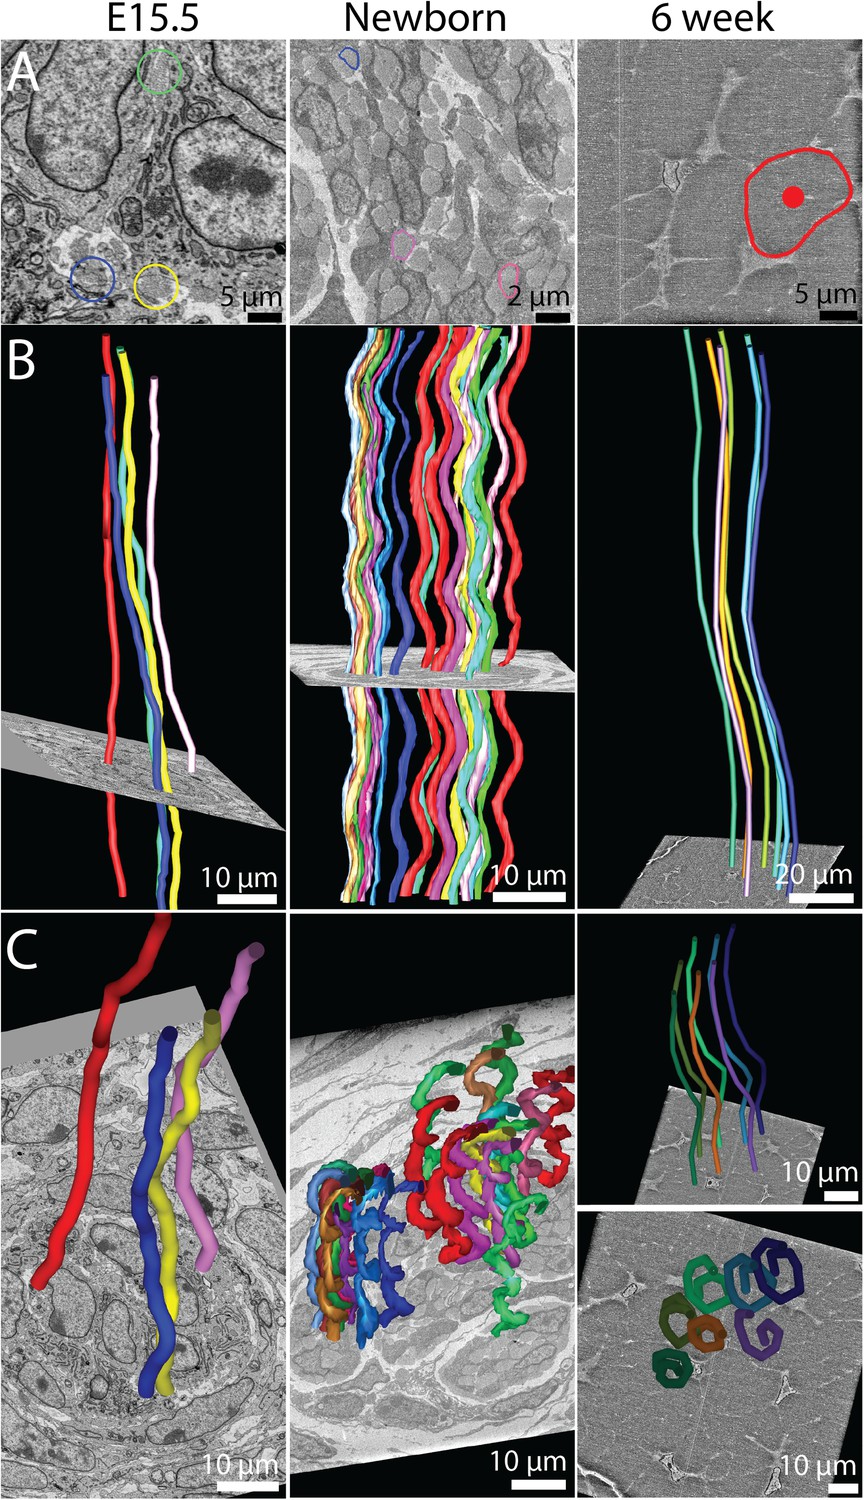
The 3D crimp structure of tendon.
(A) Single SBF-SEM images of transverse sections at E15.5, newborn and 6 week old mouse-tail tendon. Fibril bundles are ringed in colour. At 6 weeks the centre of the bundle is marked with a red circle. Centre of bundle points were used to track the bundles in B and C (6 weeks, right hand panels). (B) Longitudinal views of bundle reconstructions. Colours correspond to bundles circled in A. The crimp is apparent at E15.5, but it is not in register between different bundles. By birth the crimp is in register, all bundles have the same wavelength, in a helix throughout the tendon. This morphology is also present in 6 week tendon. (C) Oblique views of bundle reconstructions demonstrate that the crimp structure is a regular helix. A bird's-eye view of a fibril bundle reconstruction is shown for 6 weeks, demonstrating a spiral structure. Reconstructed bundles are tracked at E15.5 and newborn using the outline of the bundle. At 6 weeks the large size of the bundle made appreciation of the crimp structure difficult. Therefore the centre of the bundle was used as the marker point for reconstruction (marked in A, right hand panel).
-
Figure 7—source data 1
Crimp structure data.
- https://doi.org/10.7554/eLife.05958.017
Figure 7—figure supplement 1
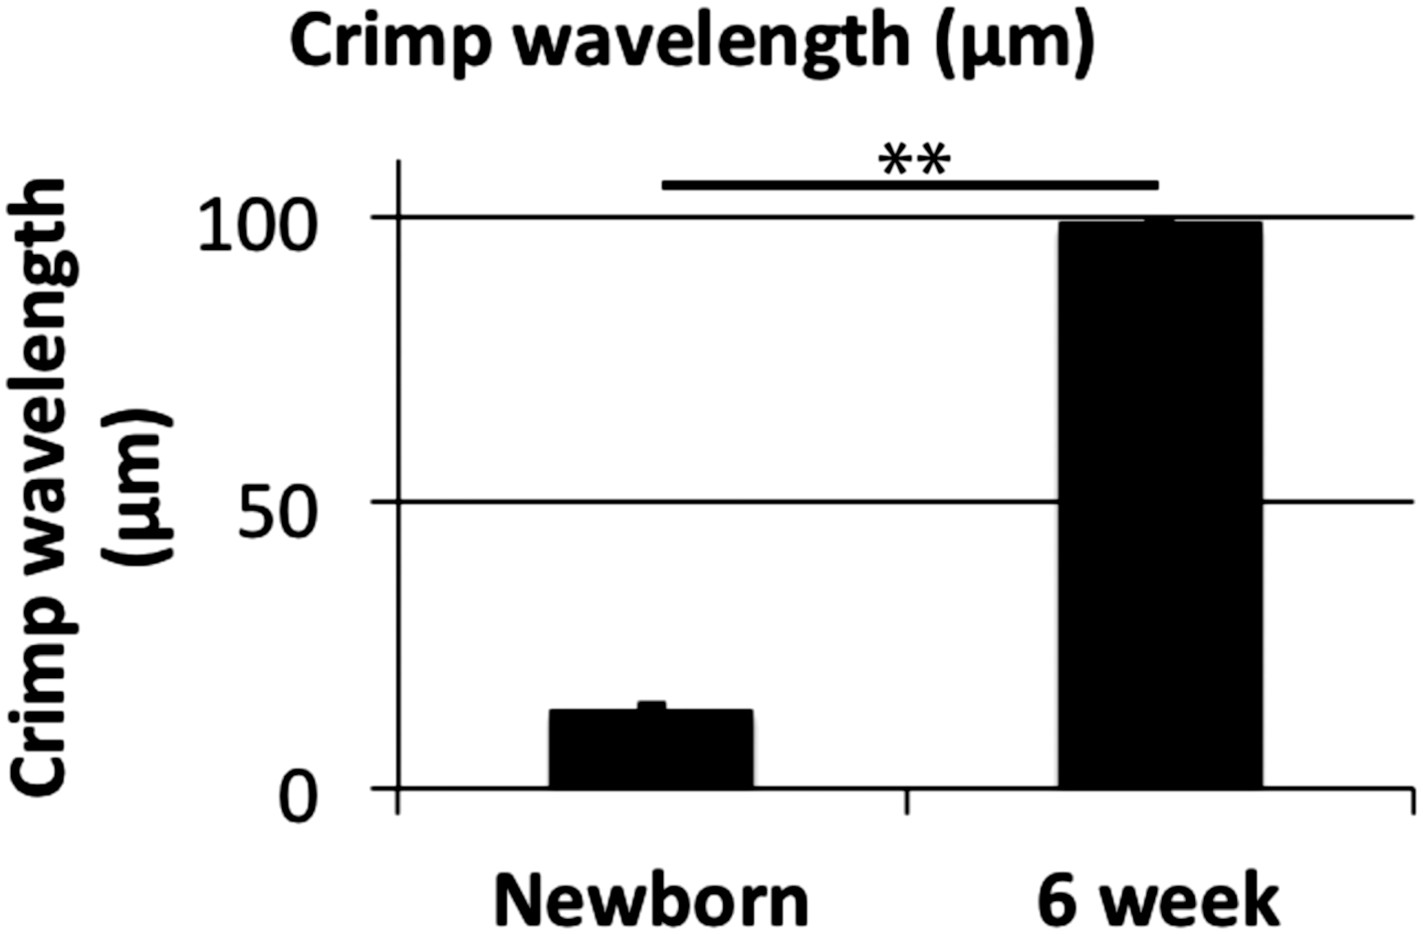
Crimp wavelength.
Crimp wavelength increases significantly from 14 µm at newborn to almost 100 µm at 6 weeks. ** Indicates significant difference (p = <0.05). Source data in Figure 7—source data 1.
Figure 7—figure supplement 2
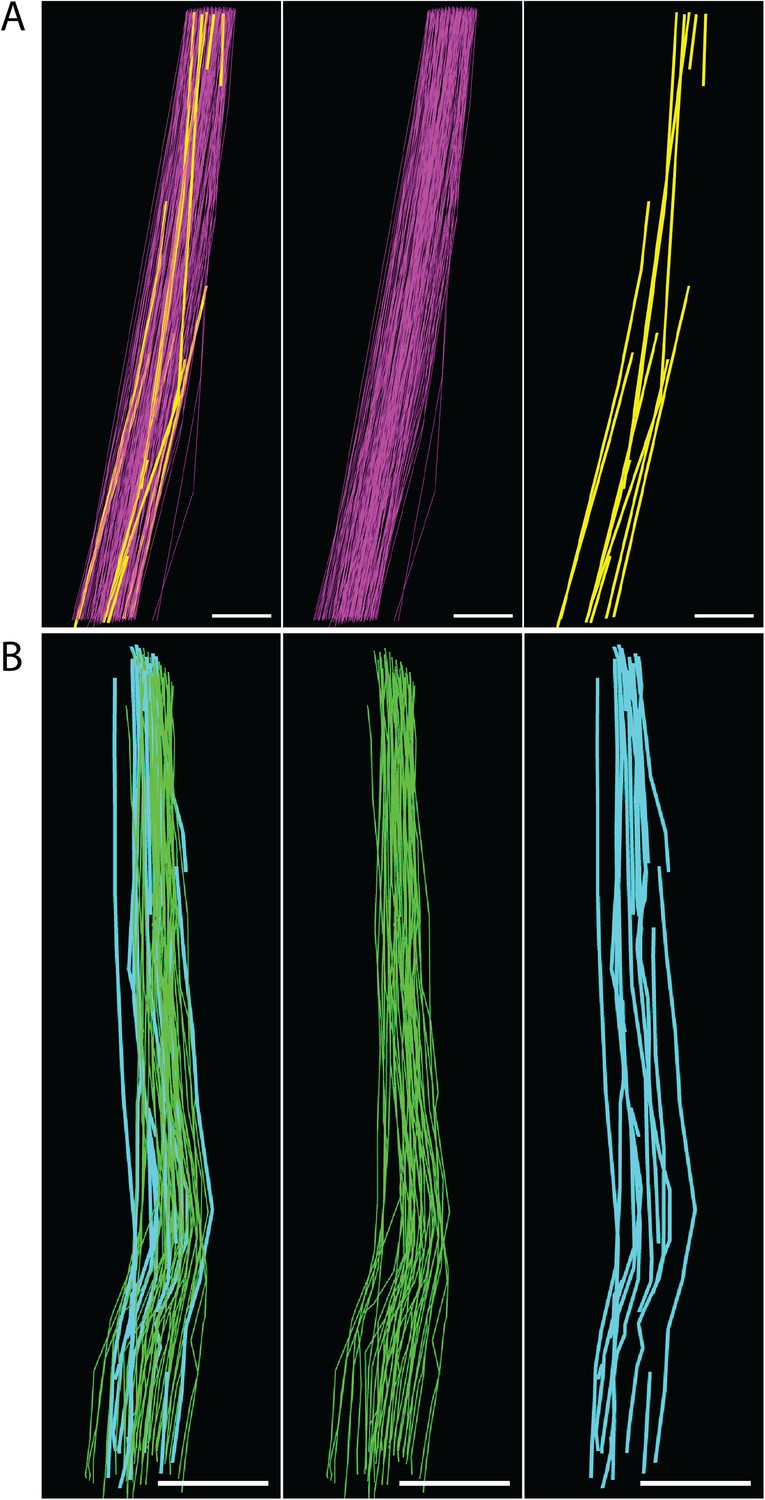
Fibril length calculations.
(A) E15.5 fibrils tracked through a z-depth of 10 µm (100 SBF-SEM sections cut at 100 nm thickness). Fibrils traversing the complete z distance are shown in purple, fibrils with tips identified are shown in yellow. Estimated fibril length 125 ± 18 µm. Scale bar = 1 µm. (B) Newborn fibrils tracked over 20 µm (200 SBF-SEM sections). Fibrils traversing the complete z distance (green) and fibrils with a tip identified (blue) are reconstructed. Estimated fibril length 578 ± 17 µm. Scale bar = 2 µm. Source data in Figure 7—source data 1.
Figure 8
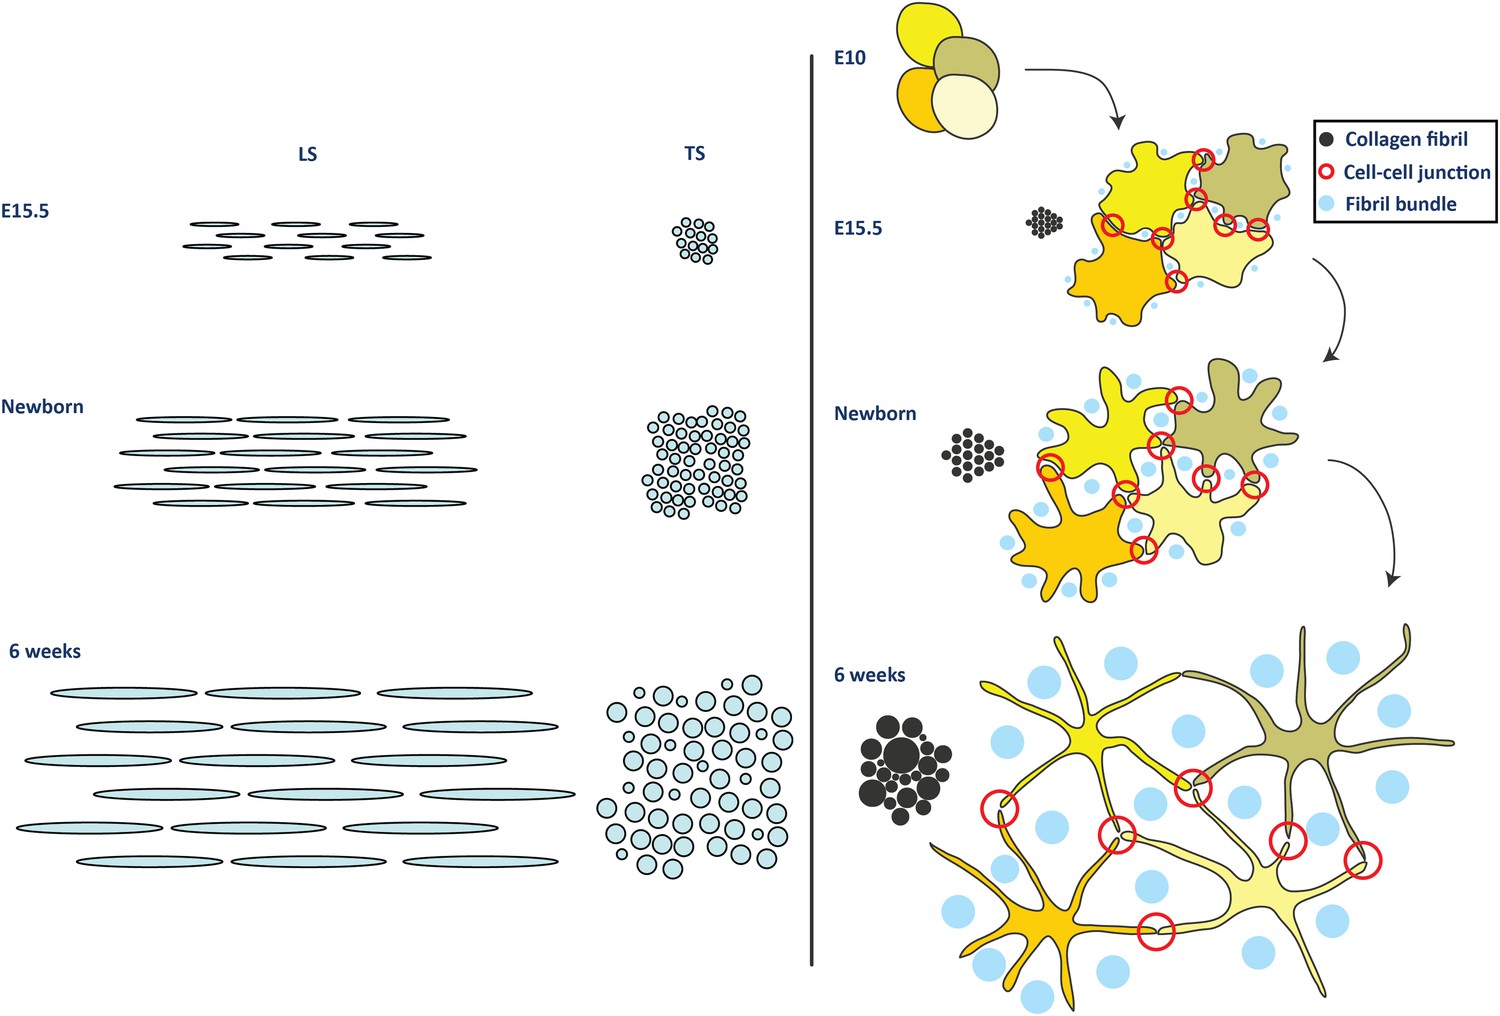
Model for development of tendon ECM.
Left side panel. Schematic diagram to represent a model of fibril nucleation and growth during tendon development. Fibrillar arrays representing bundles are shown in longitudinal and transverse section (labelled LS and TS, respectively) at the 3 time points (E15.5, newborn and 6 week). The embryonic growth stage involves fibril nucleation to increase fibril numbers along with fibril growth to increase both fibril diameter and length. The numbers of fibrils in the transverse section of the bundle is increased not only by fibril nucleation but also by axial growth of the fibrils into neighbouring regions of the bundle. The postnatal growth in stage 2 involves only fibril growth, with a major increase in fibril diameter and length, with no increase in fibril number. To maintain the observed invariant number of fibrils in the bundle transverse section, the increase in fibril length must match the local increase in tissue length. Right side panel. Schematic to represent cell and fibril growth during tendon development. Early embryonic tendon tissue (E10) is composed of rounded cells with little ECM. Collagen fibrils begin to appear in small bundles in poorly defined channels formed by cell–cell adhesions by E15.5. These channels become more developed with expansion of the ECM and are well defined in newborn tendon tissue. Postnatal expansion of the ECM results in large fibril bundles in these channels that were established during embryonic development.
Tables
Table 1
Summary of data
| Stage | Mean fibril diameter (nm) | Mean fibril area (nm2) | Mean number of fibrils per bundle | Mean fibril length (µm) | FAF (%) | Crimp length (µm) | Crimp helix radius (µm) | Tail length (mm) |
|---|---|---|---|---|---|---|---|---|
| E15.5 | 35.4 ± 0.2 | 1006.5 ± 13.8 | 156 ± 11 | 125 ± 18 | 1.4 ± 0.3 | – | – | 6.1 ± 0.30 |
| Newborn | 46.5 ± 1.1 | 2137.9 ± 370.9 | 659 ± 23 | 578 ± 17 | 17.6 ± 1.3 | 14.0 ± 0.3 | 1.6 ± 0.1 | 10.9 ± 0.9 |
| 6W | 160.1 ± 3.4 | 24,606.8 ± 933.0 | 684 ± 22 | 1250* ± 305 | 76.4 ± 1.3 | 99.3 ± 2.5 | 2.3 ± 0.1 | 67.6 ± 0.3 |
-
*
For fibrils of diameter <150 nm.
-
Raw data are provided in Supplementary file 1.
Additional files
-
Supplementary file 1
This file contains all the source data reported in the manuscript.
- https://doi.org/10.7554/eLife.05958.021
Download links
A two-part list of links to download the article, or parts of the article, in various formats.
Downloads (link to download the article as PDF)
Open citations (links to open the citations from this article in various online reference manager services)
Cite this article (links to download the citations from this article in formats compatible with various reference manager tools)
A structure-based extracellular matrix expansion mechanism of fibrous tissue growth
eLife 4:e05958.
https://doi.org/10.7554/eLife.05958


