Inhibitory activities of short linear motifs underlie Hox interactome specificity in vivo
- Centre National de Recherche Scientifique, France
- École normale supérieure de Lyon, France
- Imperial College London, Hammersmith Hospital Campus, United Kingdom
- University of Mainz, Germany
- University Aix-Marseille, Parc Scientifique de Luminy, France
- Centre National de la Recherche Scientifique, France
Figures
Figure 1 with 2 supplements
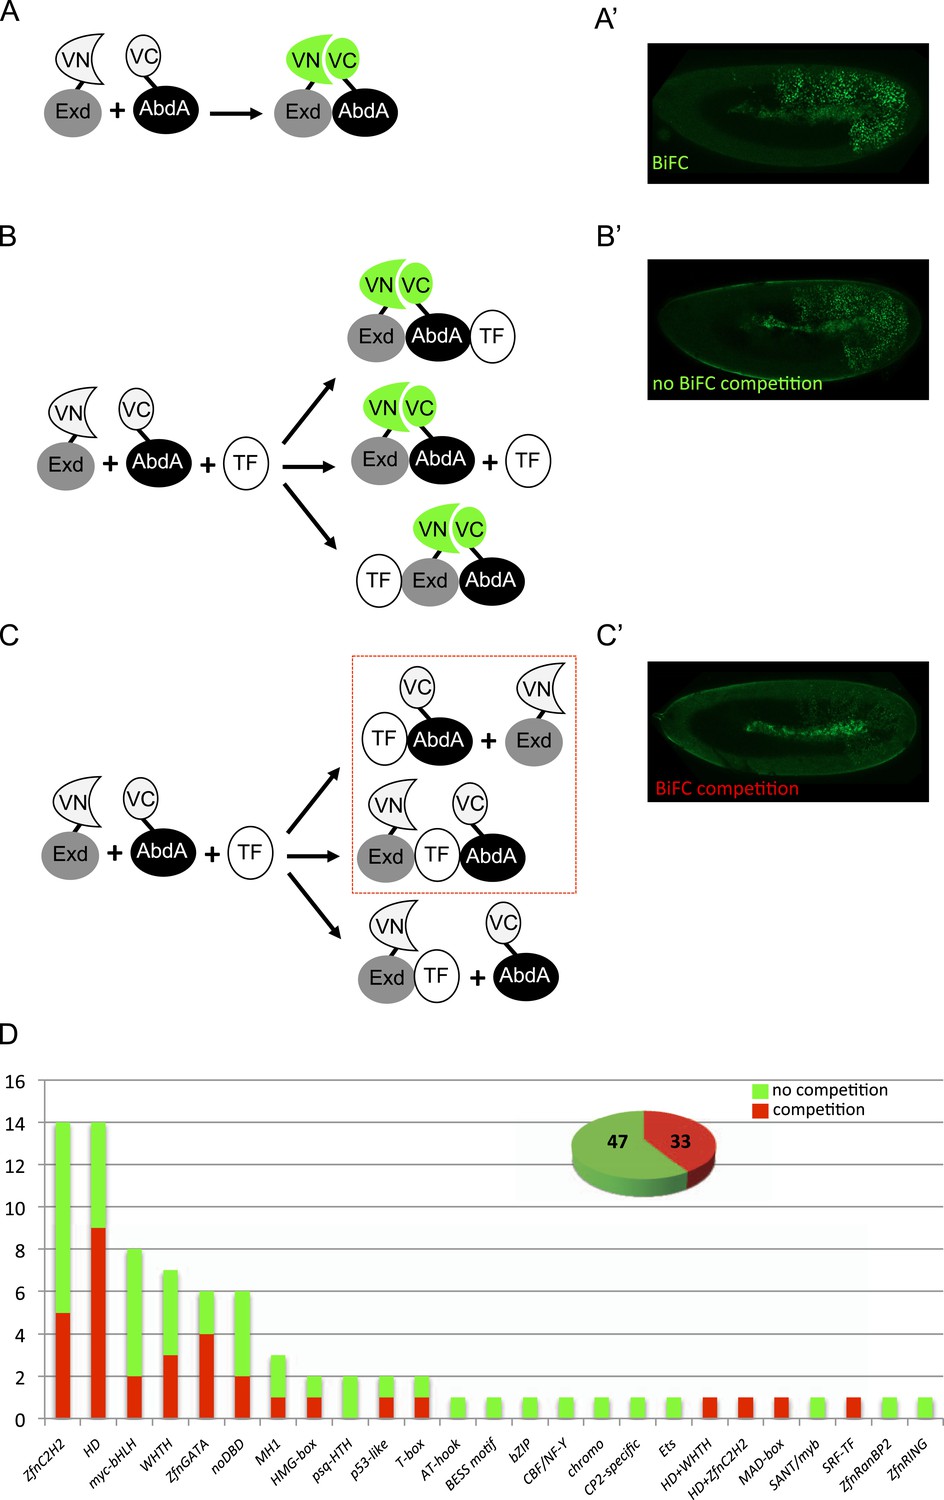
A BiFC competition screen identifies candidate transcription factors (TFs) as potential binding partners of the Hox protein AbdominalA (AbdA).
(A–C) Principle of the competition test. (A–A′) Co-expression of Extradenticle (Exd) and AbdA proteins fused to the N-(VN) or C-(VC) terminal fragment of the Venus fluorescent protein leads to BiFC in the embryo. (B–B′) Cases where no BiFC competition could be observed with a cold TF. B′ is an illustrative picture of non-competitive BiFC resulting from the simultaneous co-expression of the red fluorescent protein RFP (see also Figure 1—figure supplement 2). (C–C′) Cases where BiFC competition could be observed with a cold TF. C′ is an illustrative picture of competitive BiFC resulting from the simultaneous co-expression of a nuclear-localized form of Exd (see also Figure 1—figure supplement 1). Note that AbdA-interacting partners do not obligatory lead to competitive BiFC. TFs that could be validated in the secondary step as AbdA-binding partners (see Figure 2) are indicated (dotted-red box). (D) Graph showing the repartition of competitive (red bars) and non-competitive (green bars) TFs with regard to their DNA-binding domain. See also Supplementary file 1.
Figure 1—figure supplement 1
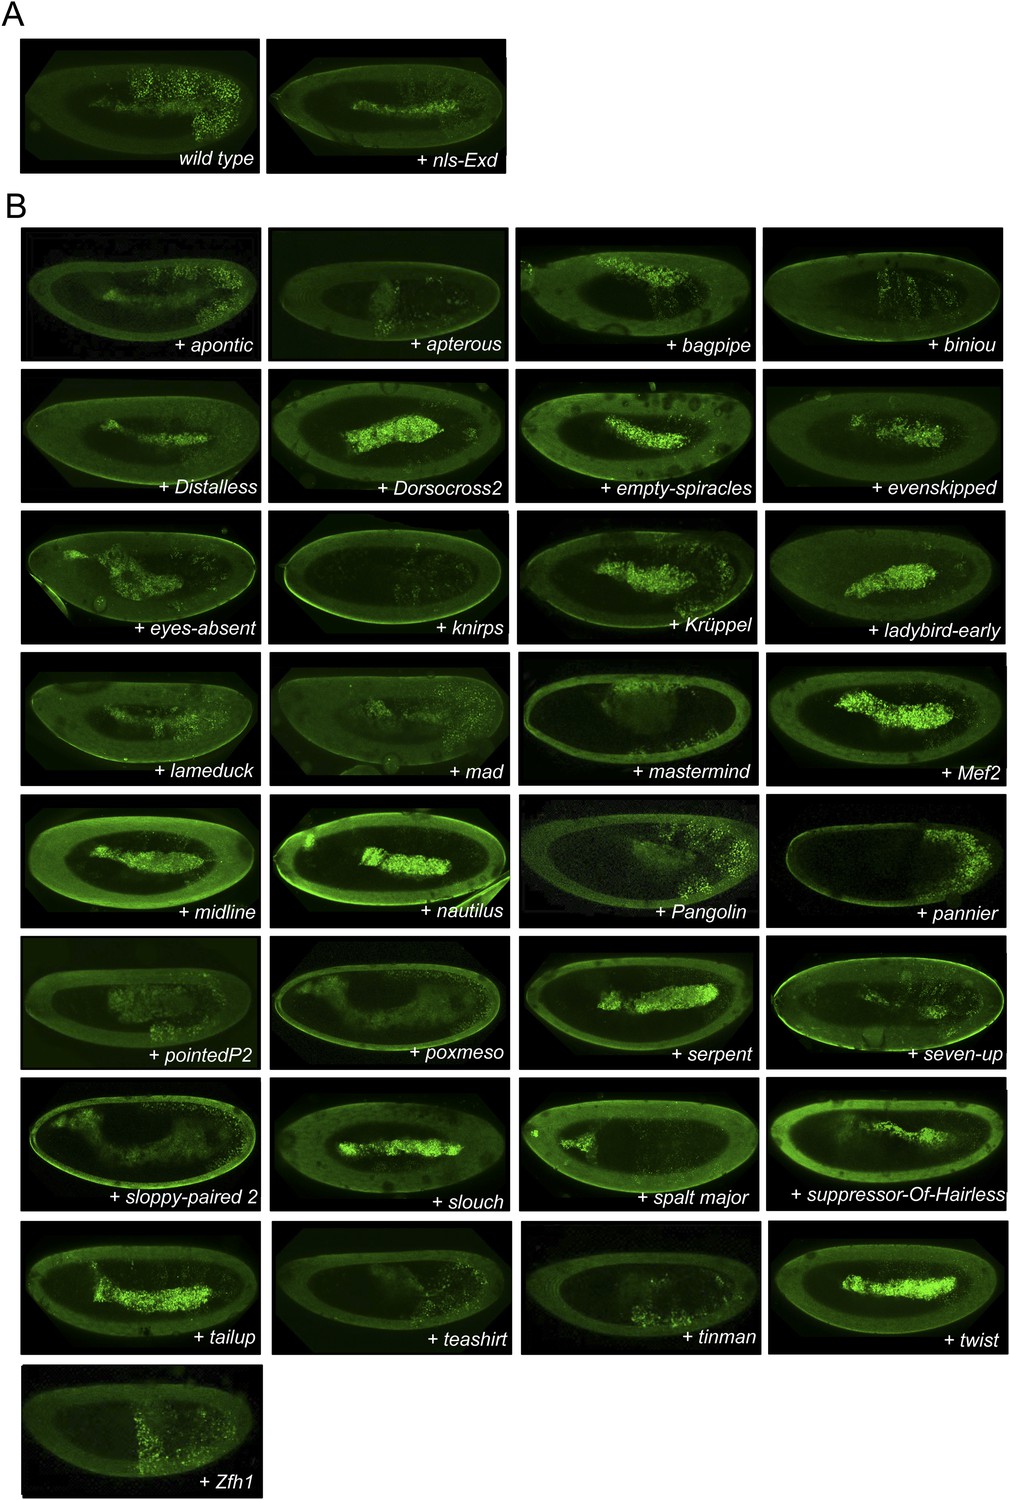
Illustrative pictures of competitive TFs.
(A) Competitive control with the UAS-nls-Exd construct. (B) Competitive TFs. Each construct was co-expressed with AbdA and Exd fusion proteins and BiFC was analysed in the epidermis of stage 10–12 of live embryos. The competition was deduced when altered BiFC signals could be observed in the expected or nearly expected proportion of the embryo progeny (see ‘Materials and methods’).
Figure 1—figure supplement 2
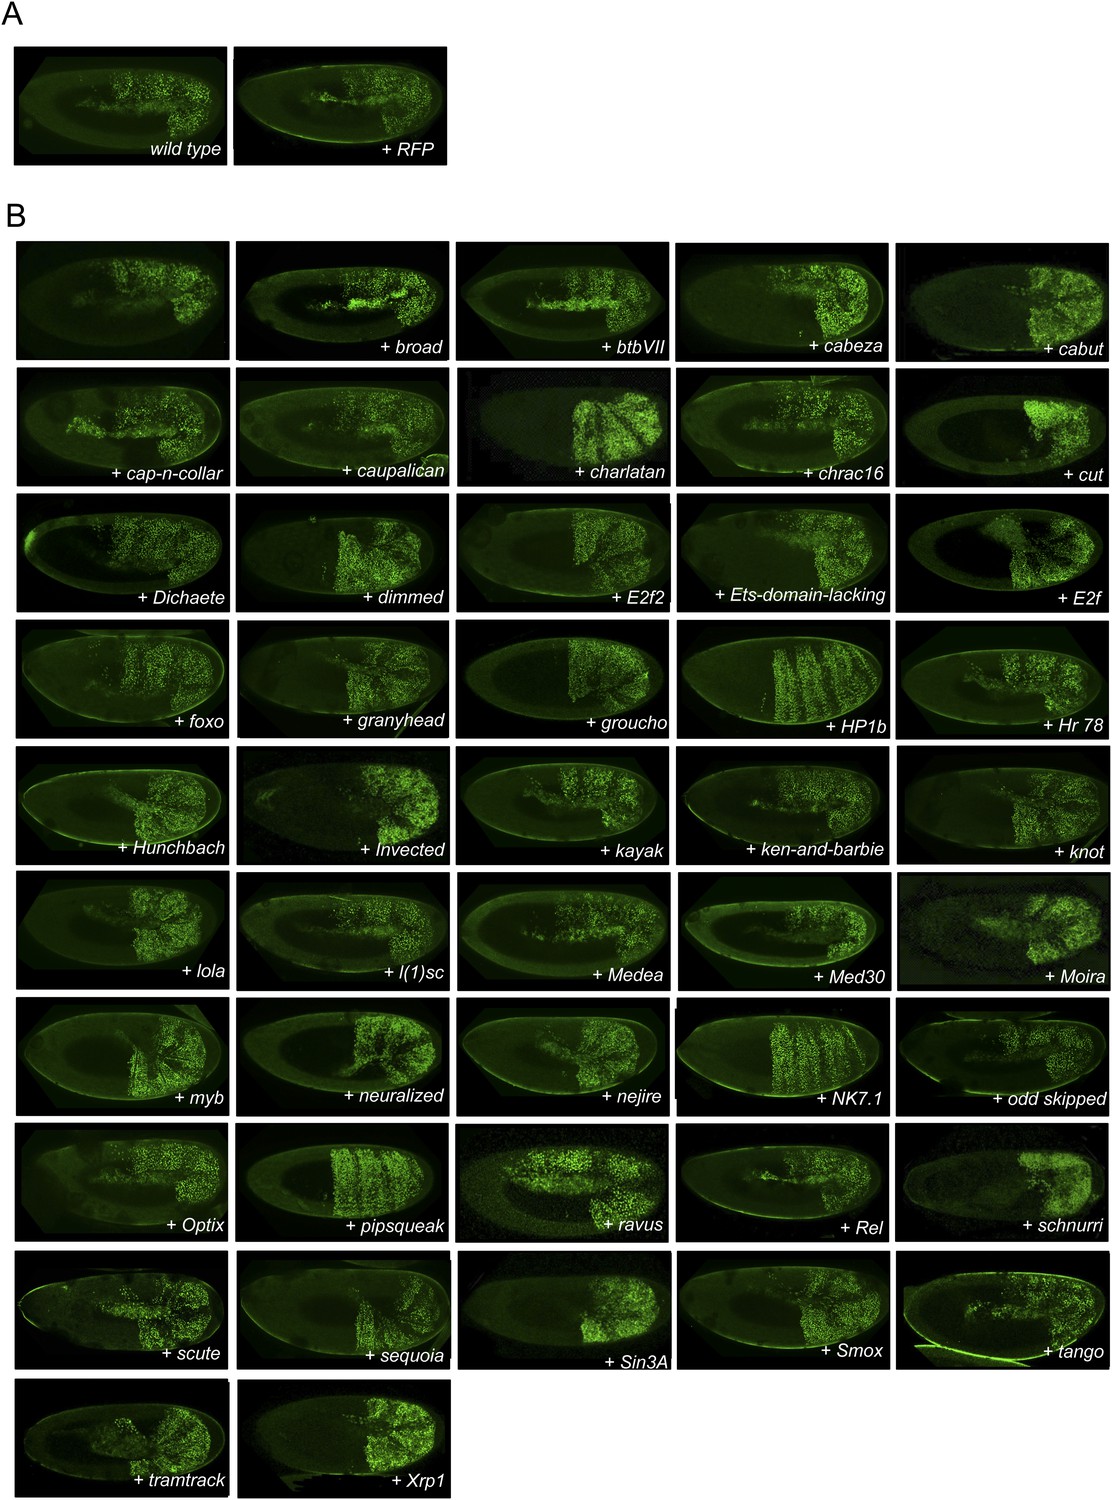
Illustrative pictures of non-competitive TFs.
(A) Non-competitive control with the UAS-RFP construct. (B) Non-competitive TFs. Each construct was co-expressed with AbdA and Exd fusion proteins and BiFC was analysed in the epidermis of stage 10–12 of live embryos. Absence of competition was deduced when no clear altered BiFC signals could be observed in the embryo progeny (see ‘Materials and methods’).
Figure 2 with 2 supplements

BiFC validates the AbdA-interaction status of competitive TFs.
(A) Principle of the BiFC screen between AbdA and the 35 selected TFs. (B) Repartition of the 35 selected TFs with regard to their DNA-binding domain. (C) Illustrative pictures of BiFC signals obtained between VC-AbdA and the indicated VN-TF in the epidermis of stage 10–12 of live embryos. Fusion constructs are expressed with the abdA-Gal4 driver. Note that typical nuclear interaction profiles are observed between AbdA and different TFs (white-dotted boxes). See also ‘Materials and methods’, Supplementary files 2, 3 and Figure 2—figure supplements 1, 2.
Figure 2—figure supplement 1
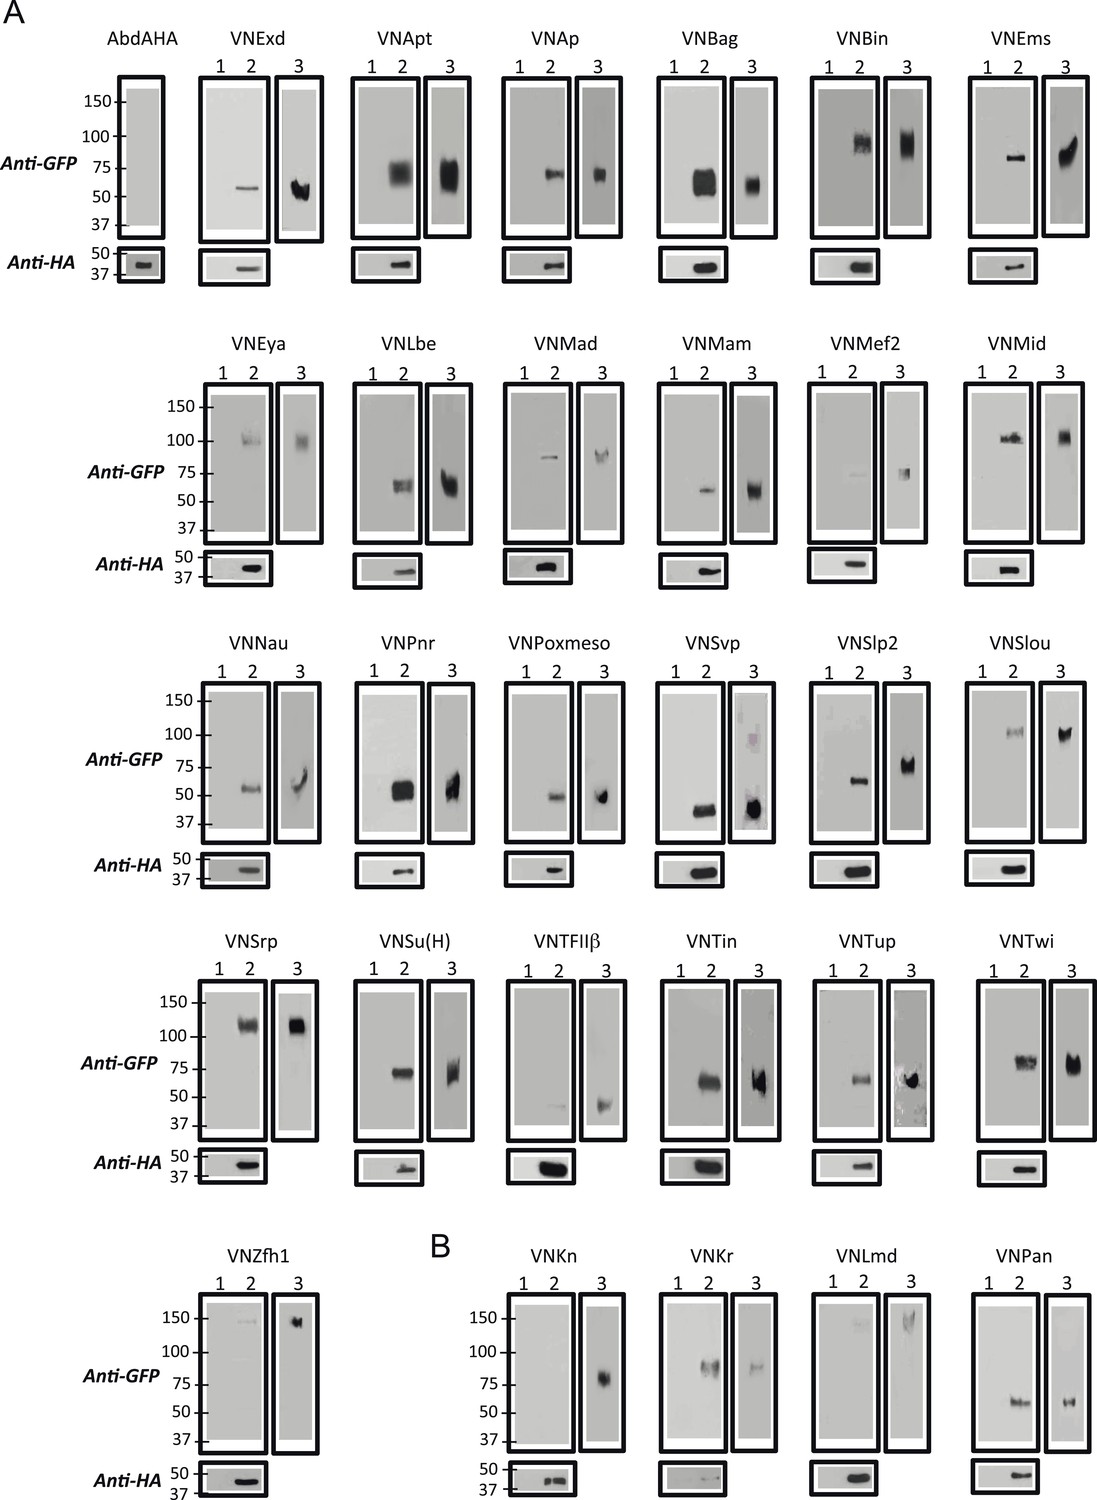
Co-immunoprecipitation (co-ip) between AbdA and TFs selected from the set used for BiFC in the Drosophila embryo.
(A) Positive co-ip experiments. (B) Negative co-ip experiments. Co-ips were performed with an anti-HA antibody recognising the AbdA-HA variant. Presence of the TF was revealed with a polyclonal anti-GFP antibody recognising the VN fragment fused to each TF. The ip was performed with the fusion TF expressed alone (lane 1) or together with AbdA (lane 2). Lane 3 corresponds to the input of cells expressing both proteins (20% of the total lysate) before the ip. Gels on the bottom are western blots validating the efficiency of the ip with the anti-HA antibody. First gel corresponds to a control validating that the anti-GFP does not recognize AbdA-HA.
Figure 2—figure supplement 2
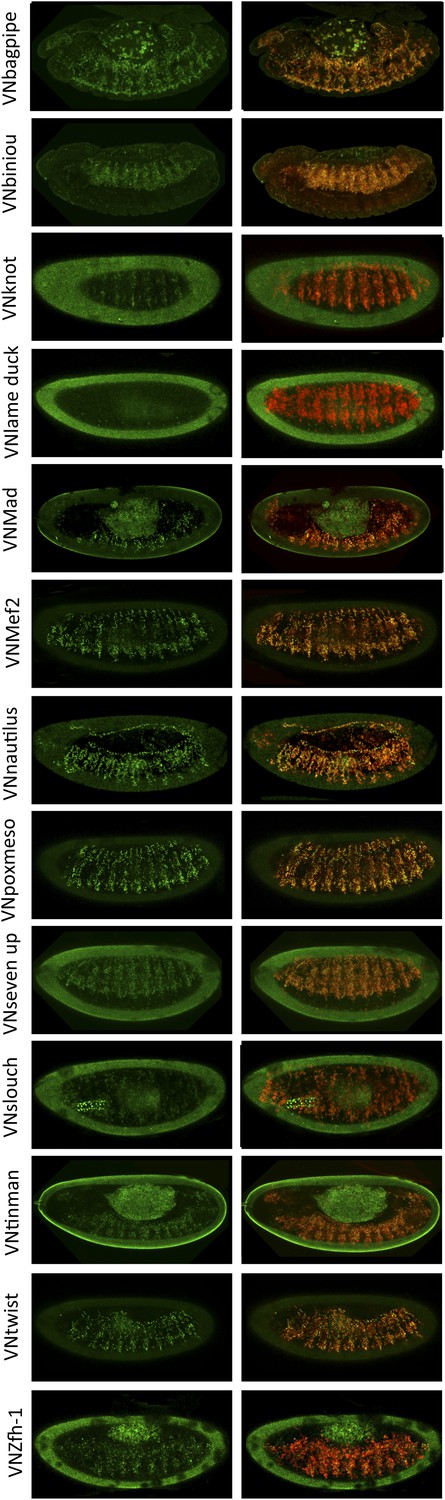
BiFC between mesodermal TFs and AbdA in the mesoderm.
Fusion proteins were expressed with the 24B-Gal4 driver recombined to UAS-mCherry (red), which allows following the expression profile in the mesoderm. BiFC (green) was observed in stages 12–14 of live embryos. Note that weak BiFC signals could be observed with VN-Kn while VN-Lmd remained negative with VC-AbdA.
Figure 3 with 2 supplements
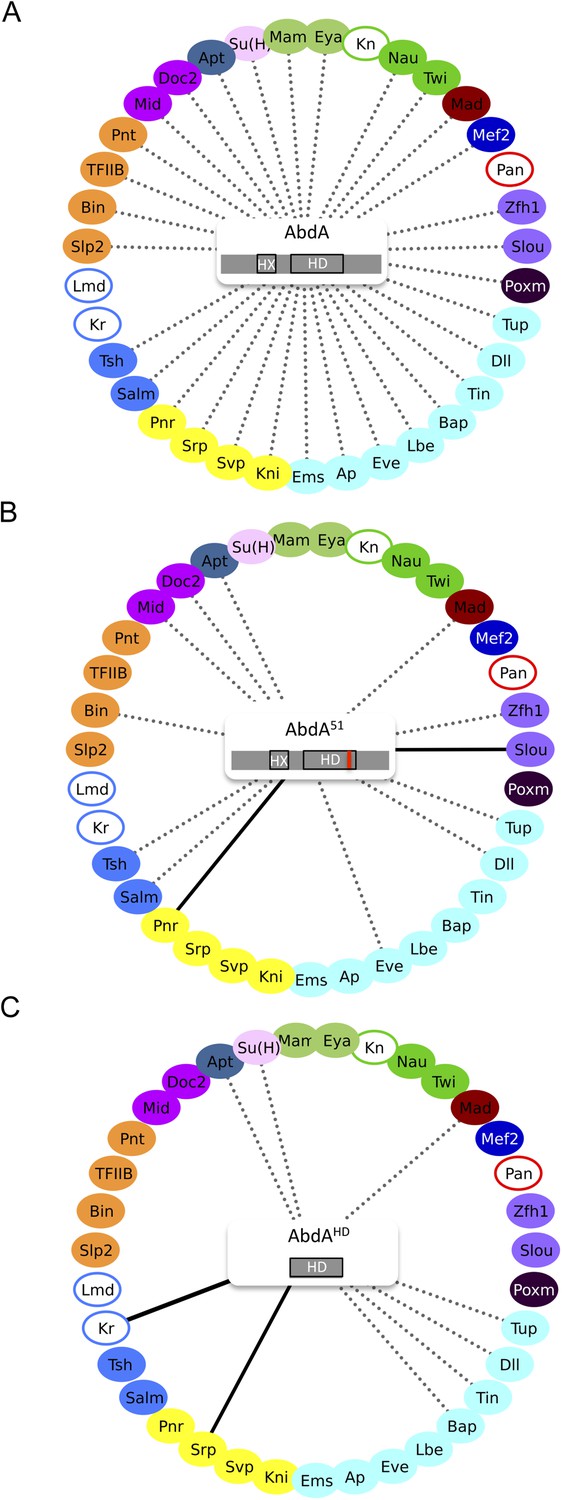
Role of the homeodomain (HD) in the AbdA interactome.
(A) Interactome with wild type AbdA. (B) Interactome with the DNA-binding deficient form of AbdA (mutated in the residue 51 of the HD, as illustrated with the red bar). See also Figure 3—figure supplement 1. (C) Interactome with the HD of AbdA. See also Figure 3—figure supplement 2. Each interactome is represented with the 35 TFs. The colour code for TFs corresponds to their type of DNA-binding domain, as shown in the Figure 2B. TFs that are not colour-filled correspond to TFs that do not interact with the wild type Hox protein. Those TFs are not connected to the Hox protein. Dotted lines indicate TFs that do interact with the wild type Hox protein. Interactions with Hox variants are depicted as the following: dotted lines indicate unaffected interactions (in between 51% and 119% of the wild type interaction); solid black lines indicate stronger (equal or superior to 120% of the wild type interaction) or novel interactions (with a non-colour-filled TF); absence of the dotted line with a colour-filled TF indicates a partial (equal or below to 50% of the wild type interaction) or complete loss of the interaction. Each Hox variant is schematized in the centre of the interactome. HD: Homeodomain. HX: Hexapeptide. See also ‘Materials and methods’.
Figure 3—figure supplement 1
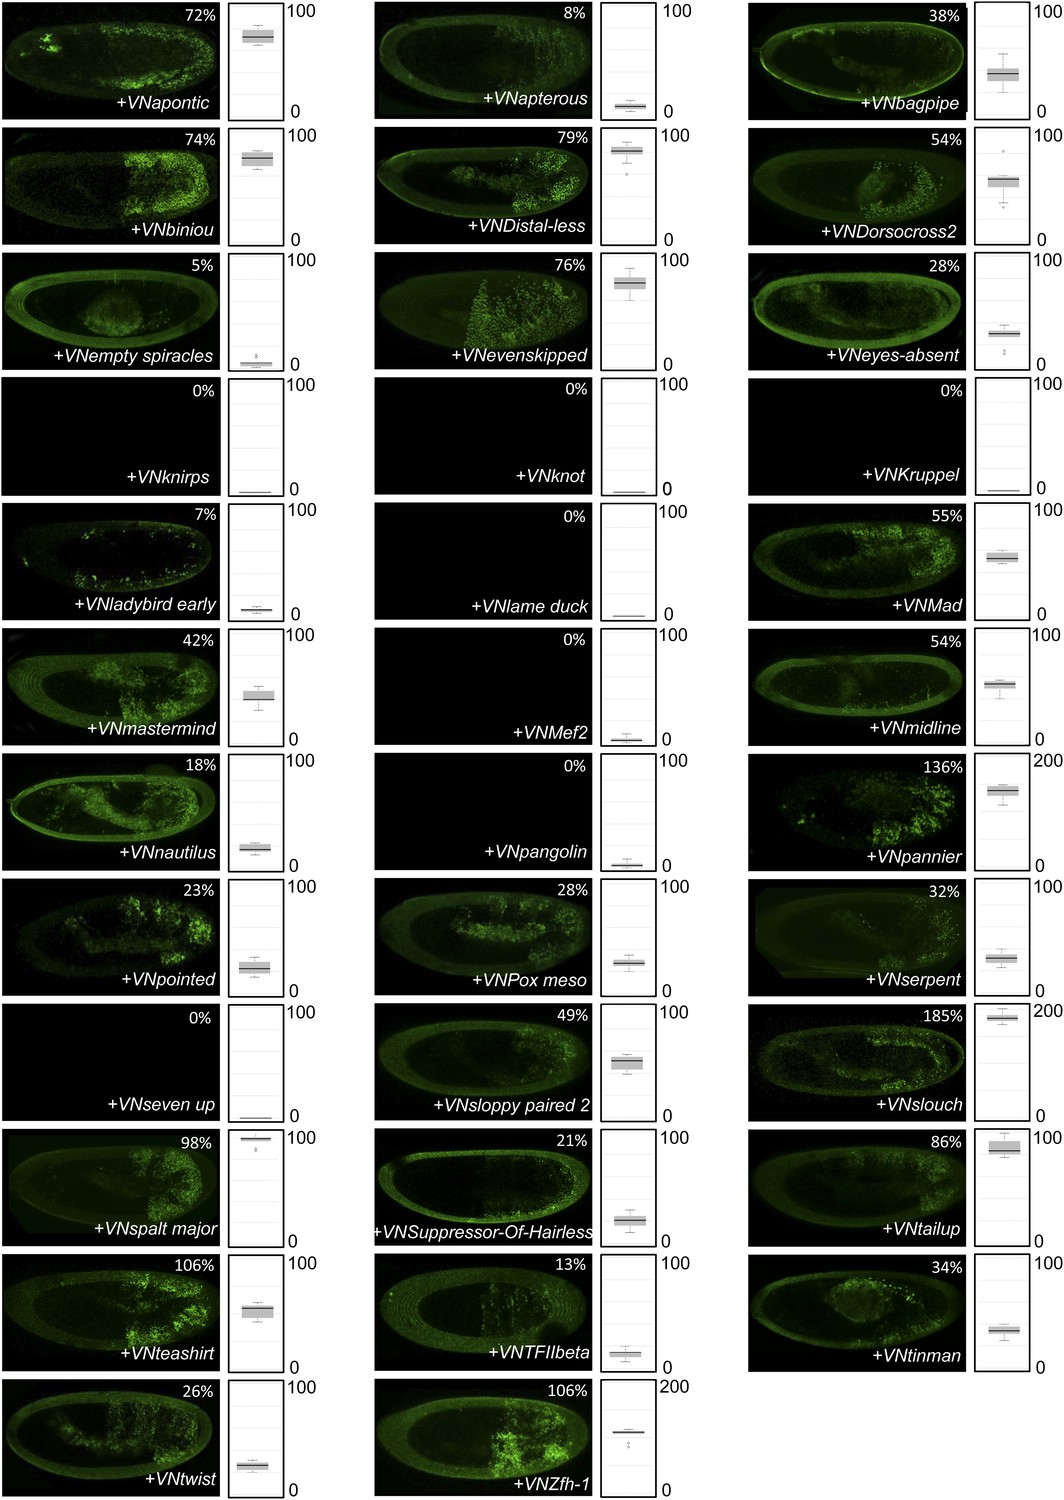
BiFC between the 35 TFs and the homeodomain (HD)-mutated form of AbdA.
Illustrative pictures are provided for each TF as indicated. Quantifications were performed in the epidermis of stage 10 embryos and are depicted on the right of each picture as a boxplot representation (see also ‘Materials and methods’). Illustrative pictures of slightly older embryos are shown when signals were strongly affected. No picture was taken in absence of BiFC.
Figure 3—figure supplement 2
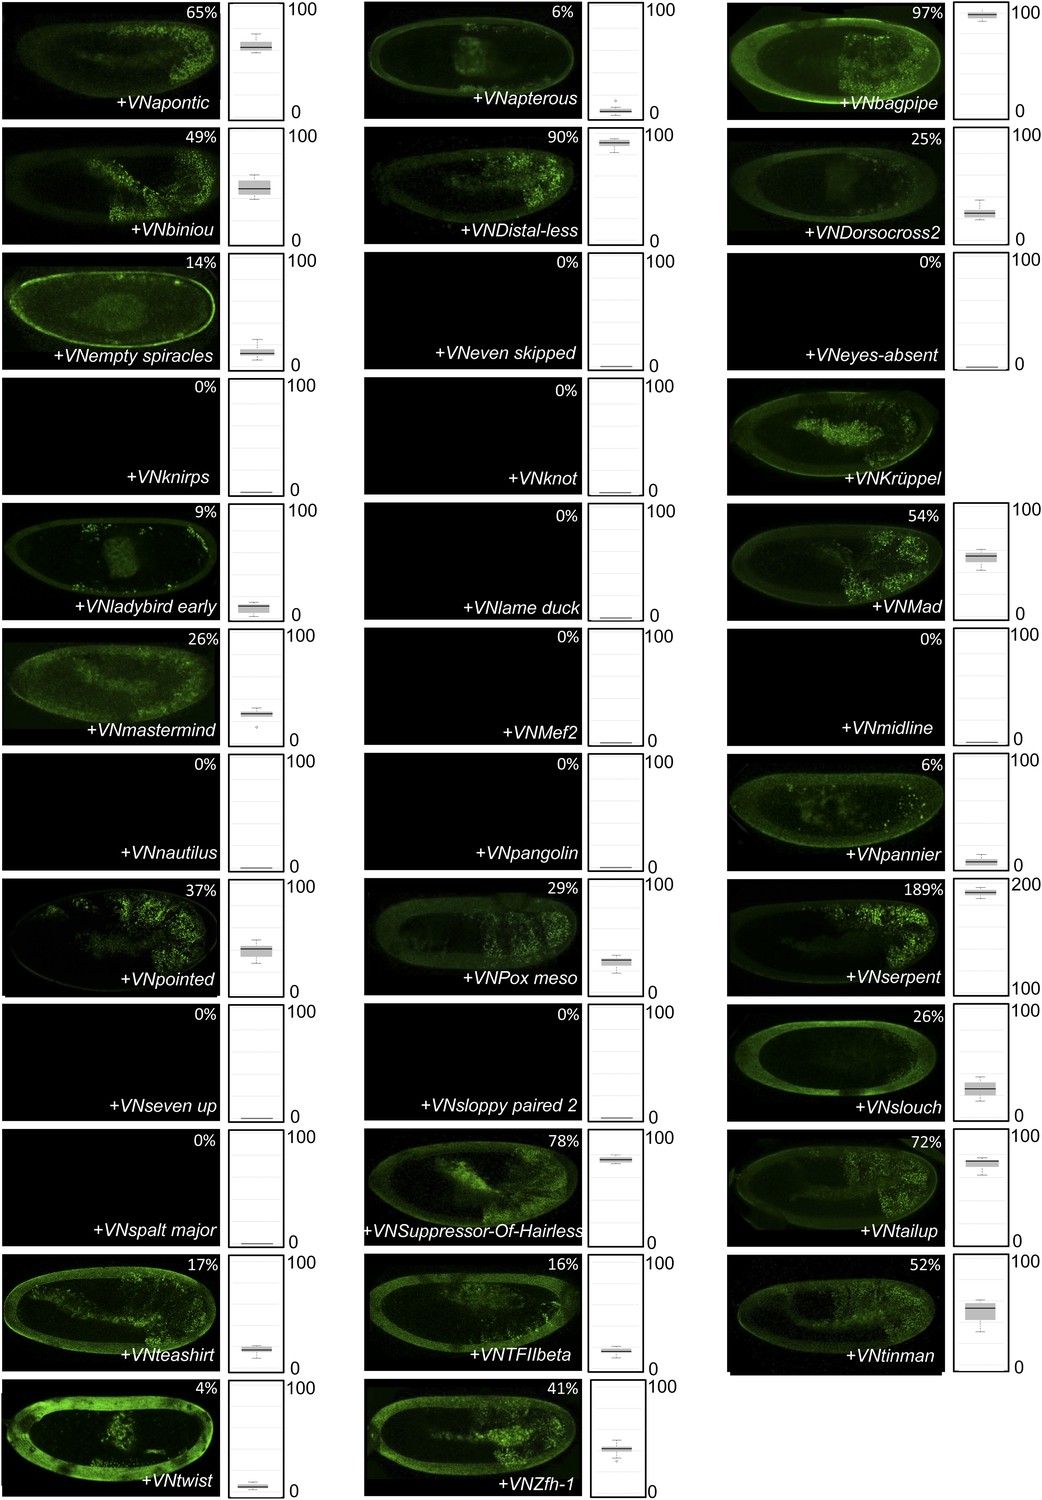
BiFC between the 35 TFs and the homeodomain (HD) of AbdA.
Illustrative pictures are provided for each TF as indicated. Quantifications were performed as in Supplementary file 5. Illustrative pictures of slightly older embryos are shown when signals were strongly affected. No statistical quantification is provided in the case of a new interaction (as seen with Krüppel). No picture was taken in absence of BiFC.
Figure 4 with 9 supplements
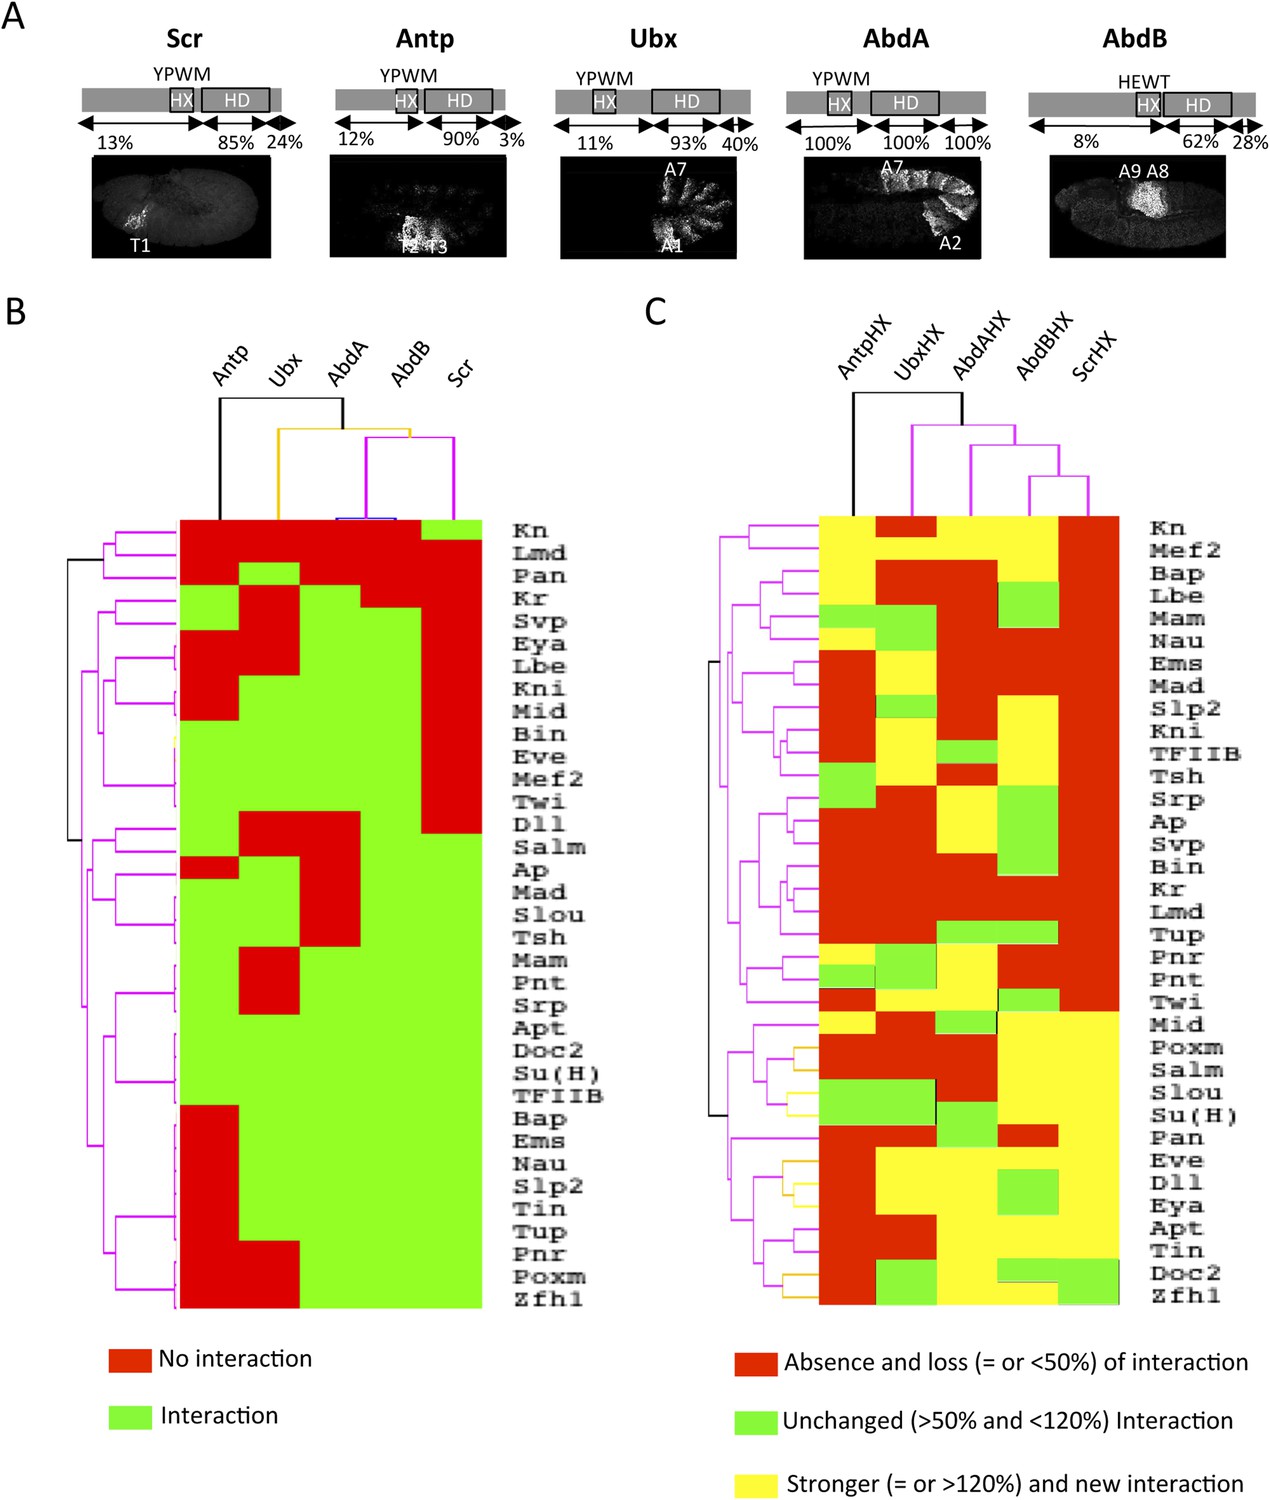
Comparison between wild type and Hexapeptide(HX)-mutated Hox interactomes.
(A) Embryonic expression profile (grey) and protein sequence identity of each of the five Drosophila Hox proteins under study. The percentage of sequence identity is given in comparison to AbdA. The conserved core sequence of the HX is also given for each Hox protein. (B) Heatmap showing the organisation of wild type Hox interactomes with the 35 TFs. See also Figure 4—figure supplements 1–4. (C) Heatmap showing the organisation of HX-mutated Hox interactomes with the 35 TFs. See also Figure 4—figure supplements 5–9. Interactions are symbolized by a colour code, as indicated. Note that the yellow colour, which corresponds to a gain of the interaction potential, appears with the HX mutation in all Hox proteins. Dendogram branches are coloured according to their bootstrap score: black 100%, grey 90–100%, blue 80–90%, green 70–80%, yellow 60–70%, orange 50–60%, pink 0.1–50%, red 0% support respectively.
Figure 4—figure supplement 1
BiFC between the 35 TFs and Sex combs reduced (Scr).
Illustrative pictures of stage 10–12 embryos are provided for each TF as indicated.
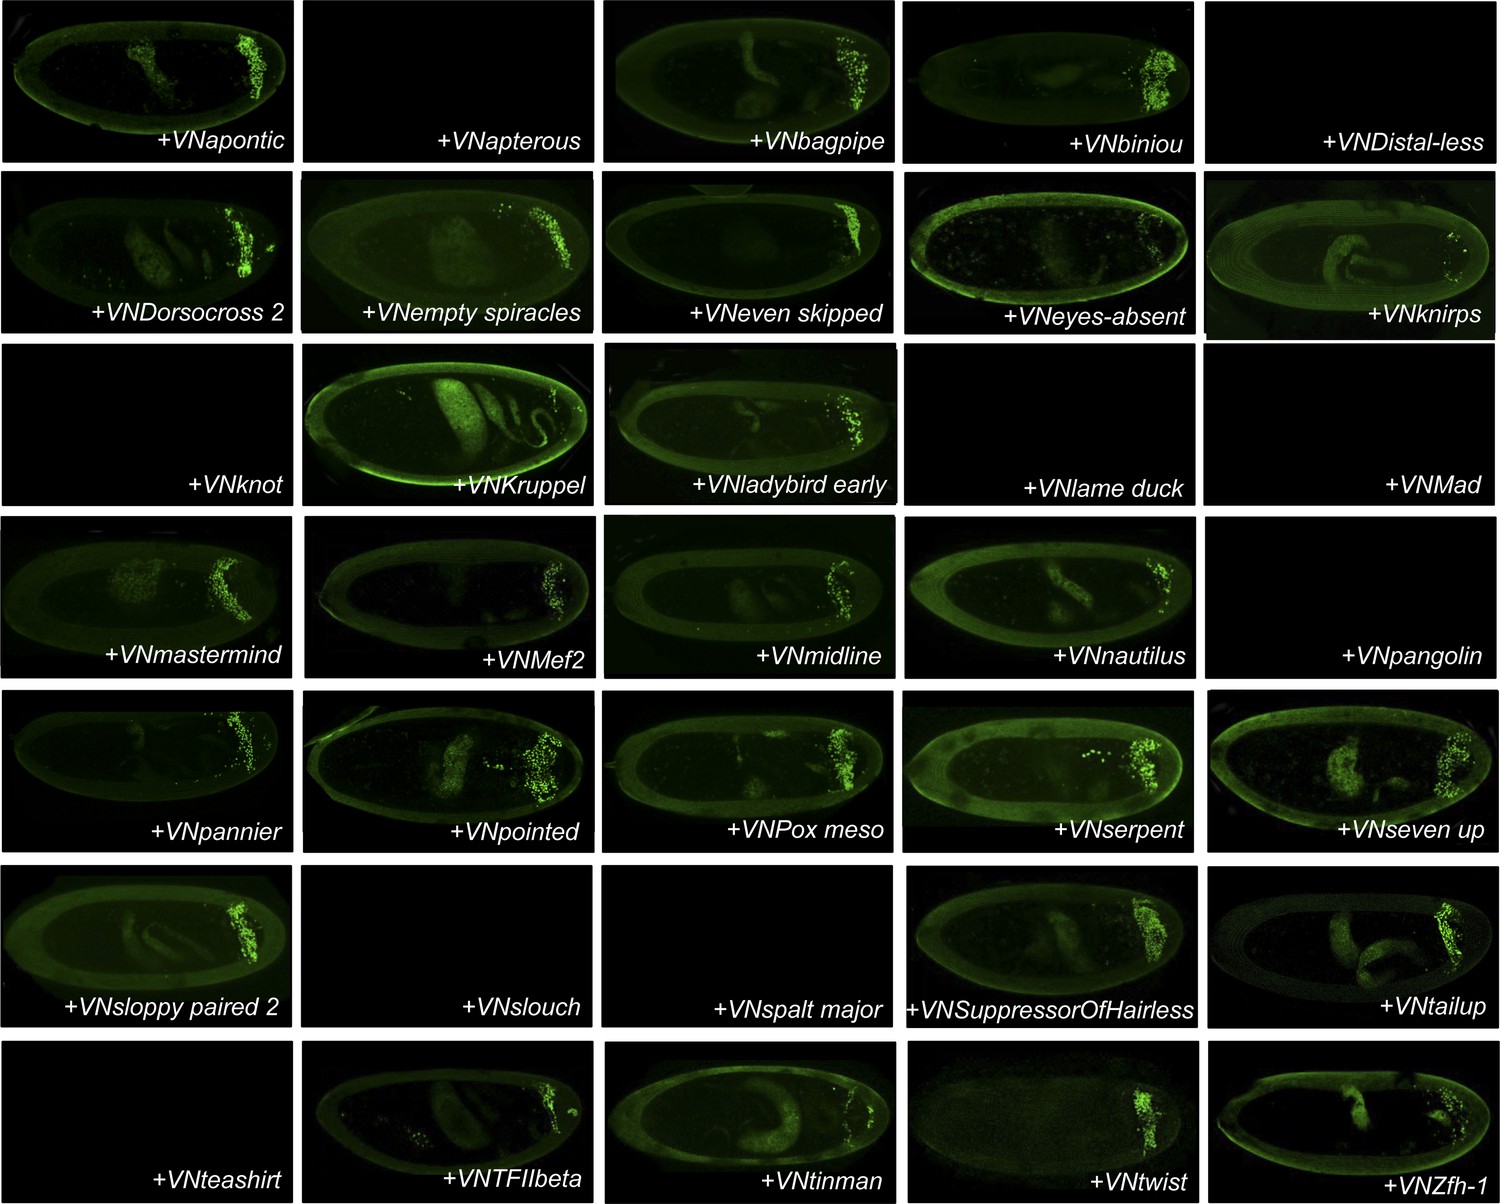
Figure 4—figure supplement 2
BiFC between the 35 TFs and Antennapedia (Antp).
Illustrative pictures of stage 10–12 embryos are provided for each TF as indicated.
Figure 4—figure supplement 3
BiFC between the 35 TFs and Ultrabithorax (Ubx).
Illustrative pictures of stage 10–12 embryos are provided for each TF as indicated.
Figure 4—figure supplement 4
BiFC between the 35 TFs and AbdominalB (AbdB).
Illustrative pictures of stage 10–12 embryos are provided for each TF as indicated.
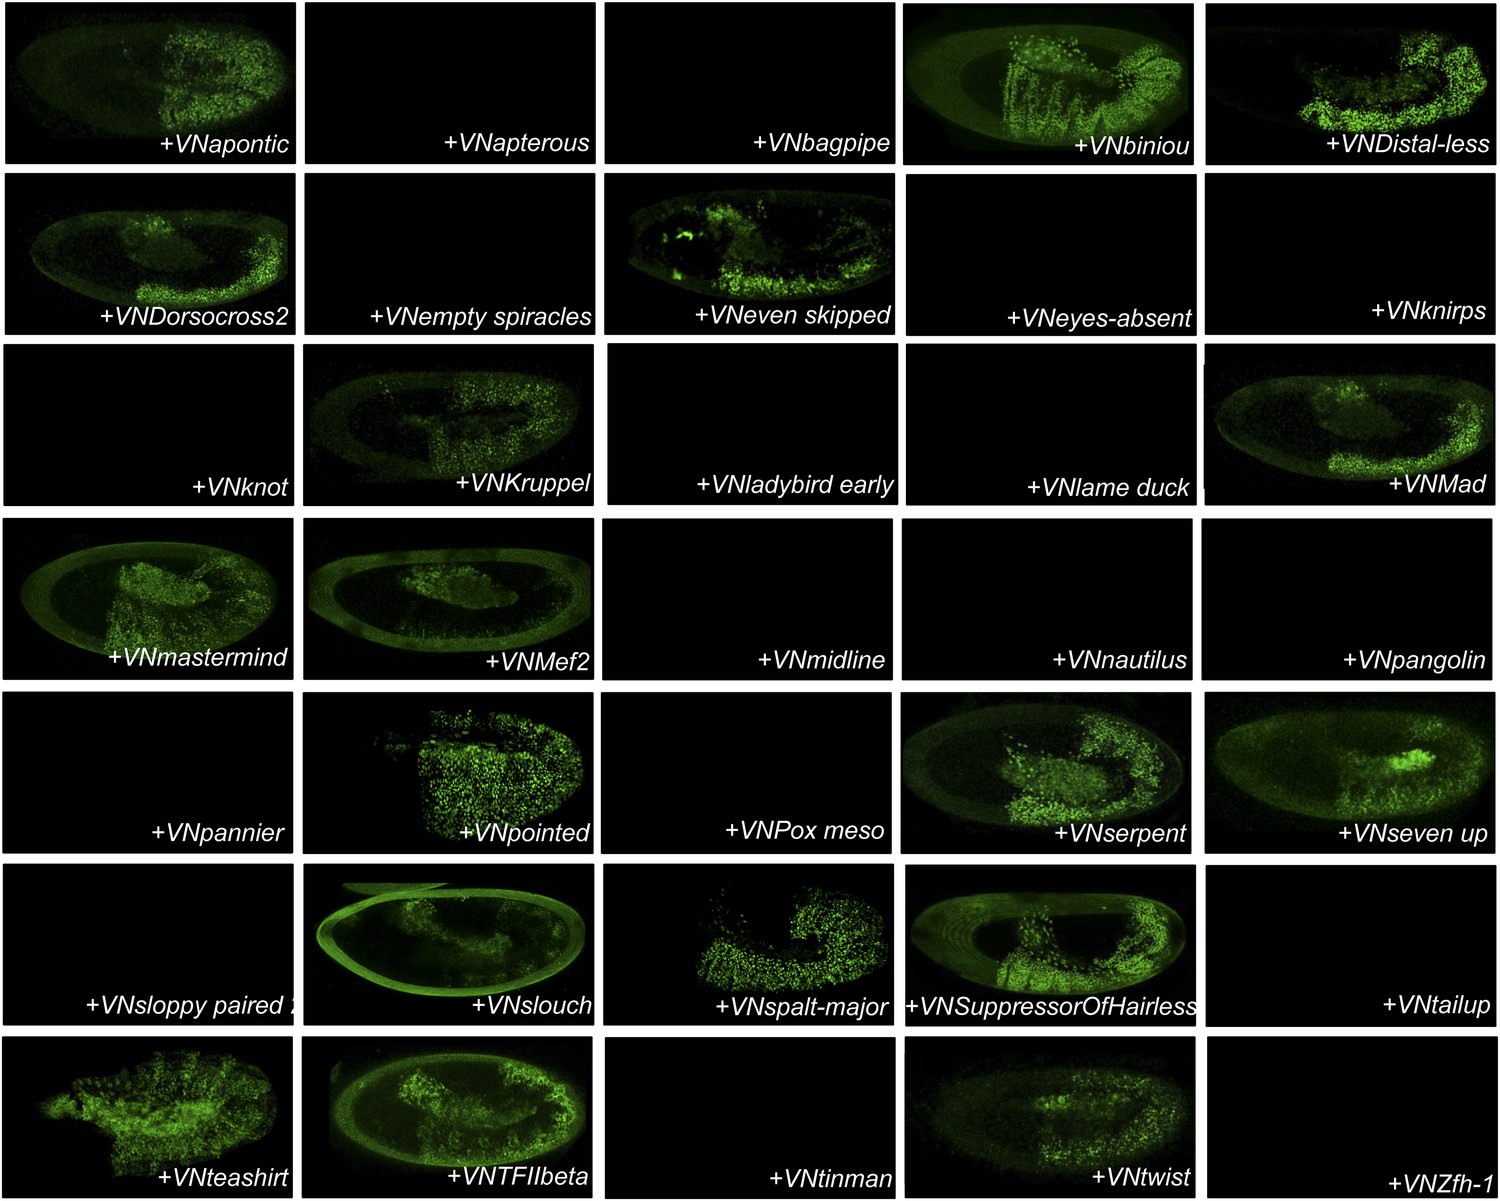
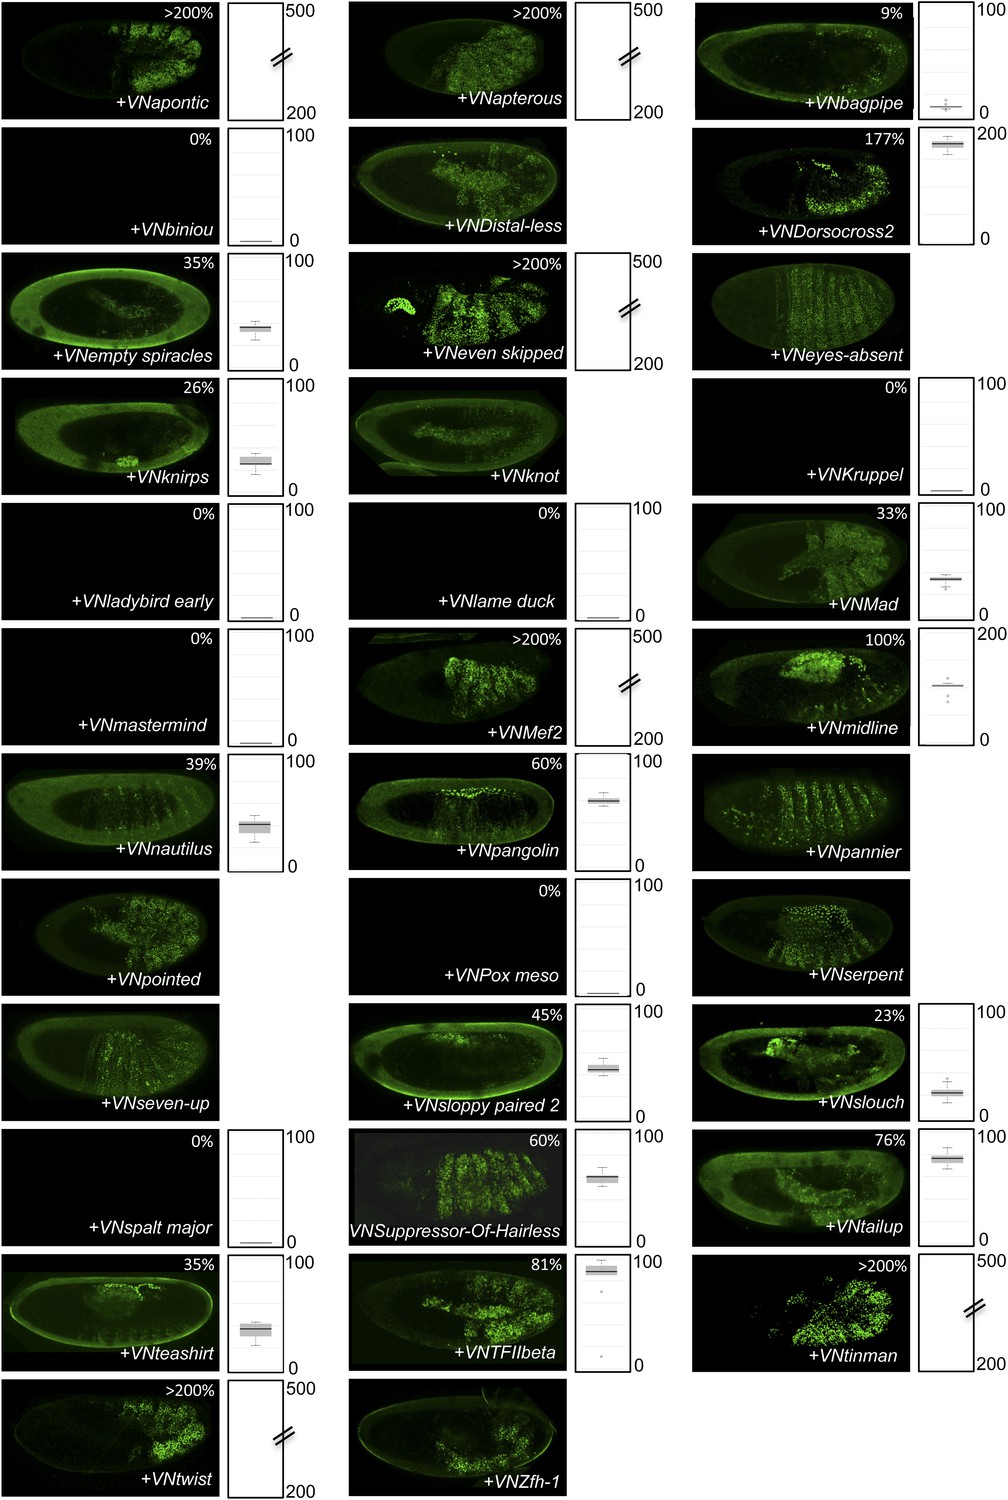
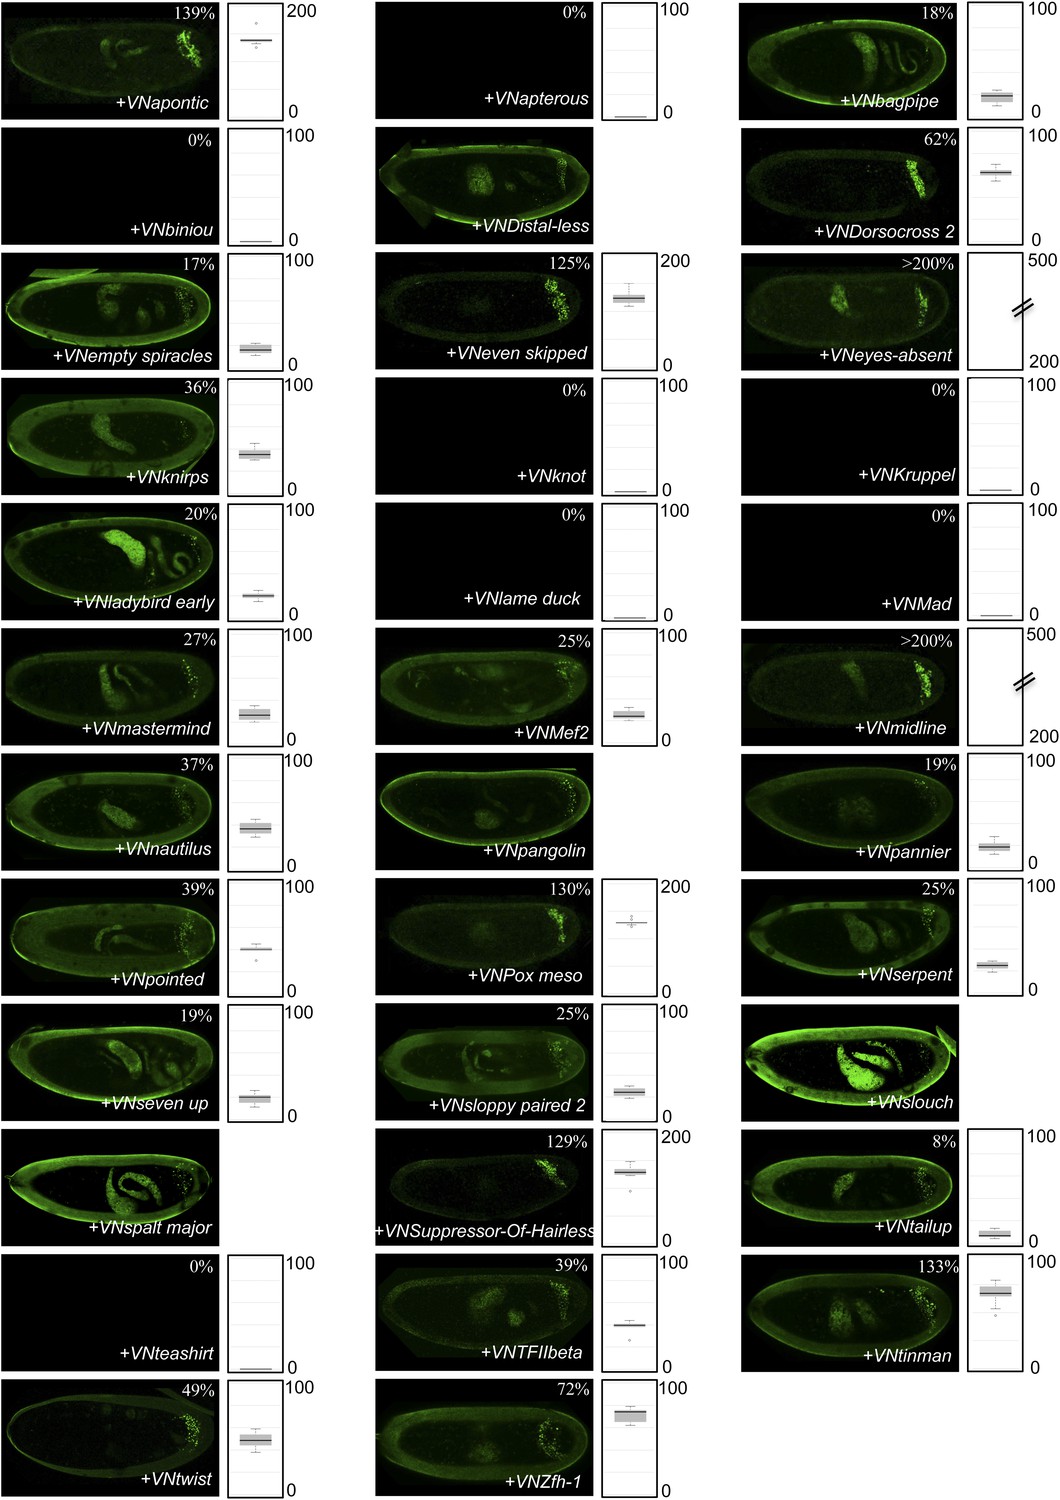
Figure 4—figure supplement 5
BiFC between the 35 TFs and hexapeptide (HX)-mutated Scr.
Illustrative pictures of stage 10–12 embryos are provided for each TF as indicated. Quantification was performed as in Figure 3—figure supplement 1. Illustrative pictures of slightly older embryos are shown when signals were strongly affected. No picture was taken in absence of BiFC. No statistical quantification is provided in the case of a new interaction (as seen for Distal-less, Even skipped, Eyes-absent, Knirps, Mef2 and Twist).
Figure 4—figure supplement 6
BiFC between the 35 TFs and hexapeptide (HX)-mutated Antp.
Illustrative pictures of stage 10–12 embryos are provided for each TF as indicated. Quantification was performed as in Figure 3—figure supplement 1. Illustrative pictures of slightly older embryos are shown when signals were strongly affected. No picture was taken in absence of BiFC. No statistical quantification is provided in the case of a new interaction (as seen for Bagpipe, Knot, Ladybird early, Midline, Nautilus and Pannier).
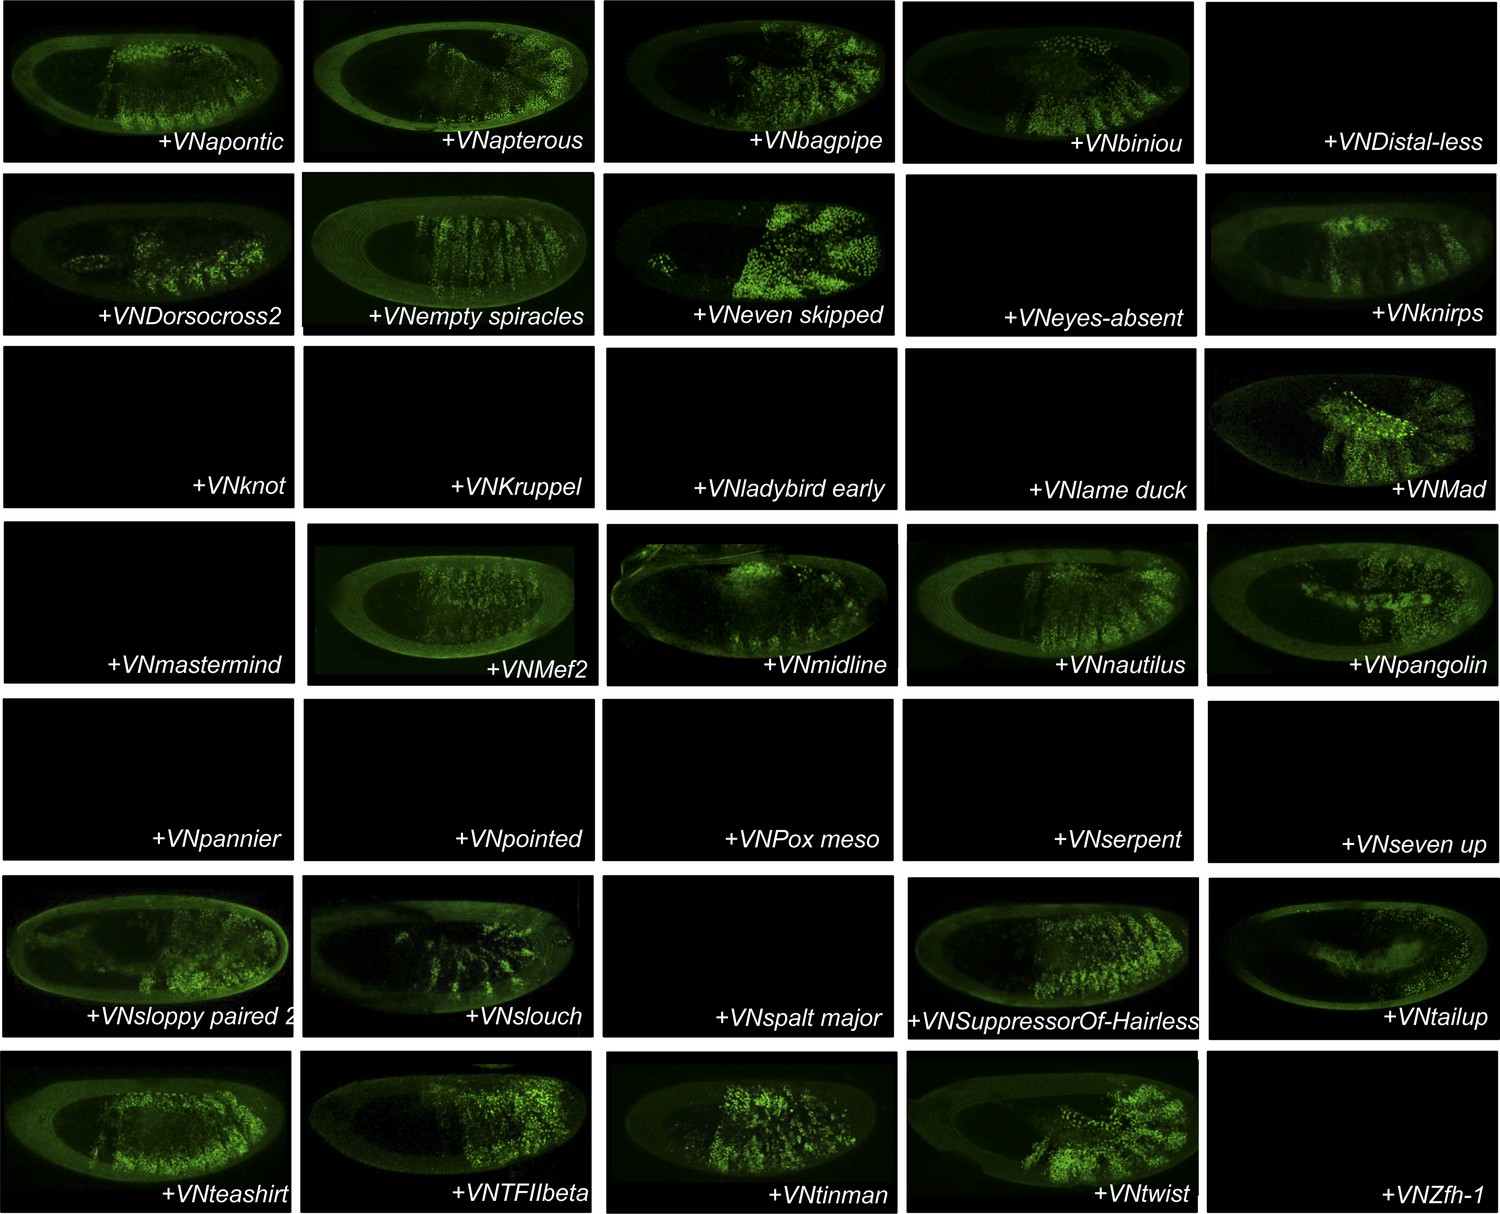
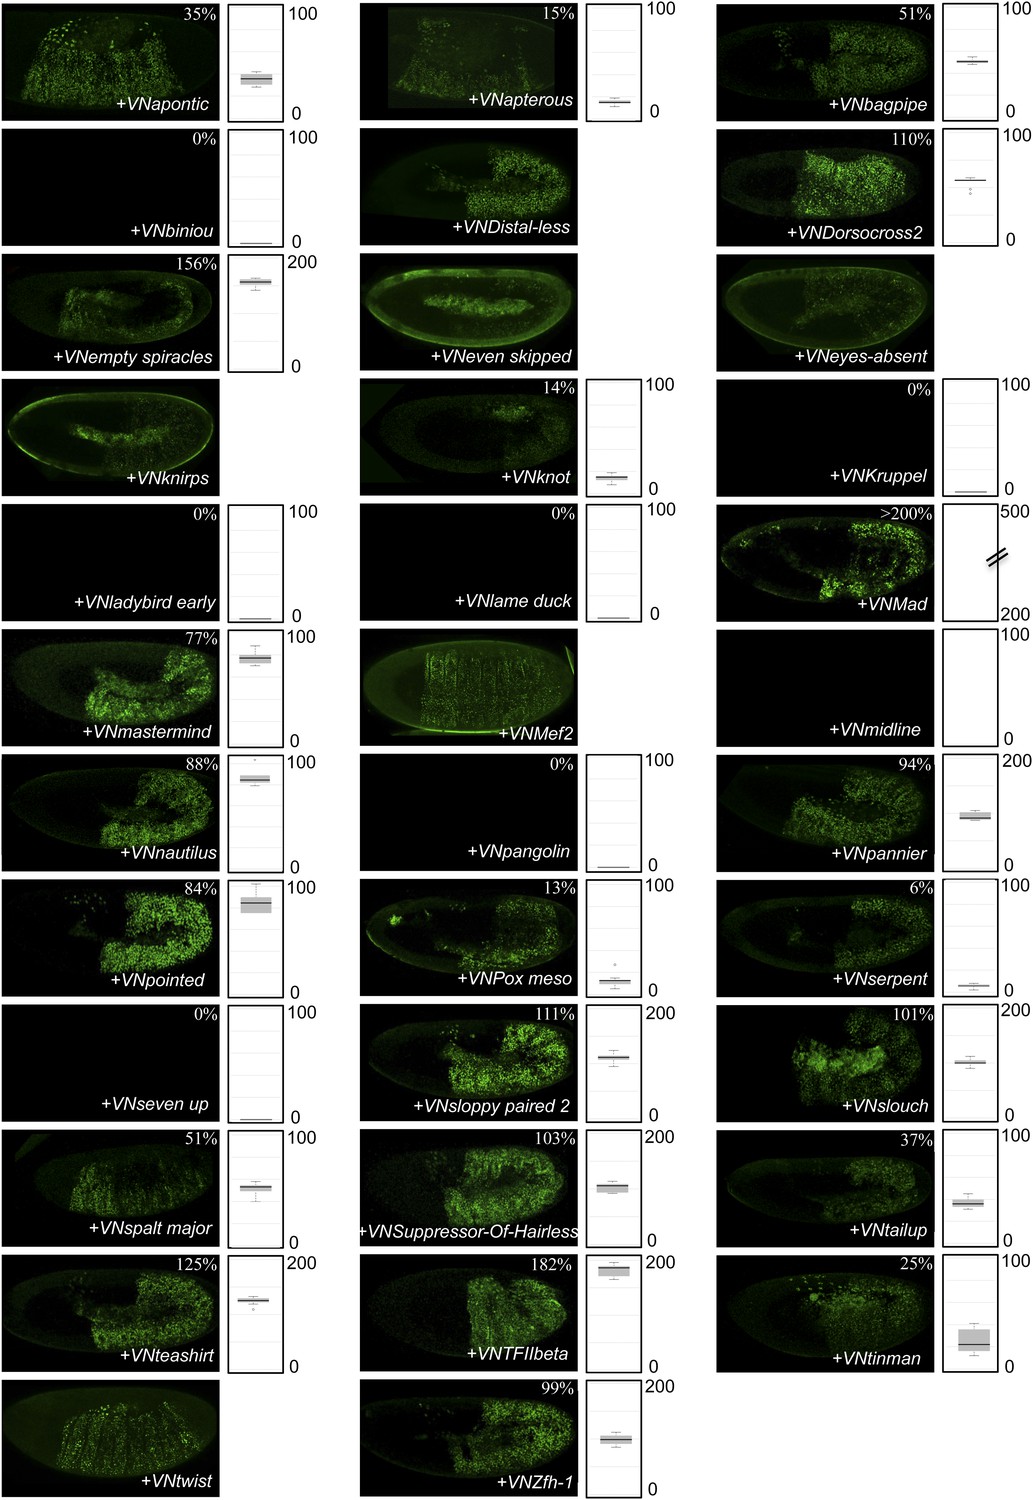
Figure 4—figure supplement 7
BiFC between the 35 TFs and hexapeptide (HX)-mutated Ubx.
Illustrative pictures of stage 10–12 embryos are provided for each TF as indicated. Quantification was performed as in Figure 3—figure supplement 1. Illustrative pictures of slightly older embryos are shown when signals were strongly affected. No picture was taken in absence of BiFC. No statistical quantification is provided in the case of a new interaction (as seen for Distal-less, Eyes-absent, Knot, Pannier, Pointed, Serpent, Seven-up and Zfh-1).
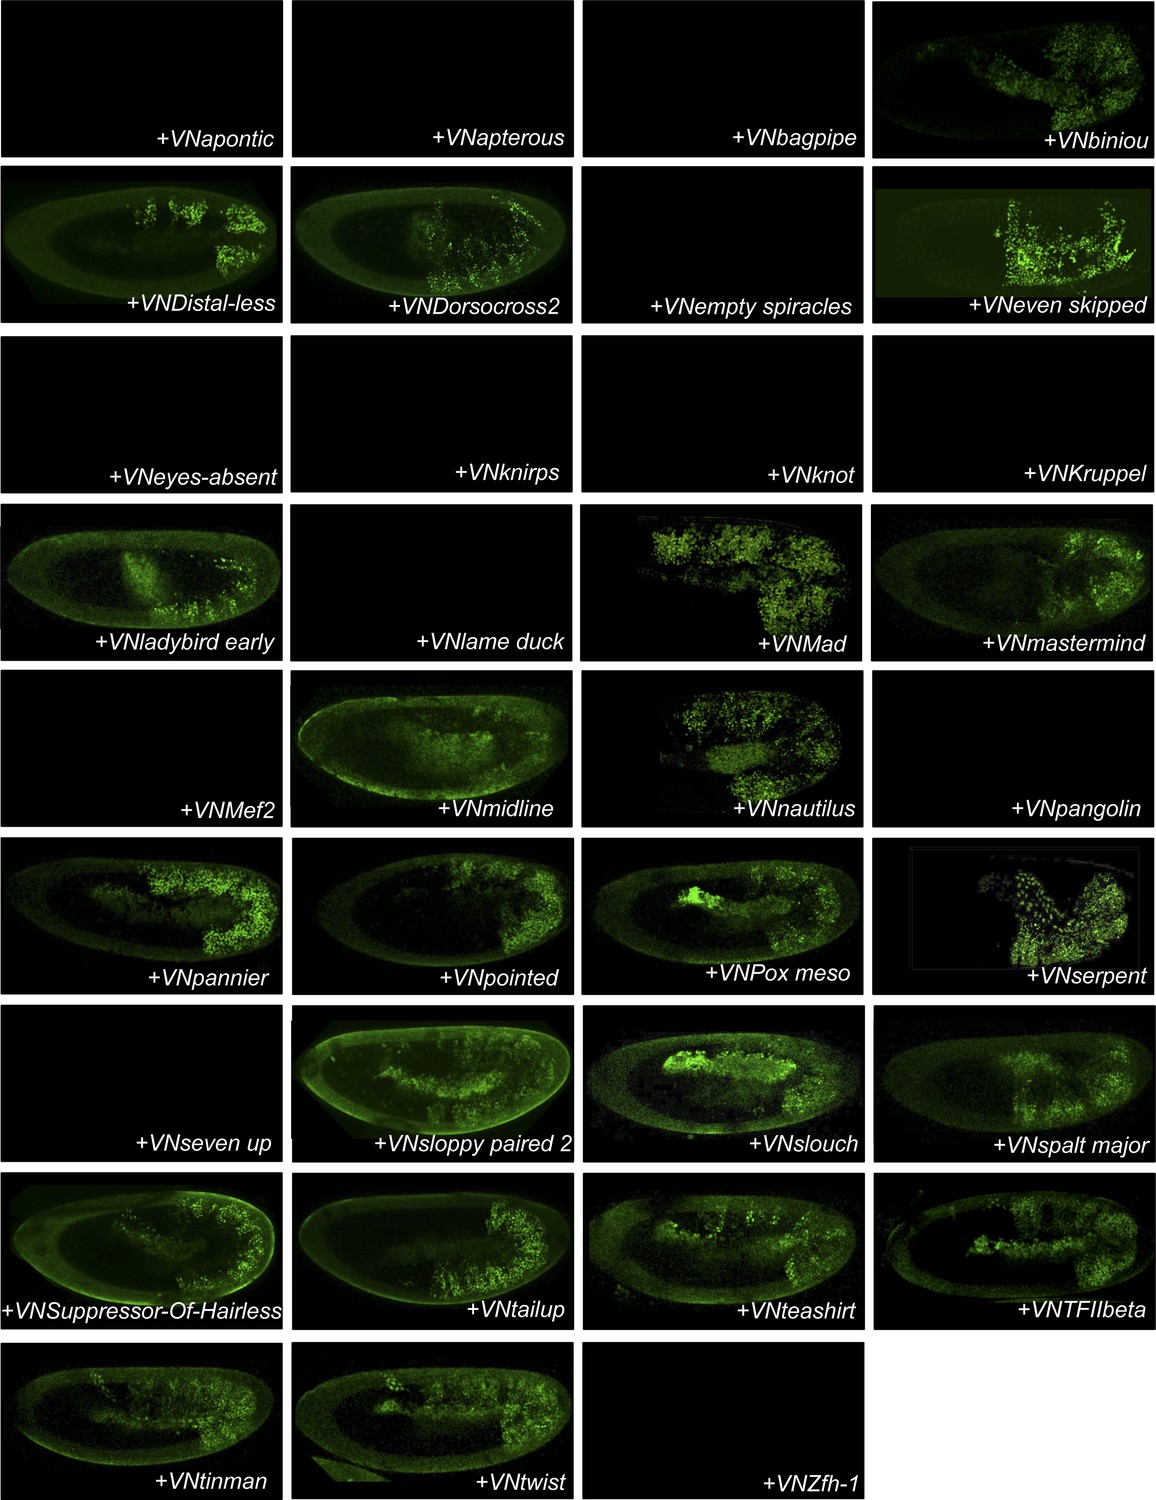
Figure 4—figure supplement 8
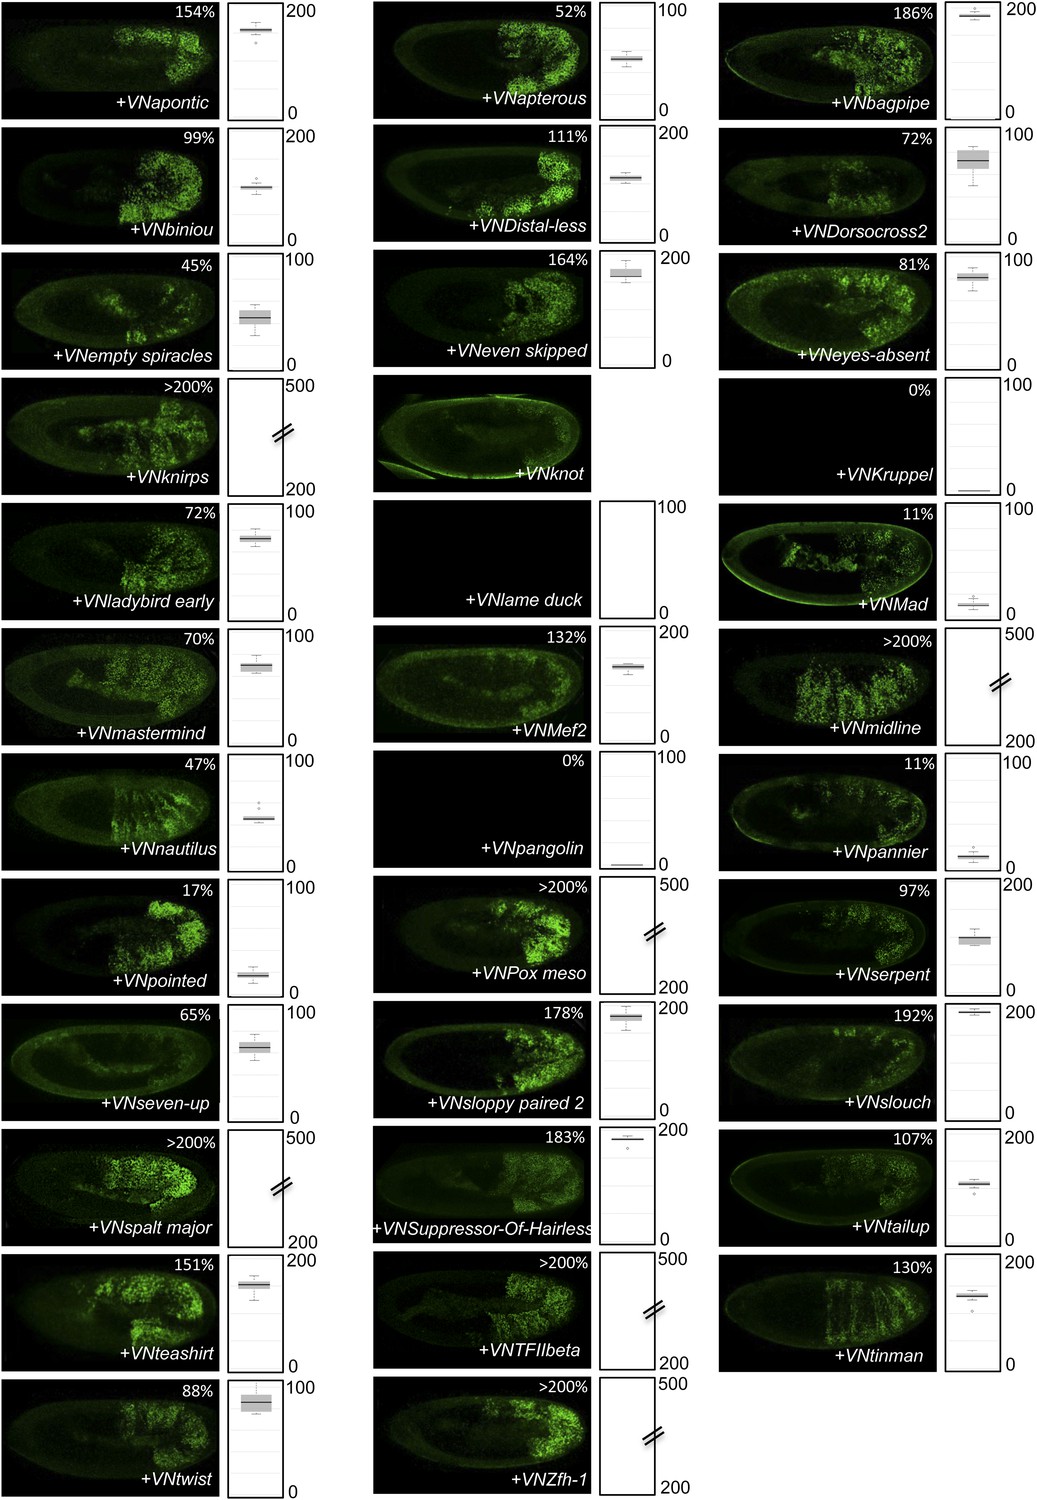
BiFC between the 35 TFs and hexapeptide (HX)-mutated AbdA.
Illustrative pictures of stage 10–12 embryos are provided for each TF as indicated. Quantification was performed as in Figure 3—figure supplement 1. Illustrative pictures of slightly older embryos are shown when signals were strongly affected. No picture was taken in absence of BiFC. No statistical quantification is provided in the case of a new interaction (as seen for Knot).
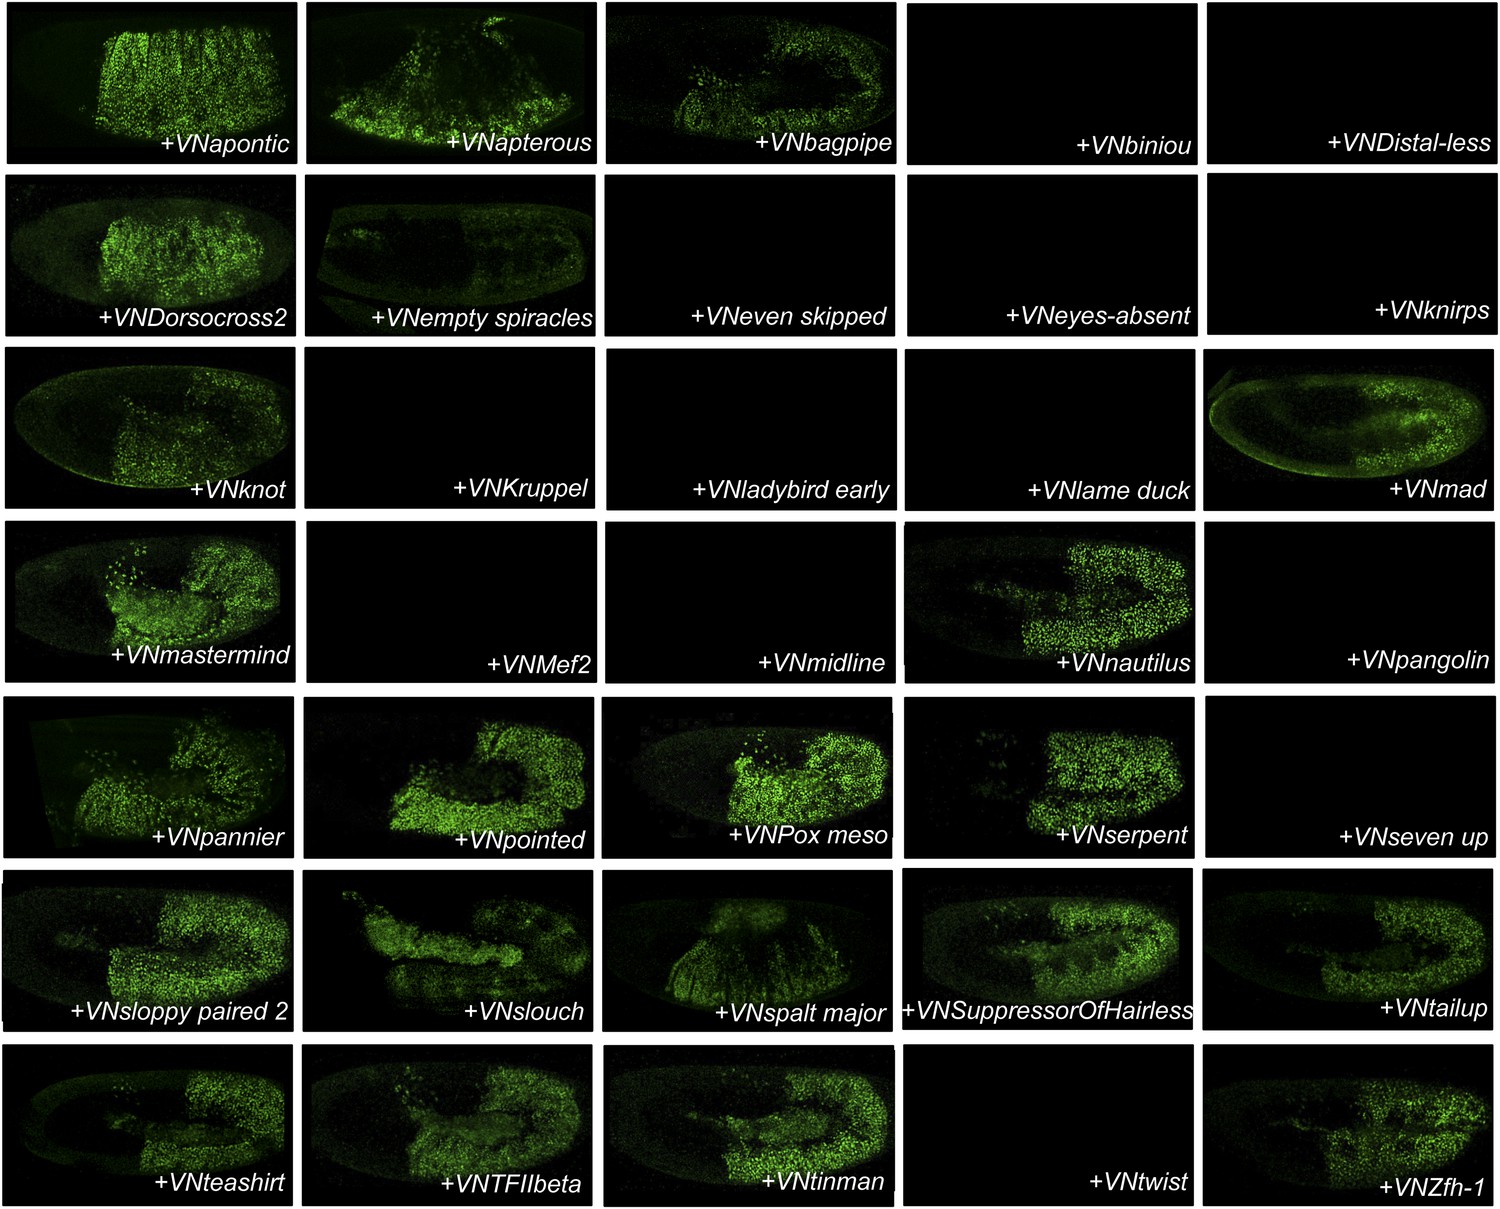
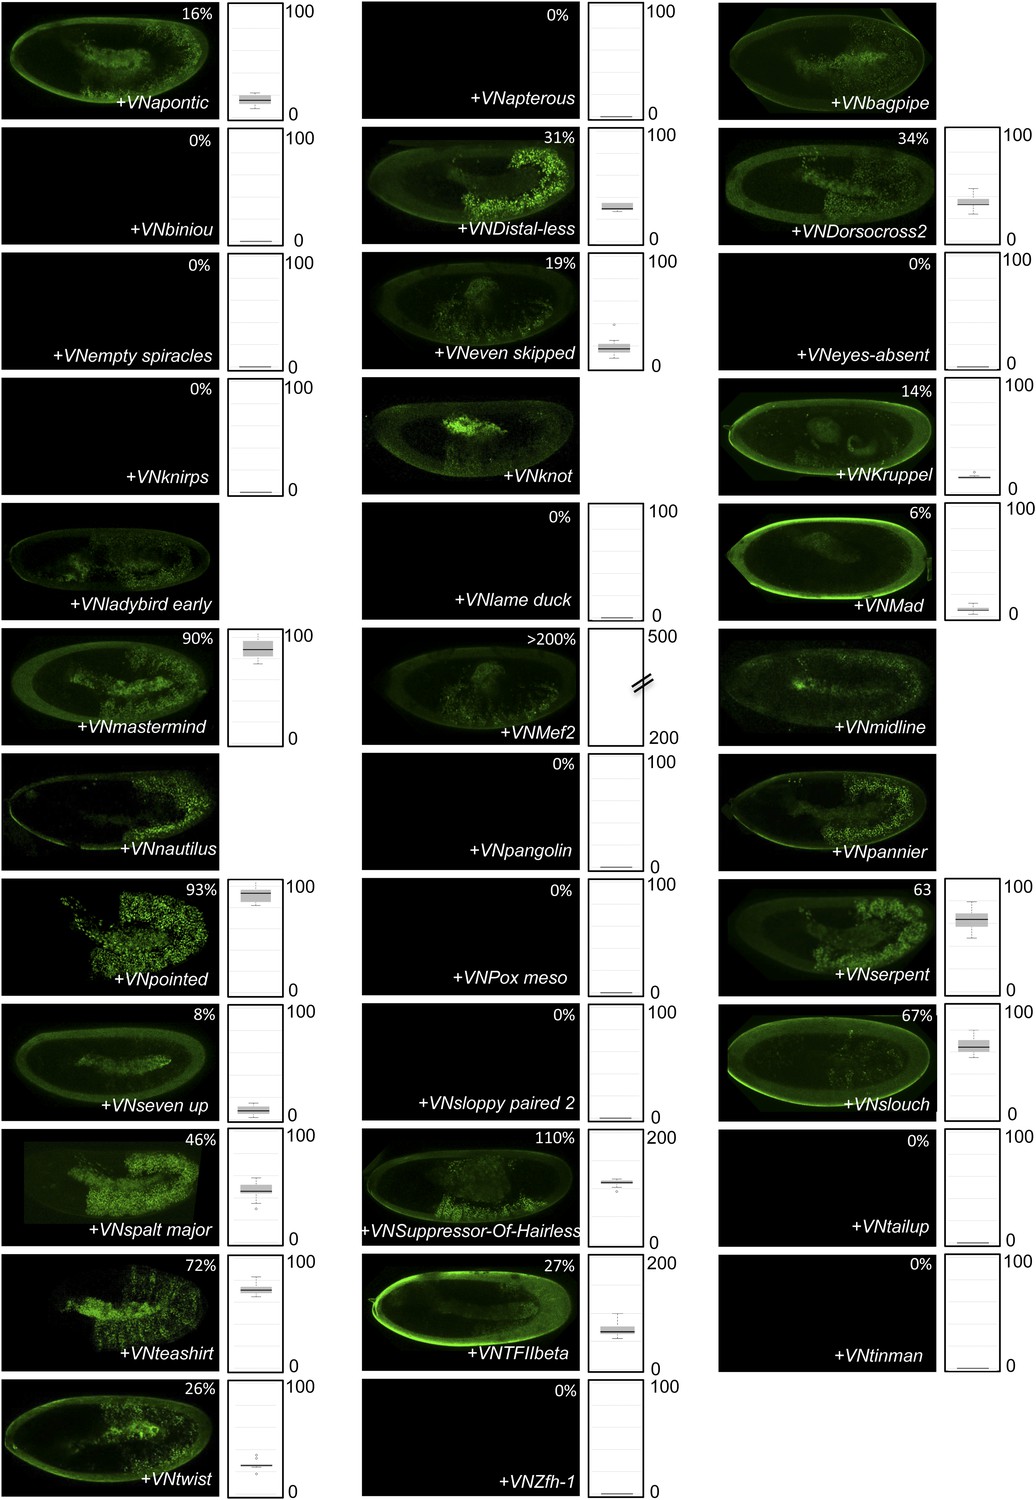
Figure 4—figure supplement 9
BiFC between the 35 TFs and hexapeptide (HX)-mutated AbdB.
Illustrative pictures of stage 10–12 embryos are provided for each TF as indicated. Quantification was performed as in Figure 3—figure supplement 1. Illustrative pictures of slightly older embryos are shown when signals were strongly affected. No picture was taken in absence of BiFC. No statistical quantification is provided in the case of a new interaction (as seen for Distal-less, Pangolin, Slouch and Spalt major).
Figure 5 with 1 supplement
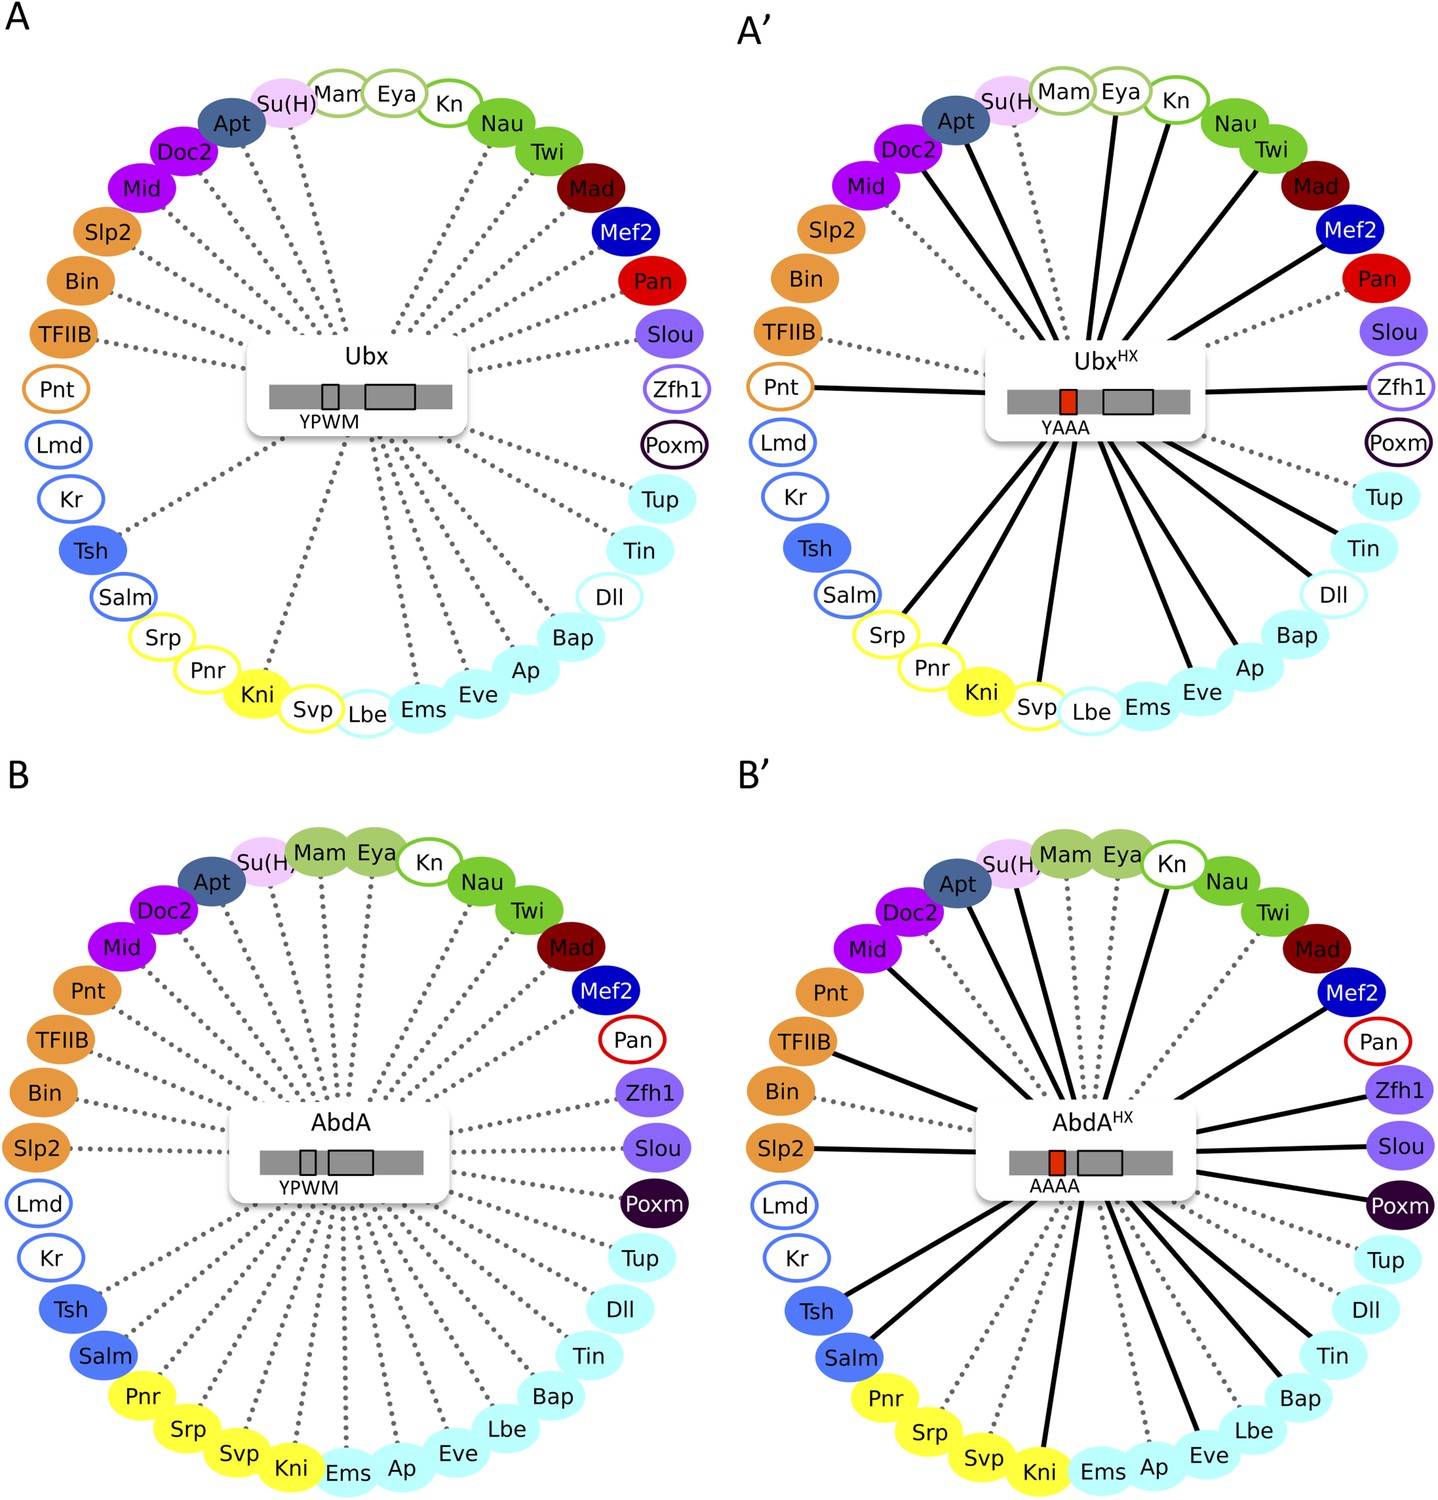
The HX mutation increases the interaction potential of Hox proteins with TFs in vivo: example in Ubx and AbdA.
(A–A′) Comparison between wild type and HX-mutated interactomes of Ubx. (B–B′) Comparison between wild type and HX-mutated interactomes of AbdA. The HX mutation led more frequently to stronger or new interactions than to interaction loses in these two Hox proteins. Colour code and representation are as in Figure 3. The HX mutation is indicated and highlighted in red. See also Figure 5—figure supplement 1.
Figure 5—figure supplement 1
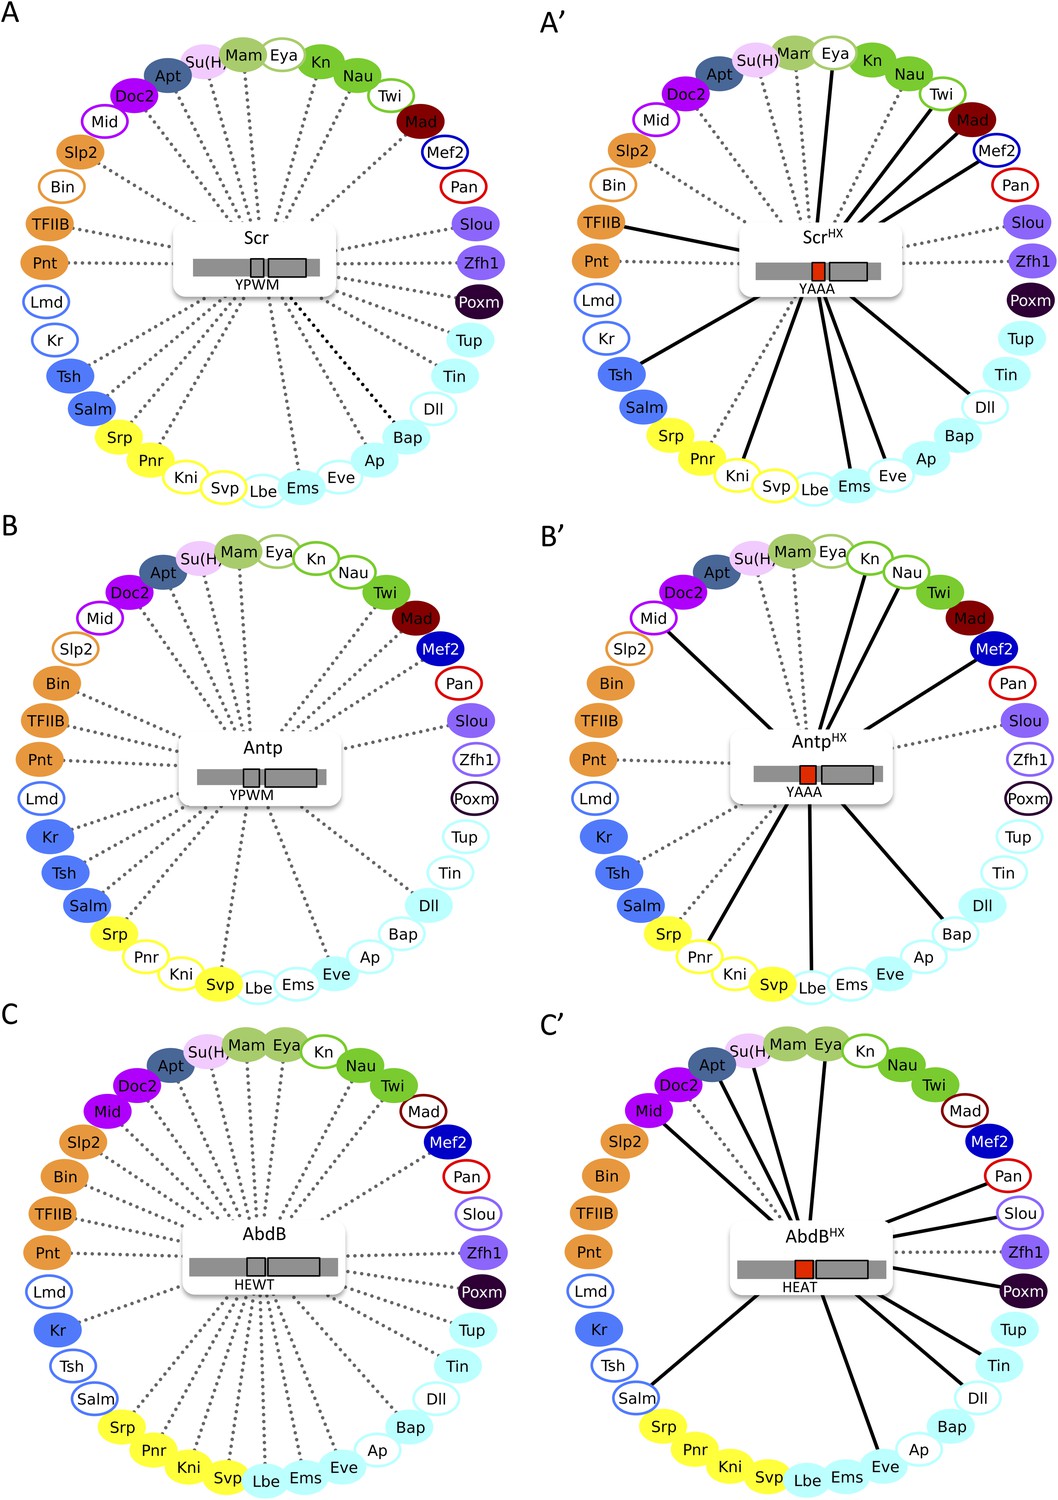
The HX mutation increases the interaction potential of Hox proteins with TFs in vivo: example in Scr, Antp, and AbdB.
(A–A′) Comparison between wild type and HX-mutated Scr. (B–B′) Comparison between wild type and HX-mutated Antp. (C–C′) Comparison between wild type and HX-mutated AbdB. Colour code and representation are as in Figure 3. The HX mutation is indicated and highlighted in red.
Figure 6 with 2 supplements
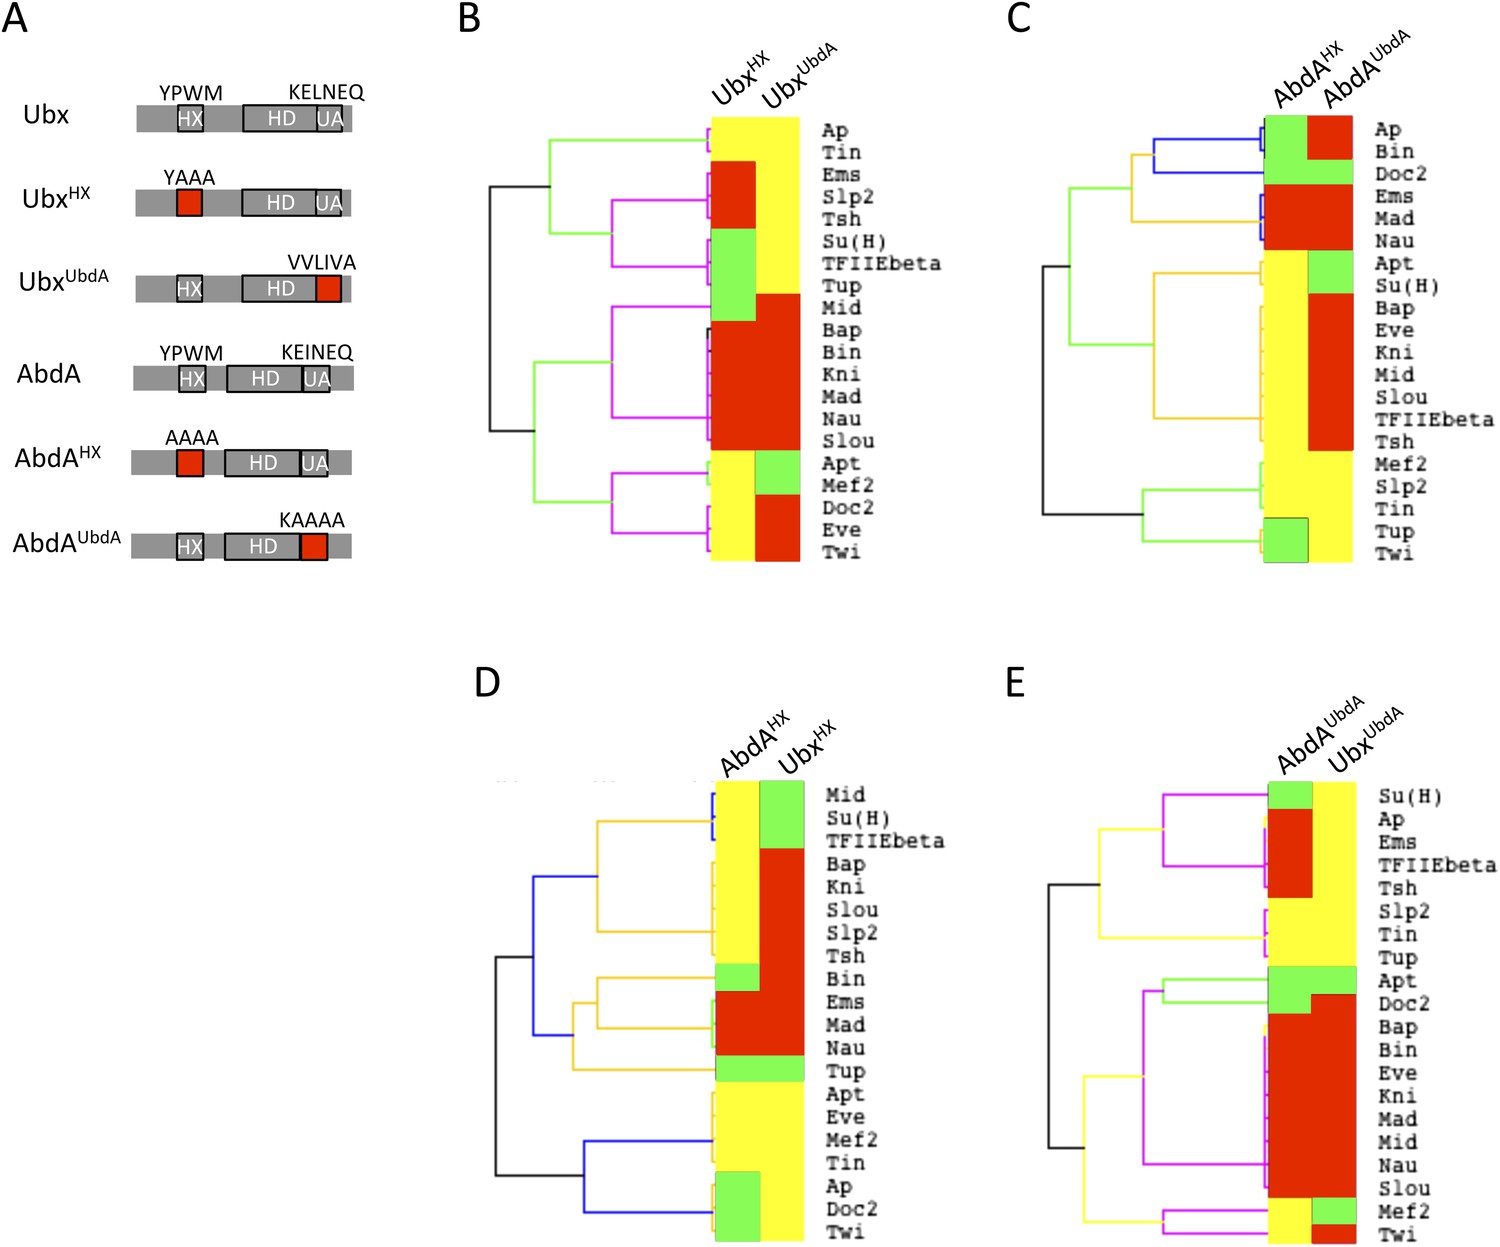
Usage mode of the HX and UbdA motifs in Ubx and AbdA proteins.
(A) Schematic representation of wild type and HX- or UbdA-mutated Ubx and AbdA proteins. (B) Heatmap comparing interaction properties of HX- and UbdA-mutated Ubx proteins with a set of 20 TFs. These TFs are common to Ubx and AbdA for BiFC. See also Figure 6—figure supplement 1. (C) Heatmap comparing interaction properties of HX- and UbdA-mutated AbdA proteins with the same set of TFs. See also Figure 6—figure supplement 2. Note that the HX and UbdA mutations have distinct or opposite effects for most of the interactions in Ubx and AbdA. (D) Heatmap comparing interaction properties of HX-mutated Ubx and AbdA proteins with the 20 common TFs. (E) Heatmap comparing interaction properties of UbdA-mutated Ubx and AbdA proteins with the 20 common TFs. Note that a higher proportion of TFs is similarly affected by the UbdA mutation in Ubx and AbdA when compared to the HX mutation. Colour code is as in Figure 4.
Figure 6—figure supplement 1
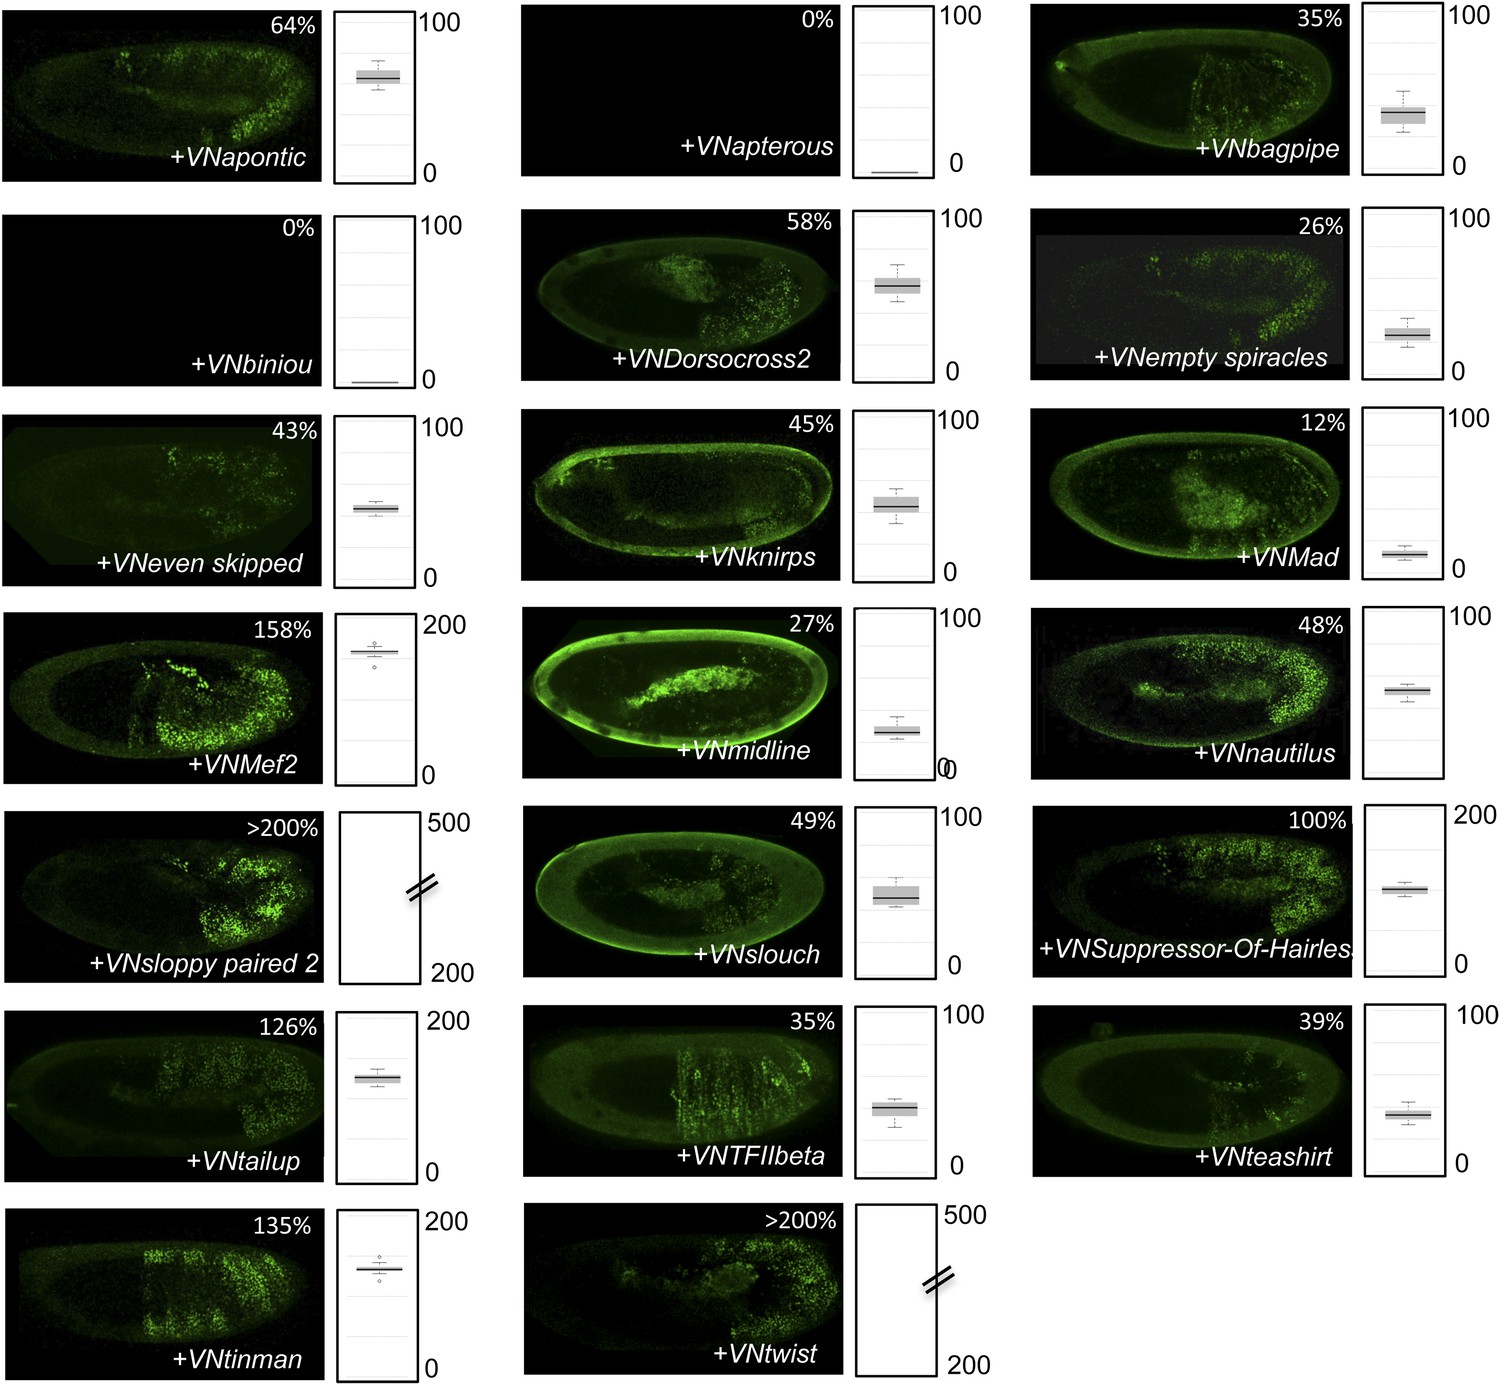
BiFC with UbdA-mutated Ubx in the epidermis.
BiFC was performed with the 20 TFs interacting both with Ubx and AbdA. Quantification was performed as in Figure 3—figure supplement 1. Illustrative pictures of slightly older embryos are shown when signals were strongly affected. No picture was taken in absence of BiFC.
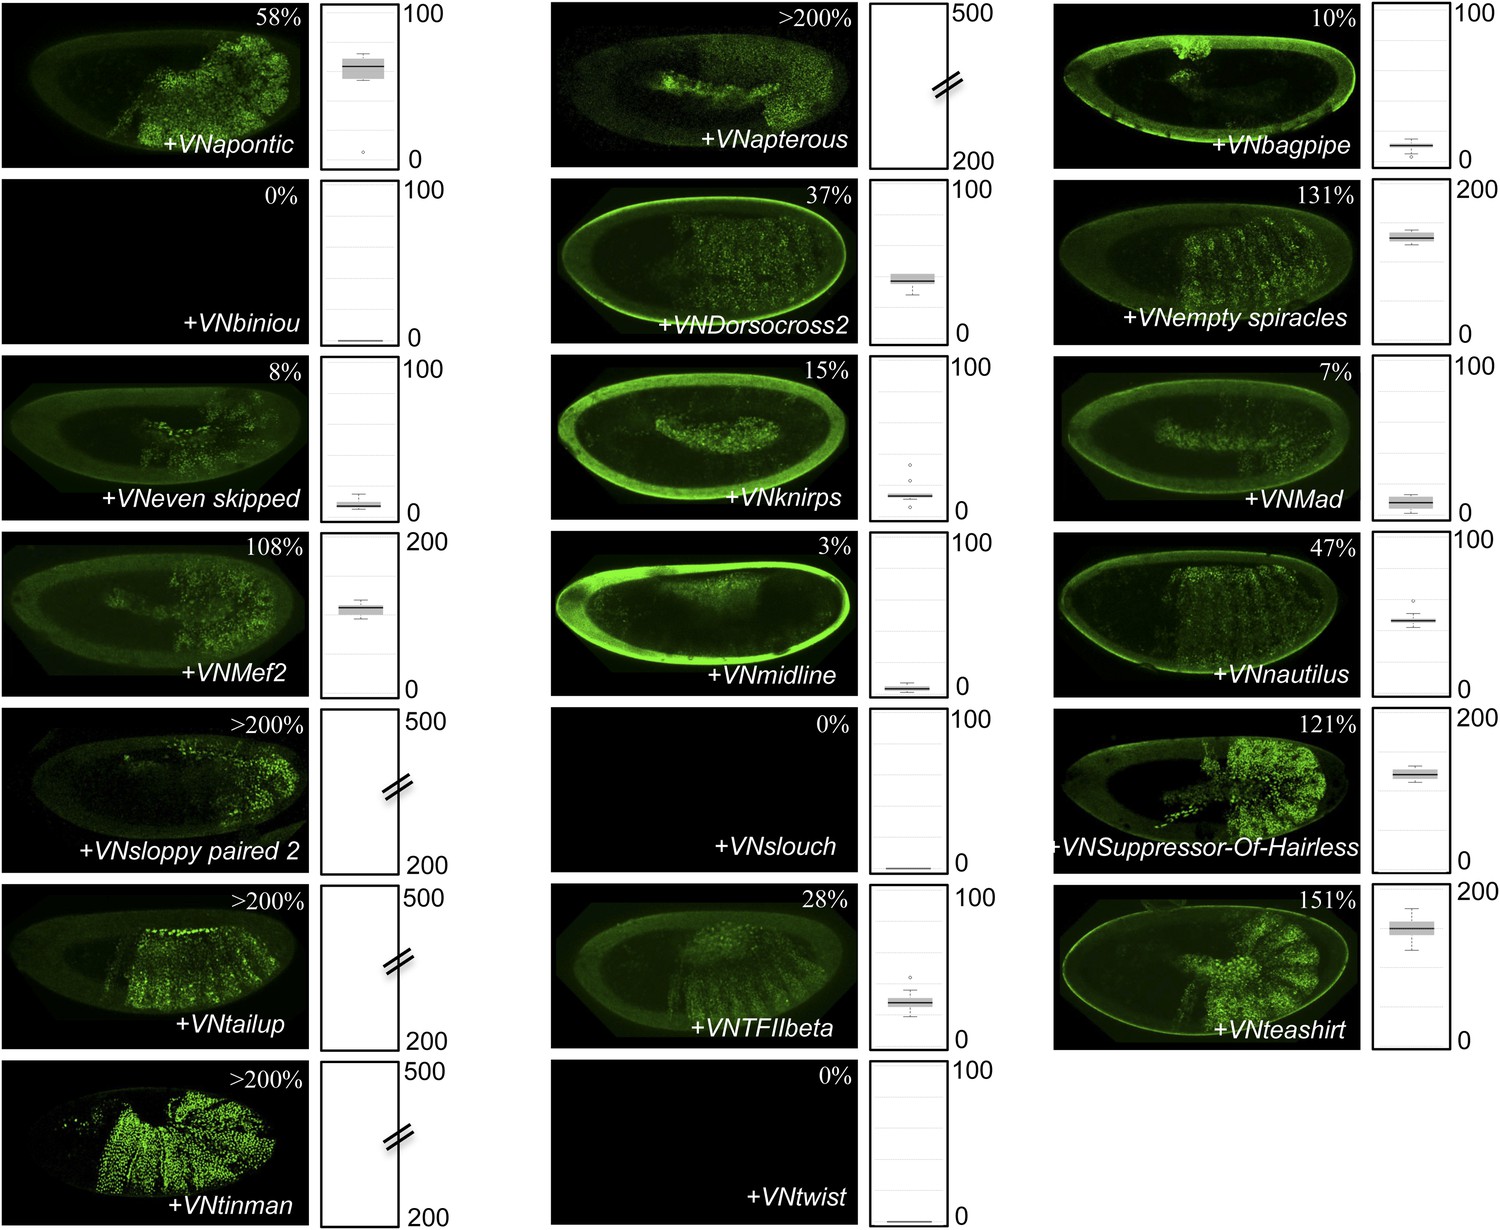
Figure 6—figure supplement 2
BiFC with UbdA-mutated AbdA in the epidermis.
BiFC was performed with the 20 TFs interacting both with Ubx and AbdA. Quantification was performed as in Figure 3—figure supplement 1. Illustrative pictures of slightly older embryos are shown when signals were strongly affected. No picture was taken in absence of BiFC.
Figure 7 with 2 supplements
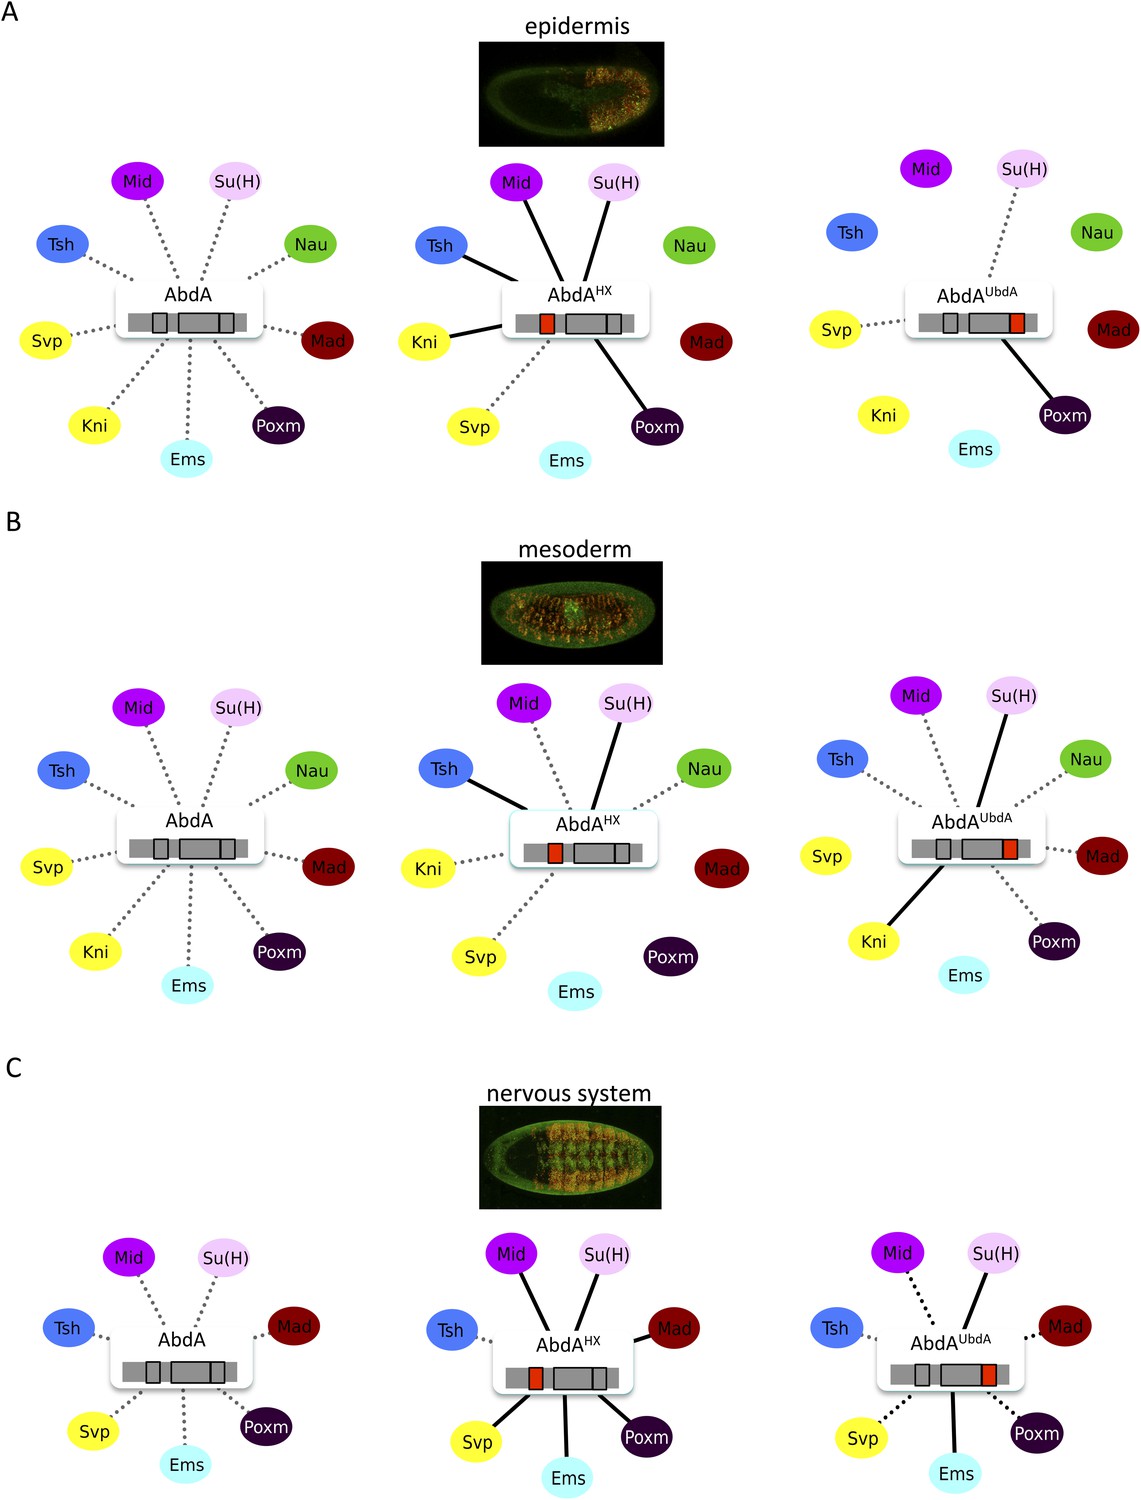
The HX and UbdA motifs of AbdA have different interaction properties in different embryonic tissues.
(A) Interaction properties of wild type and HX- or UbdA-mutated AbdA in the epidermis. (B) Interaction properties of wild type and HX- or UbdA-mutated AbdA in the mesoderm. See also Figure 7—figure supplement 1. (C) Interaction properties of wild type and HX- or UbdA-mutated AbdA in the nervous system. See also Figure 7—figure supplement 2. Picture of an embryo making BiFC (green) and expressing the dsRed fluorescent protein under the control of the Gal4 driver illustrates the tissue of interest in each condition. Interactomes are represented as in Figure 3.
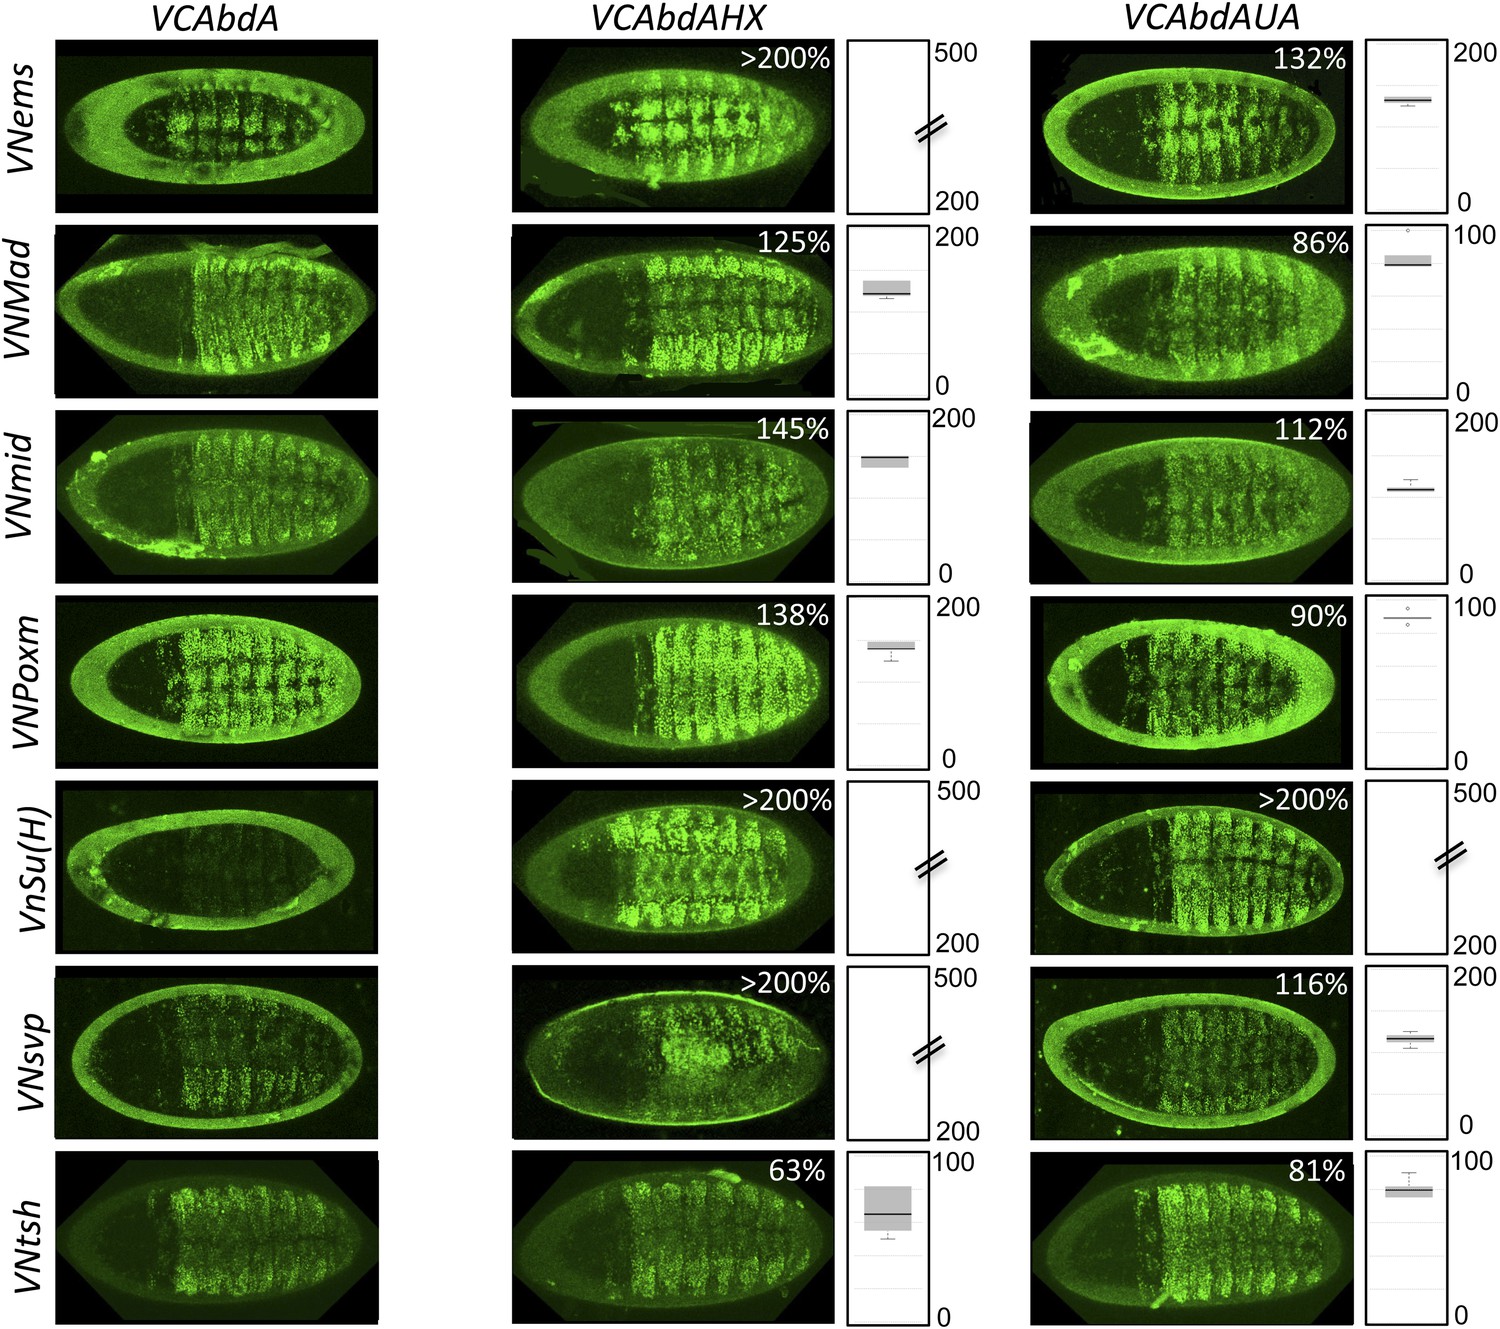
Figure 7—figure supplement 1
BiFC with wild type, HX- or UbdA-mutated AbdA in the mesoderm.
BiFC was performed with a set of 9 TFs that were all BiFC-positive with AbdA in the epidermis. Statistical quantification of BiFC signals with mutated AbdA proteins is shown as a boxplot representation. Quantification was performed in the mesoderm of stage 12 embryos (see also ‘Materials and methods’).
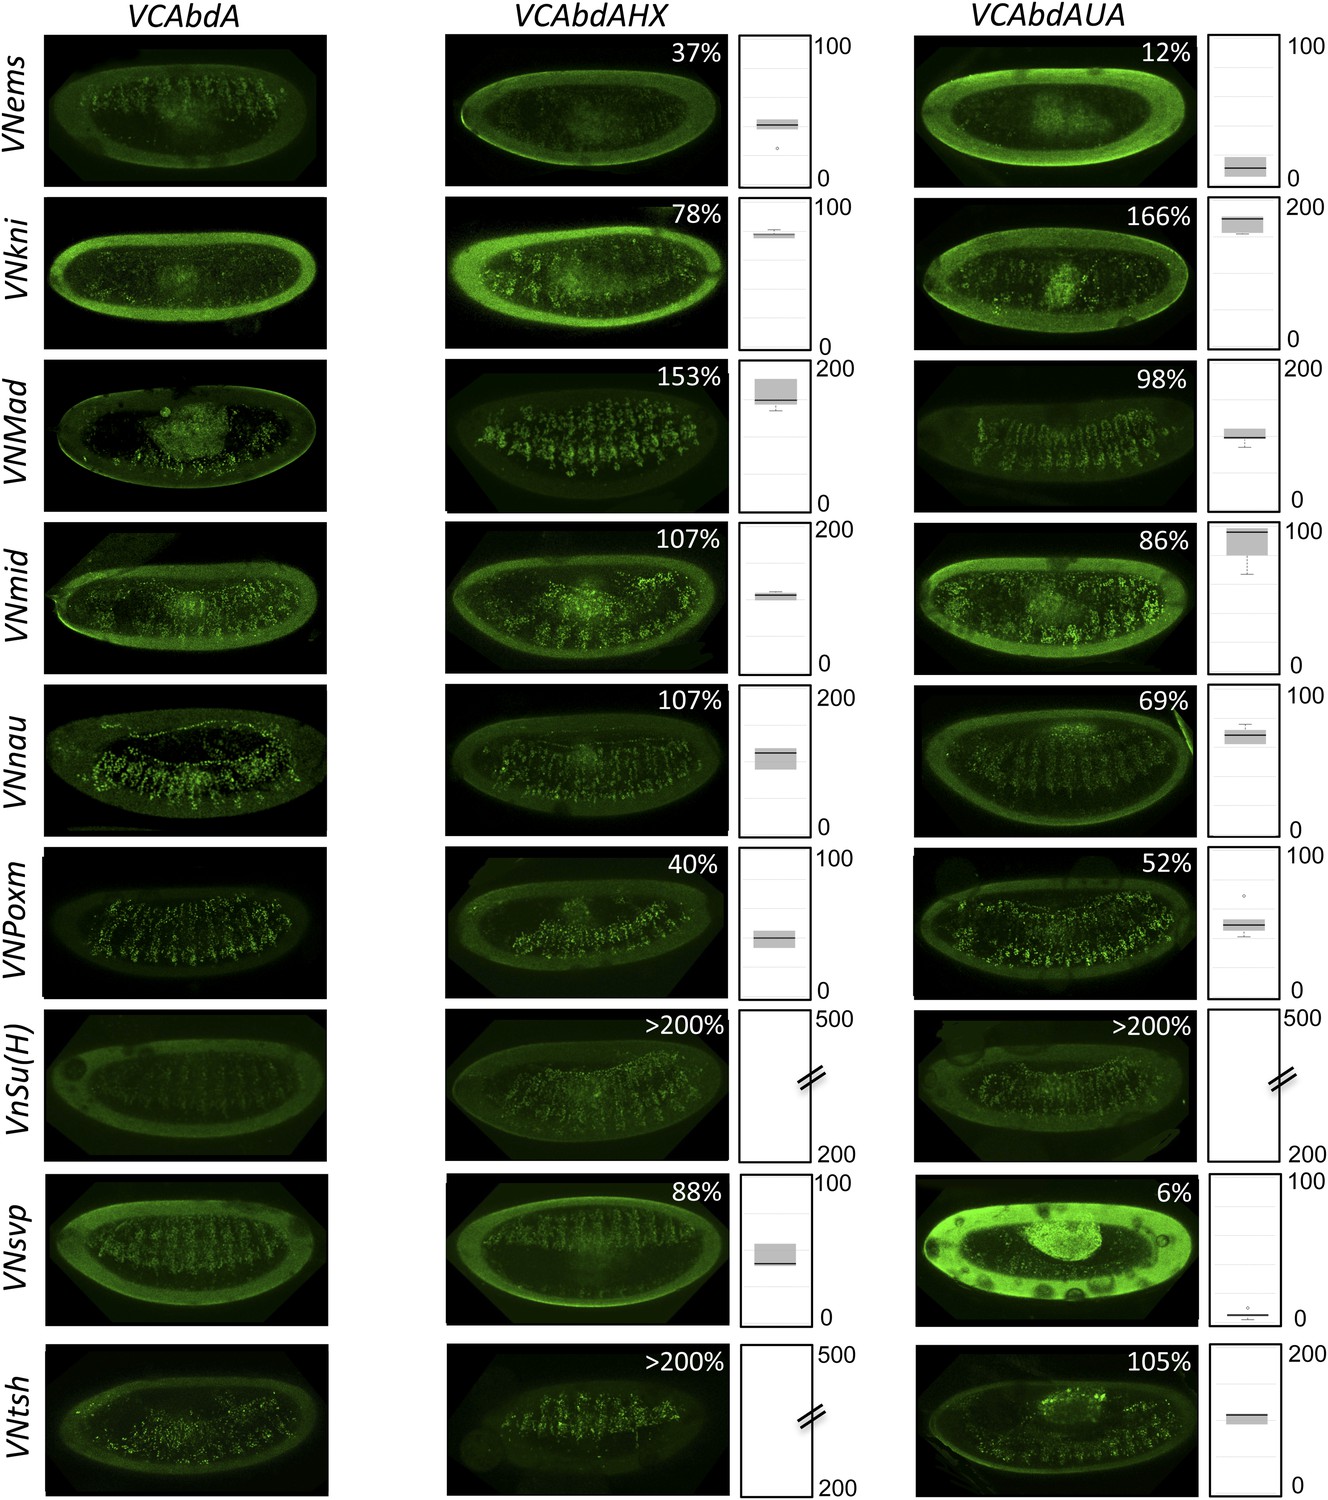
Figure 7—figure supplement 2
BiFC with wild type, HX- or UbdA-mutated AbdA in the nervous system.
BiFC was performed with a set of seven TFs that were all BiFC-positive with AbdA in the epidermis. Statistical quantification of BiFC signals with mutated AbdA proteins is shown as a boxplot representation. Quantification was specifically performed in the ventral nerve cord of stage 14 of live embryos (see also ‘Materials and methods’).
Figure 8 with 5 supplements
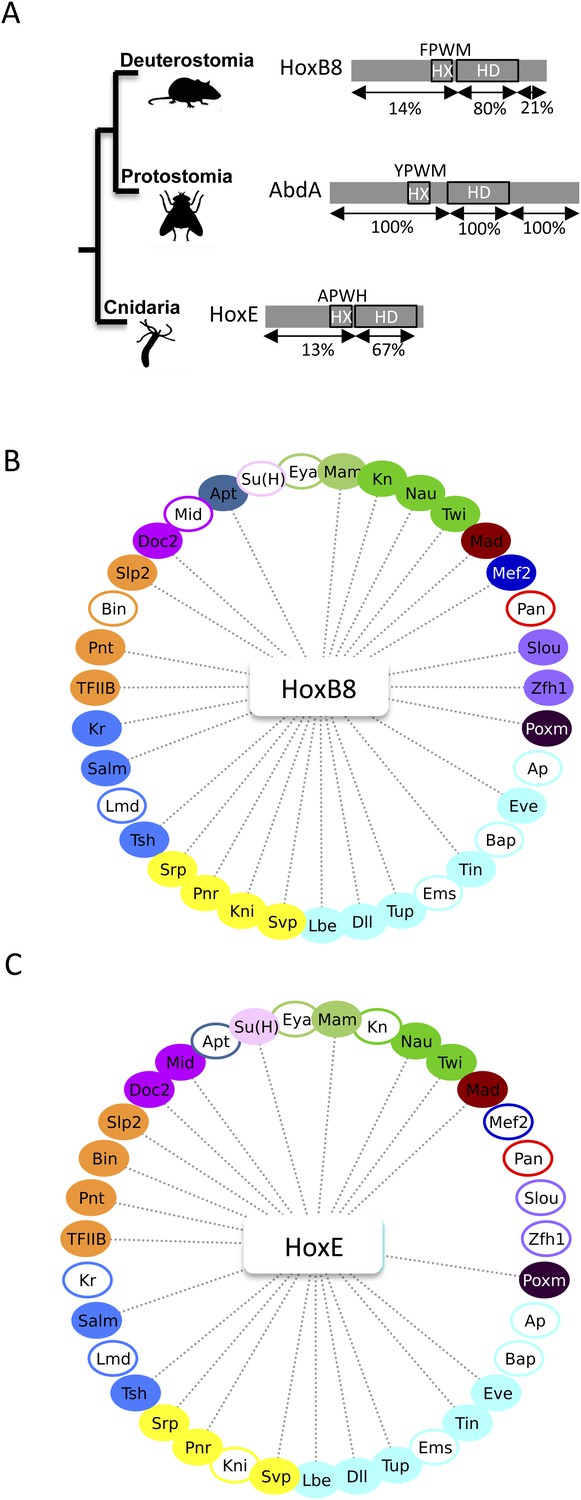
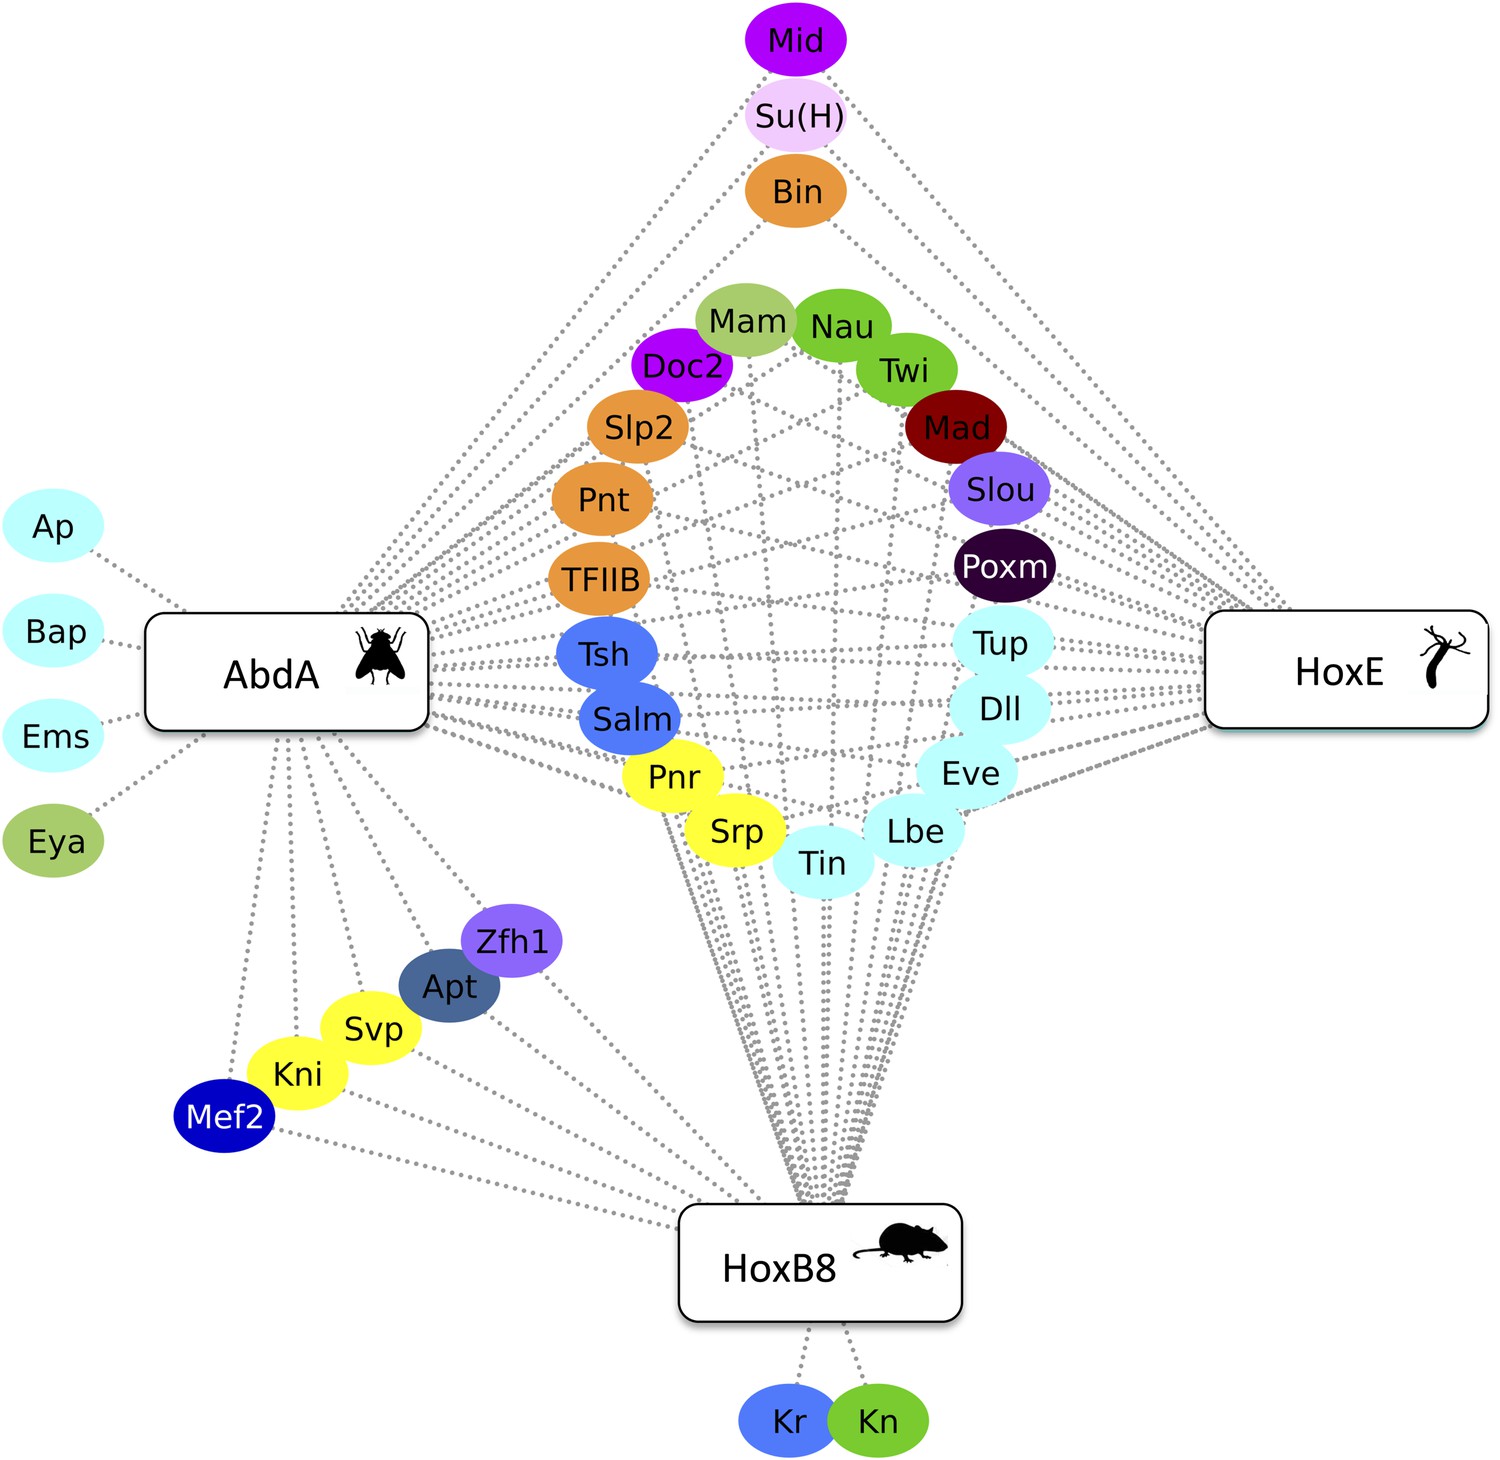
The Nematostella HoxE and mouse HoxB8 proteins interact with several Drosophila TFs.
(A) Schematic representations of the Hox proteins and the corresponding animal phylogeny. The percentage of sequence identity is given in comparison to AbdA. (B) Interactome between mouse HoxB8 and the 35 Drosophila TFs. (C) Interactome between Nematostella HoxE and the 35 Drosophila TFs. Colour code and representation are as in Figure 3. See also Figure 8—figure supplements 1–5.
Figure 8—figure supplement 1
BiFC between Drosophila TFs and the mouse HoxB8 protein.
Illustrative pictures are provided for each TF as indicated. No picture was taken in absence of BiFC.
Figure 8—figure supplement 2
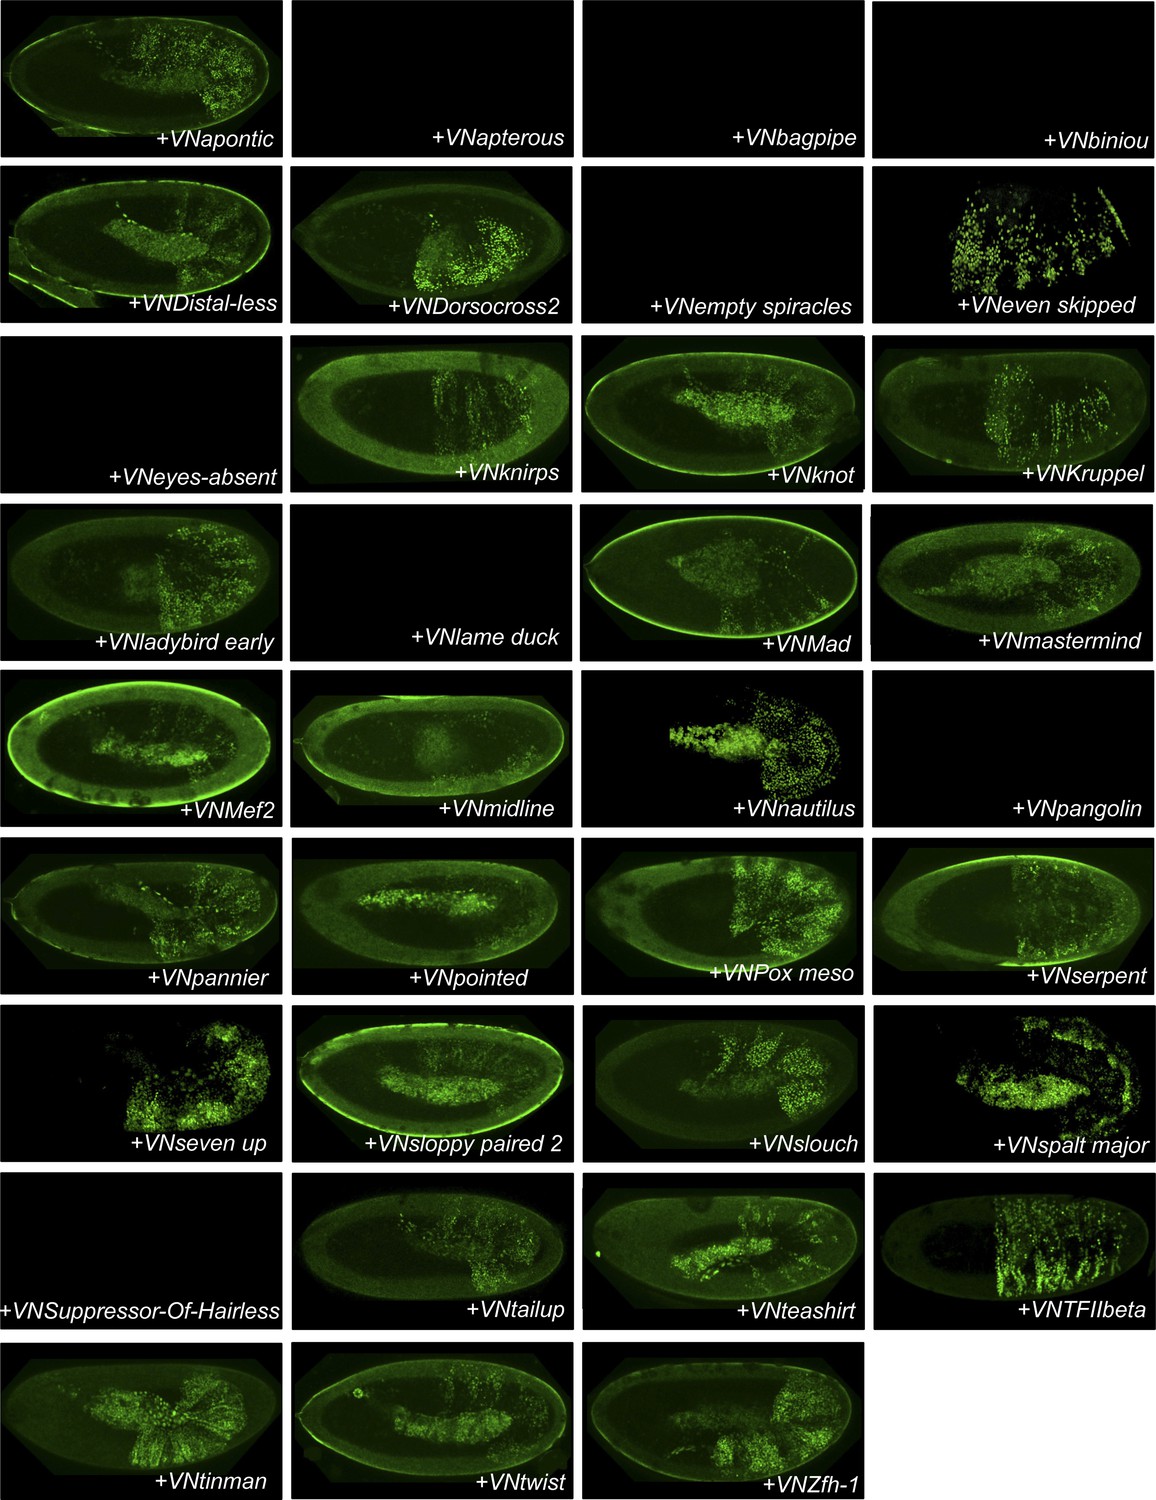
BiFC between Drosophila TFs and the Nematostella HoxE protein.
Illustrative pictures are provided for each TF as indicated. No picture was taken in absence of BiFC.
Figure 8—figure supplement 3
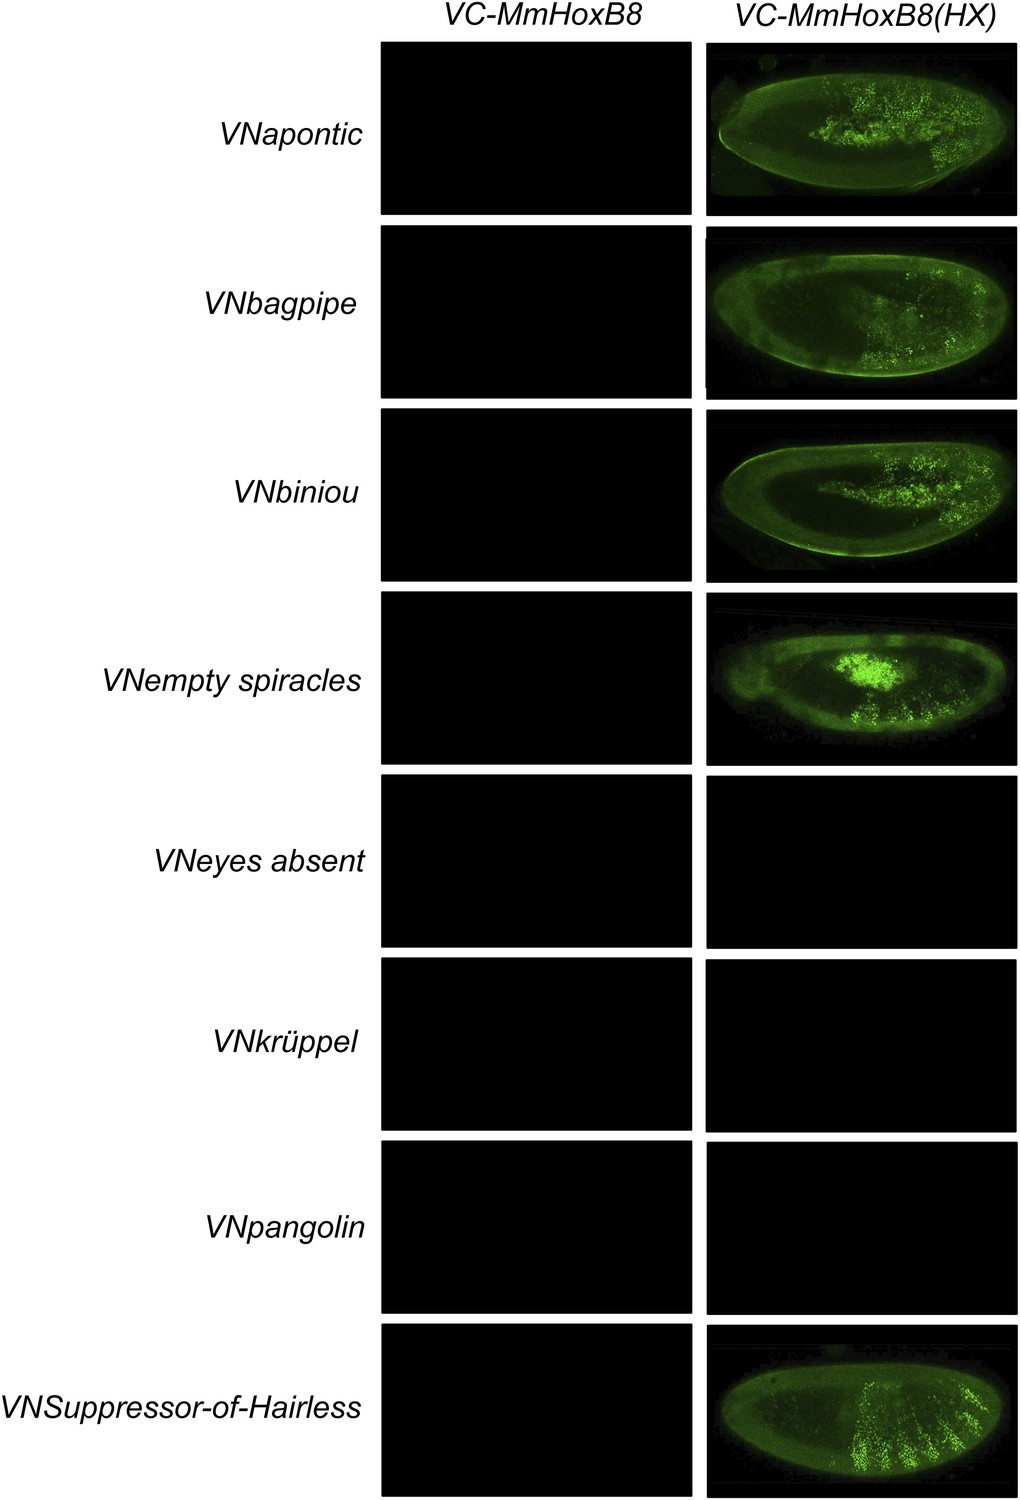
BiFC between Drosophila TFs and HX-mutated HoxB8.
Illustrative pictures are provided for each TF as indicated. BiFC was performed with TFs that were negative with wild type HoxB8. The HX mutation leads to five new interactions among the eight tested TFs (as seen for Apontic, Bagpipe, Biniou, Empty spiracles and Suppressor-of-Hairless). No picture was taken in absence of BiFC.
Figure 8—figure supplement 4
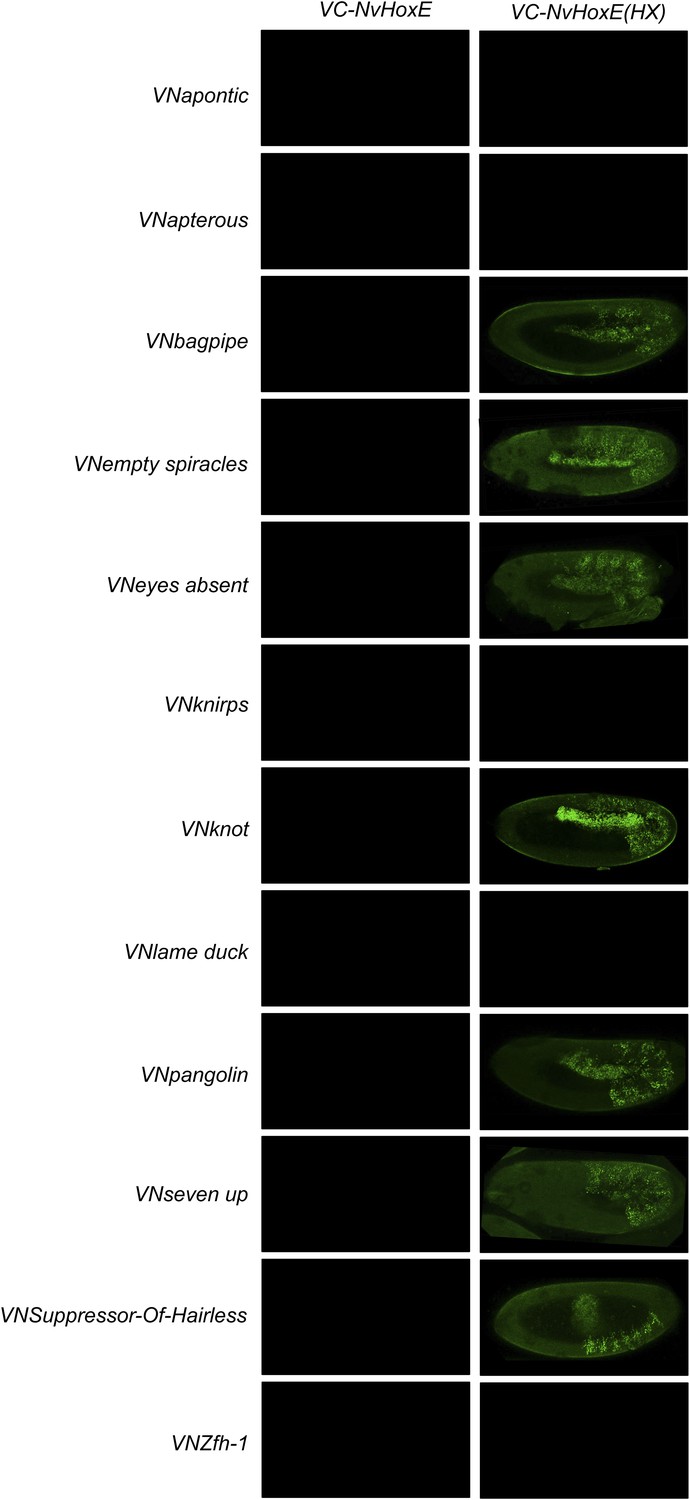
BiFC between Drosophila TFs and HX-mutated HoxE.
Illustrative pictures are provided for each TF as indicated. BiFC was performed with TFs that were negative with wild type HoxE. The HX mutation leads to seven new interactions among the twelve tested TFs (as seen for Bagpipe, Empty spiracles, Eyes absent, Knot, Pangolin, Seven up and Suppressor-of-Hairless). No picture was taken in absence of BiFC.
Figure 8—figure supplement 5
Drosophila AbdA, mouse HoxB8 and Nematostella HoxE interact with several common TFs in vivo.
Colour code and interaction representation are as in Figure 3.
Figure 9 with 1 supplement
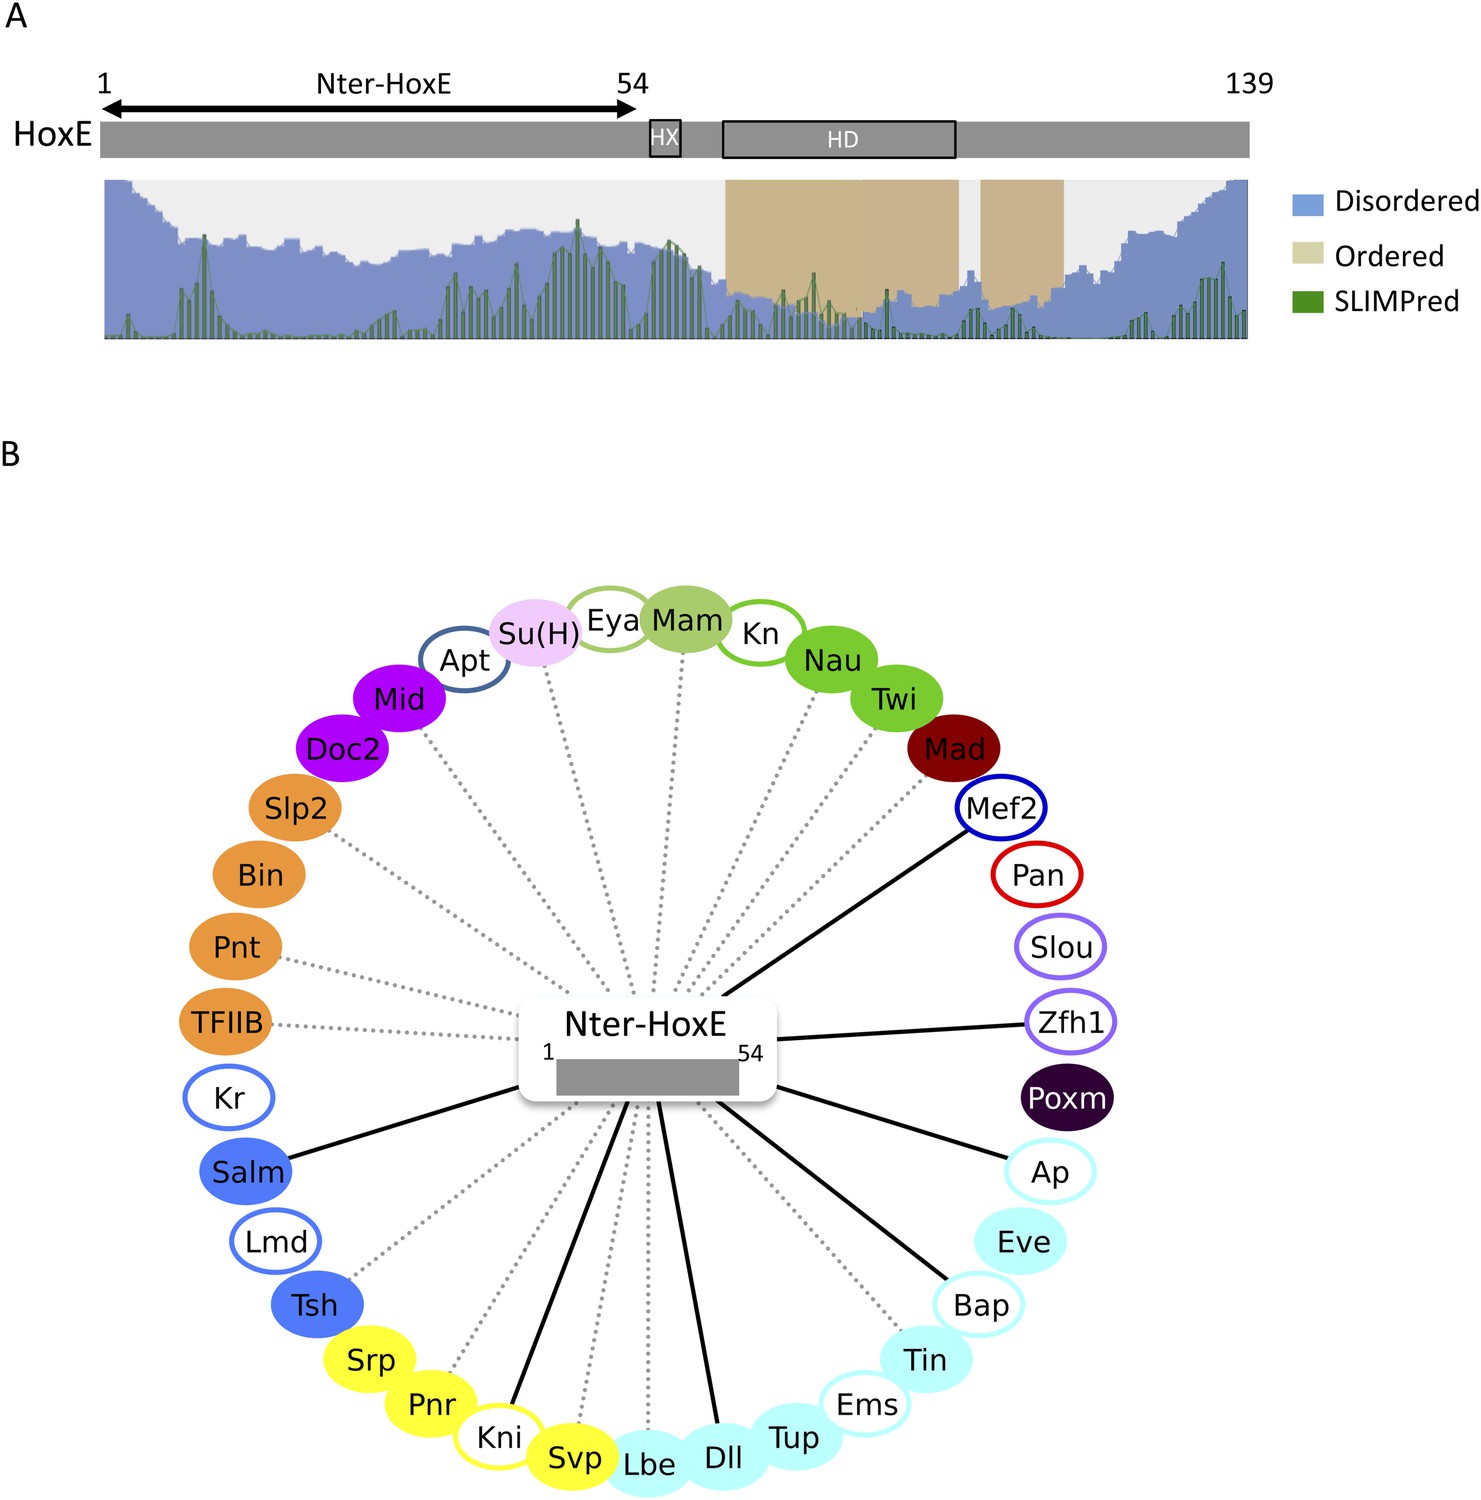
The intrinsically disordered region of HoxE establishes a number of interactions with Drosophila TFs.
(A) Scheme of full length Nematostella HoxE with its predicted SLiMs (green bars), and disordered (blue waves) or ordered (brown blocks) regions. Adapted from iupred (http://iupred.enzim.hu/). The N-terminal disordered region used for BiFC is indicated (Nter-HoxE). (B) Interactome between Nter-HoxE and the 35 Drosophila TFs. Colour code and representation are as in Figure 3. See also Figure 9—figure supplement 1.
Figure 9—figure supplement 1
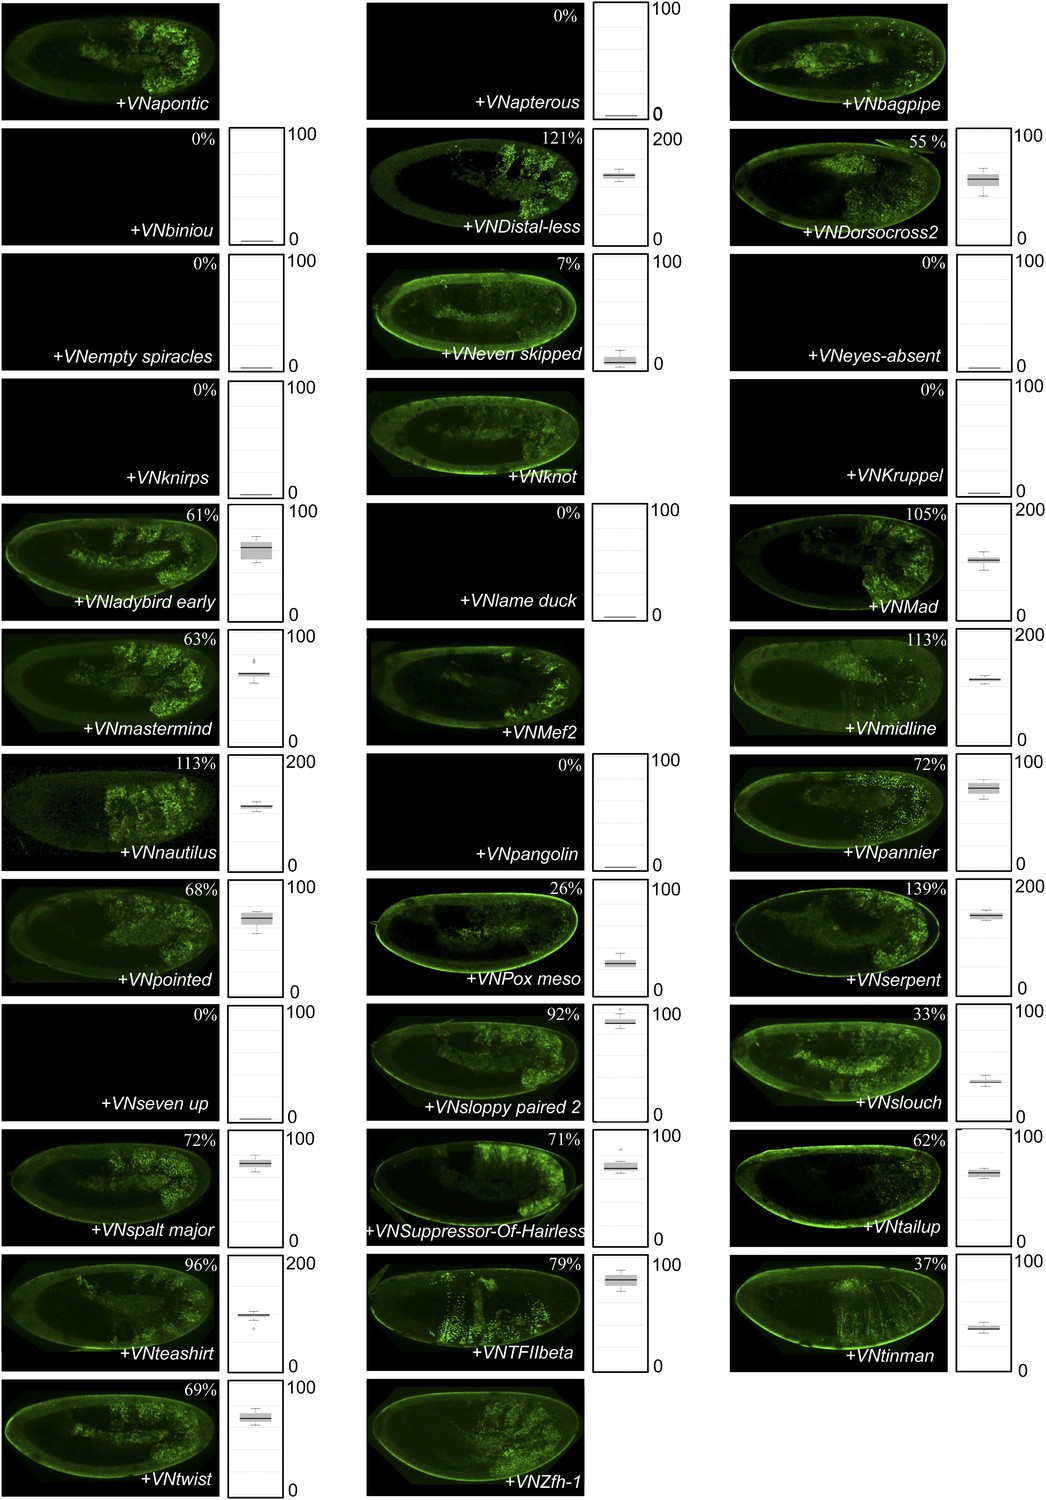
BiFC between Drosophila TFs and the N-terminal (1-54) fragment of the Nematostella HoxE protein.
BiFC was performed with the 35 TFs in the epidermis of stage 10–12 embryos, as indicated. Quantification was performed as in Figure 3—figure supplement 1. No statistical quantification is provided in the case of a new interaction (as seen for Apontic, Bagpipe, Knot, Mef2 and Zfh1). No picture was taken in absence of BiFC.
Figure 10
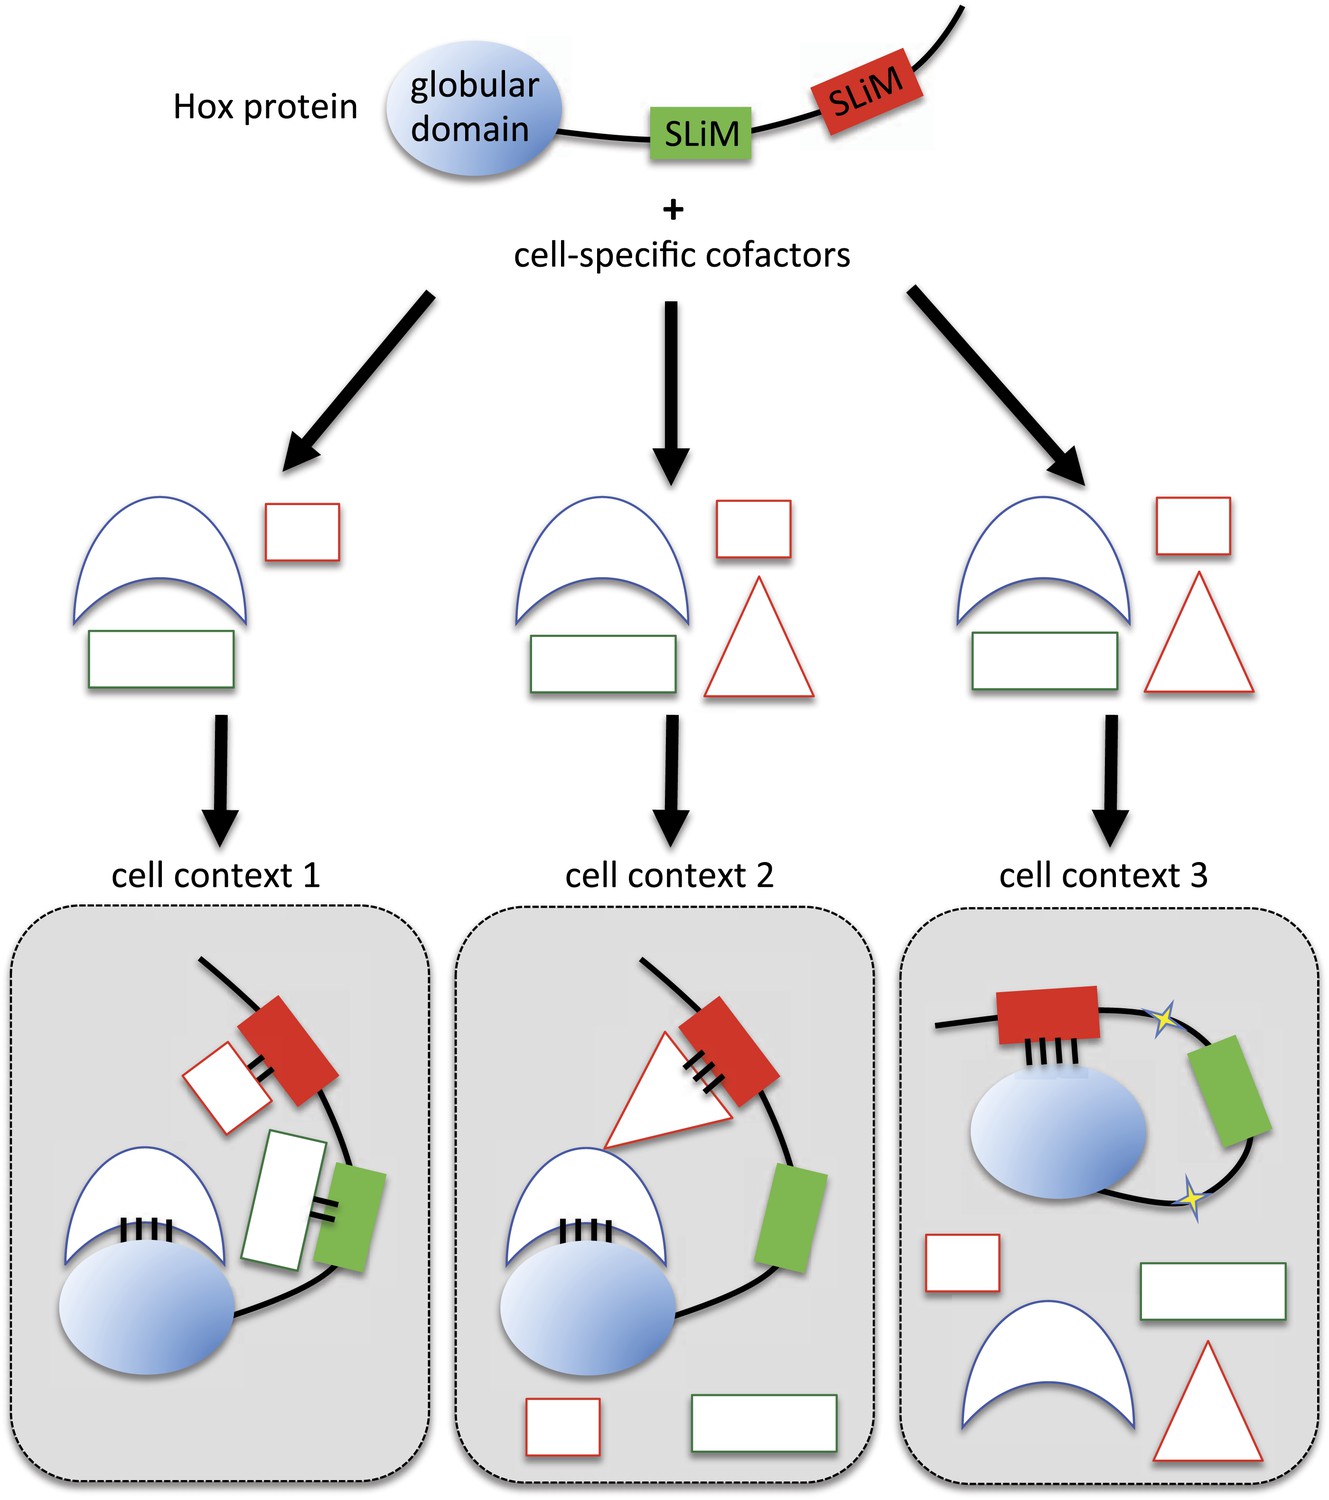
Molecular mechanisms underlying context-dependent activities of SLiMs in protein–protein interactions.
The Hox protein is represented as containing a globular structured domain together with two different SLiMs embedded in a disordered region, as indicated. This protein will present different interaction properties with a set of cofactors that could vary depending on the cell context considered. Preferential interactions between cofactors and the protein domain and SLiMs are represented by a colour code. Black bars symbolize the various levels of interaction affinity. In the cell context 1, cofactors are recruited through specific interactions with the globular domain and the two SLiMs. In the cell context 2, there is a supplementary triangular cofactor that displays higher affinity with the red SLiM than the square cofactor. As a consequence, interaction will occur with this triangular (hiding) cofactor, which forbids the interaction with the other SLiM. In this context, the red SLiM behaves as an inhibitory interaction motif. In the cell context 3, post-translational modifications in the disordered region (yellow stars) allow the inhibitory SLiM to establish interactions in cis with the globular domain. These intra-molecular contacts forbid the binding of the other cofactors. The last two mechanisms illustrate how the inhibitory activity of SLiMs could help in distinguishing/specifying interactomes with an identical set of cofactors.
Additional files
-
Supplementary file 1
List of the 80 candidate transcription factors (TFs) tested as potential cofactors of AbdA. Each TF used in the competition test corresponds either to an artificial UAS construct or to a UAS-containing transposon inserted in the endogenous promoter locus. These constructs were obtained from stock centres or from particular laboratories, as indicated. Red and green-filled boxes indicate positive or negative competitor status, respectively. The expression profile of each TF is provided for the main embryonic germ layers and was compiled according to databases (http://flybase.org and [Hammonds et al., 2013]). Yellow and black-filled boxes depict presence or absence of expression, respectively. TFs that were subsequently used for BiFC with AbdA are bolded and annotated with a grey box. Note that TFIIbeta was directly included in the BiFC analysis without doing a preliminary competition test (see main text for details).
- https://doi.org/10.7554/eLife.06034.039
-
Supplementary file 2
Spatiotemporal expression pattern of AbdA and TFs under study as deduced from in situ hybridization experiments (Hammonds et al., 2013).
- https://doi.org/10.7554/eLife.06034.040
-
Supplementary file 3
List of the TFs used for BiFC in the mesoderm. Colour code for tissue expression is as in Supplementary file 1. Green or red boxes depict presence or absence of BiFC, respectively. Results obtained by co-ip in S2 cells are also indicated for each TF. Note that only Kn is interacting specifically in the mesoderm among the tested TFs.
- https://doi.org/10.7554/eLife.06034.041
-
Supplementary file 4
List of the constructs and transgenic fly lines generated in this study.
- https://doi.org/10.7554/eLife.06034.042
-
Supplementary file 5
List of the primers used to clone each TF in fusion with the Venus fragment.
- https://doi.org/10.7554/eLife.06034.043
Download links
A two-part list of links to download the article, or parts of the article, in various formats.
Downloads (link to download the article as PDF)
Open citations (links to open the citations from this article in various online reference manager services)
Cite this article (links to download the citations from this article in formats compatible with various reference manager tools)
Inhibitory activities of short linear motifs underlie Hox interactome specificity in vivo
eLife 4:e06034.
https://doi.org/10.7554/eLife.06034


