Cerebellar associative sensory learning defects in five mouse autism models
- Princeton University, United States
- Johns Hopkins University School of Medicine, United States
- University of Chicago, United States
- University of California, Los Angeles, United States
- Harvard Medical School, United States
- RIKEN Brain Science Institute, Japan
Figures
Figure 1
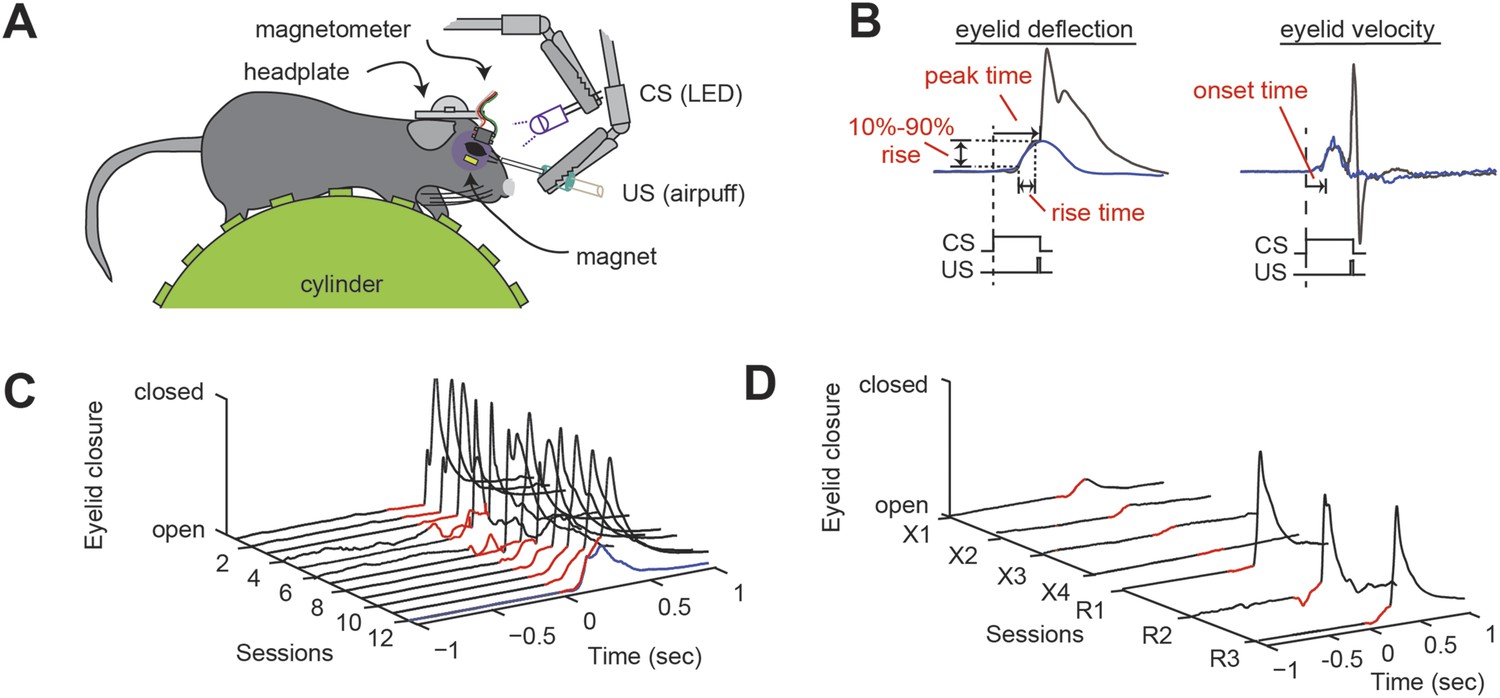
Delay eyeblink conditioning in head-fixed mice.
(A) Experimental setup. A mouse with an implanted headplate is head-fixed above a stationary foam cylinder, allowing the mouse to locomote freely. Eyeblink conditioning is carried out by delivering an aversive unconditioned stimulus (US, airpuff) that coterminates with a conditioned stimulus (CS, LED) to the same eye. Eyelid deflection is measured using induced current from a small magnet affixed to the eyelid. (B) When delivered to a trained animal, the co-terminating CS and US produce an anticipatory eyelid deflection (the conditioned response, CR) followed by a reflex blink evoked by the US. When the CS is delivered alone (blue trace), a bell-shaped CR is produced that peaks at the expected time of the US. The onset time is the time from the onset of the CS to a change in concavity of the eyeblink. The rise time is the amount of time between 10% and 90% of the maximum amplitude of the CR (10–90% rise). (C) Over twelve training sessions, the CR (portion of trace preceding US, indicated in red) develops in response to the US-CS pairing. One CS-alone response is shown as a blue trace. (D) Over four sessions of extinction training, the CR (red) disappears. After three sessions of reacquisition training, the CR (red) returns. Figure 1—source data 1 provides a wild-type benchmark for the eyeblink parameters described here, along with a statistical analysis of possible difference among wild-type cohorts (p > 0.05 in all instances).
-
Figure 1—source data 1
Wild-type values for eyeblink conditioning parameters.
Last column, results of comparison across all wild-type cohorts. Statistical test indicated.
- https://doi.org/10.7554/eLife.06085.004
Figure 2

Analysis of the full range of detectable responses allows the separation of response probability from response amplitude.
(A) Response and non-response distributions from days 3 to 6 of training in a single animal. In the top panel for each day, gray bars show the distribution of non-responding trials. In the bottom panel, black bars show the remaining response distribution. The response probability is defined as the area under the response distribution. The average response amplitude is defined as the center of mass of the response distribution. The red line shows the fixed threshold at 0.15. (B) Representative data from a single wild-type animal. Top: scatterplot of individual response magnitudes for every trial over 12 sessions of training. Gray dots, individual non-responding trials. Black dots, responding trials. Middle: response probability for each session. Bottom, response amplitude for each session.
Figure 3 with 1 supplement

Probability defects are present in four mouse models.
(A) Time course of response probability with acquisition training in L7-Tsc1 model mice. Black: WT. Red: L7/Pcp2Cre::Tsc1flox/+. (B) Time course of response probability with acquisition training in Cntnap2 model mice. Black: Cntnap2+/+. Red: Cntnap2−/−. Green: Cntnap2+/−. (C) Time course of response probability with acquisition training in Shank3ΔC. Black: Shank3+/+. Red: Shank3+/ΔC. (D) Time course of response probability with acquisition training in Mecp2R308. Black: WT. Red: Mecp2R308/Y. In panels (A) through (D), bar plots indicate response probability averaged over the last four training sessions. (E) Probability deficits across all groups. Dashed line: normalized wild-type littermate level. In all panels, shading and error bars indicate SEM, and * indicates p < 0.05. n ≥ 10 mice for each group. Figure 3—figure supplement 1 shows response probability in each group of animals during extinction and reacquisition.
Figure 3—figure supplement 1
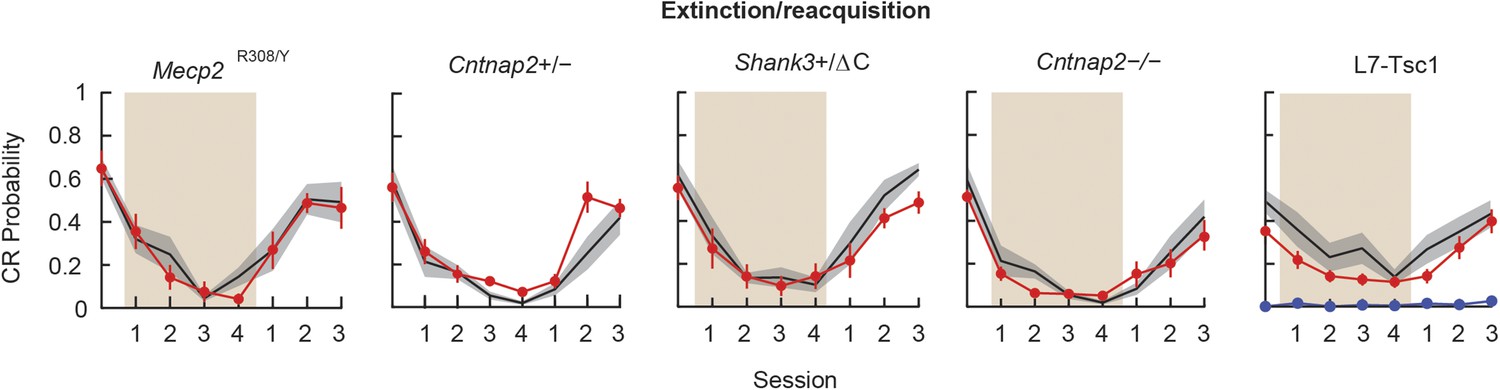
Extinction and reacquisition.
Extinction and reacquisition. Tan shading indicates the extinction period. In the L7-Tsc1 plot, the red line indicates the mean of heterozygous mice, while the blue line indicates the mean of homozygous mice. Black lines with gray shading indicate the mean ± SEM for the wild-type littermates for each cohort. CR performance on last day of reacquisition compared to last day of acquisition. n ≥ 10 for each group.
Figure 4
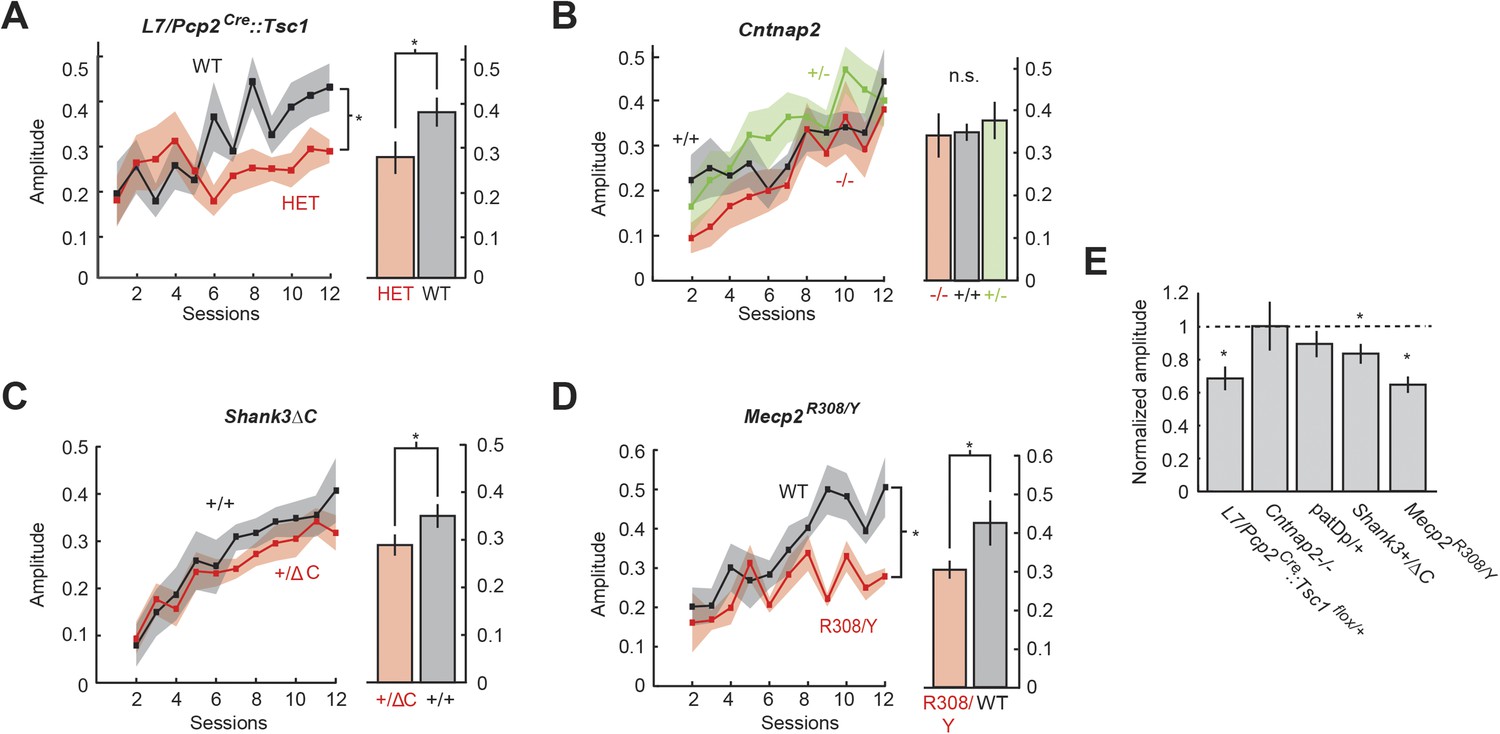
Amplitude defects are present in three mouse models.
(A) Time course of response probability with acquisition training in L7-Tsc1 model mice. Black: WT. Red: L7/Pcp2Cre::Tsc1flox/+. (B) Time course of response probability with acquisition training in Cntnap2 model mice. Black: Cntnap2+/+. Red: Cntnap2−/−. Green: Cntnap2+/−. (C) Time course of response probability with acquisition training in Shank3ΔC. Black: Shank3+/+. Red: Shank3+/ΔC. (D) Time course of response probability with acquisition training in Mecp2R308. Black: WT. Red: Mecp2R308/Y. In panels (A) through (D), bar plots indicate response probability averaged over the last four training sessions. (E) Probability deficits across all groups. Dashed line: normalized wild-type littermate level. In all panels, shading and error bars indicate SEM, and * indicates p < 0.05. n ≥ 10 mice for each group.
Figure 5

Timing defects are present in two mouse models.
(A) Analysis of Mecp2R308/Y Mecp2R308 response timing (rise time and peak latency). Inset: representative eyelid movement traces. Purple line: CS duration. Scale bars: horizontal, 100 ms; vertical, 20% of unconditioned response (UR) amplitude. Arrowheads: peak times. (B) Analysis of Shank3ΔC response timing (rise duration and peak time). Inset: representative eyelid movement traces. Purple line: CS duration. Scale bars: horizontal, 100 ms; vertical, 20% of UR amplitude. Arrowheads: peak times. (C) Analysis of Cntnap2 response time (rise time and peak latency). (D) Analysis of L7-Tsc1 response time (rise time and peak latency) (E) Peak time deficits across all groups. (F) Rise time deficits. In plots (E) and (F), dashed lines indicate normalized wild-type littermate level. In all panels, shading and error bars indicate SEM, and * indicates p < 0.05. n ≥ 10 mice for each group.
Figure 6 with 1 supplement
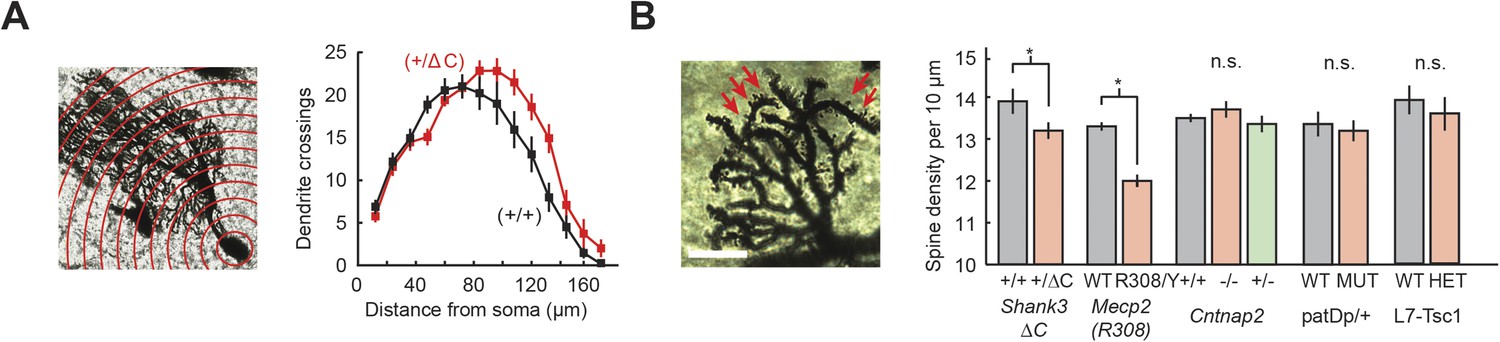
Purkinje cell dendritic arbors show structural defects in Shank3+/ΔC and Mecp2R308/Y mice.
(A) Purkinje cell (PC) dendrite arborization defect is present in Shank3+/ΔC. Left: Sholl analysis example for Shank3+/ΔC. Right: groupwise Sholl analysis for Shank3+/ΔC. Sholl analysis for other four mouse models did not show similar arborization defects, as shown in Figure 6—figure supplement 1. (B) Spine density defects are present in Shank3+/ΔC and Mecp2R308/Y. Left: example image of Shank3+/+ dendritic arbor. Right: spine density for Shank3+/ΔC and Mecp2R308/Y groups. In all panels, shading and error bars indicate SEM, n.s. indicates p > 0.05, and * indicates p < 0.05. n ≥ 12 cells for each group.
Figure 6—figure supplement 1
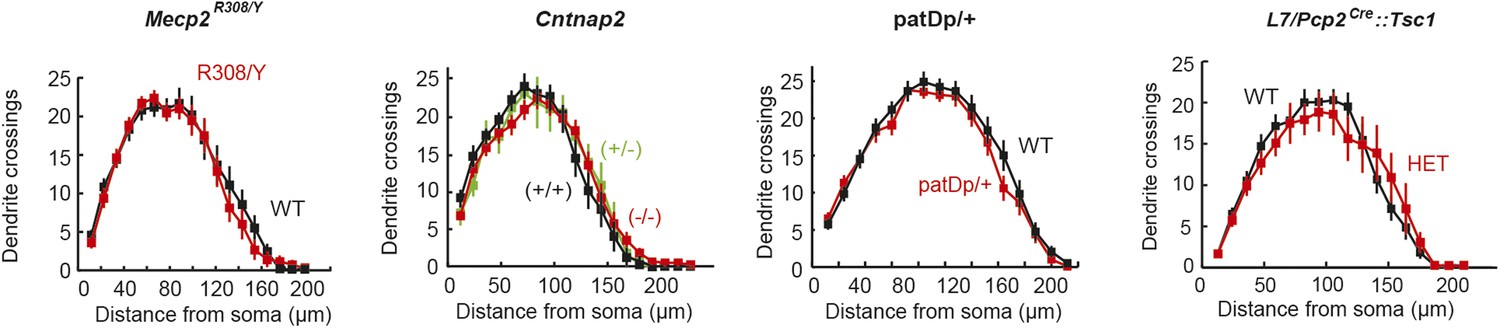
Lack of difference in PC arborization in four ASD mouse models.
(Left to right) Mecp2R308, Cntnap2, patDp/+ (15q11-13), and L7-Tsc1 (wild-type littermate vs heterozygote). n ≥ 15 cells for each group.
Figure 7 with 1 supplement
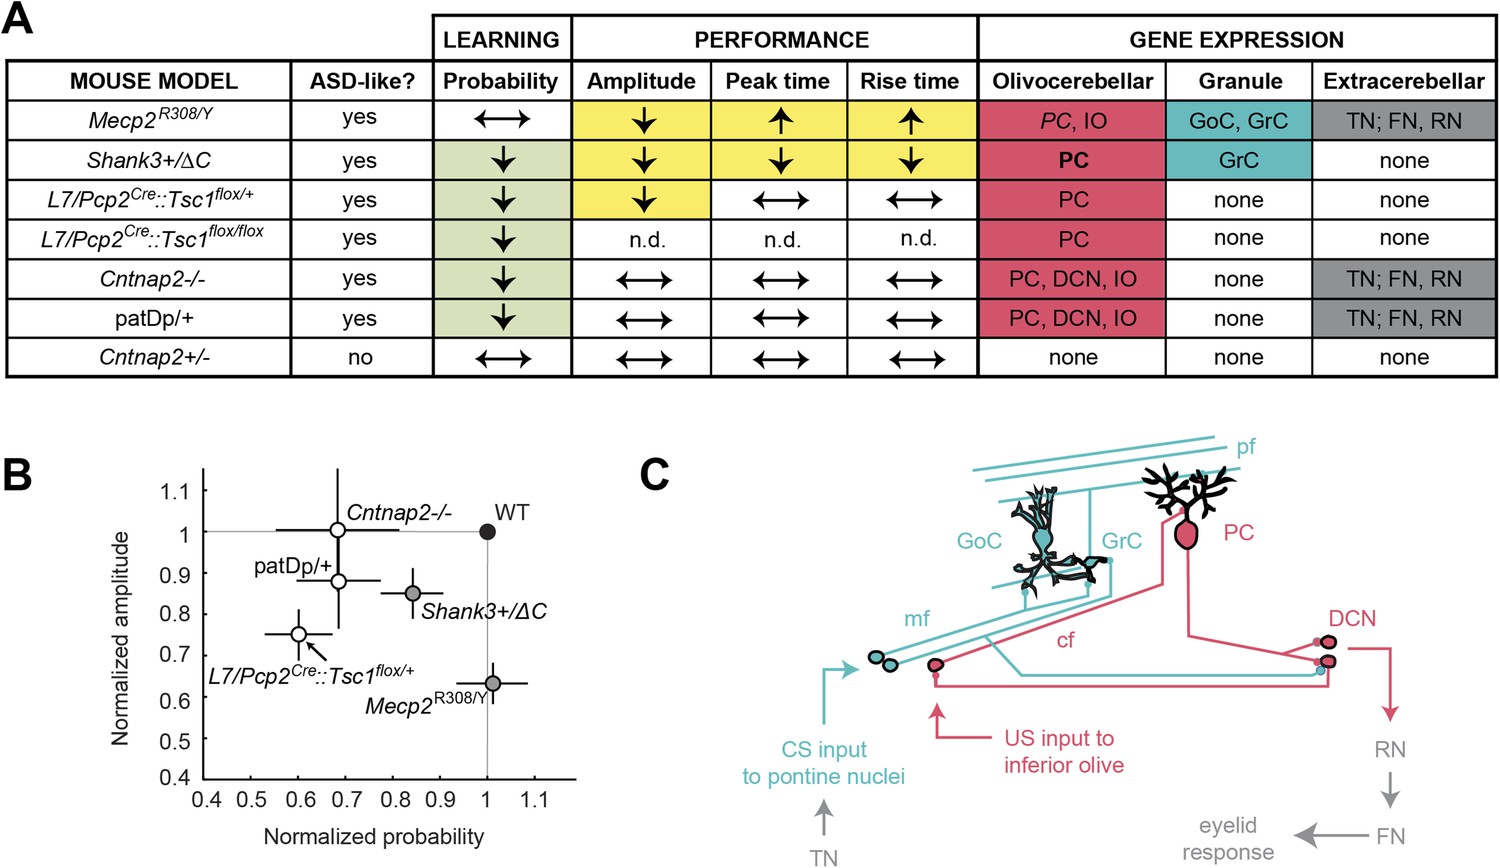
Cerebellar learning and performance deficits co-vary with circuit-specific gene expression patterns.
(A) The first four data columns show perturbations in learning (green shading) and performance (yellow shading). The last three columns show combined gene expression (Figure 1) and morphological (Figure 5) perturbations for the olivocerebellar (red shading) and granule cell layer (blue shading) pathways, along with extracerebellar (dark gray) pathways. Note that Cntnap2+/−, which has been reported to be not behaviorally different from Cntnap2+/+ (Peñagarikano et al., 2011), is shown for reference. Table 2 is an expanded tables of the phenotypes described here. (B) Response amplitude and probability in transgenic mice (open circles) normalized to wild-type littermate (‘WT’) means for all models. Dark gray shading indicates mutants for which there were also timing defects. Error bars indicate SEM. (C) The canonical cerebellar circuit. Input along the CS (turquoise) pathway via mossy fibers (mf) from the pontine nuclei enters the cerebellar cortex through granule cells (GrC), which receive feedforward and feedback inhibition from Golgi cells (GoC) in the granule cell layer. GrCs send parallel fiber (pf) projections to PC dendritic arbors. PCs also receive teaching signals along the US (gray) pathway via climbing fibers (cfs) from the inferior olive. The output of clustered PCs (gray) converges onto neurons in the deep cerebellar nuclei (DCN), which drive downstream neurons in the output pathway.
Figure 7—figure supplement 1
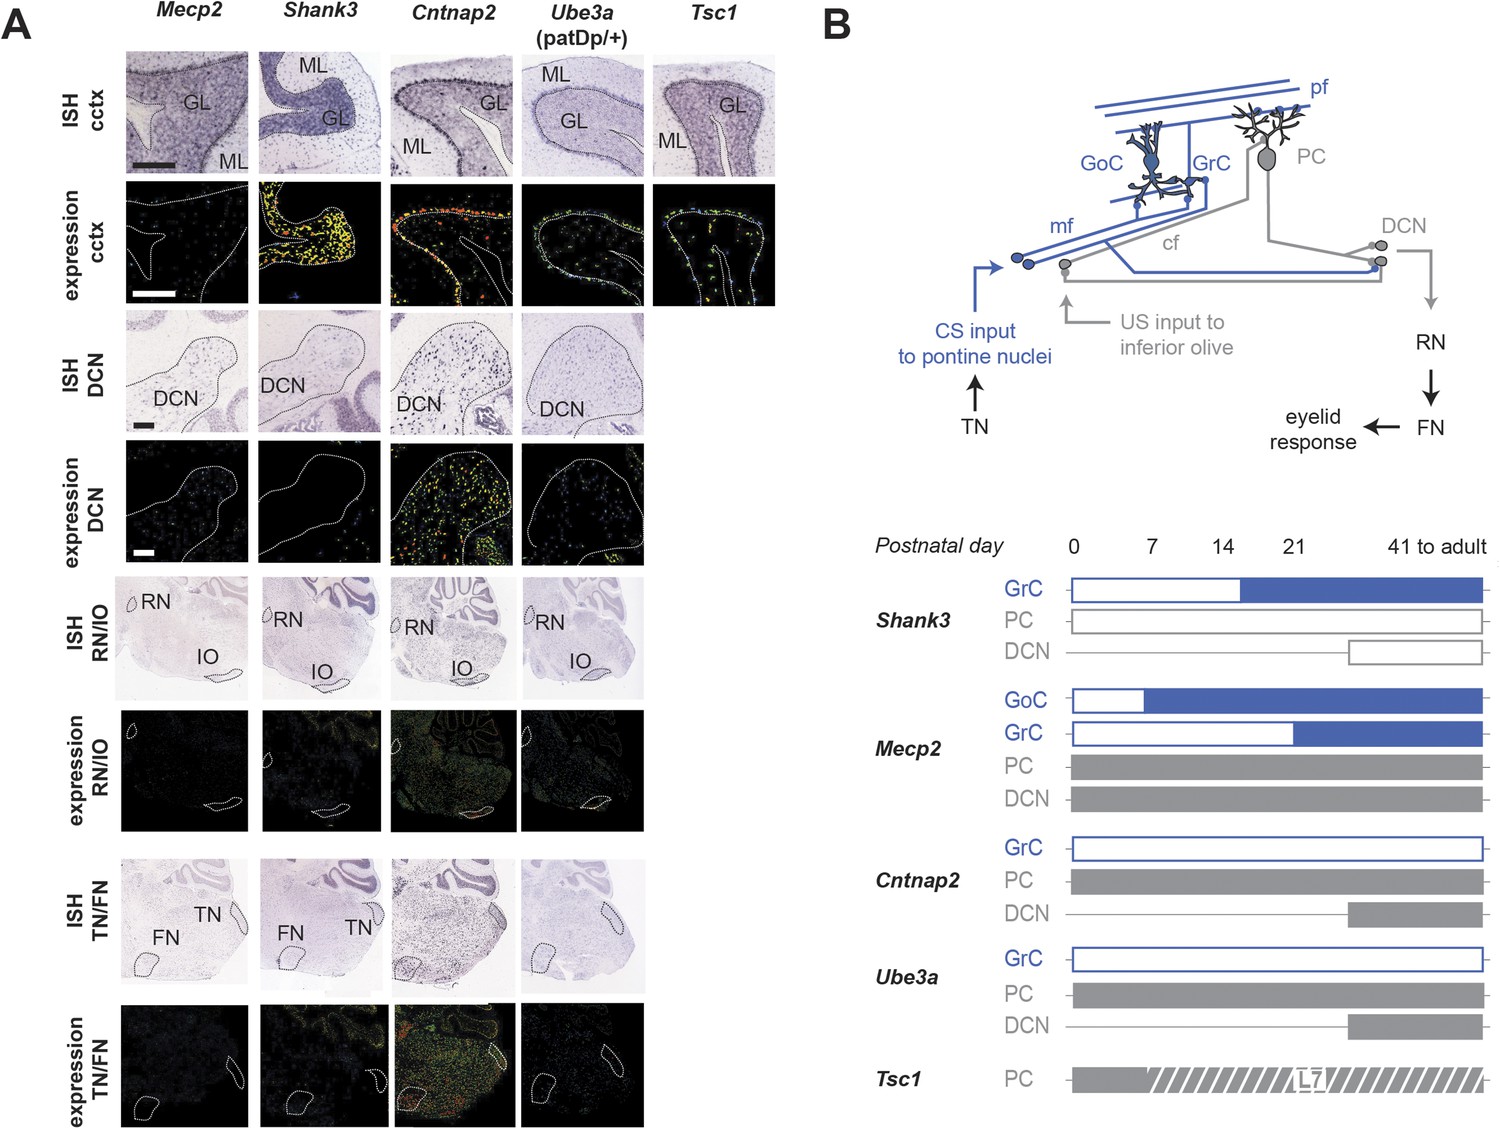
Expression patterns of ASD model genes in cerebellum.
(A) In situ hybridizations and expression quantification from Allen Brain Atlas (ABA; Lein et al., 2007) indicate expression patterns of autism spectrum disorder (ASD)-related genes in the cerebellar cortex (cctx), the deep cerebellar nuclei (DCN), the red nucleus and inferior olive (RN/IO), and the facial nucleus and the trigeminal nucleus (FN/TN). Displayed here are Shank3, Mecp2, Cntnap2, and Tsc1. Note that one gene in the imprinted region 15q11-13 with disease linkage (Albrecht et al., 1997; Piochon et al., 2014), Ube3a, with is also shown. Scale bars, 200 μm. P41 to adult data include P56 data from the Allen Brain Atlas. (B) Top: the canonical cerebellar circuit. Input along the CS (blue) pathway via mfs from the pontine nuclei enters the cerebellar cortex through granule cells (GrC), which receive feedforward and feedback inhibition from Golgi cells (GoC) in the granule cell layer. GrCs send pf projections to PC dendritic arbors. PCs also receive teaching signals along the US (gray) pathway via cfs from the inferior olive. The output of clustered PCs (gray) converges onto neurons in the cerebellar nuclei (DCN), which drive downstream neurons in the output pathway. Bottom: gene expression from birth to adulthood, by cell type. Full bars indicate strong expression as found in the literature. White bars indicate little or no expression, and a horizontal thin line indicates no data available. The hashed bar indicates the period during which Tsc1 is expressed in wild-type animals but knocked out in the L7-Tsc1 animals. References: Shank3 (Böckers et al., 2004; Böckers et al., 2005), Mecp2 (Shahbazian et al., 2002b; Mullaney et al., 2004; Neul and Zoghbi, 2004; Dragich et al., 2007; Schmid et al., 2008), Tsc1 (Tsai et al., 2012), Ube3a (a gene strongly implicated in neurodevelopmental disorders in locus 15q11-1: Albrecht et al., 1997; Dindot et al., 2008), Cntnap2 (Fujita et al., 2012; Paul et al., 2012).
Tables
Table 1
Normal sensory responsiveness, gross motor function, and non-cerebellar learning and memory in five autism mouse models
| L7/Pcp2Cre::Tsc1flox/+ | Cntnap2−/− | patDp/+ | Shank3+/ΔC | Mecp2R308/Y | |
|---|---|---|---|---|---|
| Unconditioned response | |||||
| N | 18, 16 | 12, 13 | 10, 11 | 17, 21 | 11, 12 |
| UR latency (ms) | 31.0 ± 8.6 | 32.6 ± 3.1 | 45.9 ± 8.4 | 34.5 ± 5.9 | 42.0 ± 8.7 |
| 29.9 ± 4.3 | 27.4 ± 5.0 | 30.7 ± 7.3 | 39.5 ± 8.2 | 43.1 ± 9.3 | |
| UR rise time (ms) | 64.9 ± 4.7 | 65.7 ± 5.5 | 67.3 ± 4.3 | 62.8 ± 3.6 | 60.1 ± 5.5 |
| 57.5 ± 3.8 | 64.8 ± 5.5 | 72.8 ± 6.3 | 62.6 ± 3.8 | 64.8 ± 6.5 | |
| Eyelid opening | |||||
| N | 18, 16 | 12, 13 | 10, 11 | 17, 21 | 11, 12 |
| Amplitude (% UR amp) | 13.9% ± 3.9% | 6.4% ± 1.2% | 13.4% ± 4.8% | 11.8% ± 3.1% | 13.4% ± 5.5% |
| 15.6% ± 5.0% | 11.1% ± 3.0% | 11.8% ± 7.8% | 9.3% ± 2.6% | 13.7% ± 5.8% | |
| Gait analysis | |||||
| N | 6, 7 | 10, 10 | – | 5, 4 | – |
| Fore stride (cm) | 4.61 ± 0.21 | 5.01 ± 0.21 | – | 4.82 ± 0.31 | – |
| 4.35 ± 0.14 | 5.15 ± 0.46 | – | 4.92 ± 0.28 | – | |
| Fore stance (cm) | 1.42 ± 0.06 | 1.39 ± 0.14 | – | 1.84 ± 0.12 | – |
| 1.56 ± 0.06 | 1.41 ± 0.07 | – | 1.64 ± 0.12 | – | |
| Hind stride (cm) | 4.85 ± 0.27 | 5.22 ± 0.34 | – | 4.98 ± 0.27 | – |
| 4.84 ± 0.15 | 5.09 ± 0.42 | – | 5.07 ± 0.29 | – | |
| Hind stance (cm) | 2.62 ± 0.17 | 2.20 ± 0.16 | – | 2.37 ± 0.12 | – |
| 2.69 ± 0.16 | 2.00 ± 0.17 | – | 2.27 ± 0.12 | – | |
| Swimming Y-maze acquisition | |||||
| N | 6, 7 | 10, 10 | – | 5, 4 | – |
| Acq. 1 (% correct trials) | 65.7% ± 12.9% | 81.5% ± 6.3% | – | 65.0% ± 8.6% | – |
| 76.9% ± 7.9% | 71.1% ± 11.6% | – | 52.0 ± 10.0% | – | |
| Acq. 2 (% correct trials) | 90.0% ± 6.8% | 89.0% ± 7.4% | – | 61.0% ± 17.2% | – |
| 75.6% ± 7.0% | 91.1% ± 4.8% | – | 70.0% ± 17.3% | – | |
| Acq. 3 (% correct trials) | 90.0% ± 6.8% | 96.0% ± 2.7% | – | 90.0% ± 10.0% | – |
| 80.8% ± 8.2% | 95.6% ± 3.0% | – | 95.0% ± 5.0% | – | |
| Acq. 4 (% correct trials) | 80.0% ± 20.0% | 98.0% ± 2.0% | – | 100% ± 0% | – |
| 90.0% ± 5.7% | 100% ± 0% | – | 94.3% ± 3.7% | – | |
| Test (% correct trials) | 91.3% ± 4.2% | 94.8% ± 3.1% | – | 87.2% ± 7.9% | – |
| 93.4% ± 3.3% | 99.0% ± 1.0% | – | 97.2% ± 2.8% | – | |
-
Unconditioned response was measured in terms of latency and rise time. Eyelid opening in response to initial CS trials was scaled to the size of the unconditioned response. Gait was measured as stride and stance (cm) for both forepaws and hindpaws. Swimming Y-maze acquisition was measured in terms of percentage of correct trials over valid trials for four acquisition periods and a test period. For all cells, top value (roman text) indicates the mutant mouse, while bottom value (italic text) indicates the control or wild-type littermates. All values mean ± SEM. All paired statistical comparisons yielded p-values greater than 0.05.
-
UR, unconditioned response.
Table 2
Complete table of previously reported autism-like and motor defects in mouse models combined with data from the present study
| Mouse model | Autism-like behaviors | Delay eyeblink conditioning | Movement/strength | Other tasks | |||||||||
|---|---|---|---|---|---|---|---|---|---|---|---|---|---|
| Social | Ultrasonic calls | Grooming time | Maze flexibility | Eyeblink learning* | Eyeblink amplitude* | Eyeblink timing* | Rotarod | Gait | Maze acquisition | Startle and prepulse inhibition | Anxiety | Learned fear | |
| Shank3 [a] | ↓ | ↑ | ↑ | nd | ↓ | ↓ | ↓ | ↔ | ↔* | ↔* | ↓ | nd | ↔ |
| Cntnap2 [b] | ↓ | ↓ | ↑ | ↓ | ↓ | ↔ | ↔ | ↑ | ↔* | ↔* | ↔ | ↔ | nd |
| Mecp2 [c, d, e] | ↓ | ↓ | nd | nd | ↔ | ↓ | ↑ | ↔ | nd | ↓ | nd | ↑ | ↓ |
| L7-Tsc1–mutant [f] | ↓ | ↓ | ↑ | ↓ | ↓ | nd | nd | ↓ | ↓ | ↔ | nd | nd | nd |
| L7-Tsc1–het [f] | ↓ | ↓ | ↑ | ↓ (?) | ↓ | ↓ | ↔ | ↔ | ↔ | ↔ | nd | nd | nd |
| patDp/+ [g, h, i] | ↓ | ↓ | nd | ↓ | ↓ | ↔ | ↔ | ↑ | ↓ | ↔ | ↔ | ↑ | ↑ |
-
Social, downward arrows indicate reduced performance on three-chamber preference test of mouse vs object, interactions with novel mouse, or play behavior. Ultrasonic vocalizations (USV) are used as an assay of communicative behavior. Ultrasonic, downward arrows indicate longer latency or fewer calls (adult), or more distress calls or longer latency to first call by pups. Repetitive or perseverative behaviors are assayed by grooming and flexibility on maze tasks. Eyeblink learning, downward arrows indicate a decrease in response probability. Eyeblink amplitude, downward arrows indicate a decrease in response amplitude. Eyeblink timing, downward arrows indicate earlier shifts in peak latency and decrease in rise time, while upward arrows indicate later shifts in peak latency and increase in rise time. Maze flexibility, downward arrows indicate impairment on T-maze alternation or reversal or flexibility on a Morris water or Barnes maze. Gross motor functions are assayed by rotarod and gait tasks. Rotarod, table entries indicate differences in the time to fall from an accelerating rotarod. Gait, table entries indicate differences in stance or stride parameters. Maze acquisition, downward arrow indicates impairment of acquisition on Morris water maze, Barnes maze, walking T-maze, or swimming T-maze. Anxiety, up arrows indicate increased freezing and closed-arm preference in elevated plus maze, increased light–dark preference, or decreased open-field behavior. Unless otherwise specified, the downward arrow indicates a significant decrease relative to wild-type, the upward arrow indicates a significant increase relative to wild-type, the horizontal arrow indicates no significant difference relative to wild-type, and ‘nd’ indicates unknown. The ‘*’ in row 5 indicates a difference lacking statistical significance. References: [a] Kouser et al., 2011; [b] Peñagarikano et al., 2011; [c] Shahbazian et al., 2002a; [d] Moretti et al., 2006; [e] De Filippis et al., 2010; [f] Tsai et al., 2012; [g] Nakatani et al., 2009; [h] Tamada et al., 2010; [i] Piochon et al., 2014.
Download links
A two-part list of links to download the article, or parts of the article, in various formats.
Downloads (link to download the article as PDF)
Open citations (links to open the citations from this article in various online reference manager services)
Cite this article (links to download the citations from this article in formats compatible with various reference manager tools)
Cerebellar associative sensory learning defects in five mouse autism models
eLife 4:e06085.
https://doi.org/10.7554/eLife.06085


